iPSC-Derived Embryoid Bodies as Models of c-Met-Mutated Hereditary Papillary Renal Cell Carcinoma

 , , , and
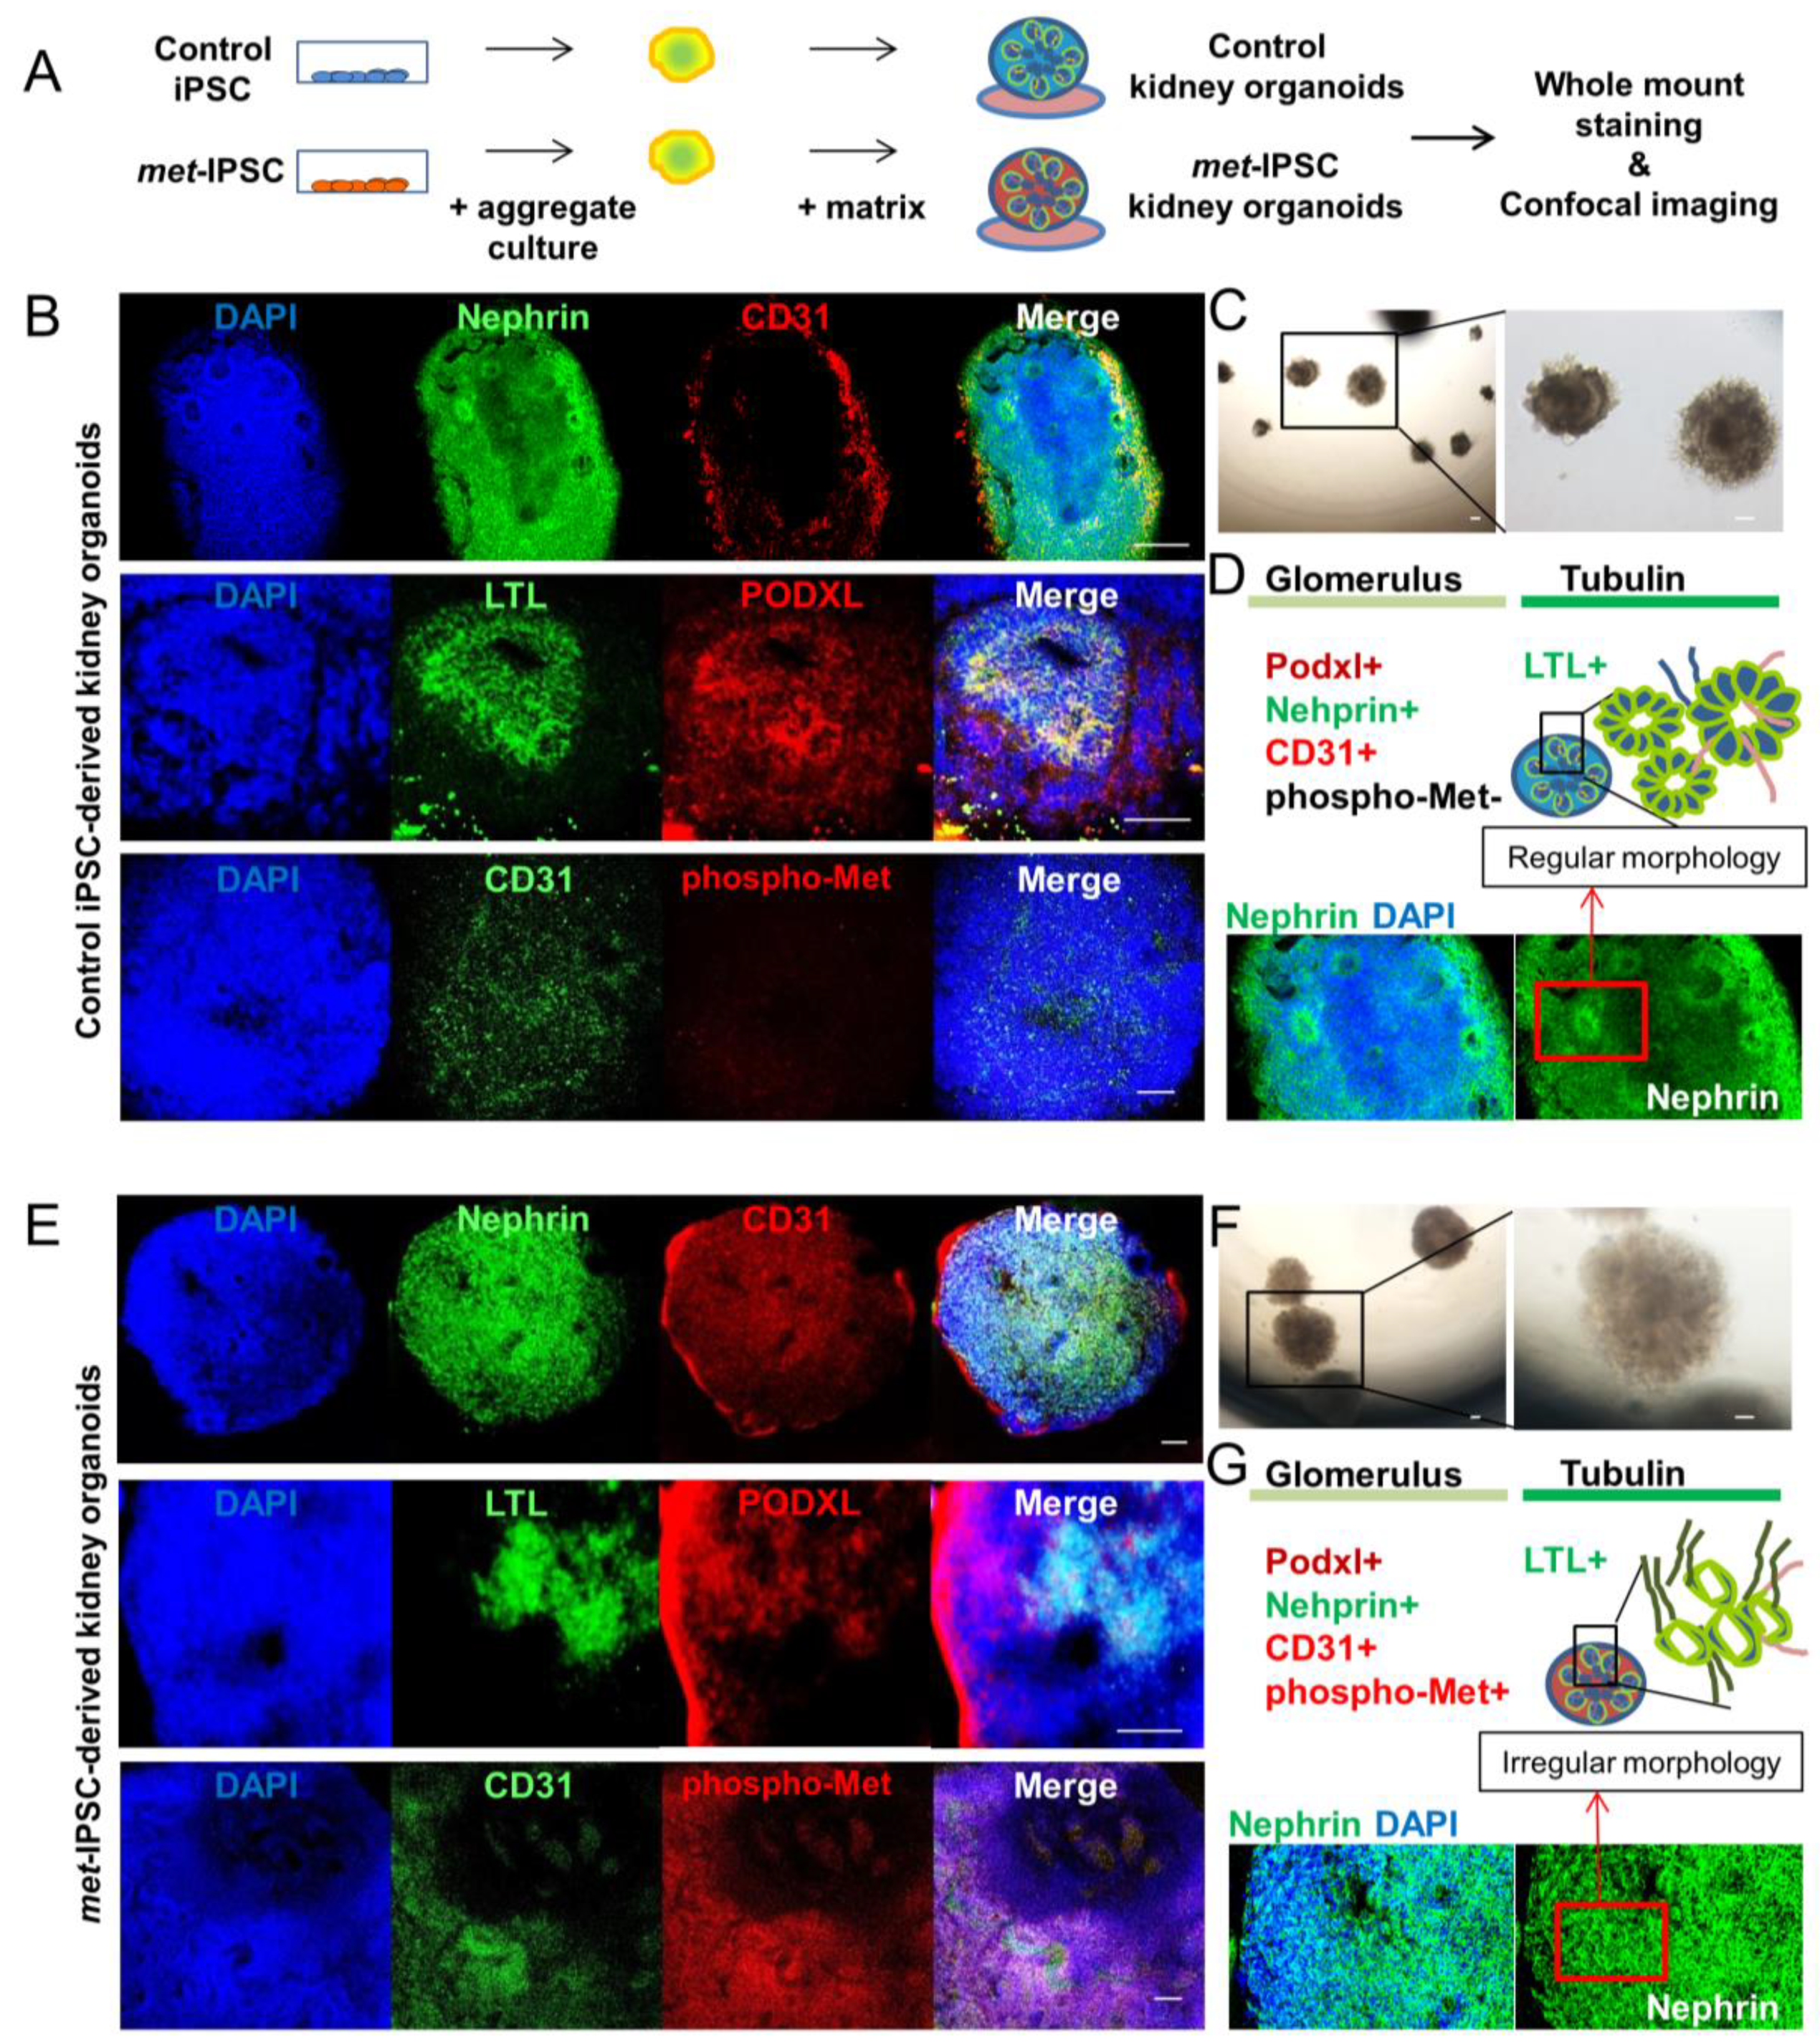
Abstract
:1. Introduction
2. Results
2.1. Patients
2.2. Generation and Characterization of c-Met-Mutated iPSC
2.3. Generation and Characterization of c-Met-Mutated iPSC Aggregates
2.4. Evaluation of a 3D Culture System for Induction of Kidney Differentiation from Met-IPSC
2.5. Characterization of Embryoid Bodies Containing Cells with Kidney Markers
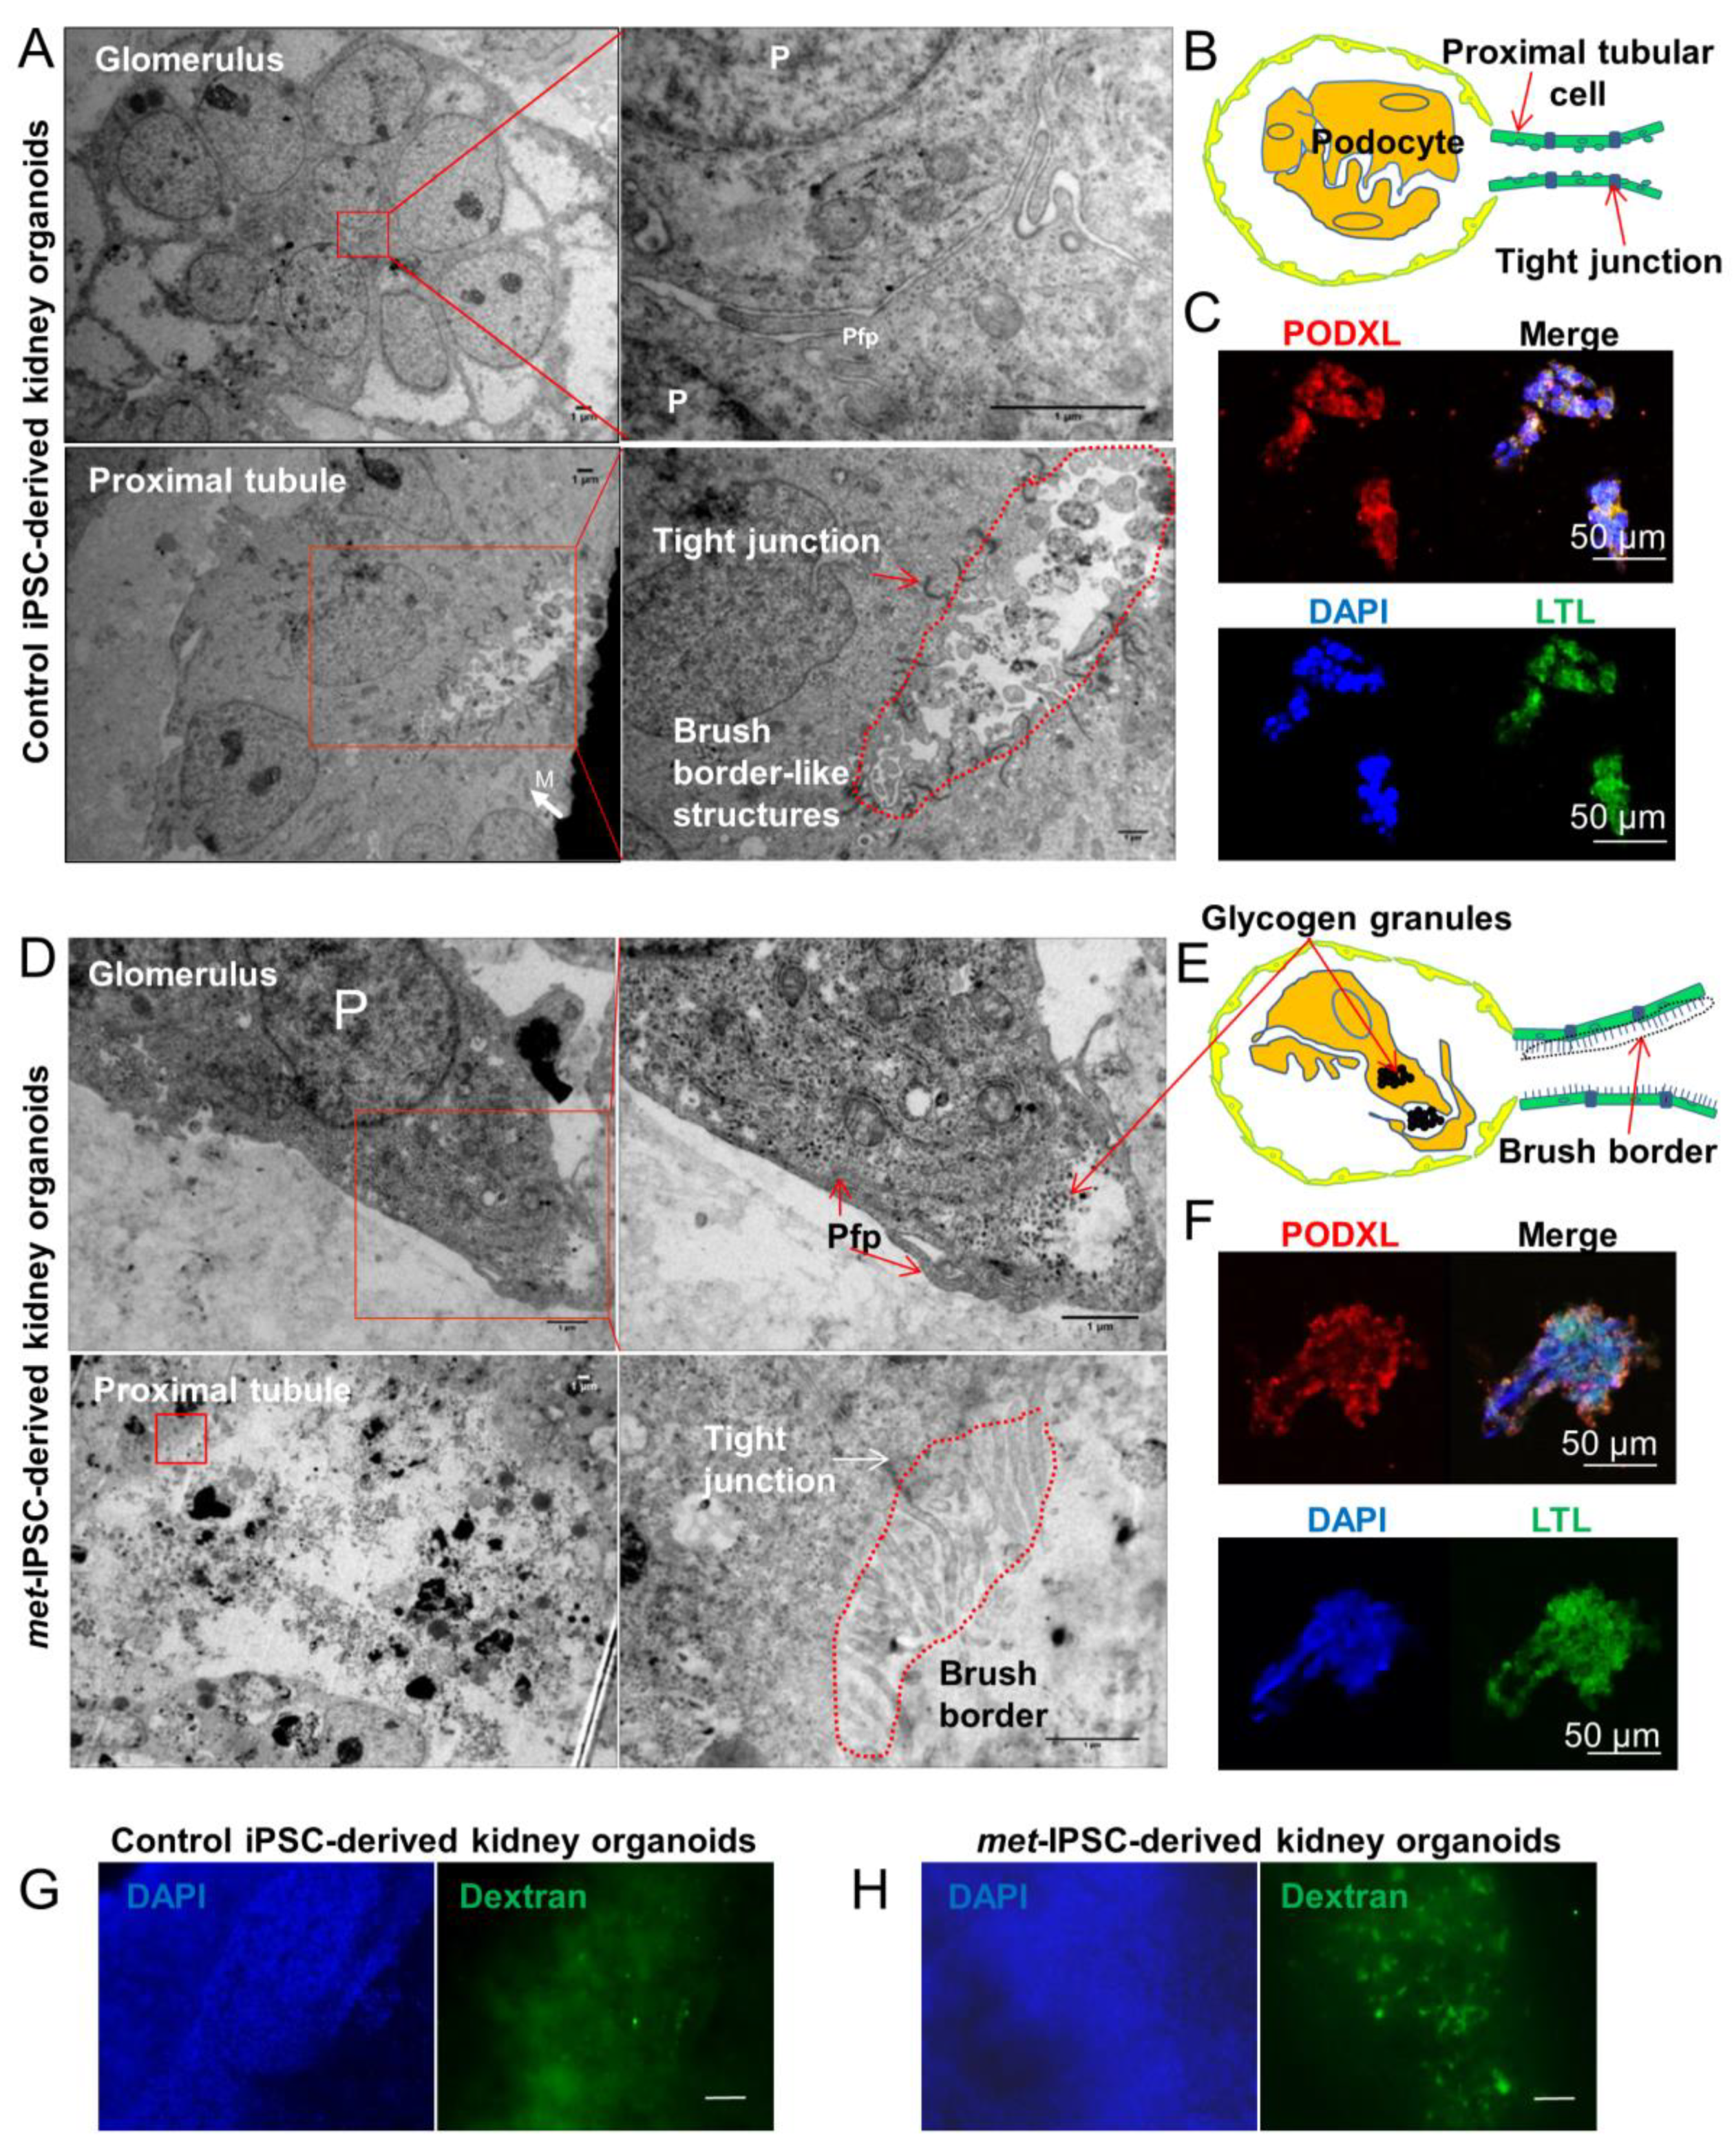
2.6. Structural and Functional Evaluation of Embryoid Bodies
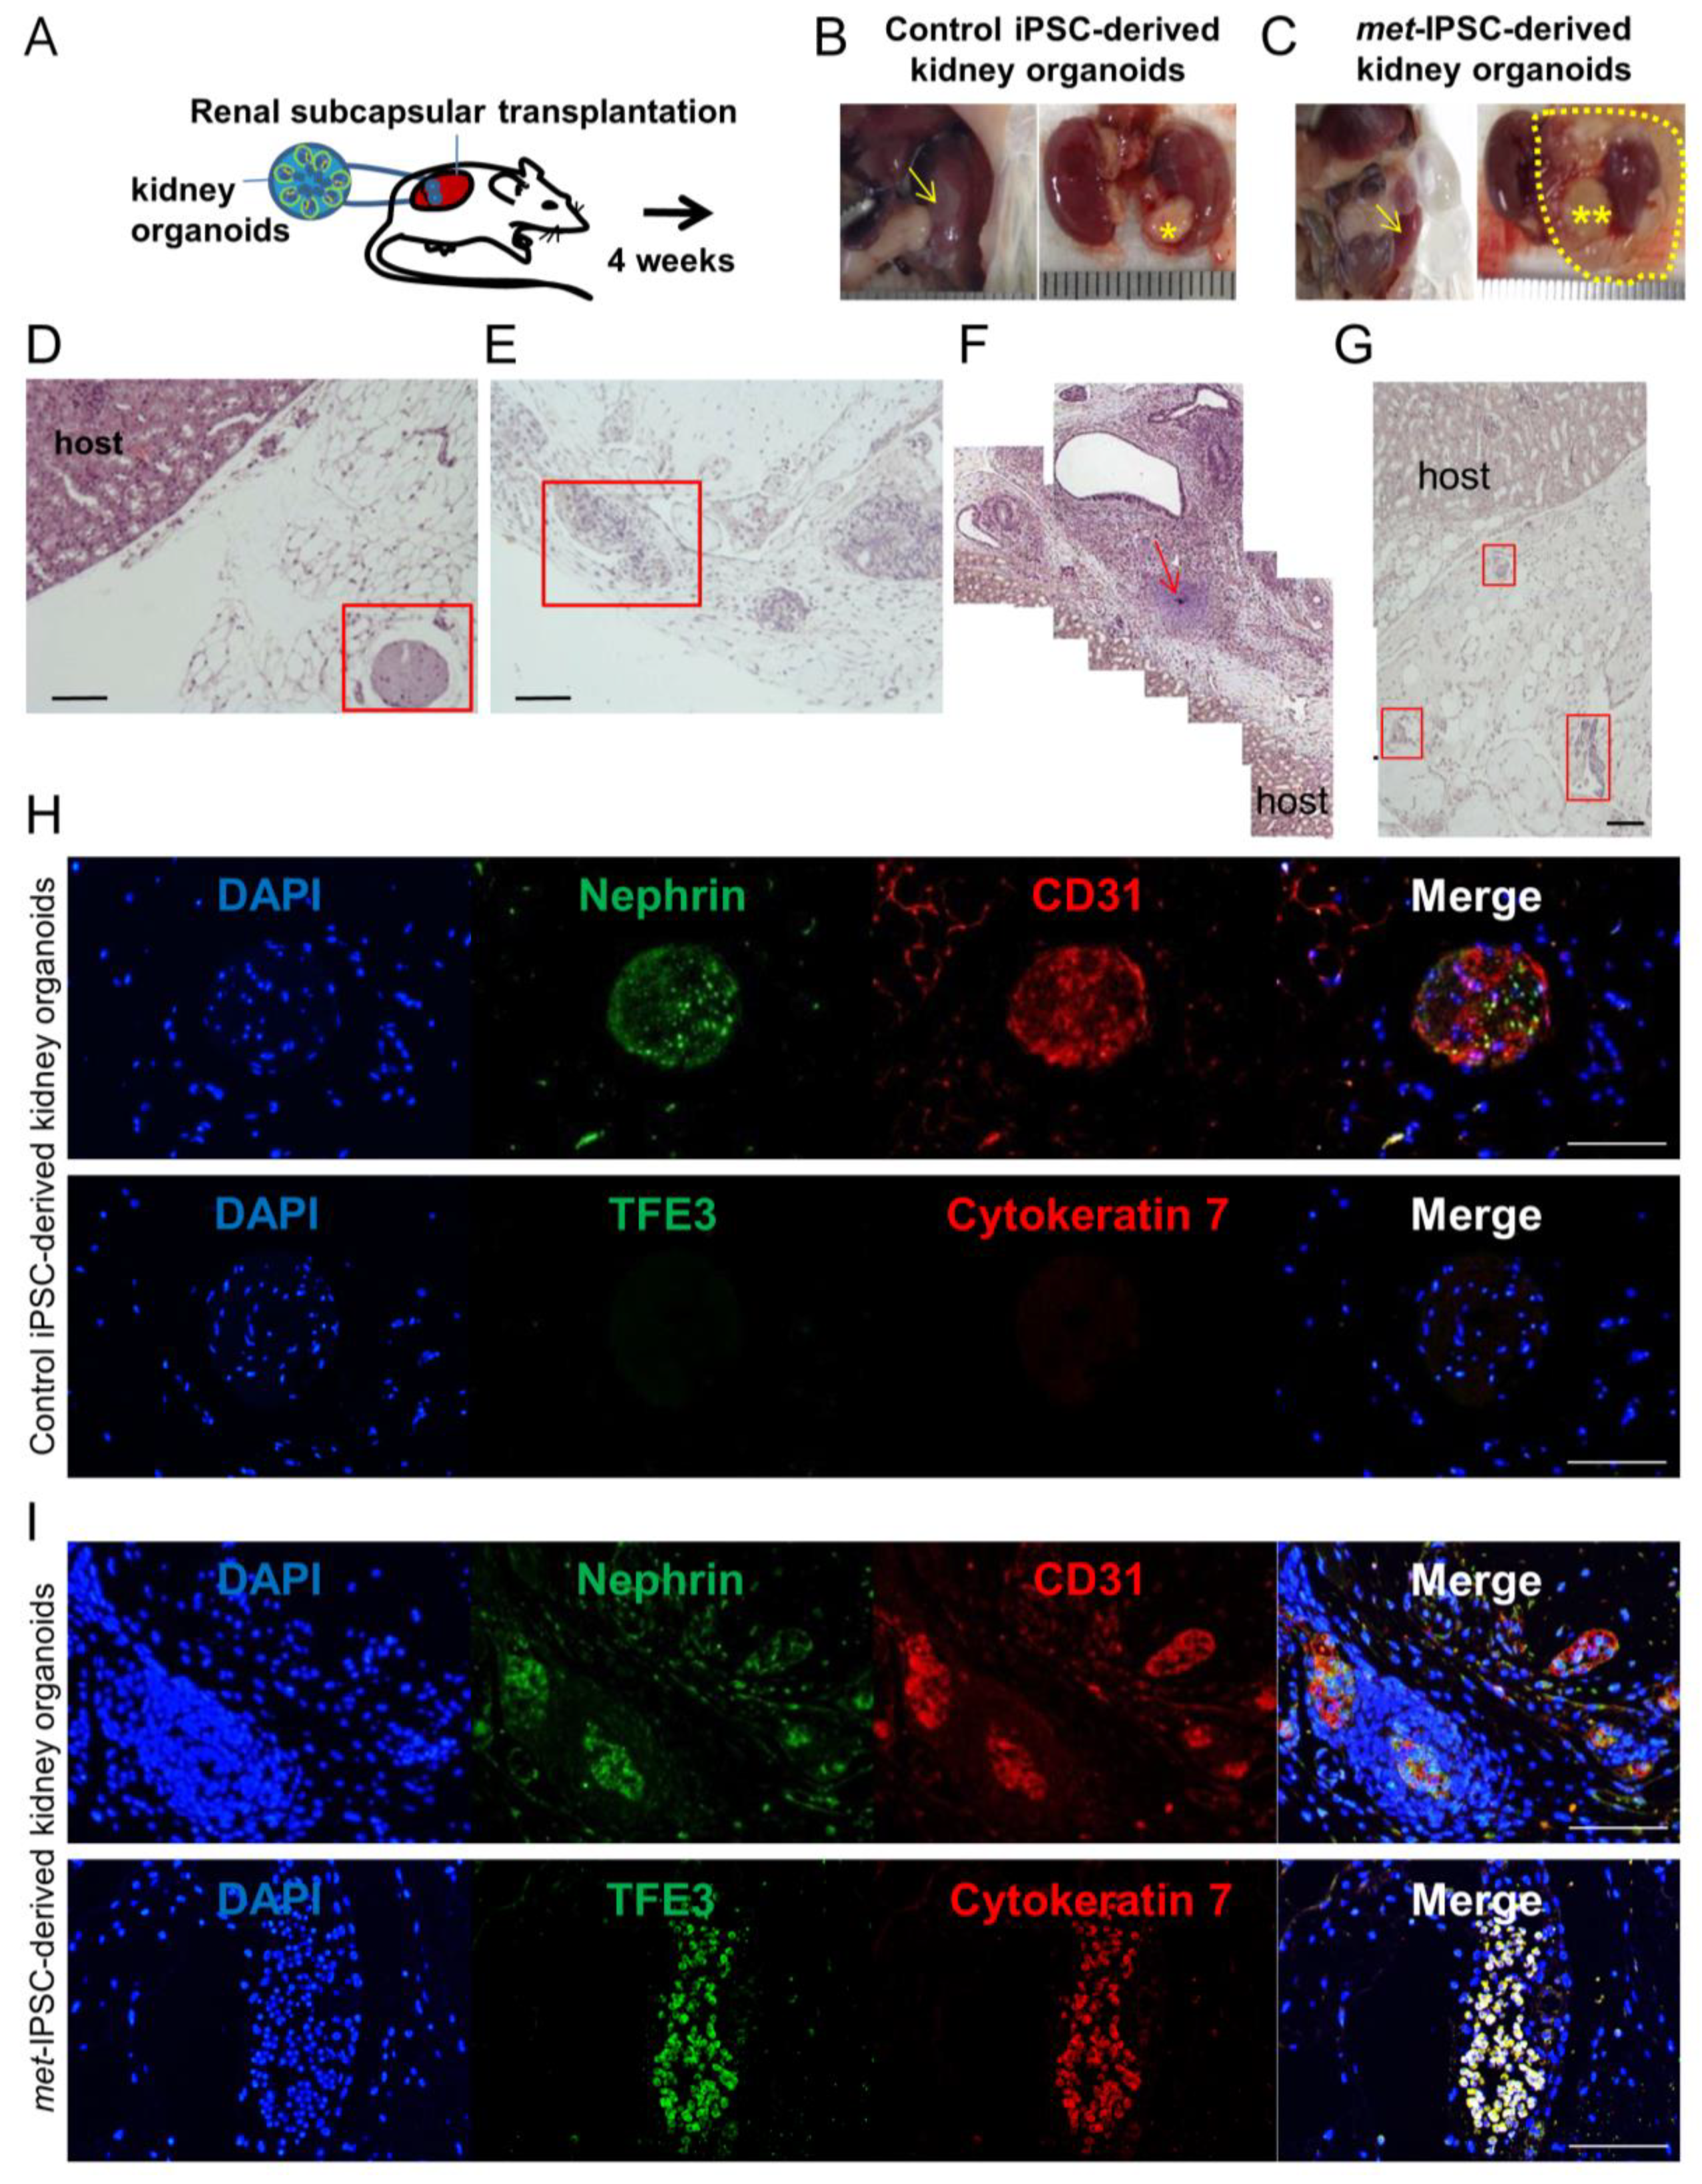
2.7. Kidney Capsule Transplantation Experiments of Met-IPSC-Derived Embryoid Bodies
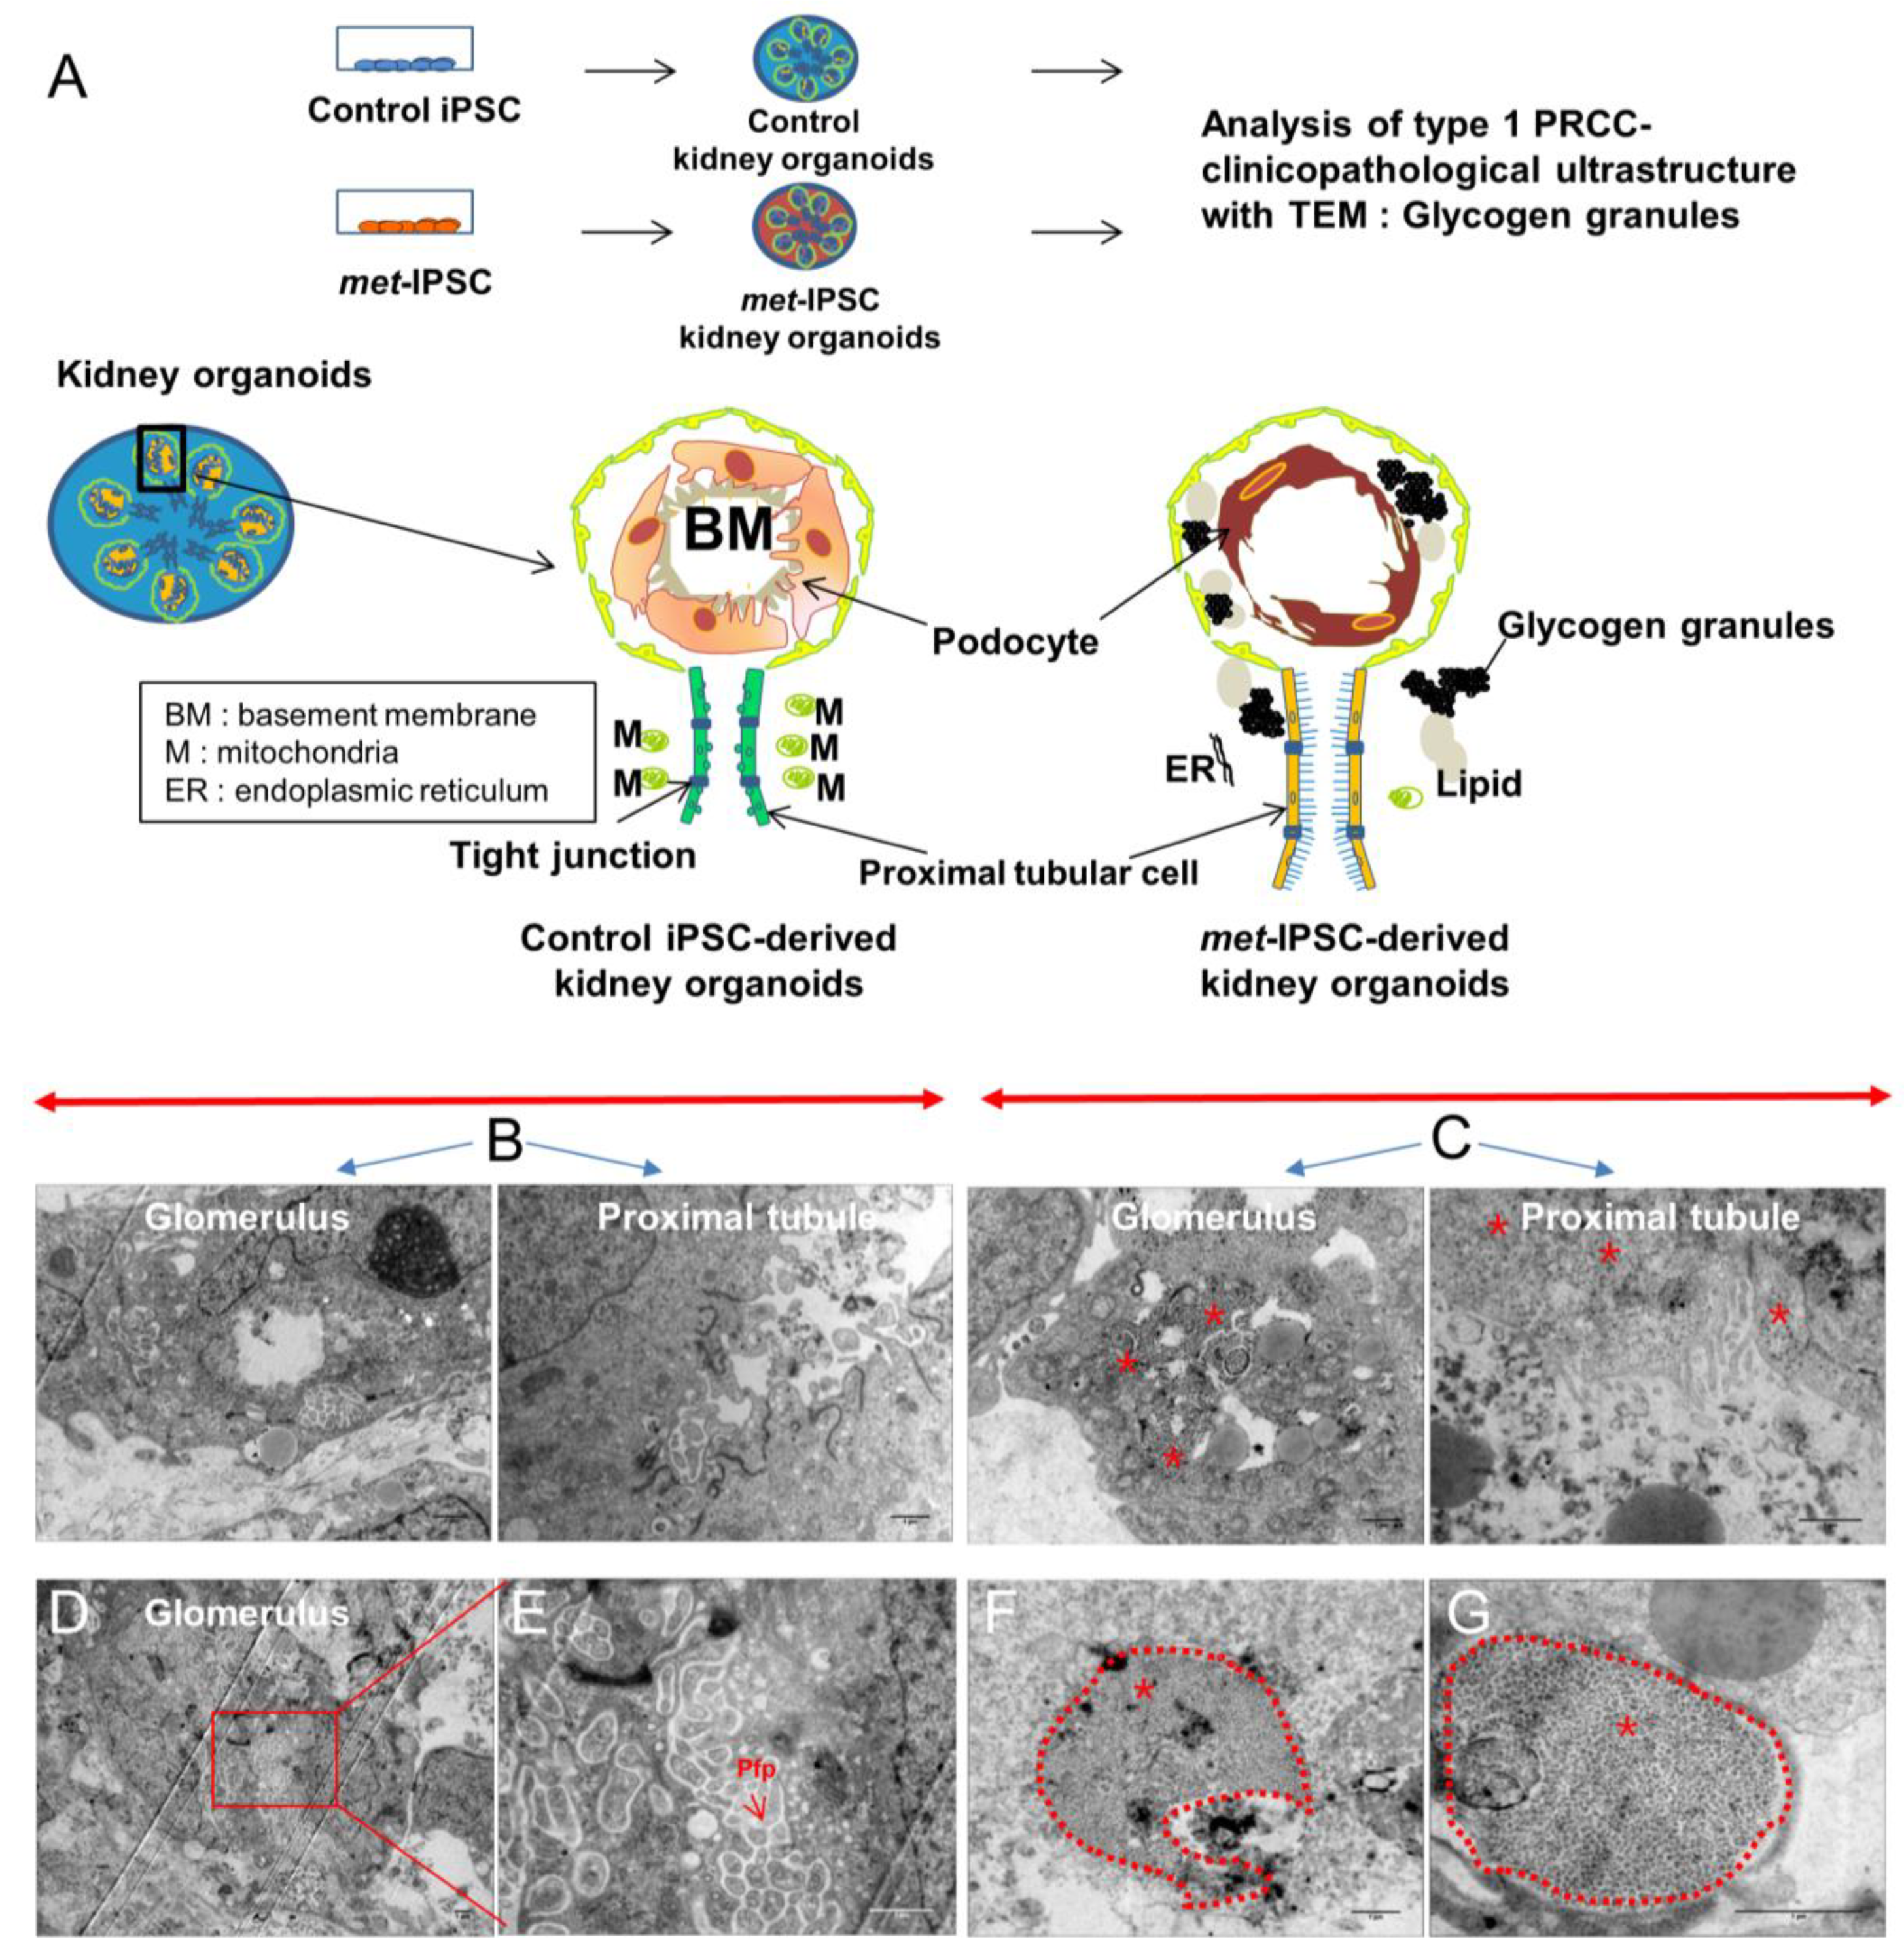
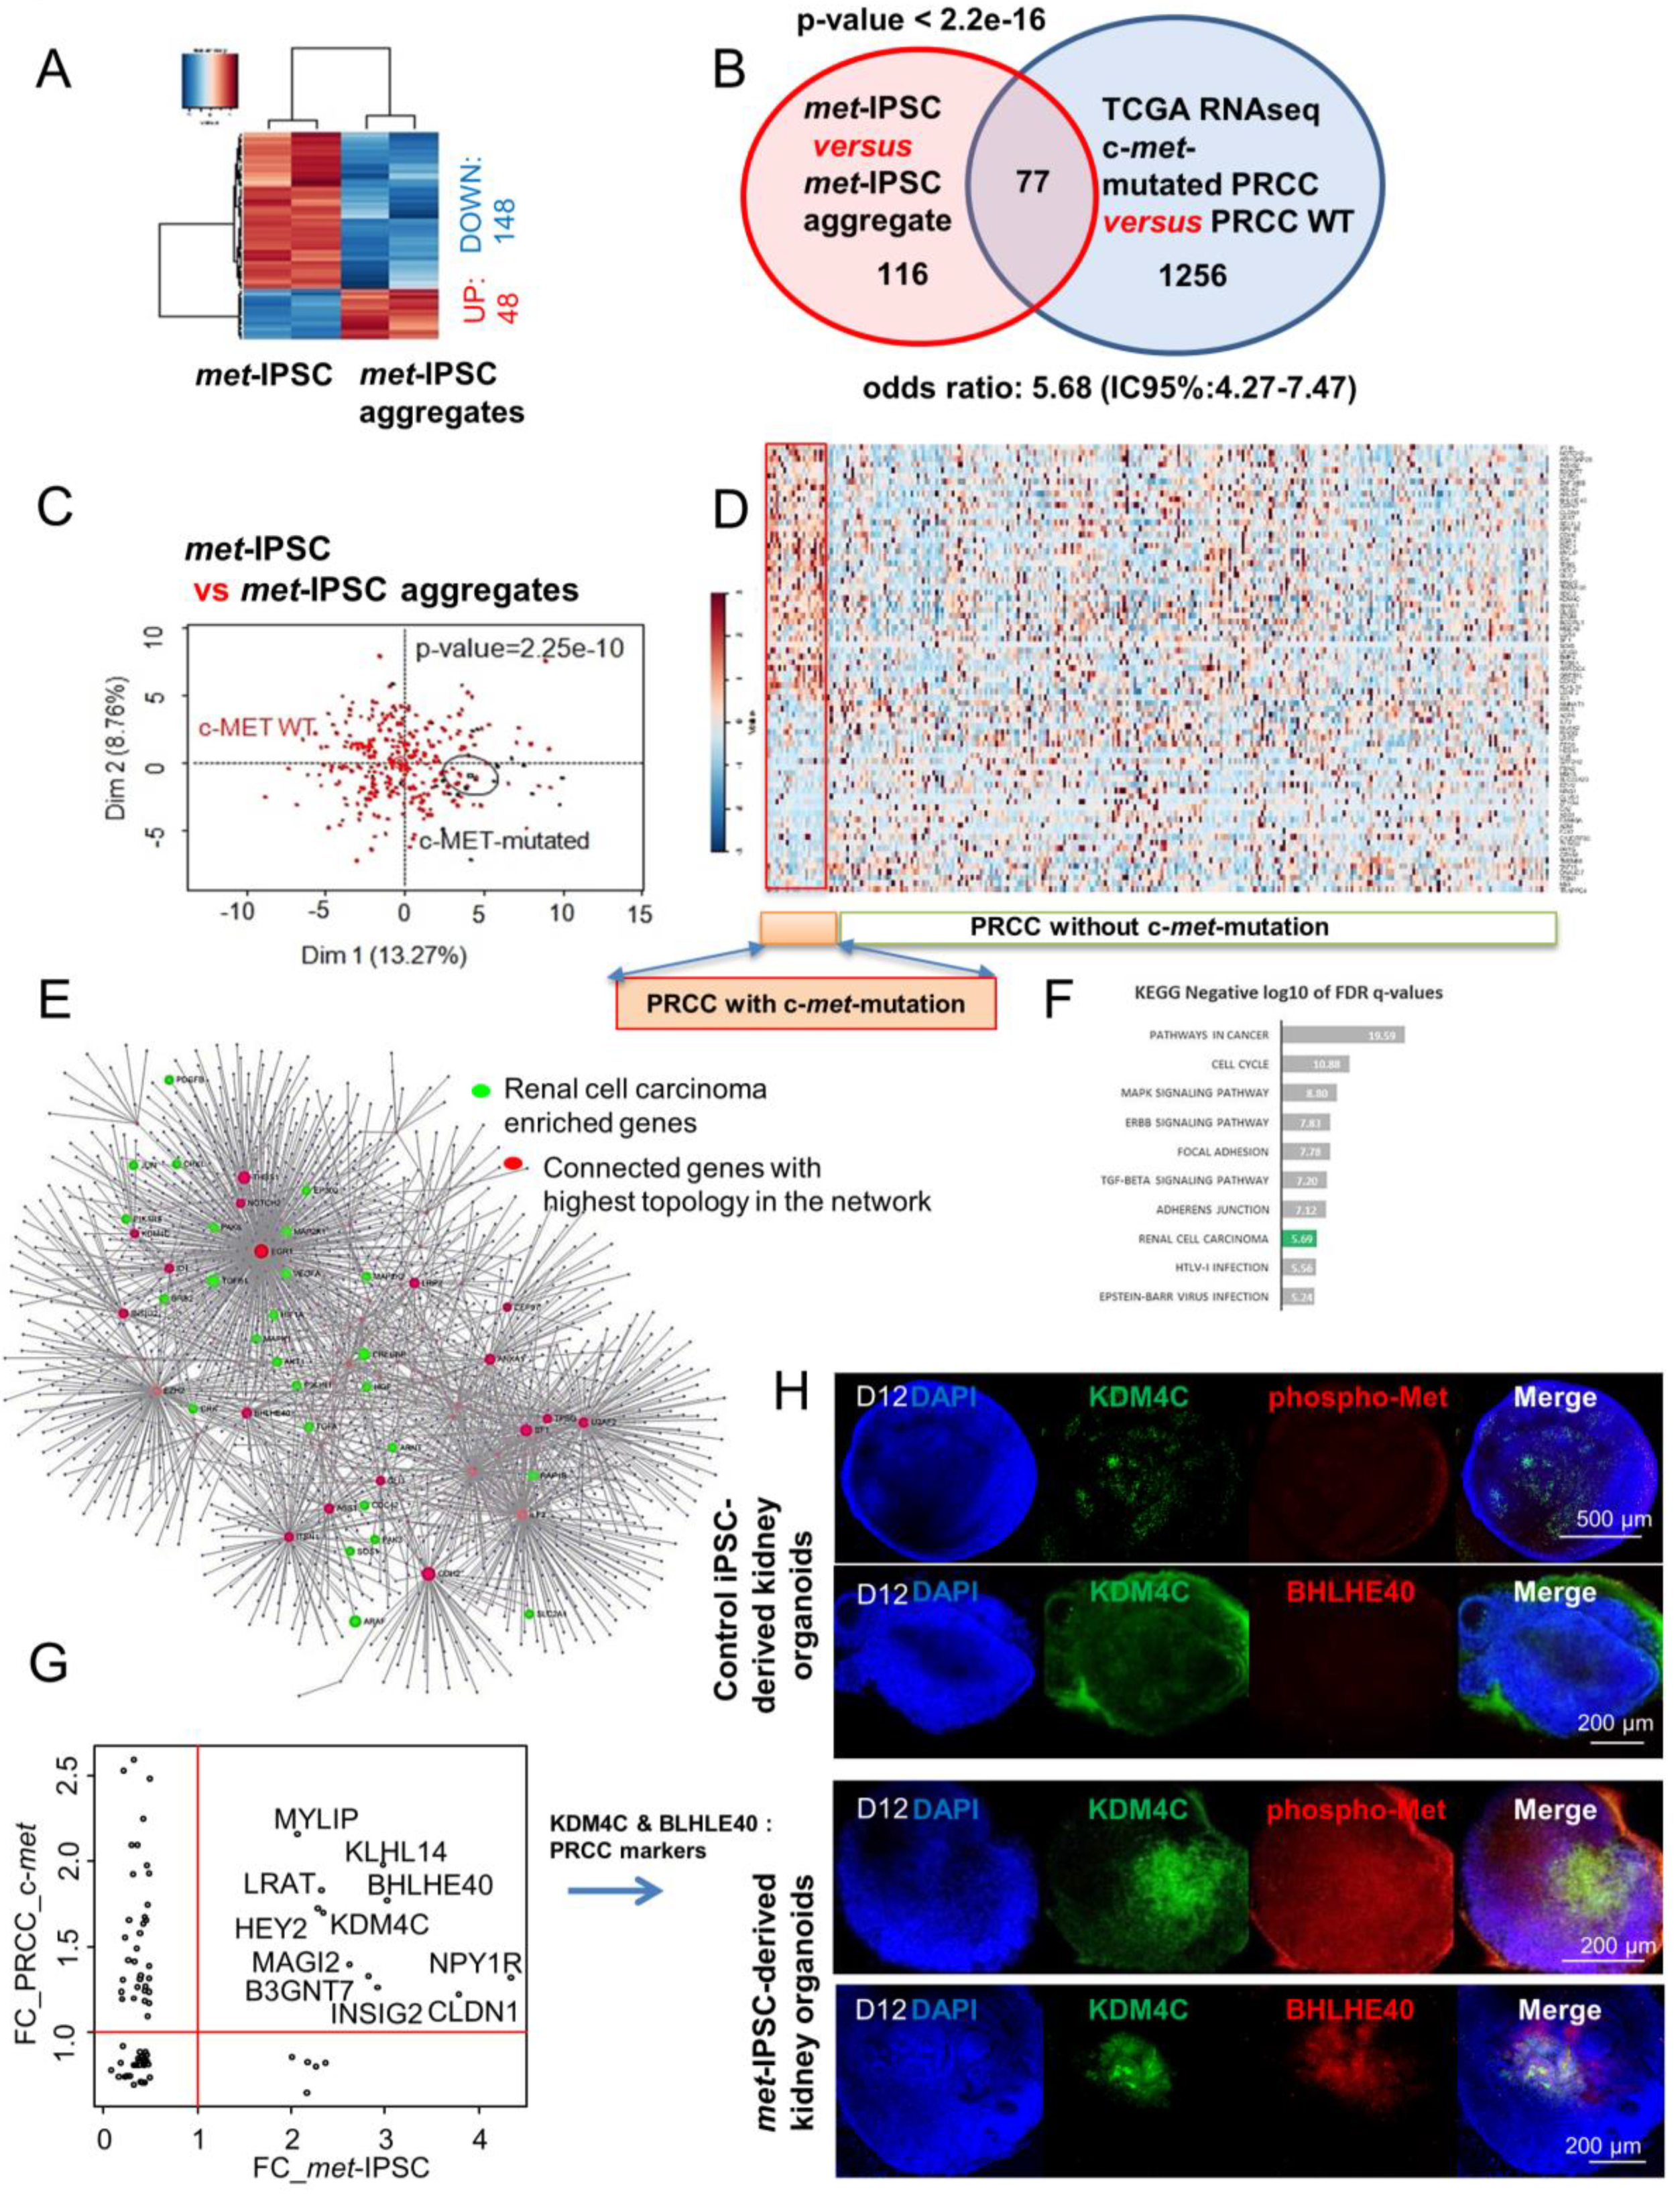
2.8. Hereditary PRCC with c-Met-Mutated iPSC Aggregates Reproduce Molecular Features of Human PRCC
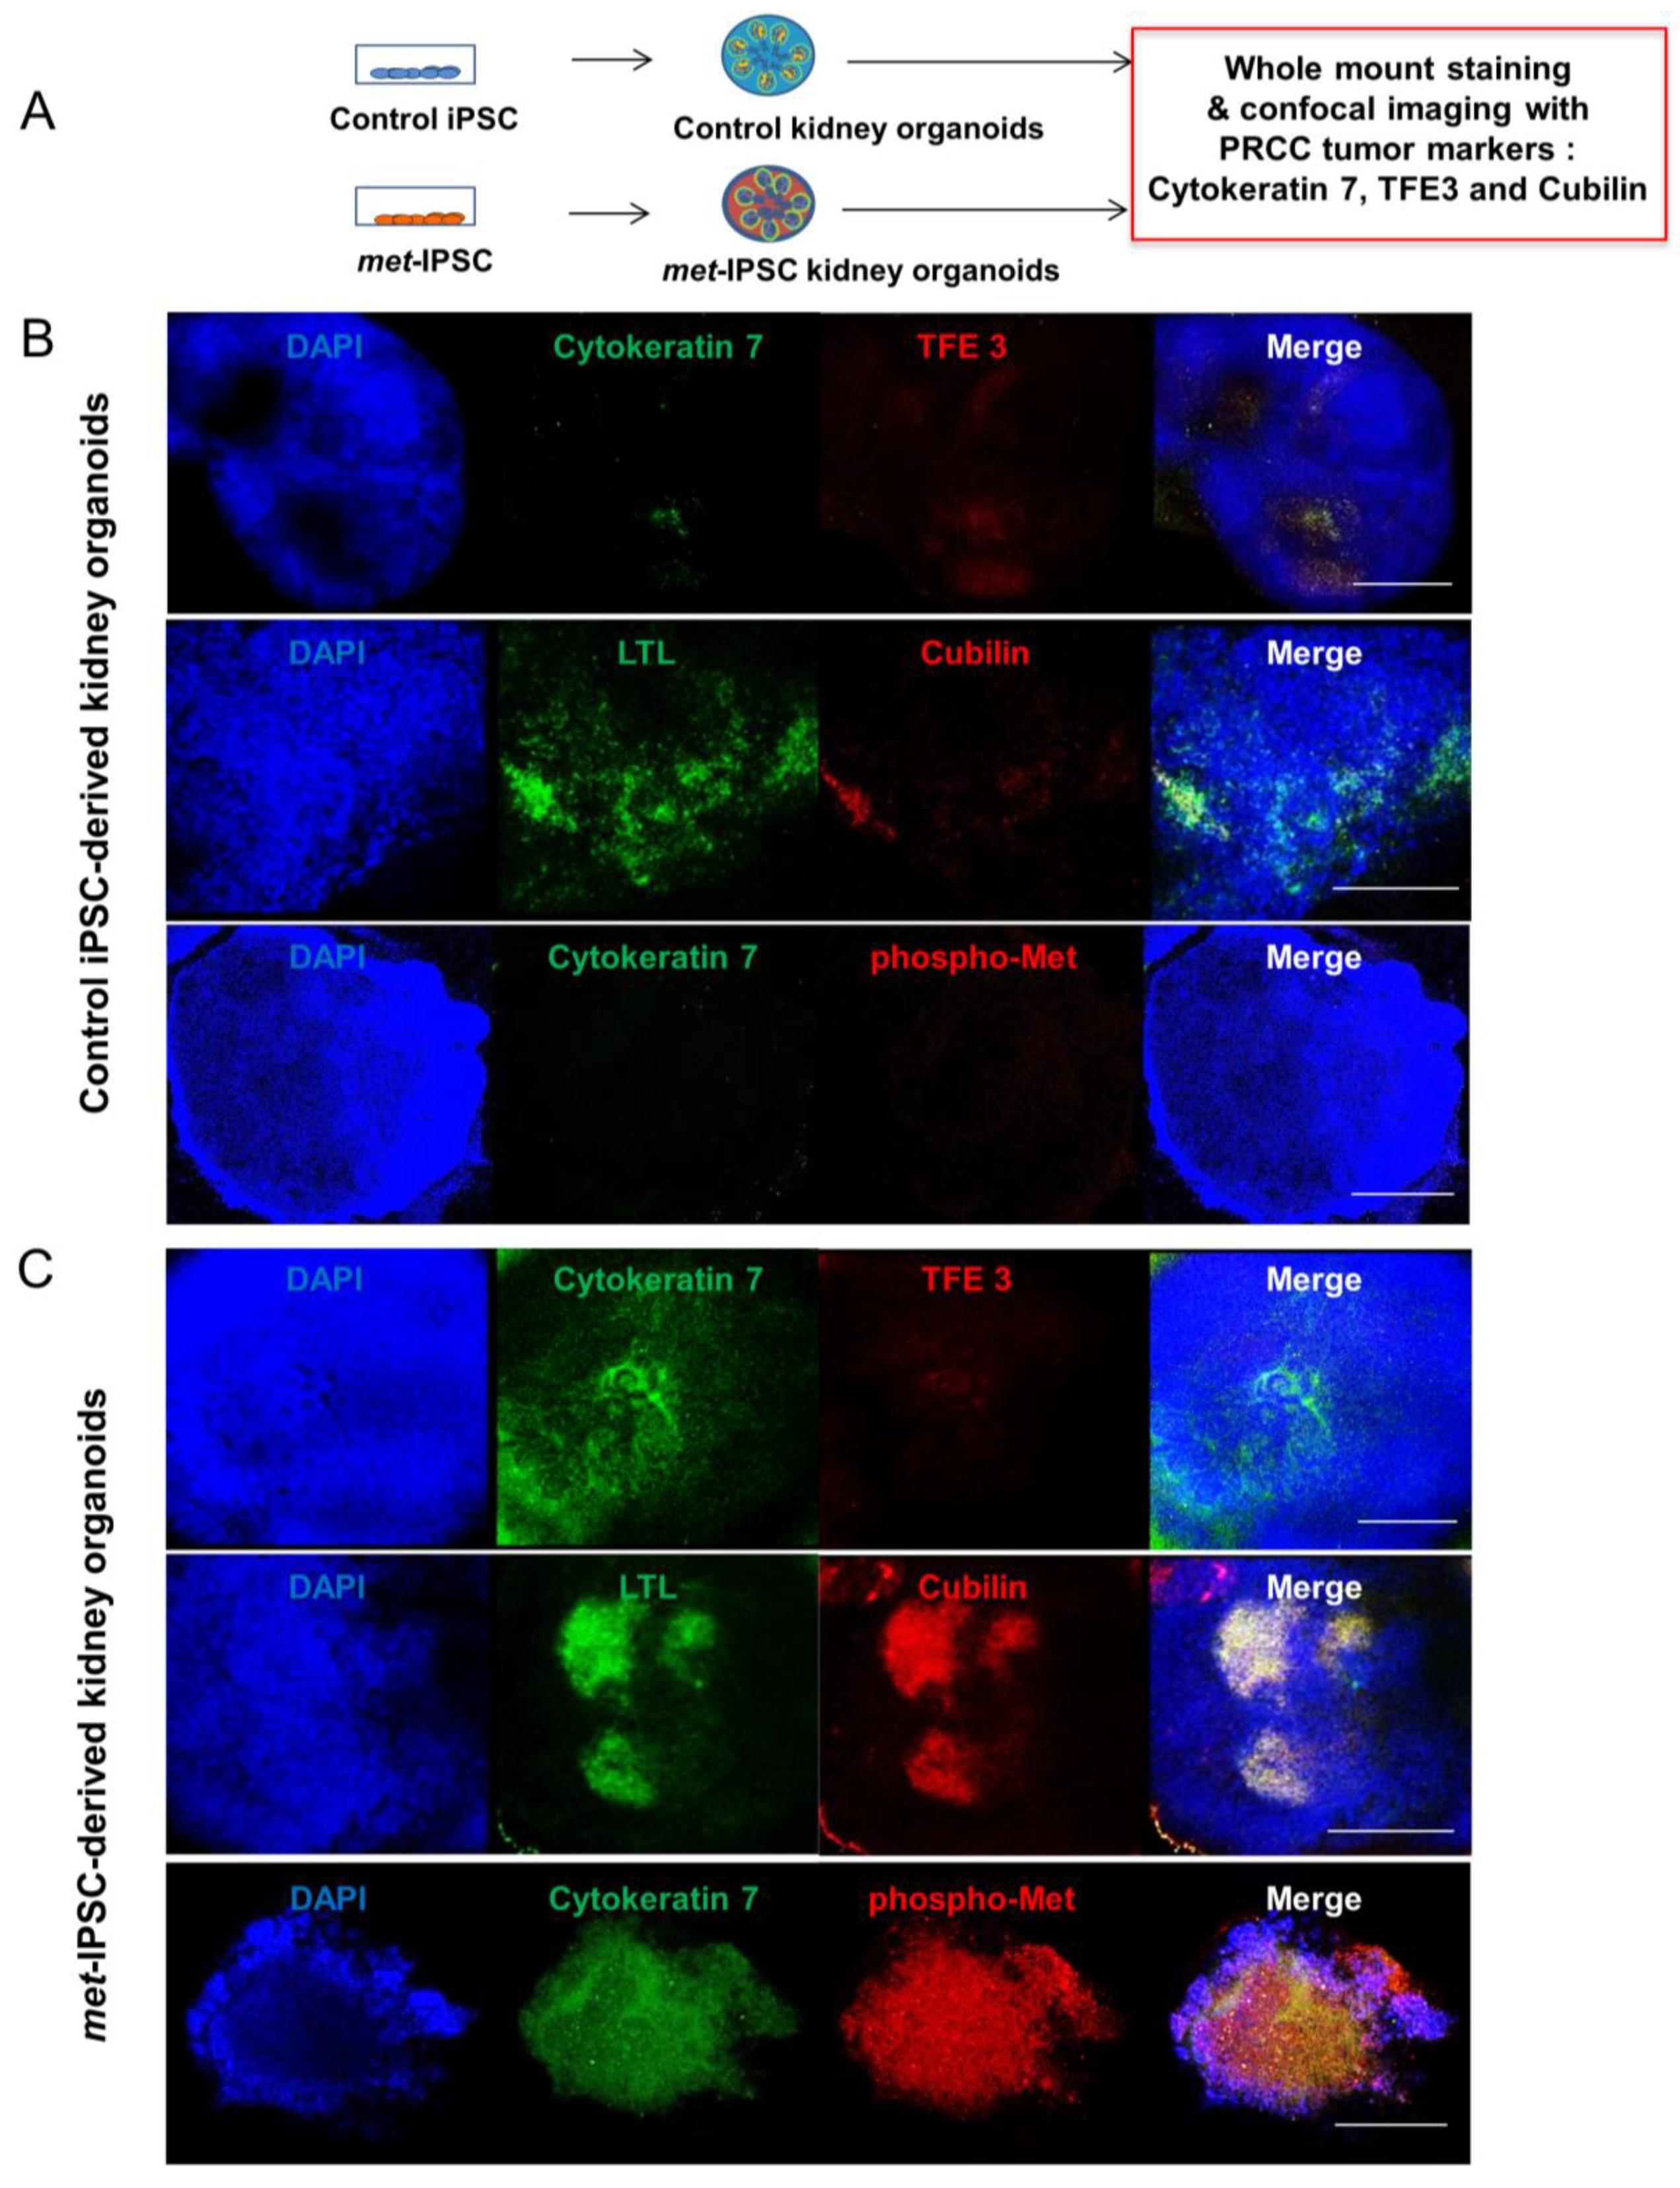
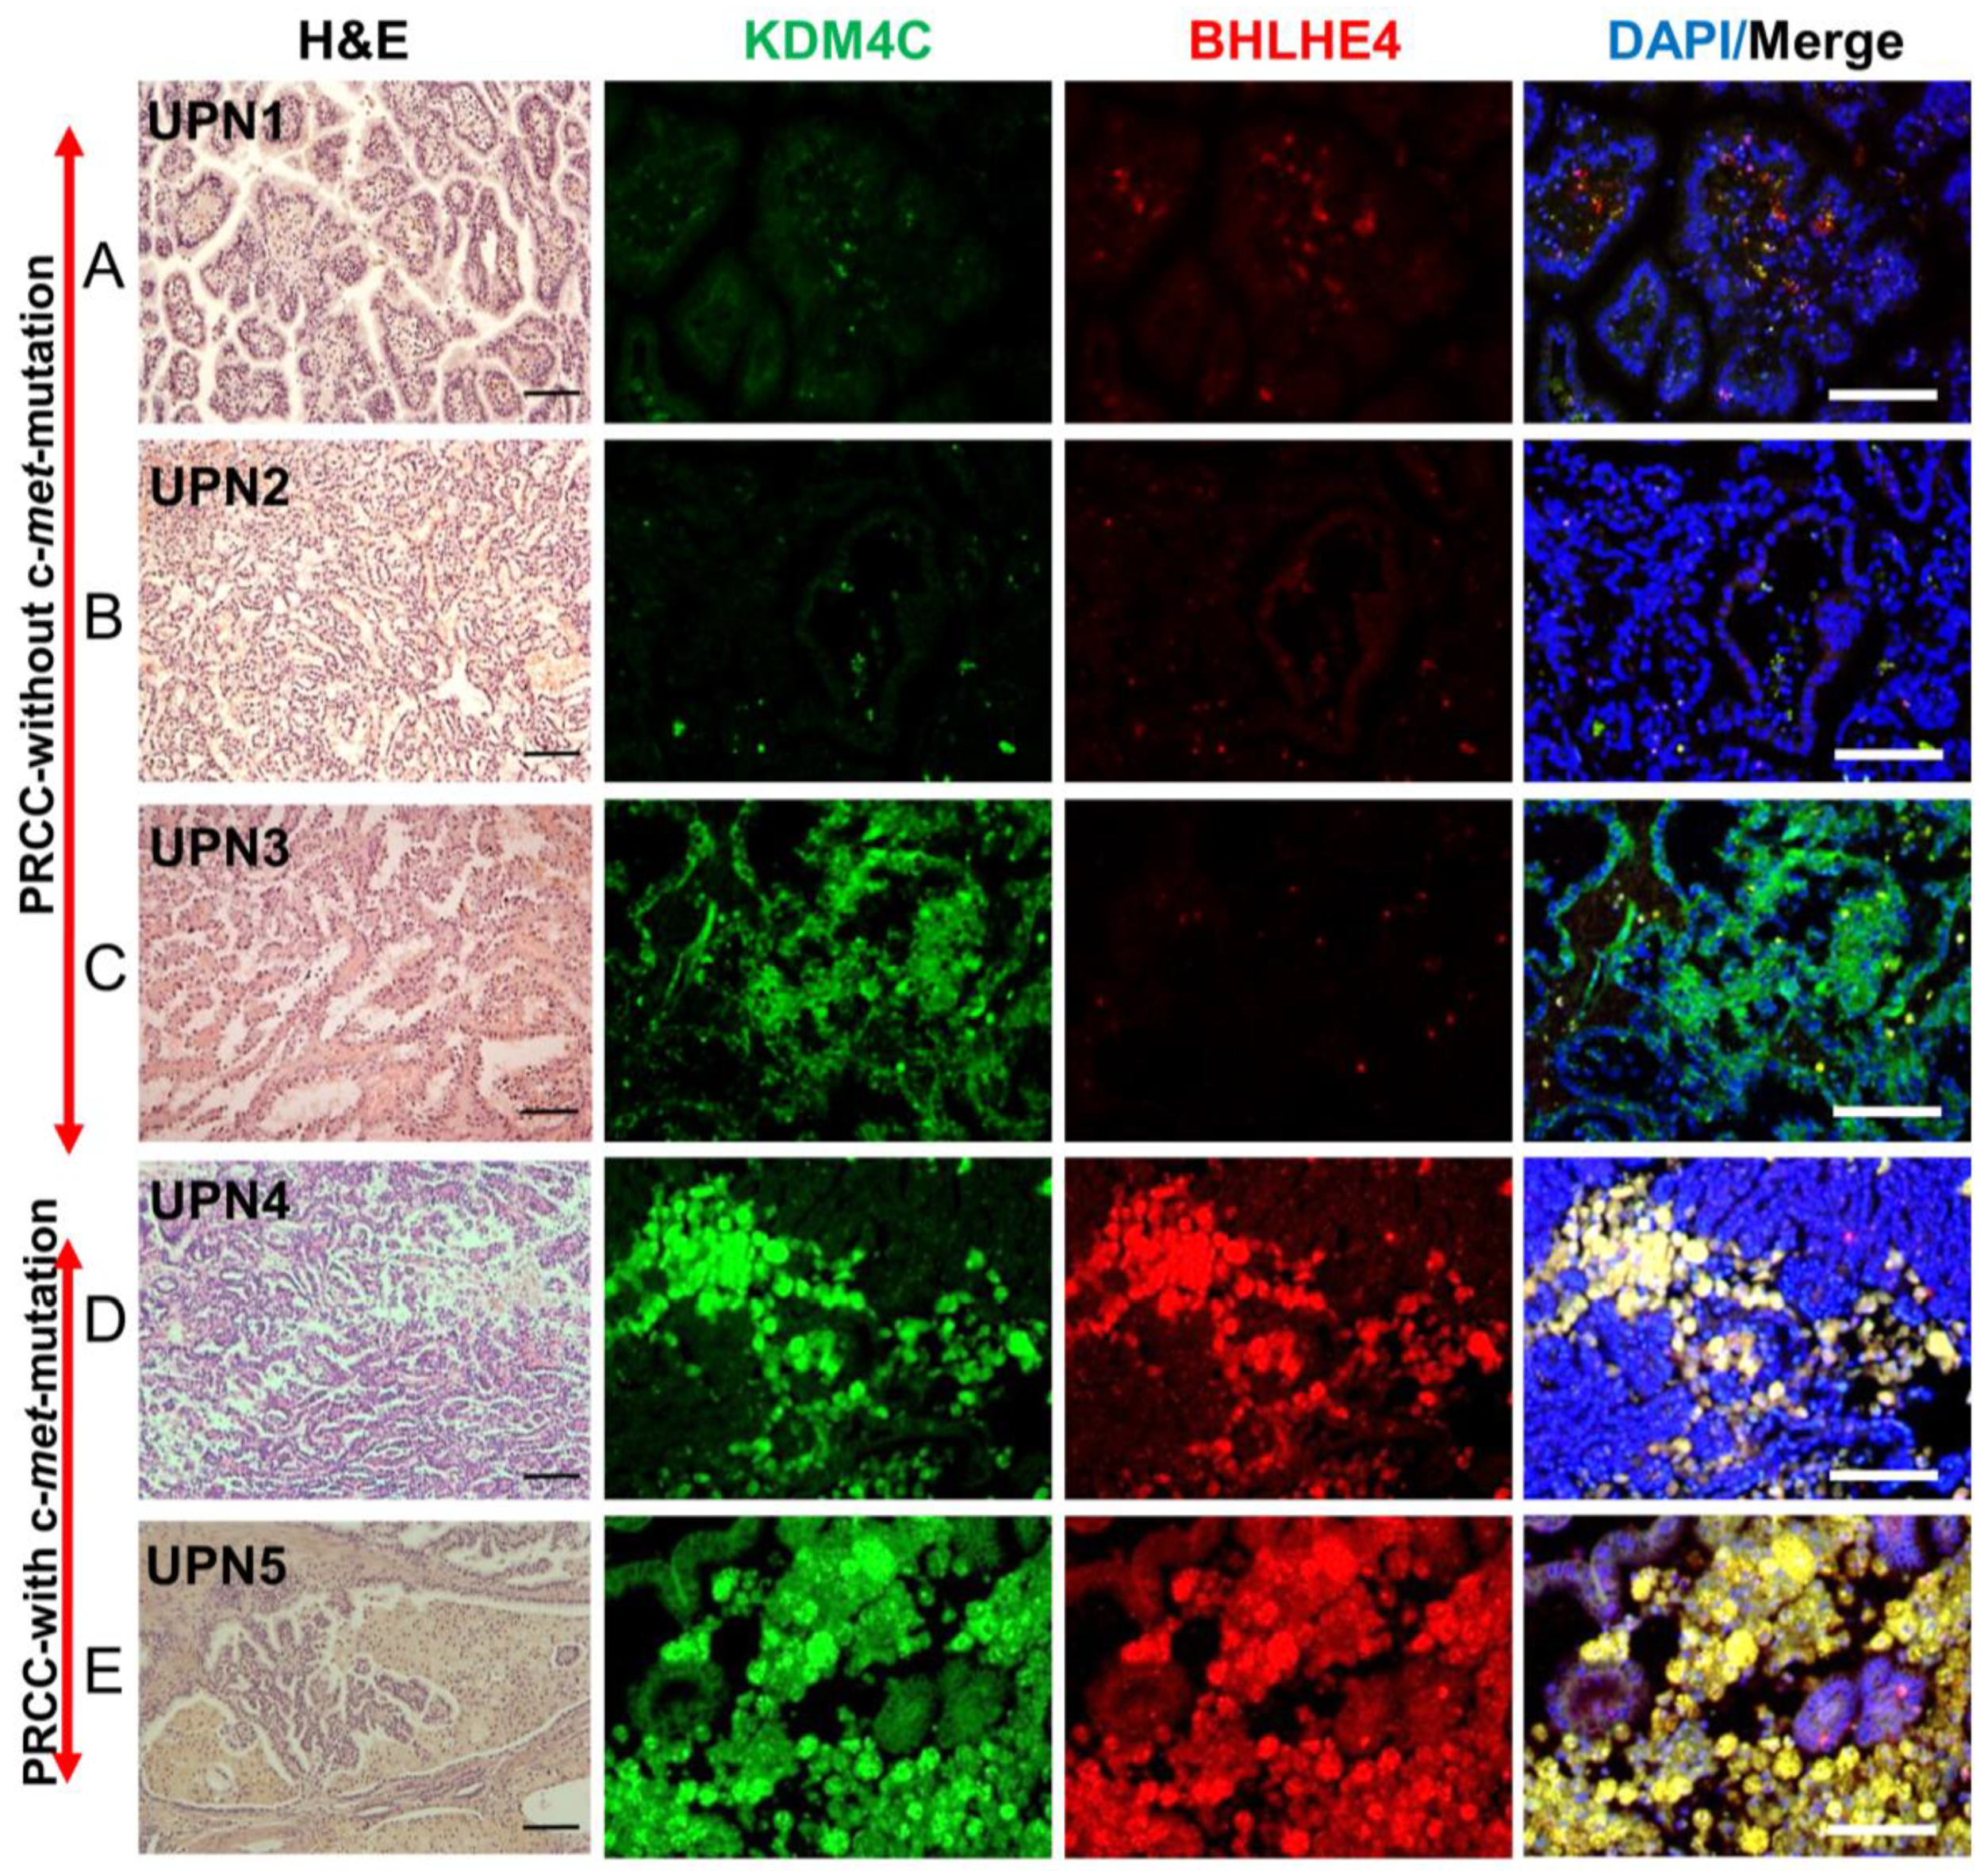
2.9. Validation of the Expression of Markers Detected in c-Met-Mutated iPSC-Derived Kidney Embryoid Bodies in Primary PRCC Tumors
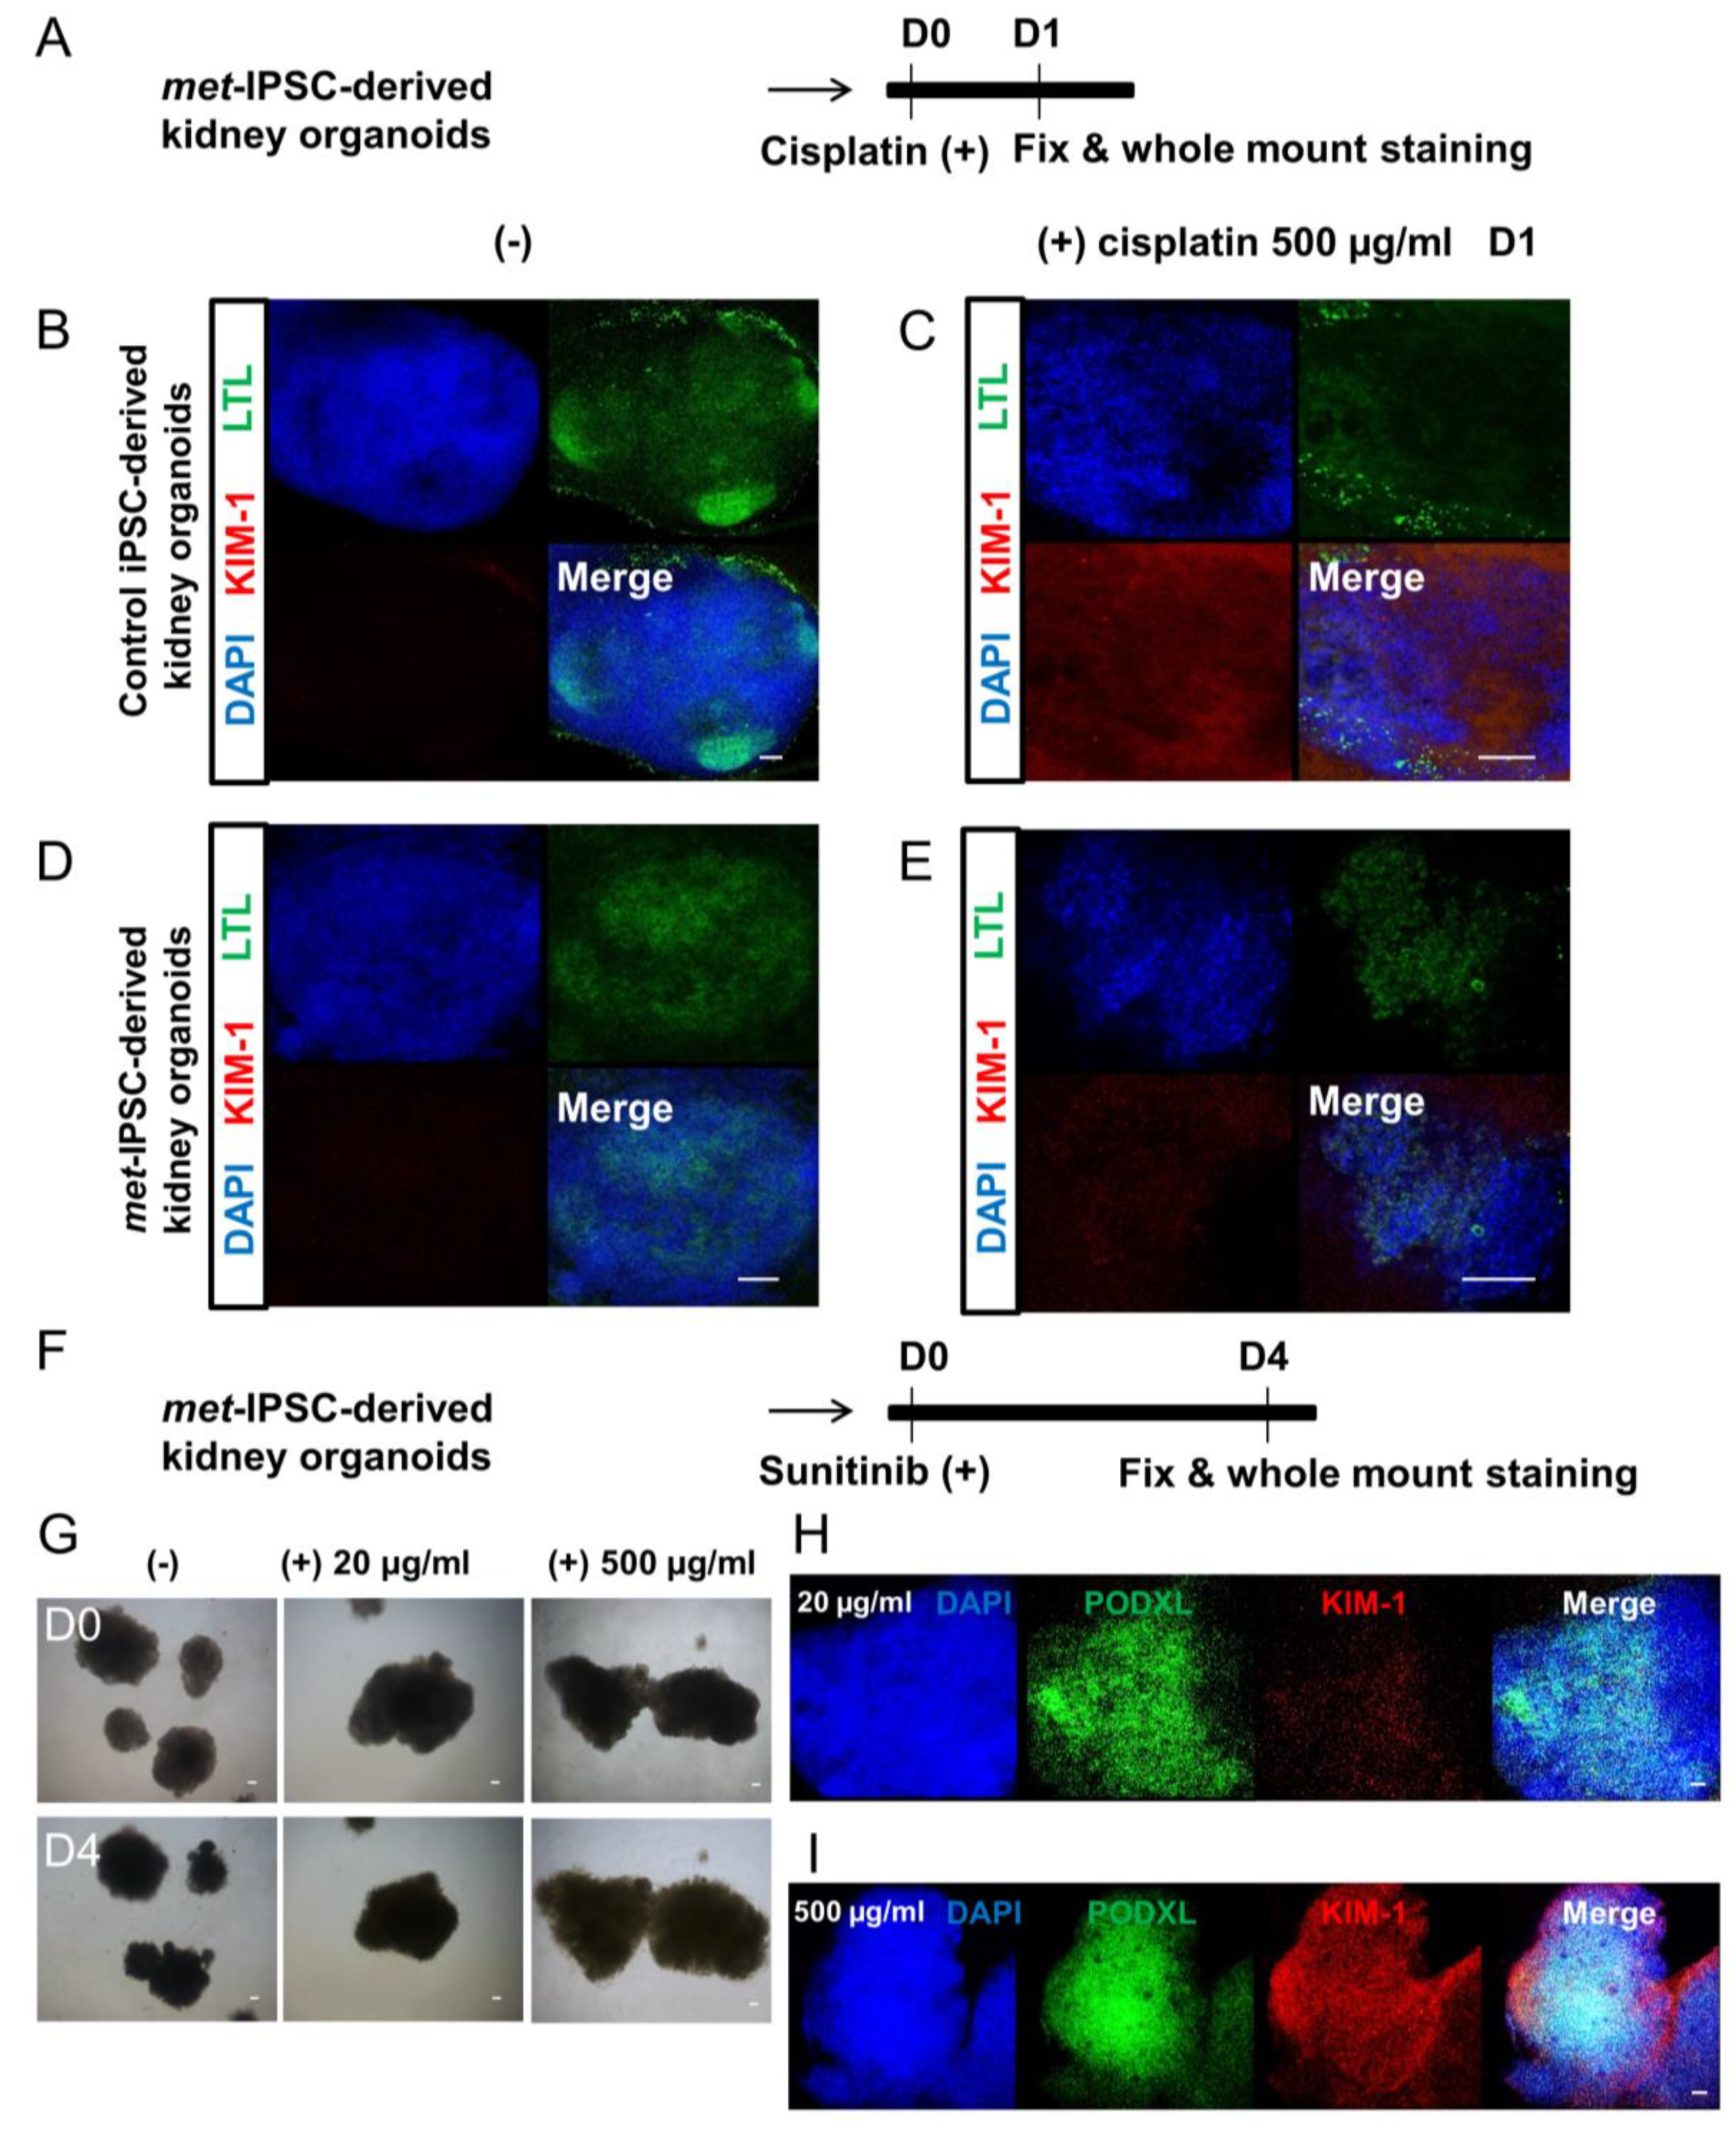
2.10. Drug Toxicity Assays
3. Discussion
4. Materials and Methods
4.1. Key Resource Table
| Reagent or Resource | Source | Identifier |
| Antibodies | ||
| Brachyury | Abcam (Cambridge, UK) | ab140661 |
| PODXL | Abcam (Cambridge, UK) | ab178566 |
| LTL | Clinisciences (Nanterre, France) | FL-1321 |
| Cubilin | Abcam (Cambridge, UK) | ab191073 |
| SIX2 | Euromedex (Souffelweyersheim, France) | 11562-1-AP |
| CD31 | Abcam (Cambridge, UK) | ab24590 |
| TFE 3 | Abcam (Cambridge, UK) | ab179804 |
| Cytokeratin 7 | Abcam (Cambridge, UK) | ab9021 |
| Nephrin | Abcam (Cambridge, UK) | ab85379 |
| KIM-1 | Bio-Techne (Minneapolis, USA) | NBP1-76701 |
| Phalloidin | Invitrogen (Carlsbad, USA) | A12381 |
| Phospho c-Met | Ozyme (Saint-Cyr-l’École, France) | 3077S |
| KDM4C | Abcam (Cambridge, UK) | LS-C114684-100 |
| VHL | Bio-Techne (Minneapolis, MN USA) | SC-5575 |
| BHLHE40 | Abcam (Cambridge, UK) | ab70723 |
| DAPI | Sigma–Aldrich (St. Louis, MO, USA) | D9542 |
| Chemicals, Peptides, and Recombinant Proteins | ||
| Essential 8 basal medium | Thermo Fisher Scientific (Waltham, MAUSA) | A1516901 |
| Essential 8 supplement | Thermo Fisher Scientific (Waltham MA, USA) | A1517101 |
| Geltrex® LDEV-Free Reduced Growth Factor Basement Membrane Matrix | Thermo Fisher Scientific (Waltham, MA, USA) | A1413202 |
| Reagent or Resource | Source | Identifier |
| Experimental Models: Cell Lines | ||
| Human iPSC: PB33 | Human (Villejuif, France) | - |
| Human c-met mutated iPSC: PB56 | Human (Villejuif, France) | - |
| Cis-platinum | Sigma–Aldrich (St. Louis, MO, USA) | P4394 |
| Osmium tetroxide solution | Sigma–Aldrich (St. Louis, MO, USA) | 75632 |
| Glutaraldehyde grade I | Sigma–Aldrich (St. Louis, MO, USA) | G5882 |
| Experimental Models: Organisms/Strains | ||
| Mouse: NOD.Cg-Prkdcscid Il2rgtm1Wjl/SzJ | N/A | |
| Software and Algorithms | ||
| ImageJ (Public domain, USA) |
4.2. Generation of Hereditary PRCC with c-Met-Mutated iPSC
4.3. Flow Cytometry
4.4. Teratoma Assay
4.5. Cell Culture and Generation of Cell Aggregates
4.6. Immunocytochemistry of iPSCs in Monolayer and Aggregate Culture
4.7. Immunohistochemistry of Mouse Kidney
4.8. Generation of Embryoid Bodies
4.9. Whole-Mount Immunostaining of 3D Embryoid Bodies
4.10. Immunohistochemistry of 3D Structures.
4.11. Transmission Electron Microscopy (TEM)
4.12. Functional Analysis of Proximal Tubules in Embryoid Bodies Containing Kidney Cells.
4.13. Transcriptome Analyses of iPSC-Derived Embryoid Bodies
4.14. Kidney Capsule Transplantation Experiments
4.15. Kidney Histology and Immunohistochemistry Analyses
4.16. Public Datasets
4.17. Transcriptome Analyses of iPSC Aggregates
4.18. Bioinformatics
4.19. Immunohistochemistry Analysis of Primary Kidney Tumors
4.20. Toxicity Tests Using c-Met-Mutated iPSC-Derived Kidney Embryoid Bodies
Supplementary Materials
Author Contributions
Funding
Conflicts of Interest
References
- Cragun, D.; Pal, T. Identification, Evaluation, and Treatment of Patients with Hereditary Cancer Risk within the United States. ISRN Oncol. 2013, 2013, 260847. [Google Scholar] [CrossRef] [PubMed]
- Hadoux, J.; Féraud, O.; Griscelli, F.; Opolon, P.; Divers, D.; Gobbo, E.; Schlumberger, M.; Bennaceur-Griscelli, A.; Turhan, A.G. Generation of an induced pluripotent stem cell line from a patient with hereditary multiple endocrine neoplasia 2A (MEN2A) syndrome with RET mutation. Stem Cell Res. 2016, 17, 154–157. [Google Scholar] [CrossRef] [PubMed] [Green Version]
- Lee, D.-F.; Su, J.; Kim, H.S.; Chang, B.; Papatsenko, D.; Zhao, R.; Yuan, Y.; Gingold, J.; Xia, W.; Darr, H.; et al. Modeling familial cancer with induced pluripotent stem cells. Cell 2015, 161, 240–254. [Google Scholar] [CrossRef]
- Griscelli, F.; Oudrhiri, N.; Feraud, O.; Divers, D.; Portier, L.; Turhan, A.G.; Bennaceur Griscelli, A. Generation of induced pluripotent stem cell (iPSC) line from a patient with triple negative breast cancer with hereditary exon 17 deletion of BRCA1 gene. Stem Cell Res. 2017, 24, 135–138. [Google Scholar] [CrossRef] [PubMed]
- Soyombo, A.A.; Wu, Y.; Kolski, L.; Rios, J.J.; Rakheja, D.; Chen, A.; Kehler, J.; Hampel, H.; Coughran, A.; Ross, T.S. Analysis of Induced Pluripotent Stem Cells from a BRCA1 Mutant Family. Stem Cell Rep. 2013, 1, 336–349. [Google Scholar] [CrossRef] [PubMed] [Green Version]
- Kim, J.; Hoffman, J.P.; Alpaugh, R.K.; Rhim, A.D.; Rhimm, A.D.; Reichert, M.; Stanger, B.Z.; Furth, E.E.; Sepulveda, A.R.; Yuan, C.-X.; et al. An iPSC line from human pancreatic ductal adenocarcinoma undergoes early to invasive stages of pancreatic cancer progression. Cell Rep. 2013, 3, 2088–2099. [Google Scholar] [CrossRef] [PubMed]
- Huang, L.; Holtzinger, A.; Jagan, I.; BeGora, M.; Lohse, I.; Ngai, N.; Nostro, C.; Wang, R.; Muthuswamy, L.B.; Crawford, H.C.; et al. Ductal pancreatic cancer modeling and drug screening using human pluripotent stem cell- and patient-derived tumor organoids. Nat. Med. 2015, 21, 1364–1371. [Google Scholar] [CrossRef] [PubMed]
- Chartier, S.; Méjean, A.; Richard, S.; Thiounn, N.; Vasiliu, V.; Verkarre, V. Biphasic Squamoid Alveolar Renal Cell Carcinoma: 2 Cases in a Family Supporting a Continuous Spectrum With Papillary Type I Renal Cell Carcinoma. Am. J. Surg. Pathol. 2017, 41, 1011. [Google Scholar] [CrossRef] [PubMed]
- Self, M.; Lagutin, O.V.; Bowling, B.; Hendrix, J.; Cai, Y.; Dressler, G.R.; Oliver, G. Six2 is required for suppression of nephrogenesis and progenitor renewal in the developing kidney. EMBO J. 2006, 25, 5214–5228. [Google Scholar] [CrossRef]
- Kobayashi, A.; Valerius, M.T.; Mugford, J.W.; Carroll, T.J.; Self, M.; Oliver, G.; McMahon, A.P. Six2 defines and regulates a multipotent self-renewing nephron progenitor population throughout mammalian kidney development. Cell Stem Cell 2008, 3, 169–181. [Google Scholar] [CrossRef]
- Delahunt, B.; Eble, J.N. Papillary renal cell carcinoma: a clinicopathologic and immunohistochemical study of 105 tumors. Mod. Pathol. Off. J. U. S. Can. Acad. Pathol. Inc 1997, 10, 537–544. [Google Scholar]
- Cancer Genome Atlas Research Network; Linehan, W.M.; Spellman, P.T.; Ricketts, C.J.; Creighton, C.J.; Fei, S.S.; Davis, C.; Wheeler, D.A.; Murray, B.A.; Schmidt, L.; et al. Comprehensive Molecular Characterization of Papillary Renal-Cell Carcinoma. N. Engl. J. Med. 2016, 374, 135–145. [Google Scholar] [CrossRef] [PubMed]
- Lubensky, I.A.; Schmidt, L.; Zhuang, Z.; Weirich, G.; Pack, S.; Zambrano, N.; Walther, M.M.; Choyke, P.; Linehan, W.M.; Zbar, B. Hereditary and Sporadic Papillary Renal Carcinomas with c-met Mutations Share a Distinct Morphological Phenotype. Am. J. Pathol. 1999, 155, 517–526. [Google Scholar] [CrossRef] [Green Version]
- Siegel, R.L.; Miller, K.D.; Jemal, A. Cancer statistics, 2016. CA. Cancer J. Clin. 2016, 66, 7–30. [Google Scholar] [CrossRef] [PubMed] [Green Version]
- Lam, A.Q.; Freedman, B.S.; Morizane, R.; Lerou, P.H.; Valerius, M.T.; Bonventre, J.V. Rapid and efficient differentiation of human pluripotent stem cells into intermediate mesoderm that forms tubules expressing kidney proximal tubular markers. J. Am. Soc. Nephrol. JASN 2014, 25, 1211–1225. [Google Scholar] [CrossRef]
- Takasato, M.; Er, P.X.; Chiu, H.S.; Maier, B.; Baillie, G.J.; Ferguson, C.; Parton, R.G.; Wolvetang, E.J.; Roost, M.S.; de Sousa Lopes, S.M.C.; et al. Kidney organoids from human iPS cells contain multiple lineages and model human nephrogenesis. Nature 2015, 526, 564–568. [Google Scholar] [CrossRef]
- Morizane, R.; Lam, A.Q.; Freedman, B.S.; Kishi, S.; Valerius, M.T.; Bonventre, J.V. Nephron organoids derived from human pluripotent stem cells model kidney development and injury. Nat. Biotechnol. 2015, 33, 1193–1200. [Google Scholar] [CrossRef]
- Dutta, D.; Heo, I.; Clevers, H. Disease Modeling in Stem Cell-Derived 3D Organoid Systems. Trends Mol. Med. 2017, 23, 393–410. [Google Scholar] [CrossRef] [PubMed]
- Davidowitz, E.J.; Schoenfeld, A.R.; Burk, R.D. VHL Induces Renal Cell Differentiation and Growth Arrest through Integration of Cell-Cell and Cell-Extracellular Matrix Signaling. Mol. Cell. Biol. 2001, 21, 865–874. [Google Scholar] [CrossRef] [Green Version]
- Luckett, W.P. The development of primordial and definitive amniotic cavities in early rhesus monkey and human embryos. Am. J. Anat. 1975, 144, 149–167. [Google Scholar] [CrossRef]
- Takabatake, Y.; Sugiyama, T.; Kohara, H.; Matsusaka, T.; Kurihara, H.; Koni, P.A.; Nagasawa, Y.; Hamano, T.; Matsui, I.; Kawada, N.; et al. The CXCL12 (SDF-1)/CXCR4 axis is essential for the development of renal vasculature. J. Am. Soc. Nephrol. JASN 2009, 20, 1714–1723. [Google Scholar] [CrossRef] [PubMed]
- Yu, W.; Zhang, W.; Jiang, Y.; Wang, Y.; Li, Y.; Wang, J.; Sun, L.; Ran, W.; Li, H. Clinicopathological, genetic, ultrastructural characterizations and prognostic factors of papillary renal cell carcinoma: New diagnostic and prognostic information. Acta Histochem. 2013, 115, 452–459. [Google Scholar] [CrossRef] [PubMed]
- Tsuda, M.; Davis, I.J.; Argani, P.; Shukla, N.; McGill, G.G.; Nagai, M.; Saito, T.; Laé, M.; Fisher, D.E.; Ladanyi, M. TFE3 Fusions Activate MET Signaling by Transcriptional Up-regulation, Defining Another Class of Tumors as Candidates for Therapeutic MET Inhibition. Cancer Res. 2007, 67, 919–929. [Google Scholar] [CrossRef] [PubMed]
- Chevarie-Davis, M.; Riazalhosseini, Y.; Arseneault, M.; Aprikian, A.; Kassouf, W.; Tanguay, S.; Latour, M.; Brimo, F. The morphologic and immunohistochemical spectrum of papillary renal cell carcinoma: study including 132 cases with pure type 1 and type 2 morphology as well as tumors with overlapping features. Am. J. Surg. Pathol. 2014, 38, 887–894. [Google Scholar] [CrossRef] [PubMed]
- Garcia, J.; Lizcano, F. KDM4C Activity Modulates Cell Proliferation and Chromosome Segregation in Triple-Negative Breast Cancer. Breast Cancer Basic Clin. Res. 2016, 10, 169–175. [Google Scholar] [CrossRef] [PubMed]
- Krill-Burger, J.M.; Lyons, M.A.; Kelly, L.A.; Sciulli, C.M.; Petrosko, P.; Chandran, U.R.; Kubal, M.D.; Bastacky, S.I.; Parwani, A.V.; Dhir, R.; et al. Renal Cell Neoplasms Contain Shared Tumor Type–Specific Copy Number Variations. Am. J. Pathol. 2012, 180, 2427–2439. [Google Scholar] [CrossRef]
- Han, W.K.; Bailly, V.; Abichandani, R.; Thadhani, R.; Bonventre, J.V. Kidney Injury Molecule-1 (KIM-1): A novel biomarker for human renal proximal tubule injury. Kidney Int. 2002, 62, 237–244. [Google Scholar] [CrossRef] [PubMed] [Green Version]
- Zarrabi, K.; Paroya, A.; Wu, S. Emerging therapeutic agents for genitourinary cancers. J. Hematol. Oncol.J Hematol Oncol 2019, 12, 89. [Google Scholar] [CrossRef]
- Wang, Q.; Yang, S.; Wang, K.; Sun, S.-Y. MET inhibitors for targeted therapy of EGFR TKI-resistant lung cancer. J. Hematol. Oncol. 2019, 12, 63. [Google Scholar] [CrossRef]
- Berry, W.L.; Janknecht, R. KDM4/JMJD2 histone demethylases: epigenetic regulators in cancer cells. Cancer Res. 2013, 73, 2936–2942. [Google Scholar] [CrossRef]
- Cheung, N.; Fung, T.K.; Zeisig, B.B.; Holmes, K.; Rane, J.K.; Mowen, K.A.; Finn, M.G.; Lenhard, B.; Chan, L.C.; So, C.W.E. Targeting Aberrant Epigenetic Networks Mediated by PRMT1 and KDM4C in Acute Myeloid Leukemia. Cancer Cell 2016, 29, 32–48. [Google Scholar] [CrossRef] [PubMed] [Green Version]
- Sato, F.; Bhawal, U.K.; Yoshimura, T.; Muragaki, Y. DEC1 and DEC2 Crosstalk between Circadian Rhythm and Tumor Progression. J. Cancer 2016, 7, 153–159. [Google Scholar] [CrossRef] [PubMed] [Green Version]
- Ivanova, A.; Liao, S.-Y.; Lerman, M.I.; Ivanov, S.; Stanbridge, E.J. STRA13 expression and subcellular localisation in normal and tumour tissues: implications for use as a diagnostic and differentiation marker. J. Med. Genet. 2005, 42, 565–576. [Google Scholar] [CrossRef] [PubMed] [Green Version]
- Telliam, G.; Féraud, O.; Griscelli, F.; Opolon, P.; Divers, D.; Bennaceur-Griscelli, A.; Turhan, A.G. Generation of an induced pluripotent stem cell line from a patient with chronic myeloid leukemia (CML) resistant to targeted therapies. Stem Cell Res. 2016, 17, 235–237. [Google Scholar] [CrossRef] [PubMed] [Green Version]
- Irizarry, R.A.; Bolstad, B.M.; Collin, F.; Cope, L.M.; Hobbs, B.; Speed, T.P. Summaries of Affymetrix GeneChip probe level data. Nucleic Acids Res. 2003, 31, e15. [Google Scholar] [CrossRef] [PubMed]
- Subramanian, A.; Tamayo, P.; Mootha, V.K.; Mukherjee, S.; Ebert, B.L.; Gillette, M.A.; Paulovich, A.; Pomeroy, S.L.; Golub, T.R.; Lander, E.S.; et al. Gene set enrichment analysis: a knowledge-based approach for interpreting genome-wide expression profiles. Proc. Natl. Acad. Sci. USA 2005, 102, 15545–15550. [Google Scholar] [CrossRef] [PubMed]
- Gao, J.; Aksoy, B.A.; Dogrusoz, U.; Dresdner, G.; Gross, B.; Sumer, S.O.; Sun, Y.; Jacobsen, A.; Sinha, R.; Larsson, E.; et al. Integrative analysis of complex cancer genomics and clinical profiles using the cBioPortal. Sci. Signal. 2013, 6, pl1. [Google Scholar] [CrossRef]
- Breitling, R.; Armengaud, P.; Amtmann, A.; Herzyk, P. Rank products: a simple, yet powerful, new method to detect differentially regulated genes in replicated microarray experiments. FEBS Lett. 2004, 573, 83–92. [Google Scholar] [CrossRef]
- Culhane, A.C.; Thioulouse, J.; Perrière, G.; Higgins, D.G. MADE4: an R package for multivariate analysis of gene expression data. Bioinforma. Oxf. Engl. 2005, 21, 2789–2790. [Google Scholar] [CrossRef] [Green Version]
- Tibshirani, R.; Hastie, T.; Narasimhan, B.; Chu, G. Diagnosis of multiple cancer types by shrunken centroids of gene expression. Proc. Natl. Acad. Sci. USA 2002, 99, 6567–6572. [Google Scholar] [CrossRef] [Green Version]
- Xia, J.; Gill, E.E.; Hancock, R.E.W. NetworkAnalyst for statistical, visual and network-based meta-analysis of gene expression data. Nat. Protoc. 2015, 10, 823–844. [Google Scholar] [CrossRef] [PubMed]
- Breuer, K.; Foroushani, A.K.; Laird, M.R.; Chen, C.; Sribnaia, A.; Lo, R.; Winsor, G.L.; Hancock, R.E.W.; Brinkman, F.S.L.; Lynn, D.J. InnateDB: systems biology of innate immunity and beyond—Recent updates and continuing curation. Nucleic Acids Res. 2013, 41, D1228–D1233. [Google Scholar] [CrossRef] [PubMed]
- Ogata, H.; Goto, S.; Sato, K.; Fujibuchi, W.; Bono, H.; Kanehisa, M. KEGG: Kyoto Encyclopedia of Genes and Genomes. Nucleic Acids Res. 1999, 27, 29–34. [Google Scholar] [CrossRef] [PubMed] [Green Version]


© 2019 by the authors. Licensee MDPI, Basel, Switzerland. This article is an open access article distributed under the terms and conditions of the Creative Commons Attribution (CC BY) license (http://creativecommons.org/licenses/by/4.0/).
Share and Cite
Hwang, J.W.; Desterke, C.; Féraud, O.; Richard, S.; Ferlicot, S.; Verkarre, V.; Patard, J.J.; Loisel-Duwattez, J.; Foudi, A.; Griscelli, F.; et al. iPSC-Derived Embryoid Bodies as Models of c-Met-Mutated Hereditary Papillary Renal Cell Carcinoma. Int. J. Mol. Sci. 2019, 20, 4867. https://0-doi-org.brum.beds.ac.uk/10.3390/ijms20194867
Hwang JW, Desterke C, Féraud O, Richard S, Ferlicot S, Verkarre V, Patard JJ, Loisel-Duwattez J, Foudi A, Griscelli F, et al. iPSC-Derived Embryoid Bodies as Models of c-Met-Mutated Hereditary Papillary Renal Cell Carcinoma. International Journal of Molecular Sciences. 2019; 20(19):4867. https://0-doi-org.brum.beds.ac.uk/10.3390/ijms20194867
Chicago/Turabian StyleHwang, Jin Wook, Christophe Desterke, Olivier Féraud, Stephane Richard, Sophie Ferlicot, Virginie Verkarre, Jean Jacques Patard, Julien Loisel-Duwattez, Adlen Foudi, Frank Griscelli, and et al. 2019. "iPSC-Derived Embryoid Bodies as Models of c-Met-Mutated Hereditary Papillary Renal Cell Carcinoma" International Journal of Molecular Sciences 20, no. 19: 4867. https://0-doi-org.brum.beds.ac.uk/10.3390/ijms20194867