Knockdown of the TP53-Induced Glycolysis and Apoptosis Regulator (TIGAR) Sensitizes Glioma Cells to Hypoxia, Irradiation and Temozolomide

 ,
,
Abstract
:
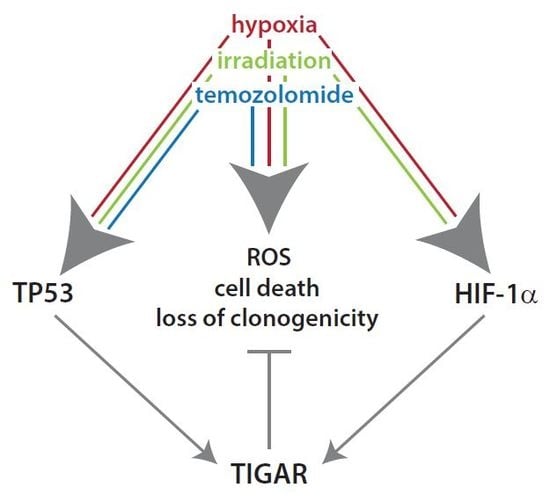
1. Introduction
2. Results
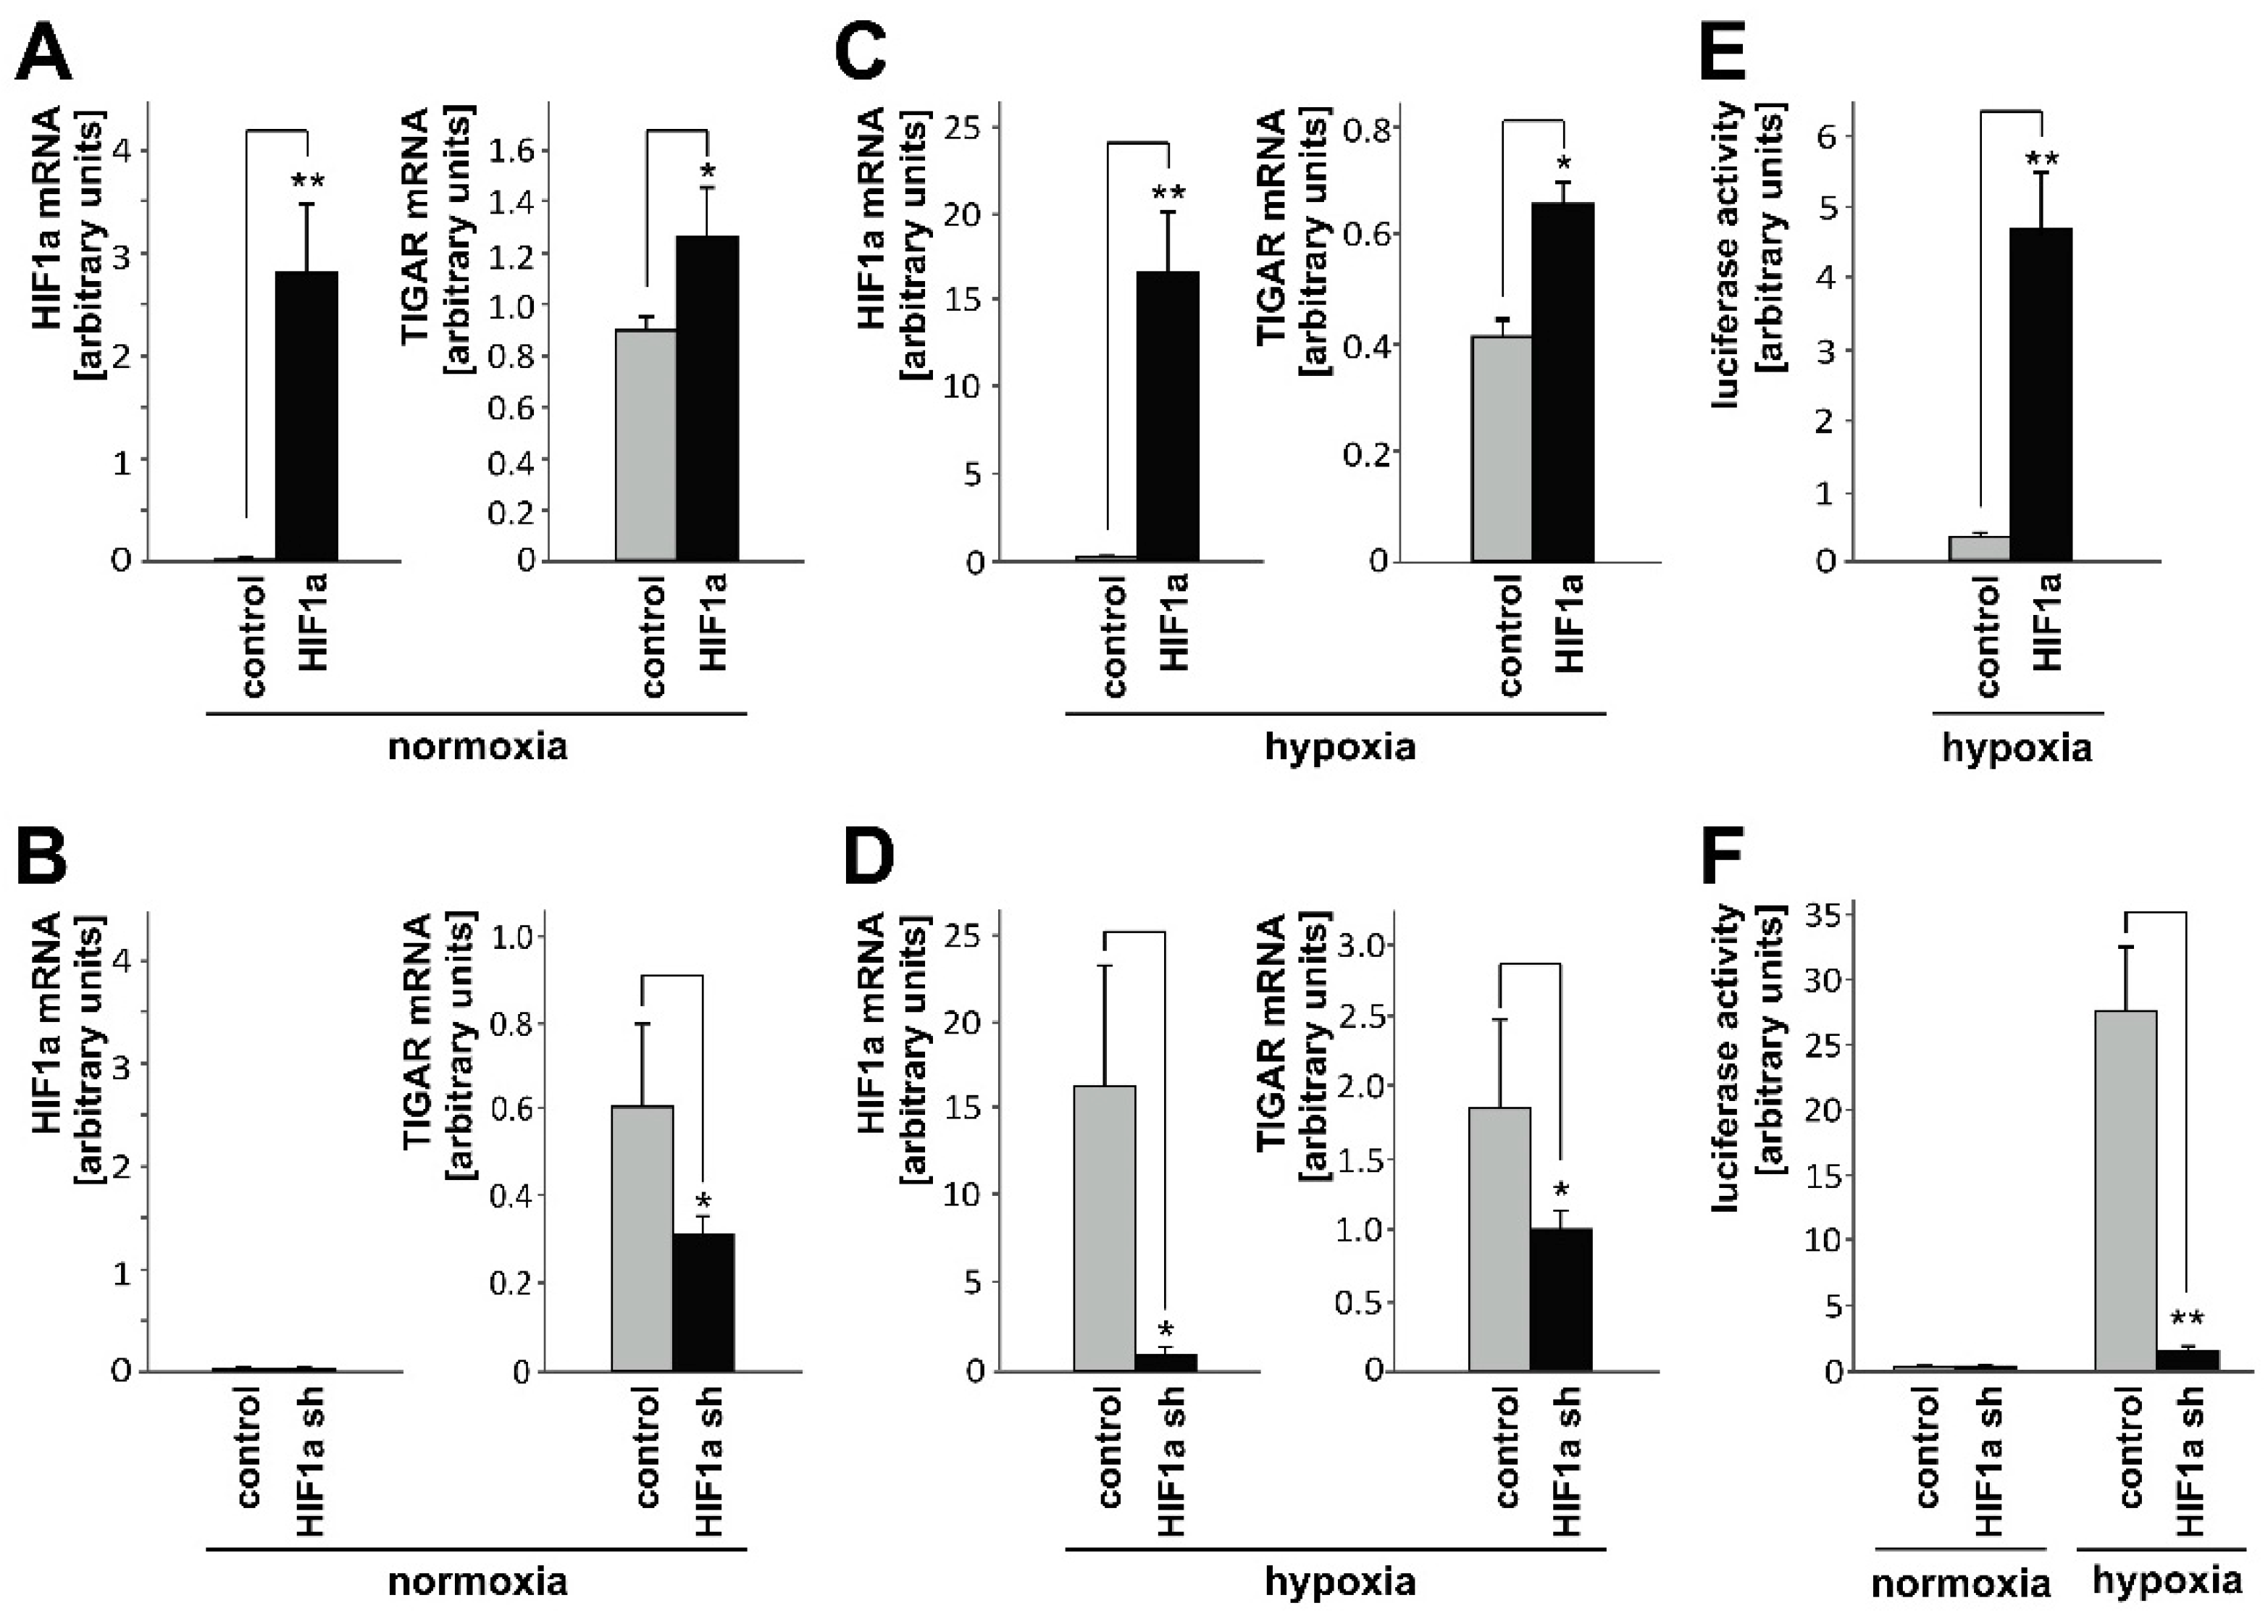
2.1. HIF-1α Upregulates TIGAR Expression in Both Normoxia and Hypoxia
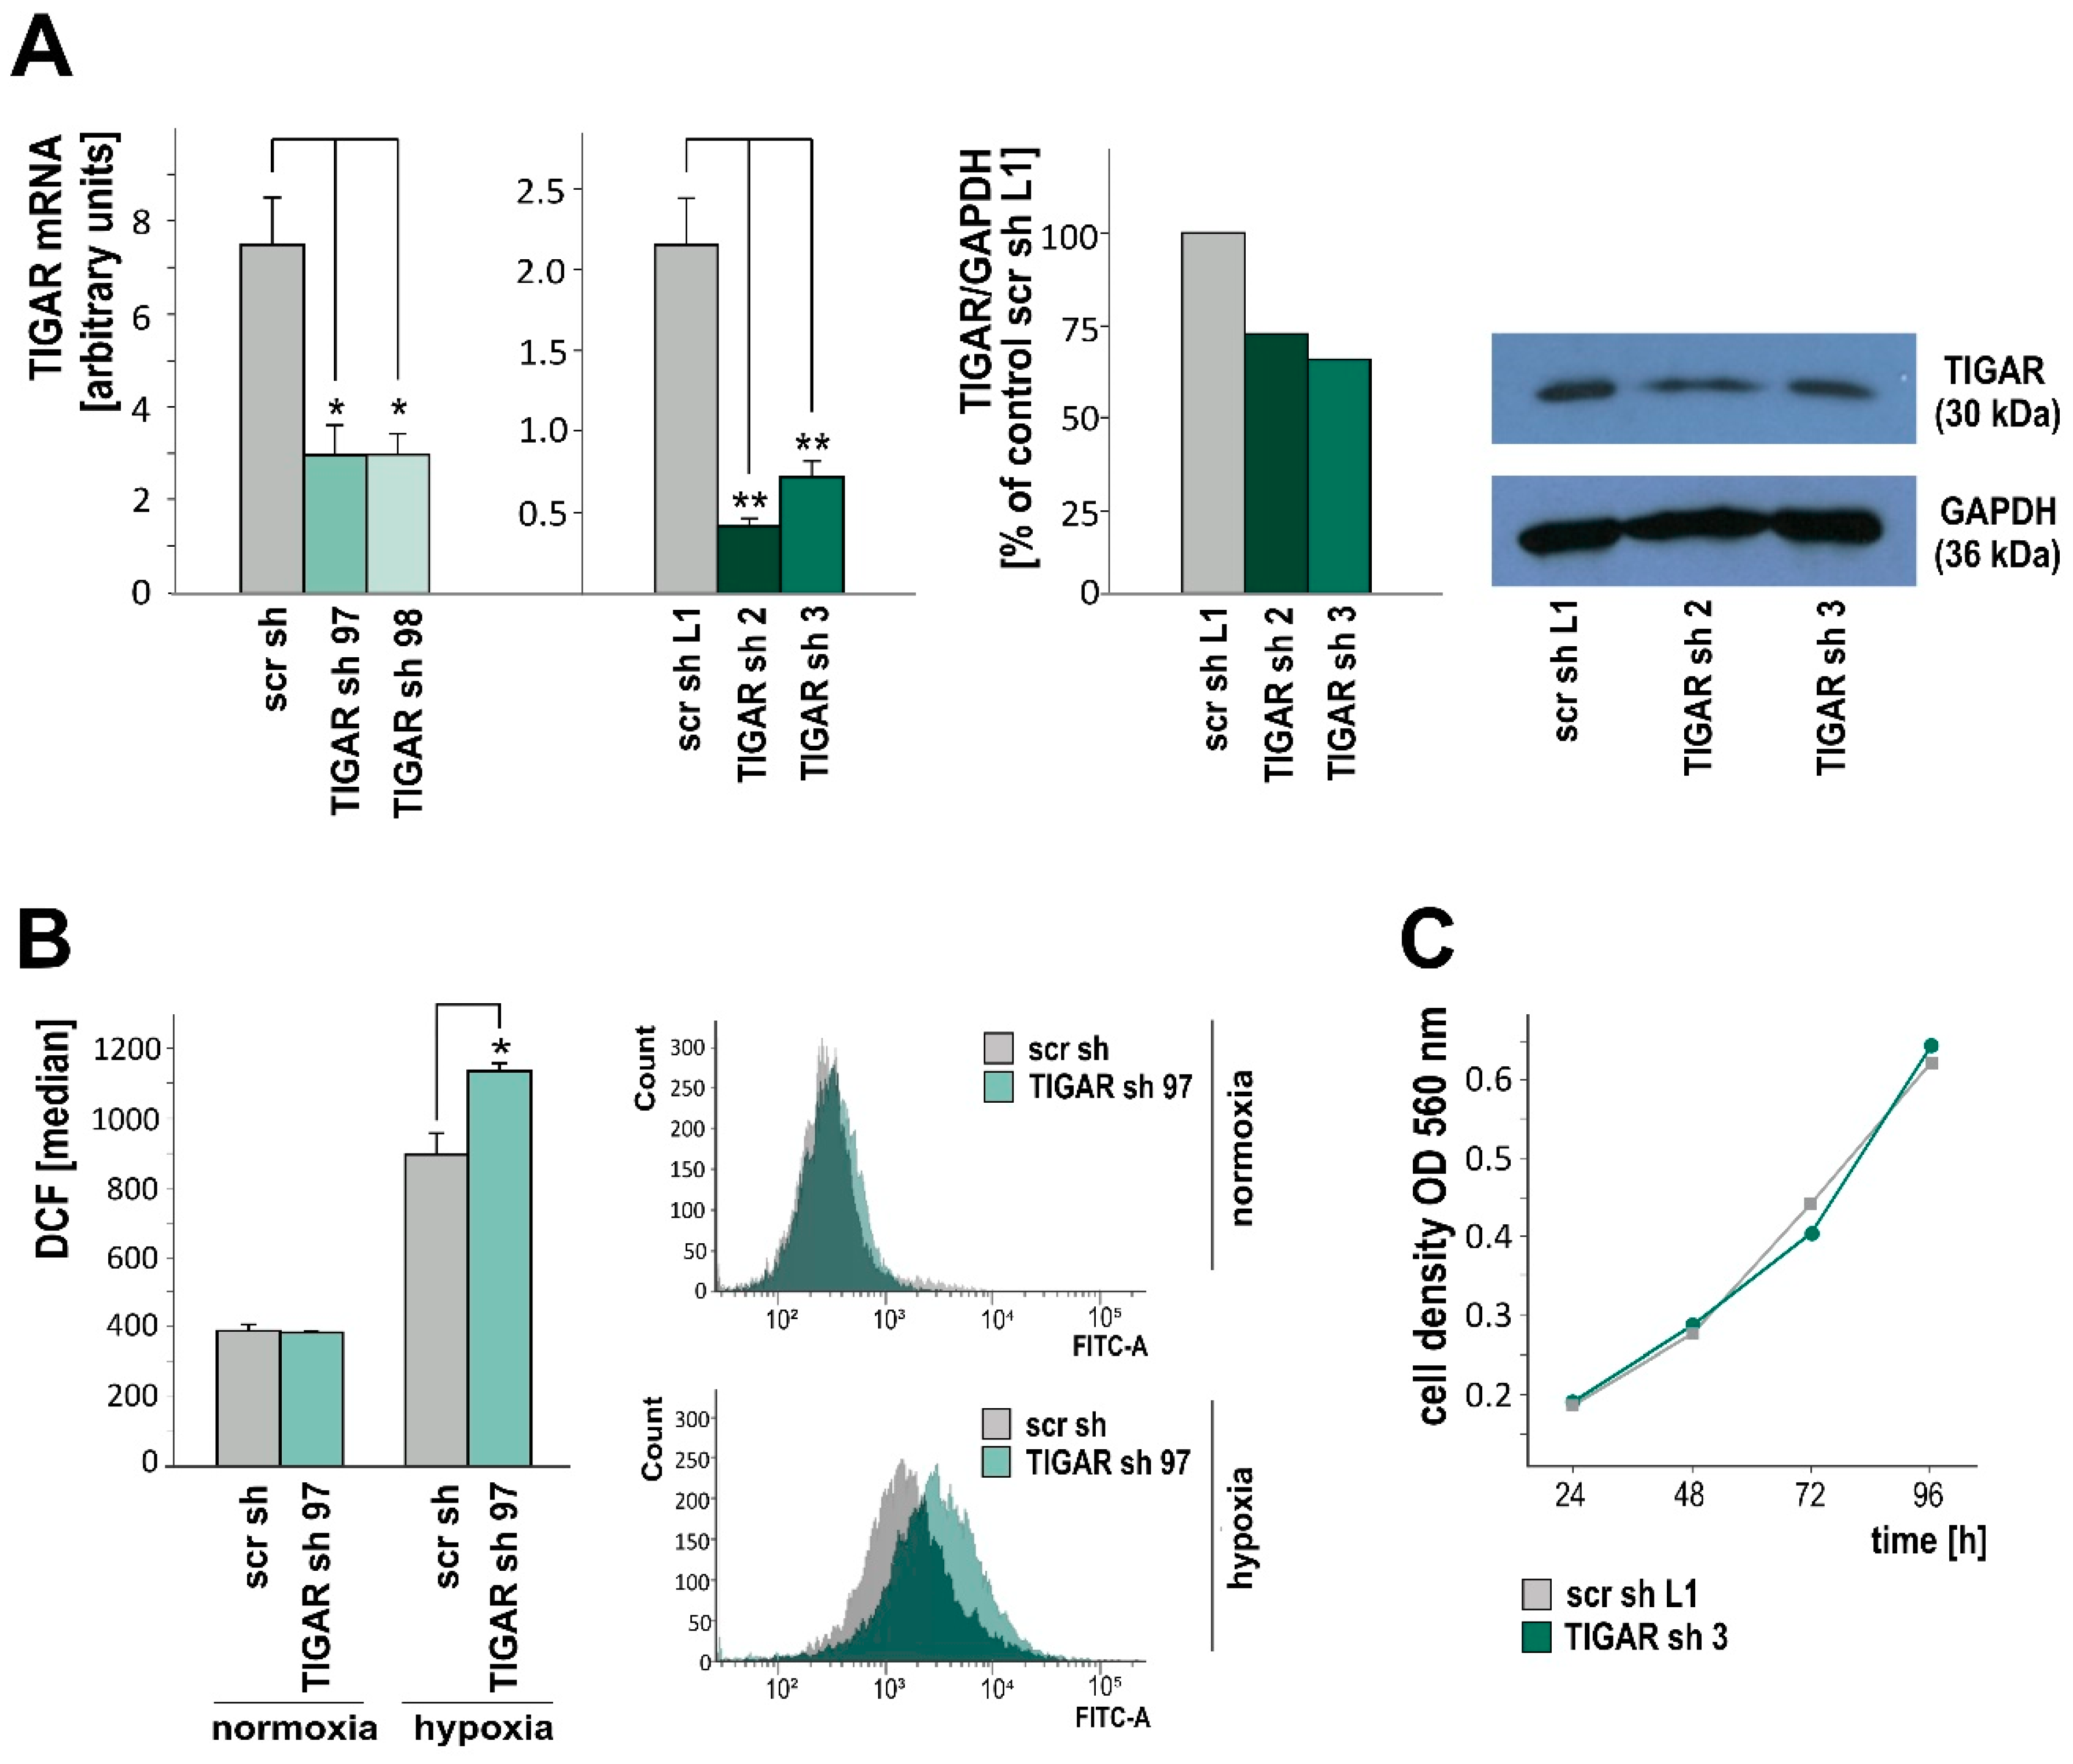
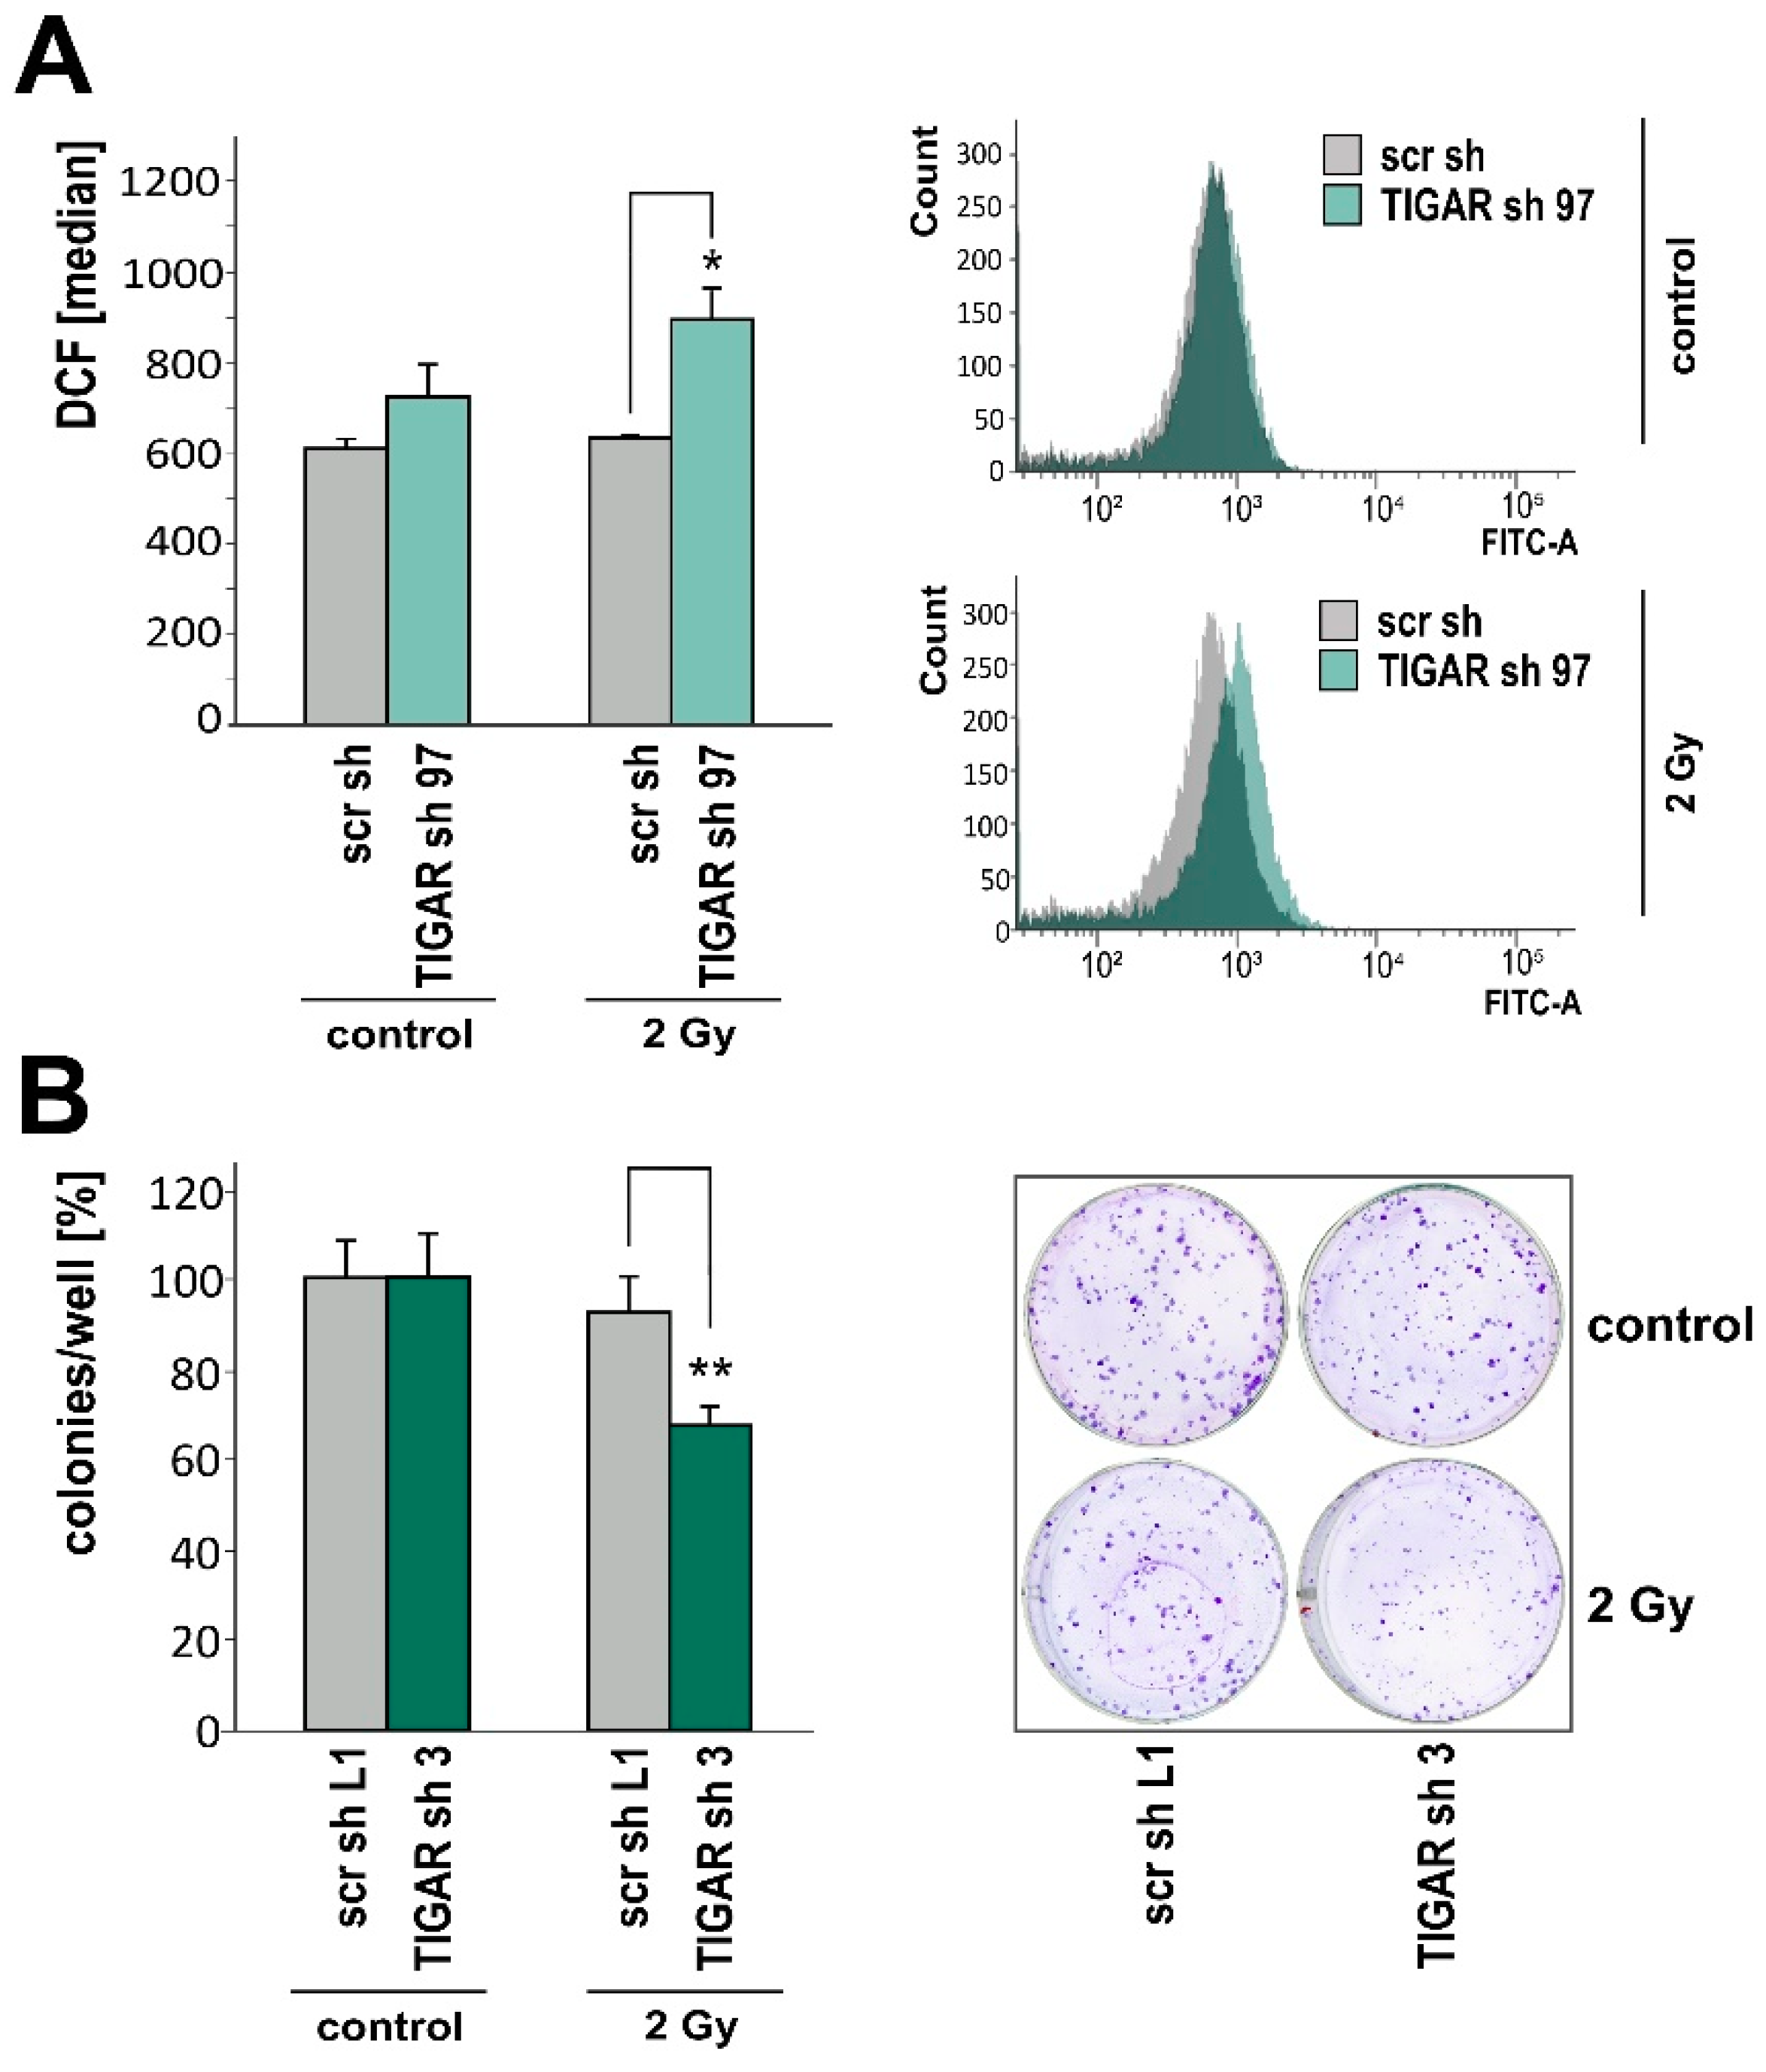
2.2. TIGAR Knockdown Involves Higher ROS Levels in Hypoxia
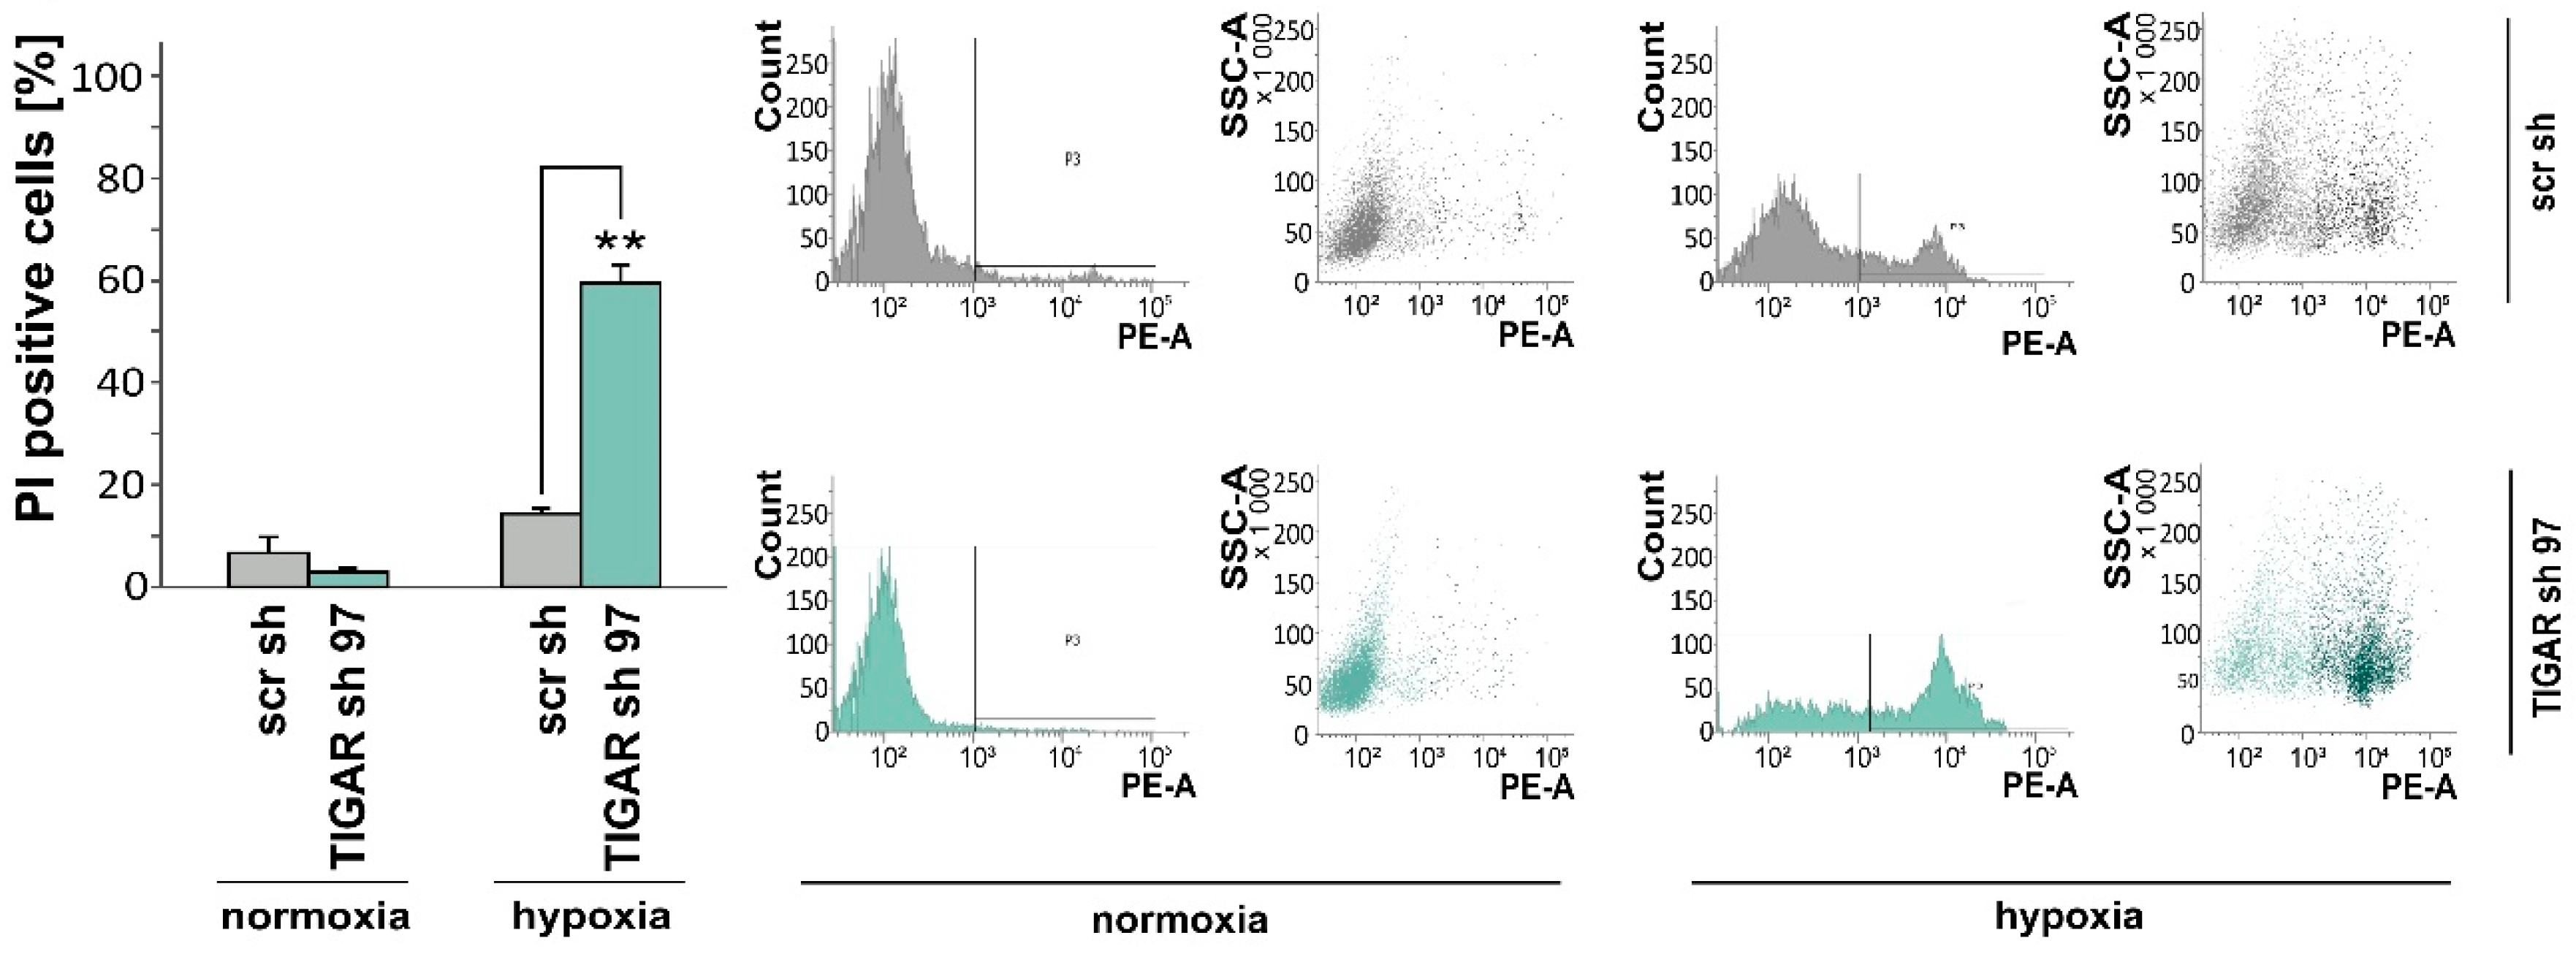
2.3. TIGAR Gene Silencing Enhances Cell Death Associated with Oxygen Restriction
2.4. TIGAR Knockdown Increases Vulnerability to Ionizing Radiation
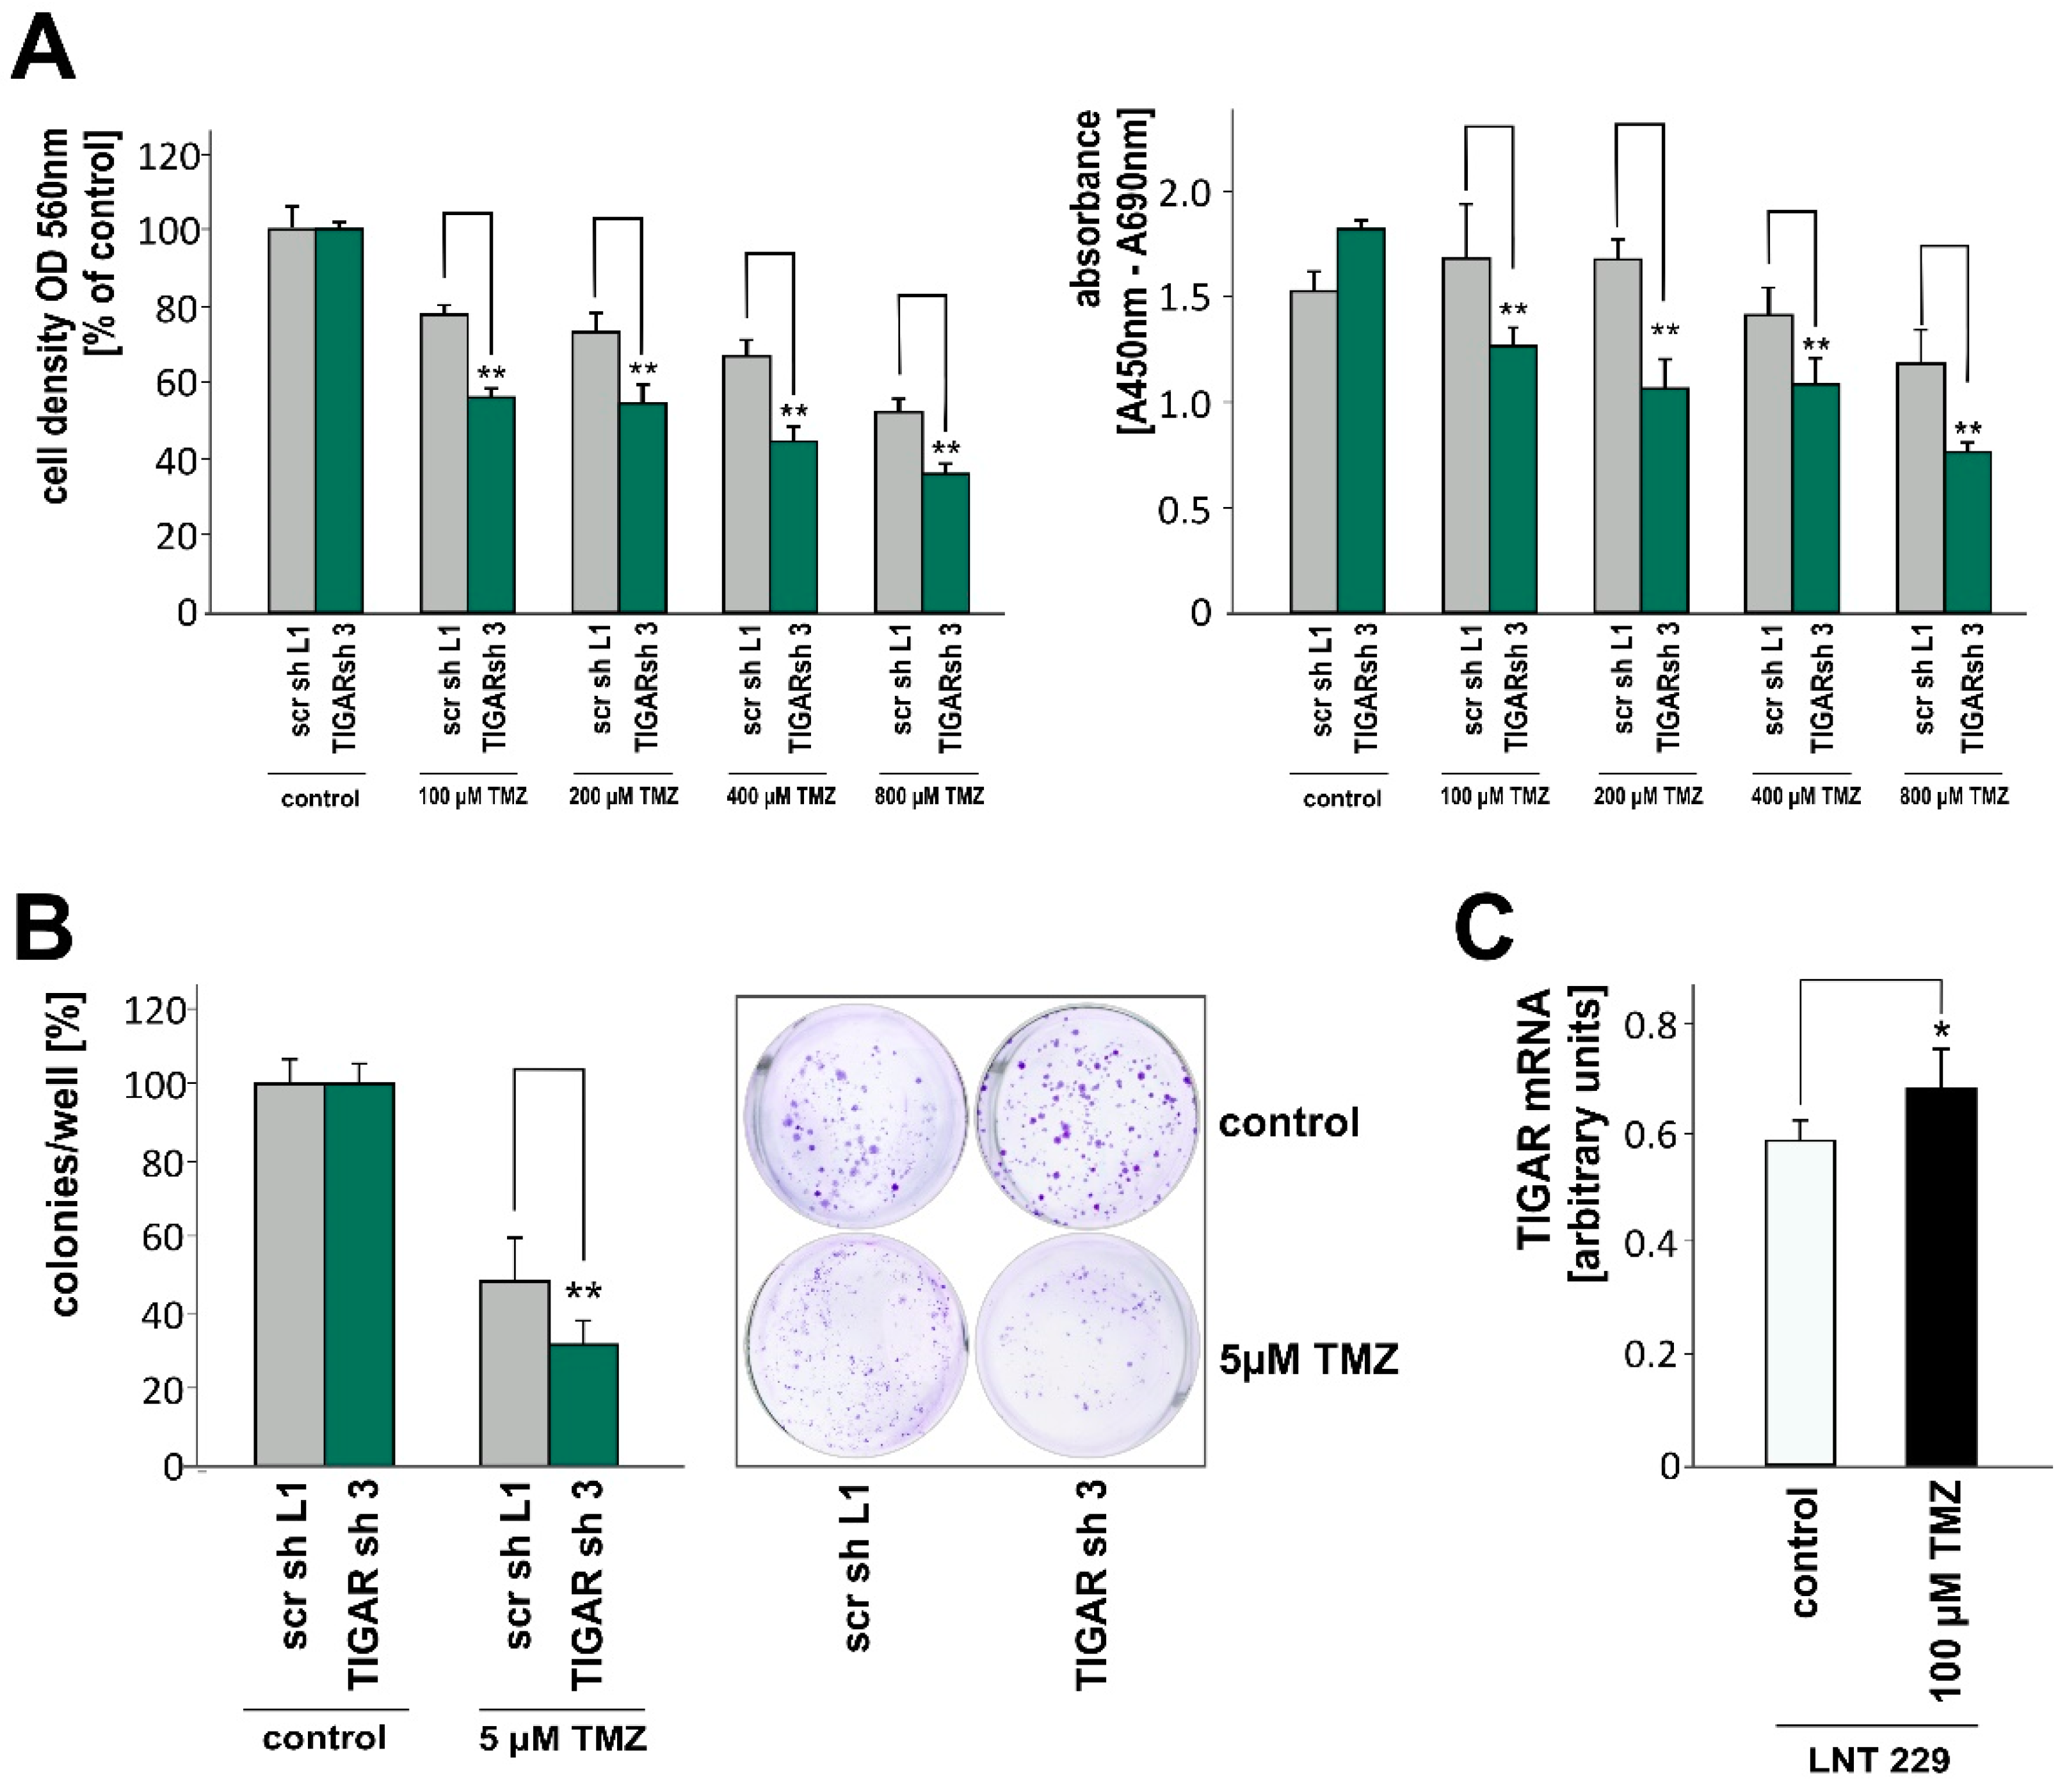
2.5. TIGAR Depletion Boosts the Effects of Temozolomide on Cell Density and Clonogenicity
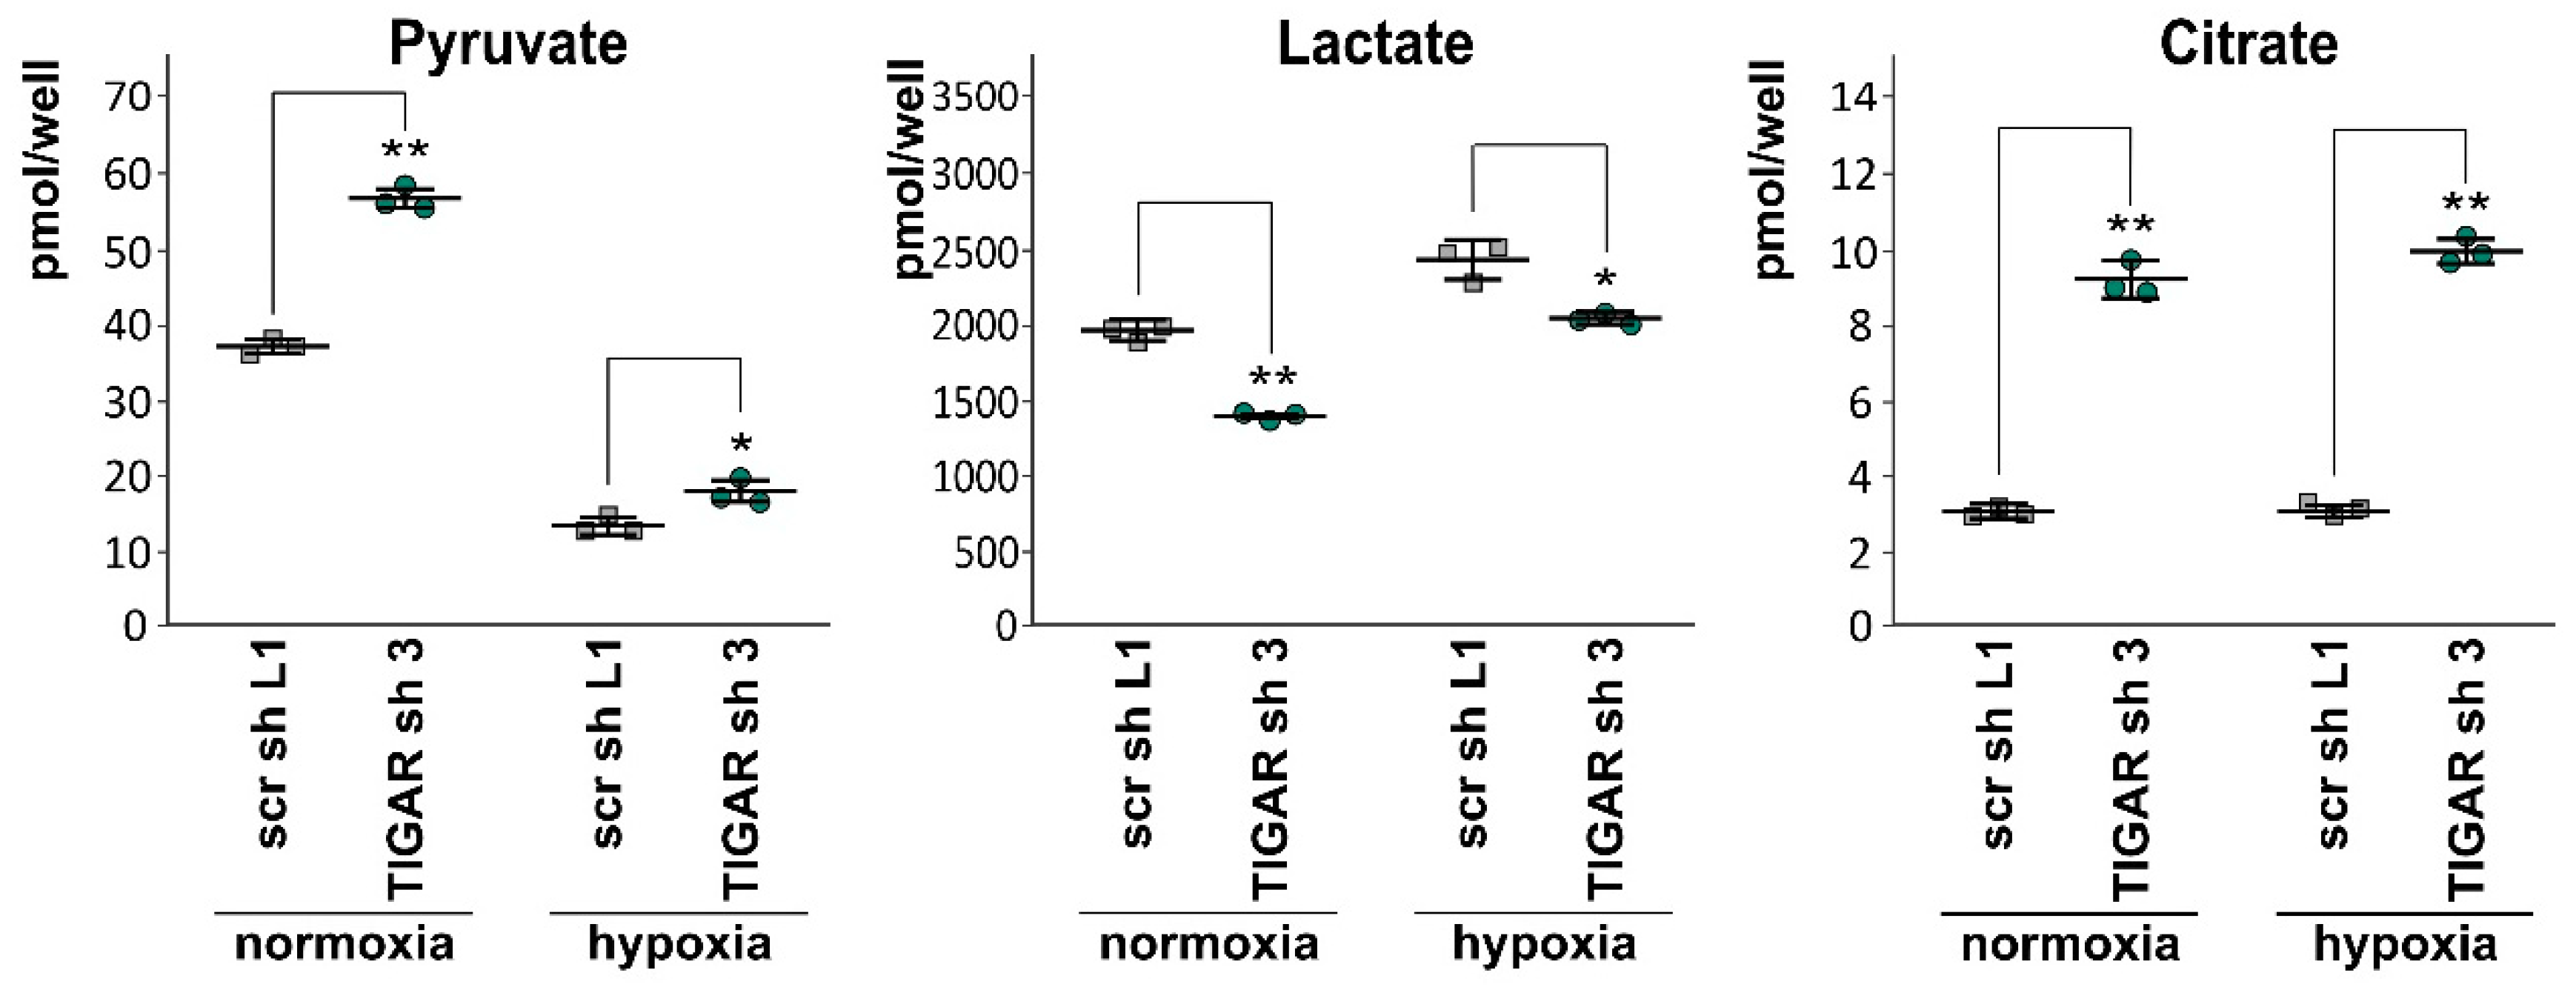
2.6. Attenuation of TIGAR is Accompanied by Metabolic Changes
3. Discussion
4. Materials and Methods
4.1. Reagents, Cell Lines and Culture Conditions
4.2. SDS-PAGE and Immunoblotting
4.3. Real-Time Quantitative PCR (RT-qPCR)
4.4. ROS Analysis
4.5. Growth and Viability Assays
4.6. Luciferase Reporter Assay
4.7. Measurement of Extracellular Levels of Pyruvate, Lactate and Citrate
4.8. Statistics
Author Contributions
Funding
Acknowledgments
Conflicts of Interest
References
- Verhaak, R.G.W.; Hoadley, K.A.; Purdom, E.; Wang, V.; Qi, Y.; Wilkerson, M.D.; Miller, C.R.; Ding, L.; Golub, T.; Mesirov, J.P.; et al. Integrated genomic analysis identifies clinically relevant subtypes of glioblastoma characterized by abnormalities in PDGFRA, IDH1, EGFR, and NF1. Cancer Cell 2010, 17, 98–110. [Google Scholar] [CrossRef] [PubMed]
- Brennan, C.W.; Verhaak, R.G.W.; McKenna, A.; Campos, B.; Noushmehr, H.; Salama, S.R.; Zheng, S.; Chakravarty, D.; Sanborn, J.Z.; Berman, S.H.; et al. The somatic genomic landscape of glioblastoma. Cell 2013, 155, 462–477. [Google Scholar] [CrossRef] [PubMed]
- Carro, M.S.; Lim, W.K.; Alvarez, M.J.; Bollo, R.J.; Zhao, X.; Snyder, E.Y.; Sulman, E.P.; Anne, S.L.; Doetsch, F.; Colman, H.; et al. The transcriptional network for mesenchymal transformation of brain tumours. Nature 2010, 463, 318–325. [Google Scholar] [CrossRef] [PubMed]
- Phillips, H.S.; Kharbanda, S.; Chen, R.; Forrest, W.F.; Soriano, R.H.; Wu, T.D.; Misra, A.; Nigro, J.M.; Colman, H.; Soroceanu, L.; et al. Molecular subclasses of high-grade glioma predict prognosis, delineate a pattern of disease progression, and resemble stages in neurogenesis. Cancer Cell 2006, 9, 157–173. [Google Scholar] [CrossRef] [PubMed] [Green Version]
- McGillicuddy, L.T.; Fromm, J.A.; Hollstein, P.E.; Kubek, S.; Beroukhim, R.; De Raedt, T.; Johnson, B.W.; Williams, S.M.G.; Nghiemphu, P.; Liau, L.M.; et al. Proteasomal and genetic inactivation of the NF1 tumor suppressor in gliomagenesis. Cancer Cell 2009, 16, 44–54. [Google Scholar] [CrossRef] [PubMed]
- Li, H.; Jogl, G. Structural and biochemical studies of TIGAR (TP53-induced glycolysis and apoptosis regulator). J. Biol. Chem. 2009, 284, 1748–1754. [Google Scholar] [CrossRef] [PubMed]
- Gerin, I.; Noël, G.; Bolsée, J.; Haumont, O.; Van Schaftingen, E.; Bommer, G.T. Identification of TP53-induced glycolysis and apoptosis regulator (TIGAR) as the phosphoglycolate-independent 2,3-bisphosphoglycerate phosphatase. Biochem. J. 2014, 458, 439–448. [Google Scholar] [CrossRef] [PubMed]
- Bensaad, K.; Tsuruta, A.; Selak, M.A.; Vidal, M.N.C.; Nakano, K.; Bartrons, R.; Gottlieb, E.; Vousden, K.H. TIGAR, a p53-inducible regulator of glycolysis and apoptosis. Cell 2006, 126, 107–120. [Google Scholar] [CrossRef] [PubMed]
- Hong, M.; Xia, Y.; Zhu, Y.; Zhao, H.-H.; Zhu, H.; Xie, Y.; Fan, L.; Wang, L.; Miao, K.-R.; Yu, H.; et al. TP53-induced glycolysis and apoptosis regulator protects from spontaneous apoptosis and predicts poor prognosis in chronic lymphocytic leukemia. Leuk. Res. 2016, 50, 72–77. [Google Scholar] [CrossRef] [PubMed]
- Qian, S.; Li, J.; Hong, M.; Zhu, Y.; Zhao, H.; Xie, Y.; Huang, J.; Lian, Y.; Li, Y.; Wang, S.; et al. TIGAR cooperated with glycolysis to inhibit the apoptosis of leukemia cells and associated with poor prognosis in patients with cytogenetically normal acute myeloid leukemia. J. Hematol. Oncol. 2016, 9, 128. [Google Scholar] [CrossRef] [PubMed] [Green Version]
- Liu, J.; Lu, F.; Gong, Y.; Zhao, C.; Pan, Q.; Ballantyne, S.; Zhao, X.; Tian, S.; Chen, H. High expression of synthesis of cytochrome c oxidase 2 and TP53-induced glycolysis and apoptosis regulator can predict poor prognosis in human lung adenocarcinoma. Hum. Pathol. 2018, 77, 54–62. [Google Scholar] [CrossRef] [PubMed]
- Peña-Rico, M.A.; Calvo-Vidal, M.N.; Villalonga-Planells, R.; Martínez-Soler, F.; Giménez-Bonafé, P.; Navarro-Sabaté, À.; Tortosa, A.; Bartrons, R.; Manzano, A. TP53 induced glycolysis and apoptosis regulator (TIGAR) knockdown results in radiosensitization of glioma cells. Radiother. Oncol. 2011, 101, 132–139. [Google Scholar] [CrossRef] [PubMed] [Green Version]
- Zhang, H.; Gu, C.; Yu, J.; Wang, Z.; Yuan, X.; Yang, L.; Wang, J.; Jia, Y.; Liu, J.; Liu, F. Radiosensitization of glioma cells by TP53-induced glycolysis and apoptosis regulator knockdown is dependent on thioredoxin-1 nuclear translocation. Free Radic. Biol. Med. 2014, 69, 239–248. [Google Scholar] [CrossRef] [PubMed]
- Zhang, Y.; Chen, F.; Tai, G.; Wang, J.; Shang, J.; Zhang, B.; Wang, P.; Huang, B.; Du, J.; Yu, J.; et al. TIGAR knockdown radiosensitizes TrxR1-overexpressing glioma in vitro and in vivo via inhibiting Trx1 nuclear transport. Sci. Rep. 2017, 7, 42928. [Google Scholar] [CrossRef] [PubMed] [Green Version]
- Xie, J.-M.; Li, B.; Yu, H.-P.; Gao, Q.-G.; Li, W.; Wu, H.-R.; Qin, Z.-H. TIGAR has a dual role in cancer cell survival through regulating apoptosis and autophagy. Cancer Res. 2014, 74, 5127–5138. [Google Scholar] [CrossRef] [PubMed]
- Zhang, T.; Yu, X.; Miao, P.; Zhao, X.; Huang, G.; Liu, J. Inhibition of TIGAR expression can increase the sensitivity to chemotherapy in A549 non-small cell lung cancer cells. Tumor 2014, 34, 303–309. [Google Scholar]
- Wanka, C.; Steinbach, J.P.; Rieger, J. Tp53-induced glycolysis and apoptosis regulator (TIGAR) protects glioma cells from starvation-induced cell death by up-regulating respiration and improving cellular redox homeostasis. J. Biol. Chem. 2012, 287, 33436–33446. [Google Scholar] [CrossRef] [PubMed]
- Oliva, C.R.; Moellering, D.R.; Gillespie, G.Y.; Griguer, C.E. Acquisition of chemoresistance in gliomas is associated with increased mitochondrial coupling and decreased ROS production. PLoS ONE 2011, 6, e24665. [Google Scholar] [CrossRef] [PubMed]
- Barker, H.E.; Paget, J.T.E.; Khan, A.A.; Harrington, K.J. The tumour microenvironment after radiotherapy: Mechanisms of resistance and recurrence. Nat. Rev. Cancer 2015, 15, 409–425. [Google Scholar] [CrossRef] [PubMed]
- Colwell, N.; Larion, M.; Giles, A.J.; Seldomridge, A.N.; Sizdahkhani, S.; Gilbert, M.R.; Park, D.M. Hypoxia in the glioblastoma microenvironment: Shaping the phenotype of cancer stem-like cells. Neuro-Oncology 2017, 19, 887–896. [Google Scholar] [CrossRef] [PubMed]
- McKeown, S.R. Defining normoxia, physoxia and hypoxia in tumours-implications for treatment response. Br. J. Radiol. 2014, 87, 20130676. [Google Scholar] [CrossRef] [PubMed]
- Schieber, M.; Chandel, N.S. ROS Function in Redox Signaling and Oxidative Stress. Curr. Biol. 2014, 24, R453–R462. [Google Scholar] [CrossRef] [PubMed] [Green Version]
- Moloney, J.N.; Cotter, T.G. ROS signalling in the biology of cancer. Semin. Cell Dev. Biol. 2018, 80, 50–64. [Google Scholar] [CrossRef] [PubMed]
- Tafani, M.; Sansone, L.; Limana, F.; Arcangeli, T.; De Santis, E.; Polese, M.; Fini, M.; Russo, M.A. The Interplay of Reactive Oxygen Species, Hypoxia, Inflammation, and Sirtuins in Cancer Initiation and Progression. Oxid. Med. Cell. Longev. 2016, 2016, 1–18. [Google Scholar] [CrossRef] [PubMed]
- Chandel, N.S.; Maltepe, E.; Goldwasser, E.; Mathieu, C.E.; Simon, M.C.; Schumacker, P.T. Mitochondrial reactive oxygen species trigger hypoxia-induced transcription. Proc. Natl. Acad. Sci. USA 1998, 95, 11715–11720. [Google Scholar] [CrossRef] [PubMed] [Green Version]
- Humpton, T.J.; Vousden, K.H. Regulation of Cellular Metabolism and Hypoxia by p53. Cold Spring Harb. Perspect. Med. 2016, 6, a026146. [Google Scholar] [CrossRef] [PubMed]
- Province, P.; Griguer, C.E.; Han, X.; Louis, N.; Fathallah, H. Hypoxia, Angiogenesis and Mechanisms for Invasion of Malignant Gliomas. In Evolution of the Molecular Biology of Brain Tumors and the Therapeutic Implications; Lichtor, T., Ed.; InTech: London, UK, 2013; ISBN 978-953-51-0989-1. [Google Scholar] [Green Version]
- Dayal, R.; Singh, A.; Pandey, A.; Mishra, K.P. Reactive oxygen species as mediator of tumor radiosensitivity. J. Cancer Res. Ther. 2014, 10, 811–818. [Google Scholar] [PubMed]
- Diehn, M.; Cho, R.W.; Lobo, N.A.; Kalisky, T.; Dorie, M.J.; Kulp, A.N.; Qian, D.; Lam, J.S.; Ailles, L.E.; Wong, M.; et al. Association of reactive oxygen species levels and radioresistance in cancer stem cells. Nature 2009, 458, 780–783. [Google Scholar] [CrossRef] [PubMed] [Green Version]
- Stupp, R.; Mason, W.P.; van den Bent, M.J.; Weller, M.; Fisher, B.; Taphoorn, M.J.B.; Belanger, K.; Brandes, A.A.; Marosi, C.; Bogdahn, U.; et al. Radiotherapy plus concomitant and adjuvant temozolomide for glioblastoma. N. Engl. J. Med. 2005, 352, 987–996. [Google Scholar] [CrossRef] [PubMed]
- Lin, C.-J.; Lee, C.-C.; Shih, Y.-L.; Lin, T.-Y.; Wang, S.-H.; Lin, Y.-F.; Shih, C.-M. Resveratrol enhances the therapeutic effect of temozolomide against malignant glioma in vitro and in vivo by inhibiting autophagy. Free Radic. Biol. Med. 2012, 52, 377–391. [Google Scholar] [CrossRef] [PubMed]
- Yin, H.; Zhou, Y.; Wen, C.; Zhou, C.; Zhang, W.; Hu, X.; Wang, L.; You, C.; Shao, J. Curcumin sensitizes glioblastoma to temozolomide by simultaneously generating ROS and disrupting AKT/mTOR signaling. Oncol. Rep. 2014, 32, 1610–1616. [Google Scholar] [CrossRef] [PubMed]
- Josephy, P.D.; Mannervik, B. Molecular Toxicology, 2nd ed.; Oxford University Press: Oxford, UK; New York, NY, USA, 2006; ISBN 978-0-19-517620-9. [Google Scholar]
- Ko, Y.-H.; Domingo-Vidal, M.; Roche, M.; Lin, Z.; Whitaker-Menezes, D.; Seifert, E.; Capparelli, C.; Tuluc, M.; Birbe, R.C.; Tassone, P.; et al. TP53-inducible Glycolysis and Apoptosis Regulator (TIGAR) Metabolically Reprograms Carcinoma and Stromal Cells in Breast Cancer. J. Biol. Chem. 2016, 291, 26291–26303. [Google Scholar] [CrossRef] [PubMed]
- Geng, J.; Wei, M.; Yuan, X.; Liu, Z.; Wang, X.; Zhang, D.; Luo, L.; Wu, J.; Guo, W.; Qin, Z.-H. TIGAR regulates mitochondrial functions through SIRT1-PGC1α pathway and translocation of TIGAR into mitochondria in skeletal muscle. FASEB J. 2019. [Google Scholar] [CrossRef] [PubMed]
- Bartrons, R.; Simon-Molas, H.; Rodríguez-García, A.; Castaño, E.; Navarro-Sabaté, À.; Manzano, A.; Martinez-Outschoorn, U.E. Fructose 2,6-Bisphosphate in Cancer Cell Metabolism. Front. Oncol. 2018, 8, 331. [Google Scholar] [CrossRef] [PubMed]
- Cheung, E.C.; Athineos, D.; Lee, P.; Ridgway, R.A.; Lambie, W.; Nixon, C.; Strathdee, D.; Blyth, K.; Sansom, O.J.; Vousden, K.H. TIGAR is required for efficient intestinal regeneration and tumorigenesis. Dev. Cell 2013, 25, 463–477. [Google Scholar] [CrossRef] [PubMed]
- Wong, E.Y.L.; Wong, S.-C.C.; Chan, C.M.L.; Lam, E.K.Y.; Ho, L.Y.; Lau, C.P.Y.; Au, T.C.C.; Chan, A.K.C.; Tsang, C.M.; Tsao, S.W.; et al. TP53-induced glycolysis and apoptosis regulator promotes proliferation and invasiveness of nasopharyngeal carcinoma cells. Oncol. Lett. 2015, 9, 569–574. [Google Scholar] [CrossRef] [PubMed]
- Shen, M.; Zhao, X.; Zhao, L.; Shi, L.; An, S.; Huang, G.; Liu, J. Met is involved in TIGAR-regulated metastasis of non-small-cell lung cancer. Mol. Cancer 2018, 17, 88. [Google Scholar] [CrossRef] [PubMed]
- Mao, Z.; Han, X.; Chen, D.; Xu, Y.; Xu, L.; Yin, L.; Sun, H.; Qi, Y.; Fang, L.; Liu, K.; et al. Potent effects of dioscin against hepatocellular carcinoma through regulating TIGAR-mediated apoptosis, autophagy and DNA damage. Br. J. Pharmacol. 2019. [Google Scholar] [CrossRef] [PubMed]
- Vousden, K.H. p53 pathways and cancer cell metabolism 2018. Presented at the Frankfurt Cancer Conference, Frankfurt, Germany, 26 September 2018. [Google Scholar]
- Lin, L.; Mi, Y.; Li, X.; Peng, C.; Shangguan, Z.; Li, Z.; Liu, S. Higher plasma concentration of TP53-induced glycolysis and apoptosis regulator is associated with a lower risk of colorectal cancer metastasis. Cancer Manag. Res. 2019, 11, 263–272. [Google Scholar] [CrossRef] [PubMed]
- Geng, J.; Yuan, X.; Wei, M.; Wu, J.; Qin, Z.-H. The diverse role of TIGAR in cellular homeostasis and cancer. Free Radic. Res. 2018, 52, 1240–1249. [Google Scholar] [CrossRef] [PubMed]
- Rajendran, R.; Garva, R.; Ashour, H.; Leung, T.; Stratford, I.; Krstic-Demonacos, M.; Demonacos, C. Acetylation mediated by the p300/CBP-associated factor determines cellular energy metabolic pathways in cancer. Int. J. Oncol. 2013, 42, 1961–1972. [Google Scholar] [CrossRef] [PubMed] [Green Version]
- Wang, H.-H.; Chang, T.-Y.; Lin, W.-C.; Wei, K.-C.; Shin, J.-W. GADD45A plays a protective role against temozolomide treatment in glioblastoma cells. Sci. Rep. 2017, 7, 8814. [Google Scholar] [CrossRef] [PubMed] [Green Version]
- Hammond, E.M.; Giaccia, A.J. The role of p53 in hypoxia-induced apoptosis. Biochem. Biophys. Res. Commun. 2005, 331, 718–725. [Google Scholar] [CrossRef] [PubMed]
- Fei, P.; El-Deiry, W.S. P53 and radiation responses. Oncogene 2003, 22, 5774–5783. [Google Scholar] [CrossRef] [PubMed] [Green Version]
- Semenza, G.L. Hydroxylation of HIF-1: Oxygen sensing at the molecular level. Physiology 2004, 19, 176–182. [Google Scholar] [CrossRef] [PubMed]
- Kim, Y.-H.; Yoo, K.-C.; Cui, Y.-H.; Uddin, N.; Lim, E.-J.; Kim, M.-J.; Nam, S.-Y.; Kim, I.-G.; Suh, Y.; Lee, S.-J. Radiation promotes malignant progression of glioma cells through HIF-1alpha stabilization. Cancer Lett. 2014, 354, 132–141. [Google Scholar] [CrossRef] [PubMed]
- Moeller, B.J.; Cao, Y.; Li, C.Y.; Dewhirst, M.W. Radiation activates HIF-1 to regulate vascular radiosensitivity in tumors: Role of reoxygenation, free radicals, and stress granules. Cancer Cell 2004, 5, 429–441. [Google Scholar] [CrossRef]
- Sermeus, A.; Michiels, C. Reciprocal influence of the p53 and the hypoxic pathways. Cell Death Dis. 2011, 2, e164. [Google Scholar] [CrossRef] [PubMed]
- Yu, H.-P.; Xie, J.-M.; Li, B.; Sun, Y.-H.; Gao, Q.-G.; Ding, Z.-H.; Wu, H.-R.; Qin, Z.-H. TIGAR regulates DNA damage and repair through pentosephosphate pathway and Cdk5-ATM pathway. Sci. Rep. 2015, 5, 9853. [Google Scholar] [CrossRef] [PubMed] [Green Version]
- Turgeon, M.-O.; Perry, N.J.S.; Poulogiannis, G. DNA Damage, Repair, and Cancer Metabolism. Front. Oncol. 2018, 8, 15. [Google Scholar] [CrossRef] [PubMed]
- Uhlen, M.; Zhang, C.; Lee, S.; Sjöstedt, E.; Fagerberg, L.; Bidkhori, G.; Benfeitas, R.; Arif, M.; Liu, Z.; Edfors, F.; et al. A pathology atlas of the human cancer transcriptome. Science 2017, 357, eaan2507. [Google Scholar] [CrossRef] [PubMed]
- Kastenhuber, E.R.; Lowe, S.W. Putting p53 in Context. Cell 2017, 170, 1062–1078. [Google Scholar] [CrossRef] [PubMed]
- Agnihotri, S.; Zadeh, G. Metabolic reprogramming in glioblastoma: The influence of cancer metabolism on epigenetics and unanswered questions. Neuro-Oncology 2016, 18, 160–172. [Google Scholar] [CrossRef] [PubMed]
- Corbet, C.; Feron, O. Tumour acidosis: From the passenger to the driver’s seat. Nat. Rev. Cancer 2017, 17, 577–593. [Google Scholar] [CrossRef] [PubMed]
- Westergaard, N.; Waagepetersen, H.S.; Belhage, B.; Schousboe, A. Citrate, a Ubiquitous Key Metabolite with Regulatory Function in the CNS. Neurochem. Res. 2017, 42, 1583–1588. [Google Scholar] [CrossRef] [PubMed]
- Mycielska, M.E.; Dettmer, K.; Rümmele, P.; Schmidt, K.; Prehn, C.; Milenkovic, V.M.; Jagla, W.; Madej, G.M.; Lantow, M.; Schladt, M.; et al. Extracellular Citrate Affects Critical Elements of Cancer Cell Metabolism and Supports Cancer Development In Vivo. Cancer Res. 2018, 78, 2513–2523. [Google Scholar] [CrossRef] [PubMed]
- Yin, C.; He, D.; Chen, S.; Tan, X.; Sang, N. Exogenous pyruvate facilitates cancer cell adaptation to hypoxia by serving as an oxygen surrogate. Oncotarget 2016, 7, 47494–47510. [Google Scholar] [CrossRef] [PubMed]
- Chen, X.; Song, M.; Zhang, B.; Zhang, Y. Reactive Oxygen Species Regulate T Cell Immune Response in the Tumor Microenvironment. Oxid. Med. Cell. Longev. 2016, 2016, 1580967. [Google Scholar] [CrossRef] [PubMed]
- Henze, A.-T.; Riedel, J.; Diem, T.; Wenner, J.; Flamme, I.; Pouyseggur, J.; Plate, K.H.; Acker, T. Prolyl hydroxylases 2 and 3 act in gliomas as protective negative feedback regulators of hypoxia-inducible factors. Cancer Res. 2010, 70, 357–366. [Google Scholar] [CrossRef] [PubMed]
- Ishii, N.; Maier, D.; Merlo, A.; Tada, M.; Sawamura, Y.; Diserens, A.C.; Van Meir, E.G. Frequent co-alterations of TP53, p16/CDKN2A, p14ARF, PTEN tumor suppressor genes in human glioma cell lines. Brain Pathol. 1999, 9, 469–479. [Google Scholar] [CrossRef] [PubMed]
- Wischhusen, J.; Naumann, U.; Ohgaki, H.; Rastinejad, F.; Weller, M. CP-31398, a novel p53-stabilizing agent, induces p53-dependent and p53-independent glioma cell death. Oncogene 2003, 22, 8233–8245. [Google Scholar] [CrossRef] [PubMed] [Green Version]
- Weinmann, L.; Wischhusen, J.; Demma, M.J.; Naumann, U.; Roth, P.; Dasmahapatra, B.; Weller, M. A novel p53 rescue compound induces p53-dependent growth arrest and sensitises glioma cells to Apo2L/TRAIL-induced apoptosis. Cell Death Differ. 2008, 15, 718–729. [Google Scholar] [CrossRef] [PubMed] [Green Version]
- Schneider, C.A.; Rasband, W.S.; Eliceiri, K.W. NIH Image to ImageJ: 25 years of image analysis. Nat. Methods 2012, 9, 671–675. [Google Scholar] [CrossRef] [PubMed] [Green Version]
- Livak, K.J.; Schmittgen, T.D. Analysis of relative gene expression data using real-time quantitative PCR and the 2(-Delta Delta C(T)) Method. Methods 2001, 25, 402–408. [Google Scholar] [CrossRef] [PubMed]
- Hermisson, M.; Klumpp, A.; Wick, W.; Wischhusen, J.; Nagel, G.; Roos, W.; Kaina, B.; Weller, M. O6-methylguanine DNA methyltransferase and p53 status predict temozolomide sensitivity in human malignant glioma cells. J. Neurochem. 2006, 96, 766–776. [Google Scholar] [CrossRef] [PubMed] [Green Version]
- Berra, E.; Benizri, E.; Ginouvès, A.; Volmat, V.; Roux, D.; Pouysségur, J. HIF prolyl-hydroxylase 2 is the key oxygen sensor setting low steady-state levels of HIF-1alpha in normoxia. EMBO J. 2003, 22, 4082–4090. [Google Scholar] [CrossRef] [PubMed]
- Dyer, B.W.; Ferrer, F.A.; Klinedinst, D.K.; Rodriguez, R. A noncommercial dual luciferase enzyme assay system for reporter gene analysis. Anal. Biochem. 2000, 282, 158–161. [Google Scholar] [CrossRef] [PubMed]
- Hofmann, U.; Maier, K.; Niebel, A.; Vacun, G.; Reuss, M.; Mauch, K. Identification of metabolic fluxes in hepatic cells from transient 13C-labeling experiments: Part I. Experimental observations. Biotechnol. Bioeng. 2008, 100, 344–354. [Google Scholar] [CrossRef] [PubMed]


© 2019 by the authors. Licensee MDPI, Basel, Switzerland. This article is an open access article distributed under the terms and conditions of the Creative Commons Attribution (CC BY) license (http://creativecommons.org/licenses/by/4.0/).
Share and Cite
Maurer, G.D.; Heller, S.; Wanka, C.; Rieger, J.; Steinbach, J.P. Knockdown of the TP53-Induced Glycolysis and Apoptosis Regulator (TIGAR) Sensitizes Glioma Cells to Hypoxia, Irradiation and Temozolomide. Int. J. Mol. Sci. 2019, 20, 1061. https://0-doi-org.brum.beds.ac.uk/10.3390/ijms20051061
Maurer GD, Heller S, Wanka C, Rieger J, Steinbach JP. Knockdown of the TP53-Induced Glycolysis and Apoptosis Regulator (TIGAR) Sensitizes Glioma Cells to Hypoxia, Irradiation and Temozolomide. International Journal of Molecular Sciences. 2019; 20(5):1061. https://0-doi-org.brum.beds.ac.uk/10.3390/ijms20051061
Chicago/Turabian StyleMaurer, Gabriele D., Sonja Heller, Christina Wanka, Johannes Rieger, and Joachim P. Steinbach. 2019. "Knockdown of the TP53-Induced Glycolysis and Apoptosis Regulator (TIGAR) Sensitizes Glioma Cells to Hypoxia, Irradiation and Temozolomide" International Journal of Molecular Sciences 20, no. 5: 1061. https://0-doi-org.brum.beds.ac.uk/10.3390/ijms20051061