Human Multilineage 3D Spheroids as a Model of Liver Steatosis and Fibrosis

 , , and
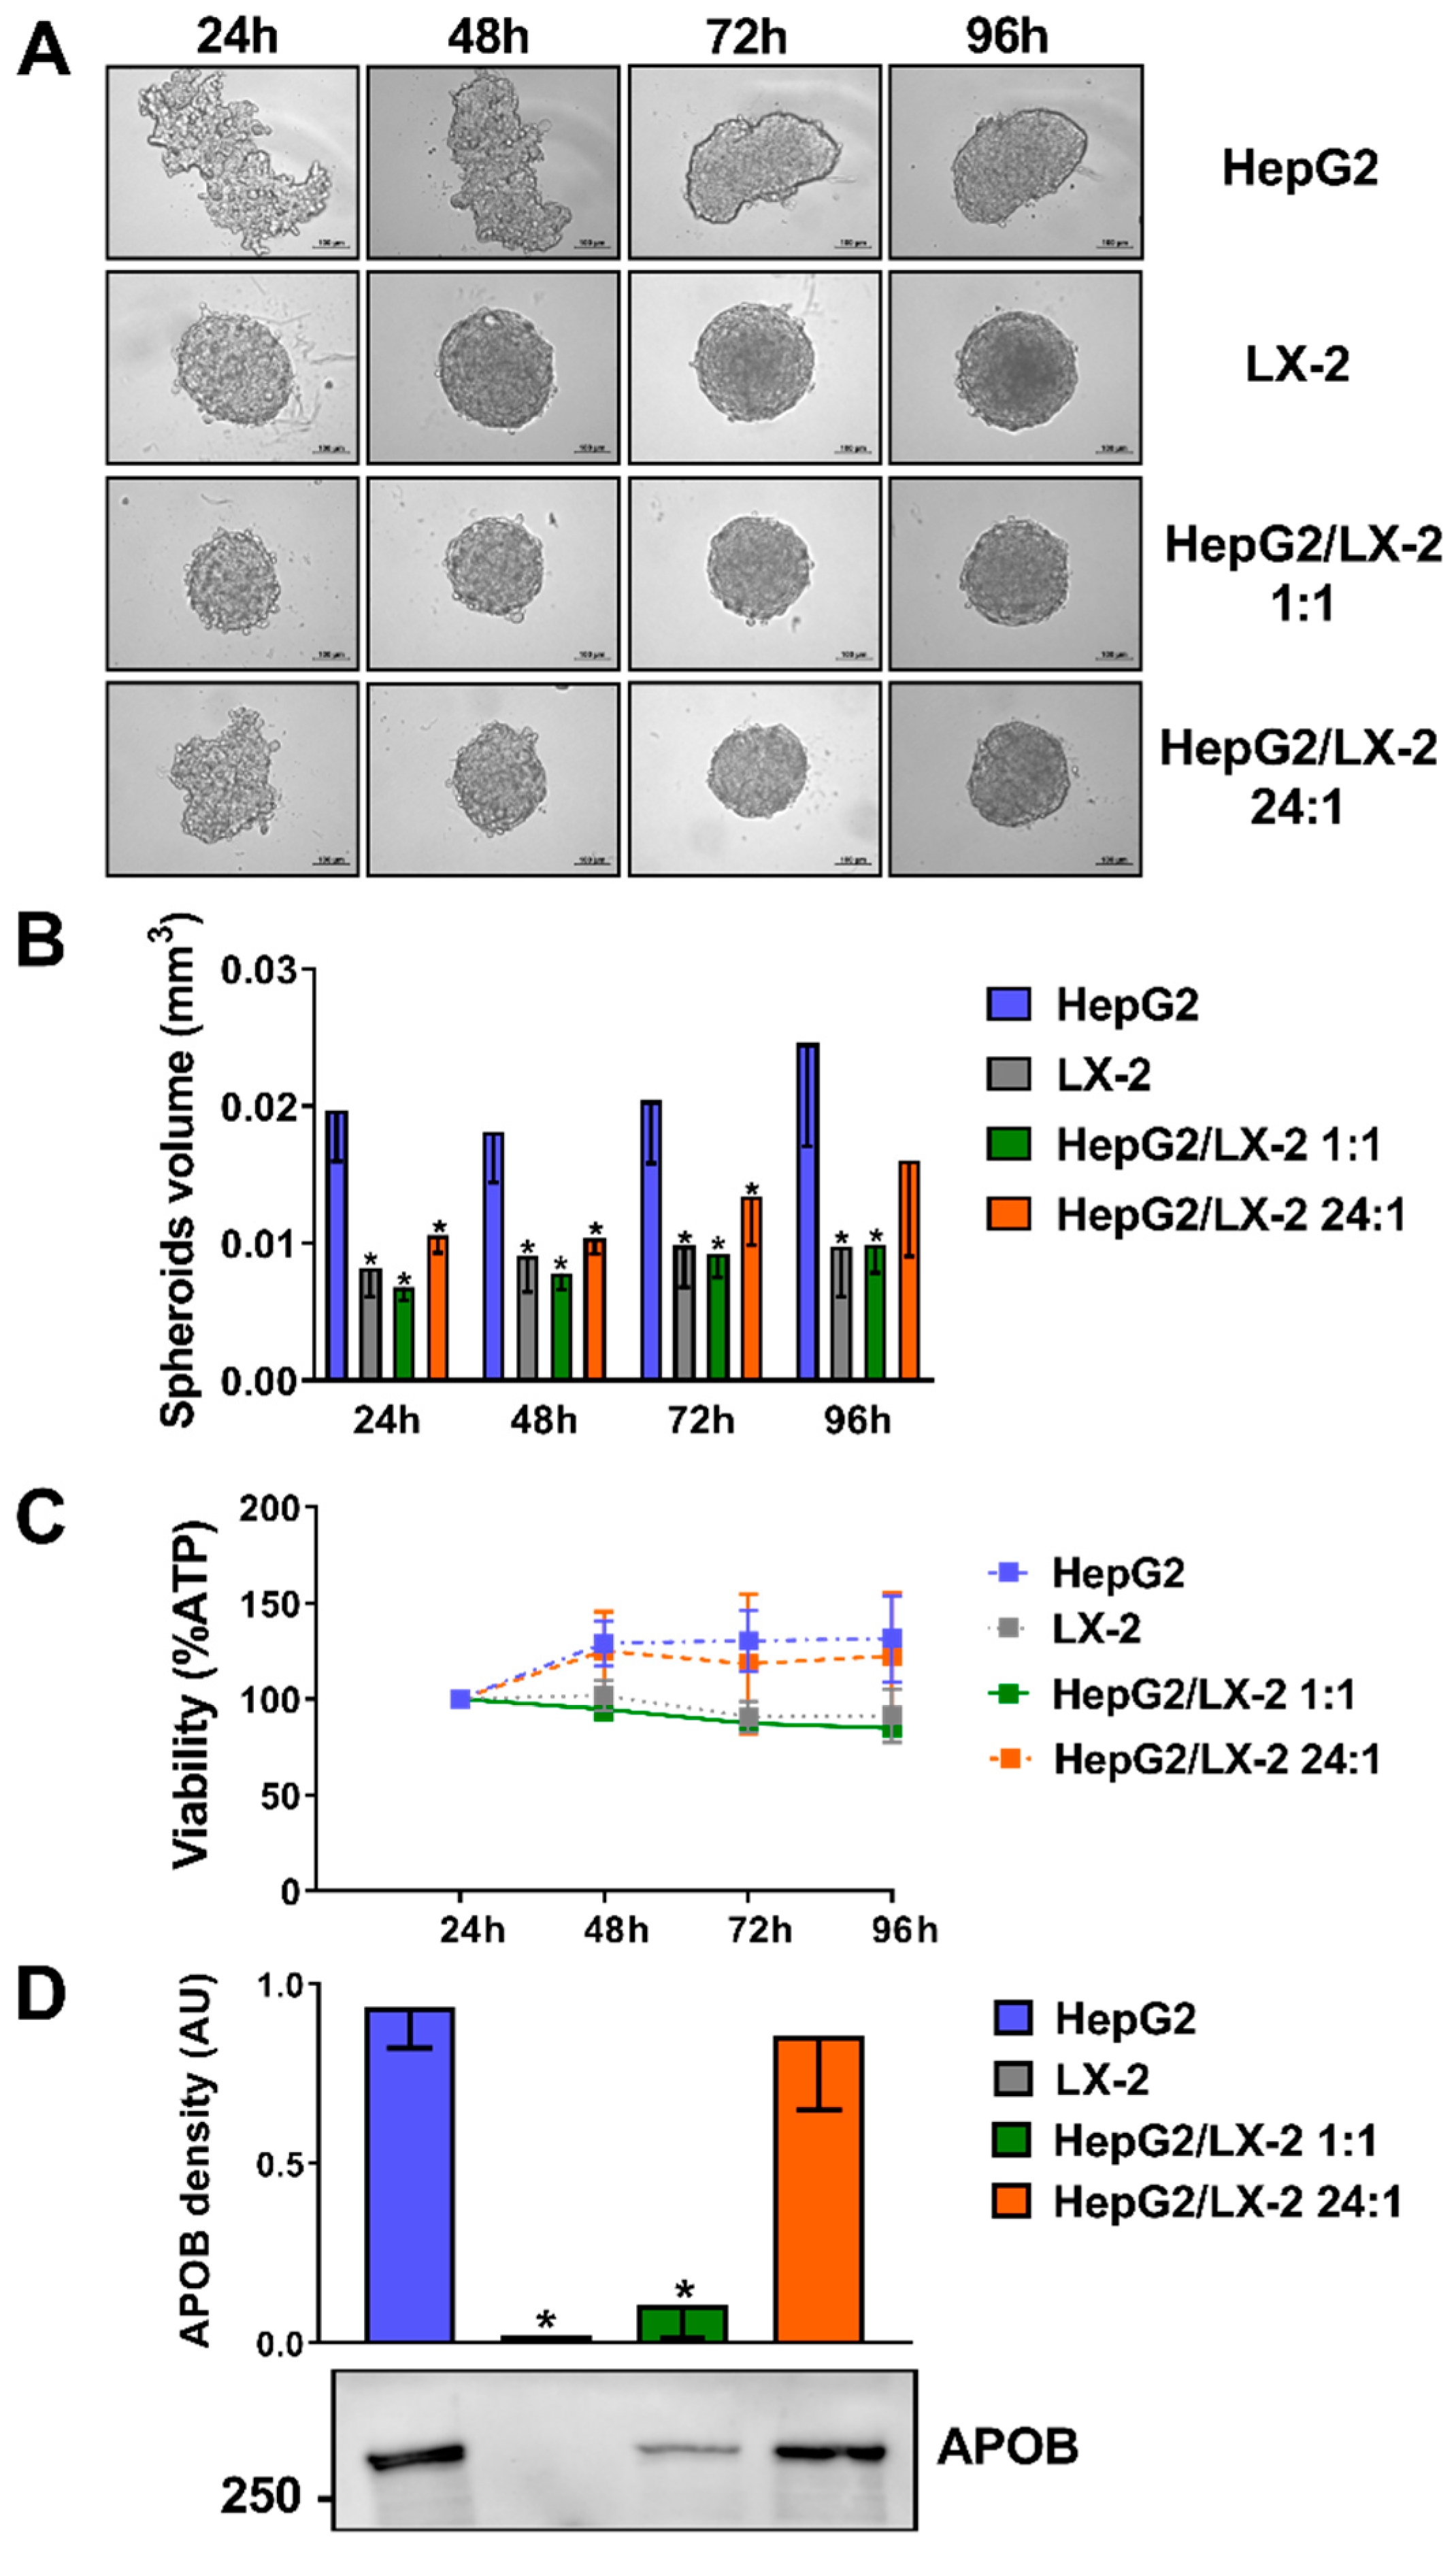
Abstract
:1. Introduction
2. Results
2.1. Co-Culture of HepG2 and LX-2 Cells Facilitates the Compactness of 3D Spheroids
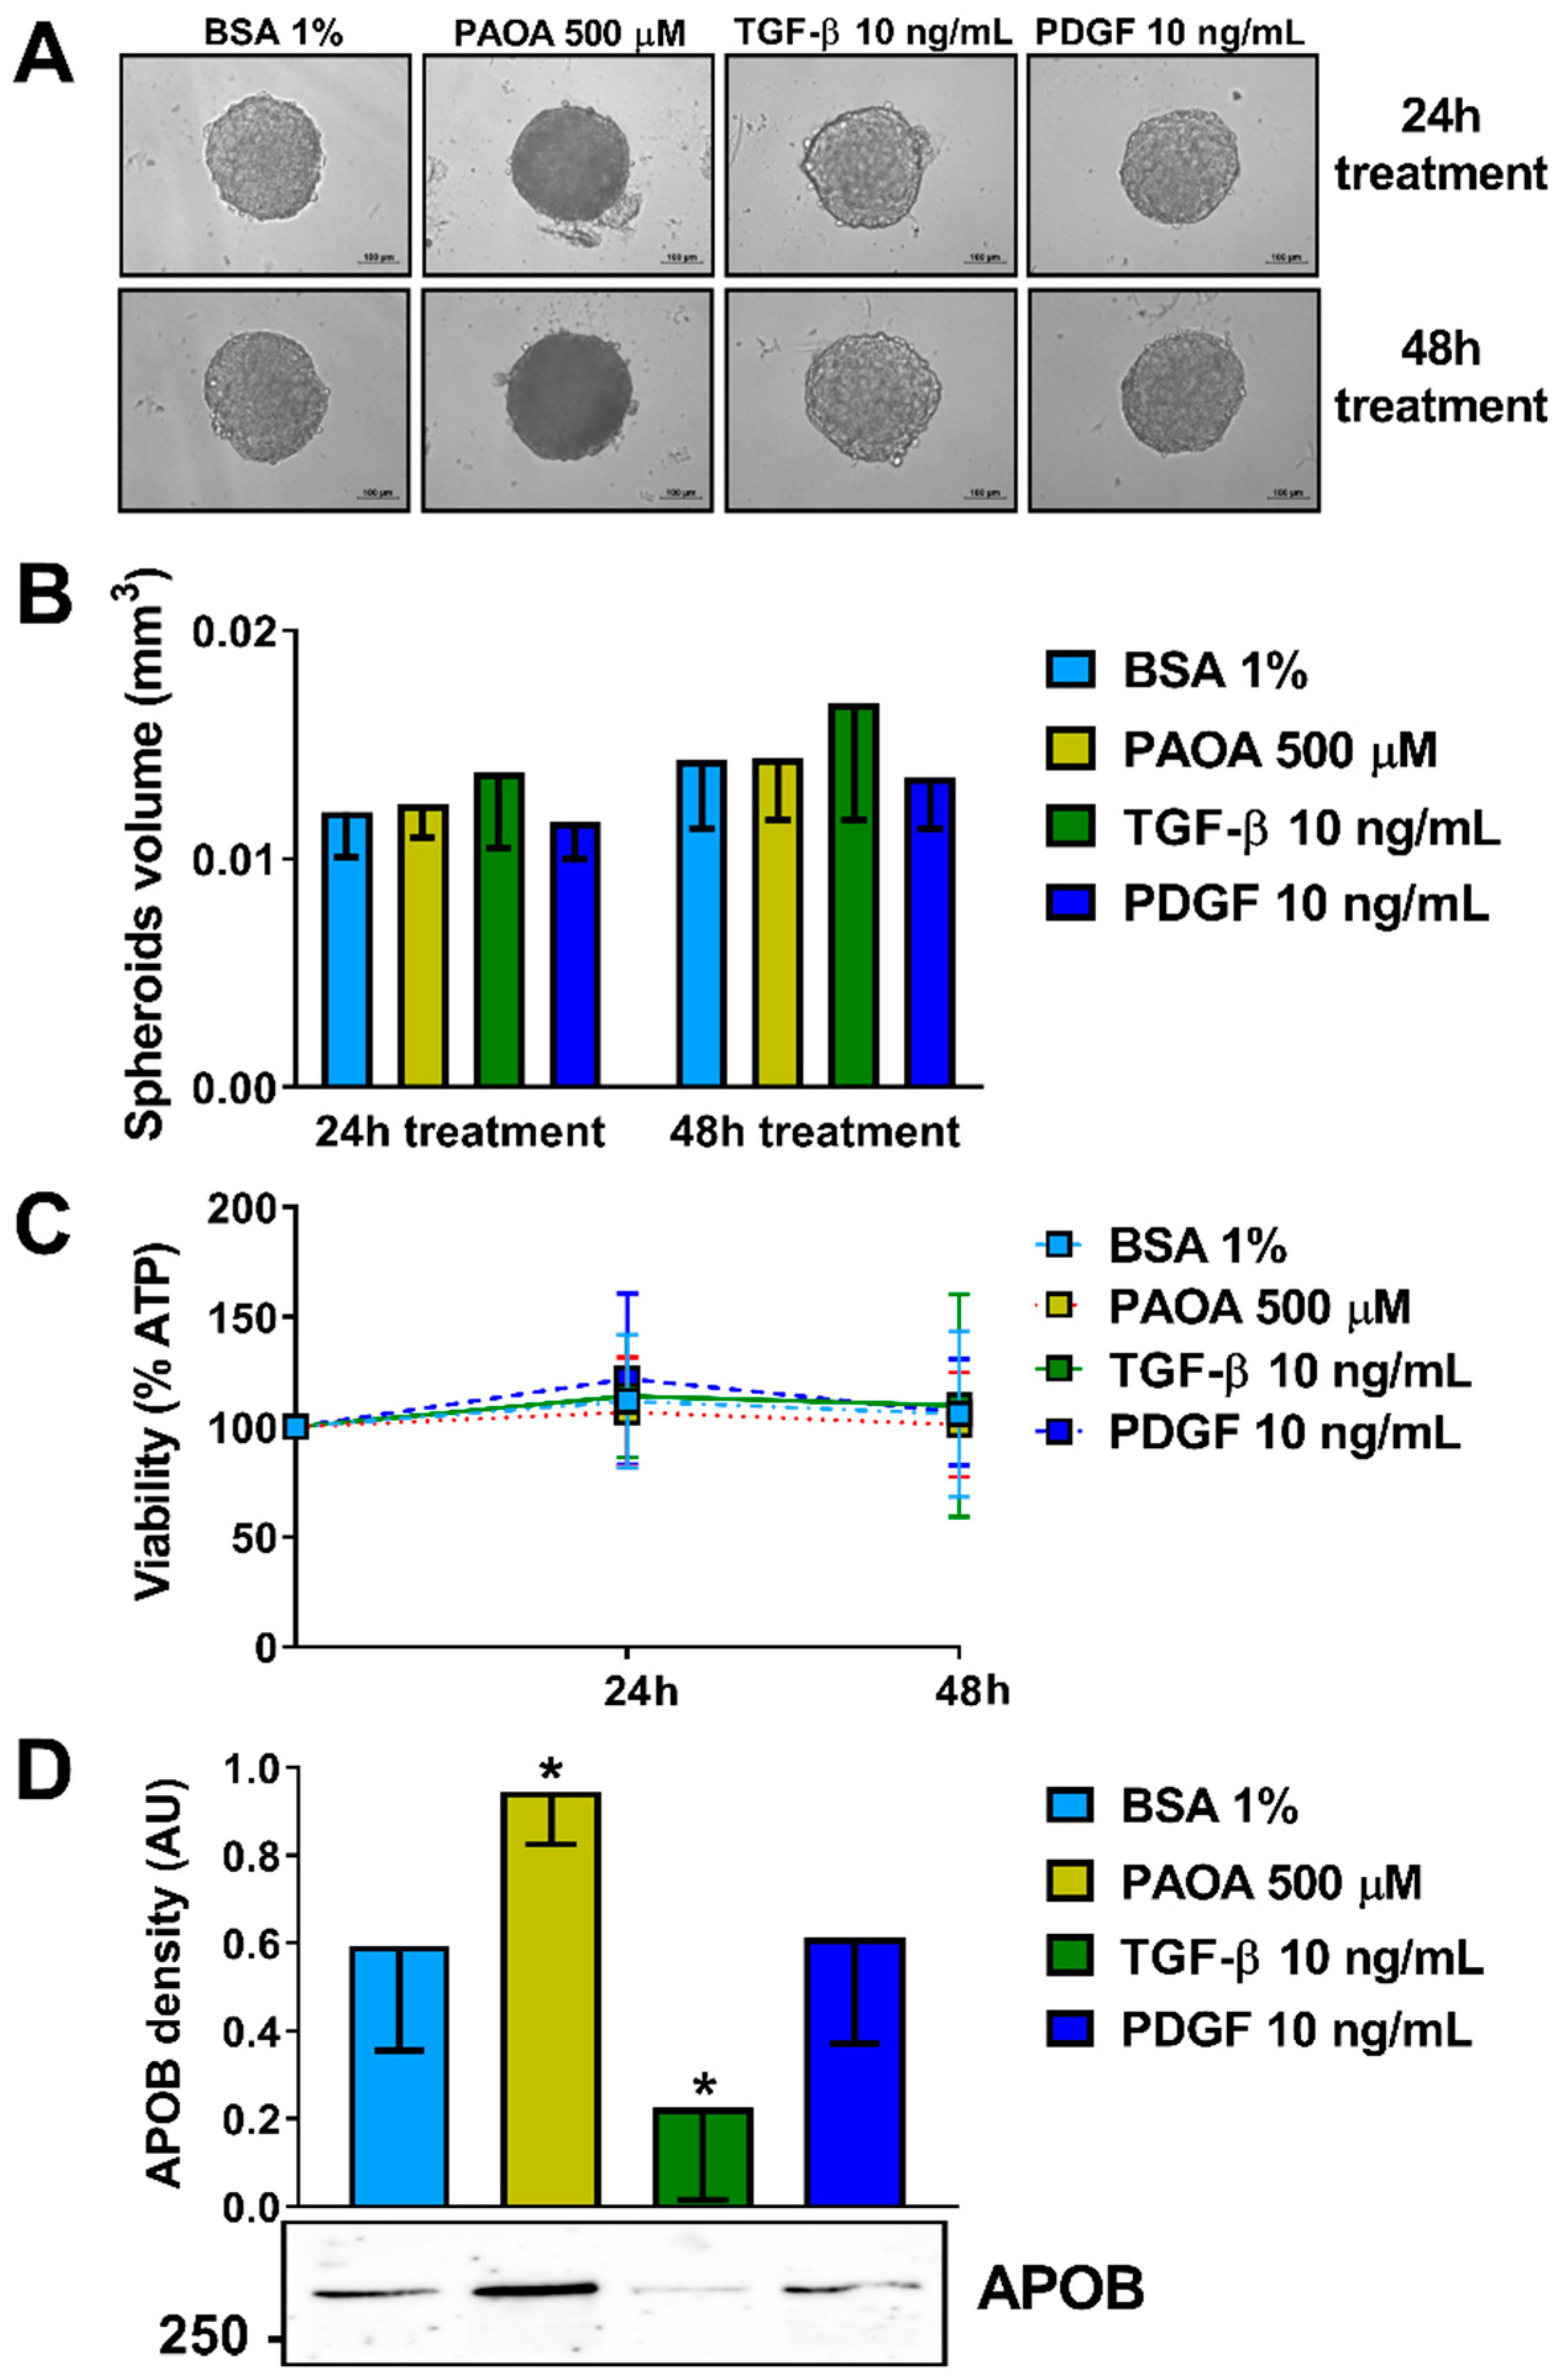
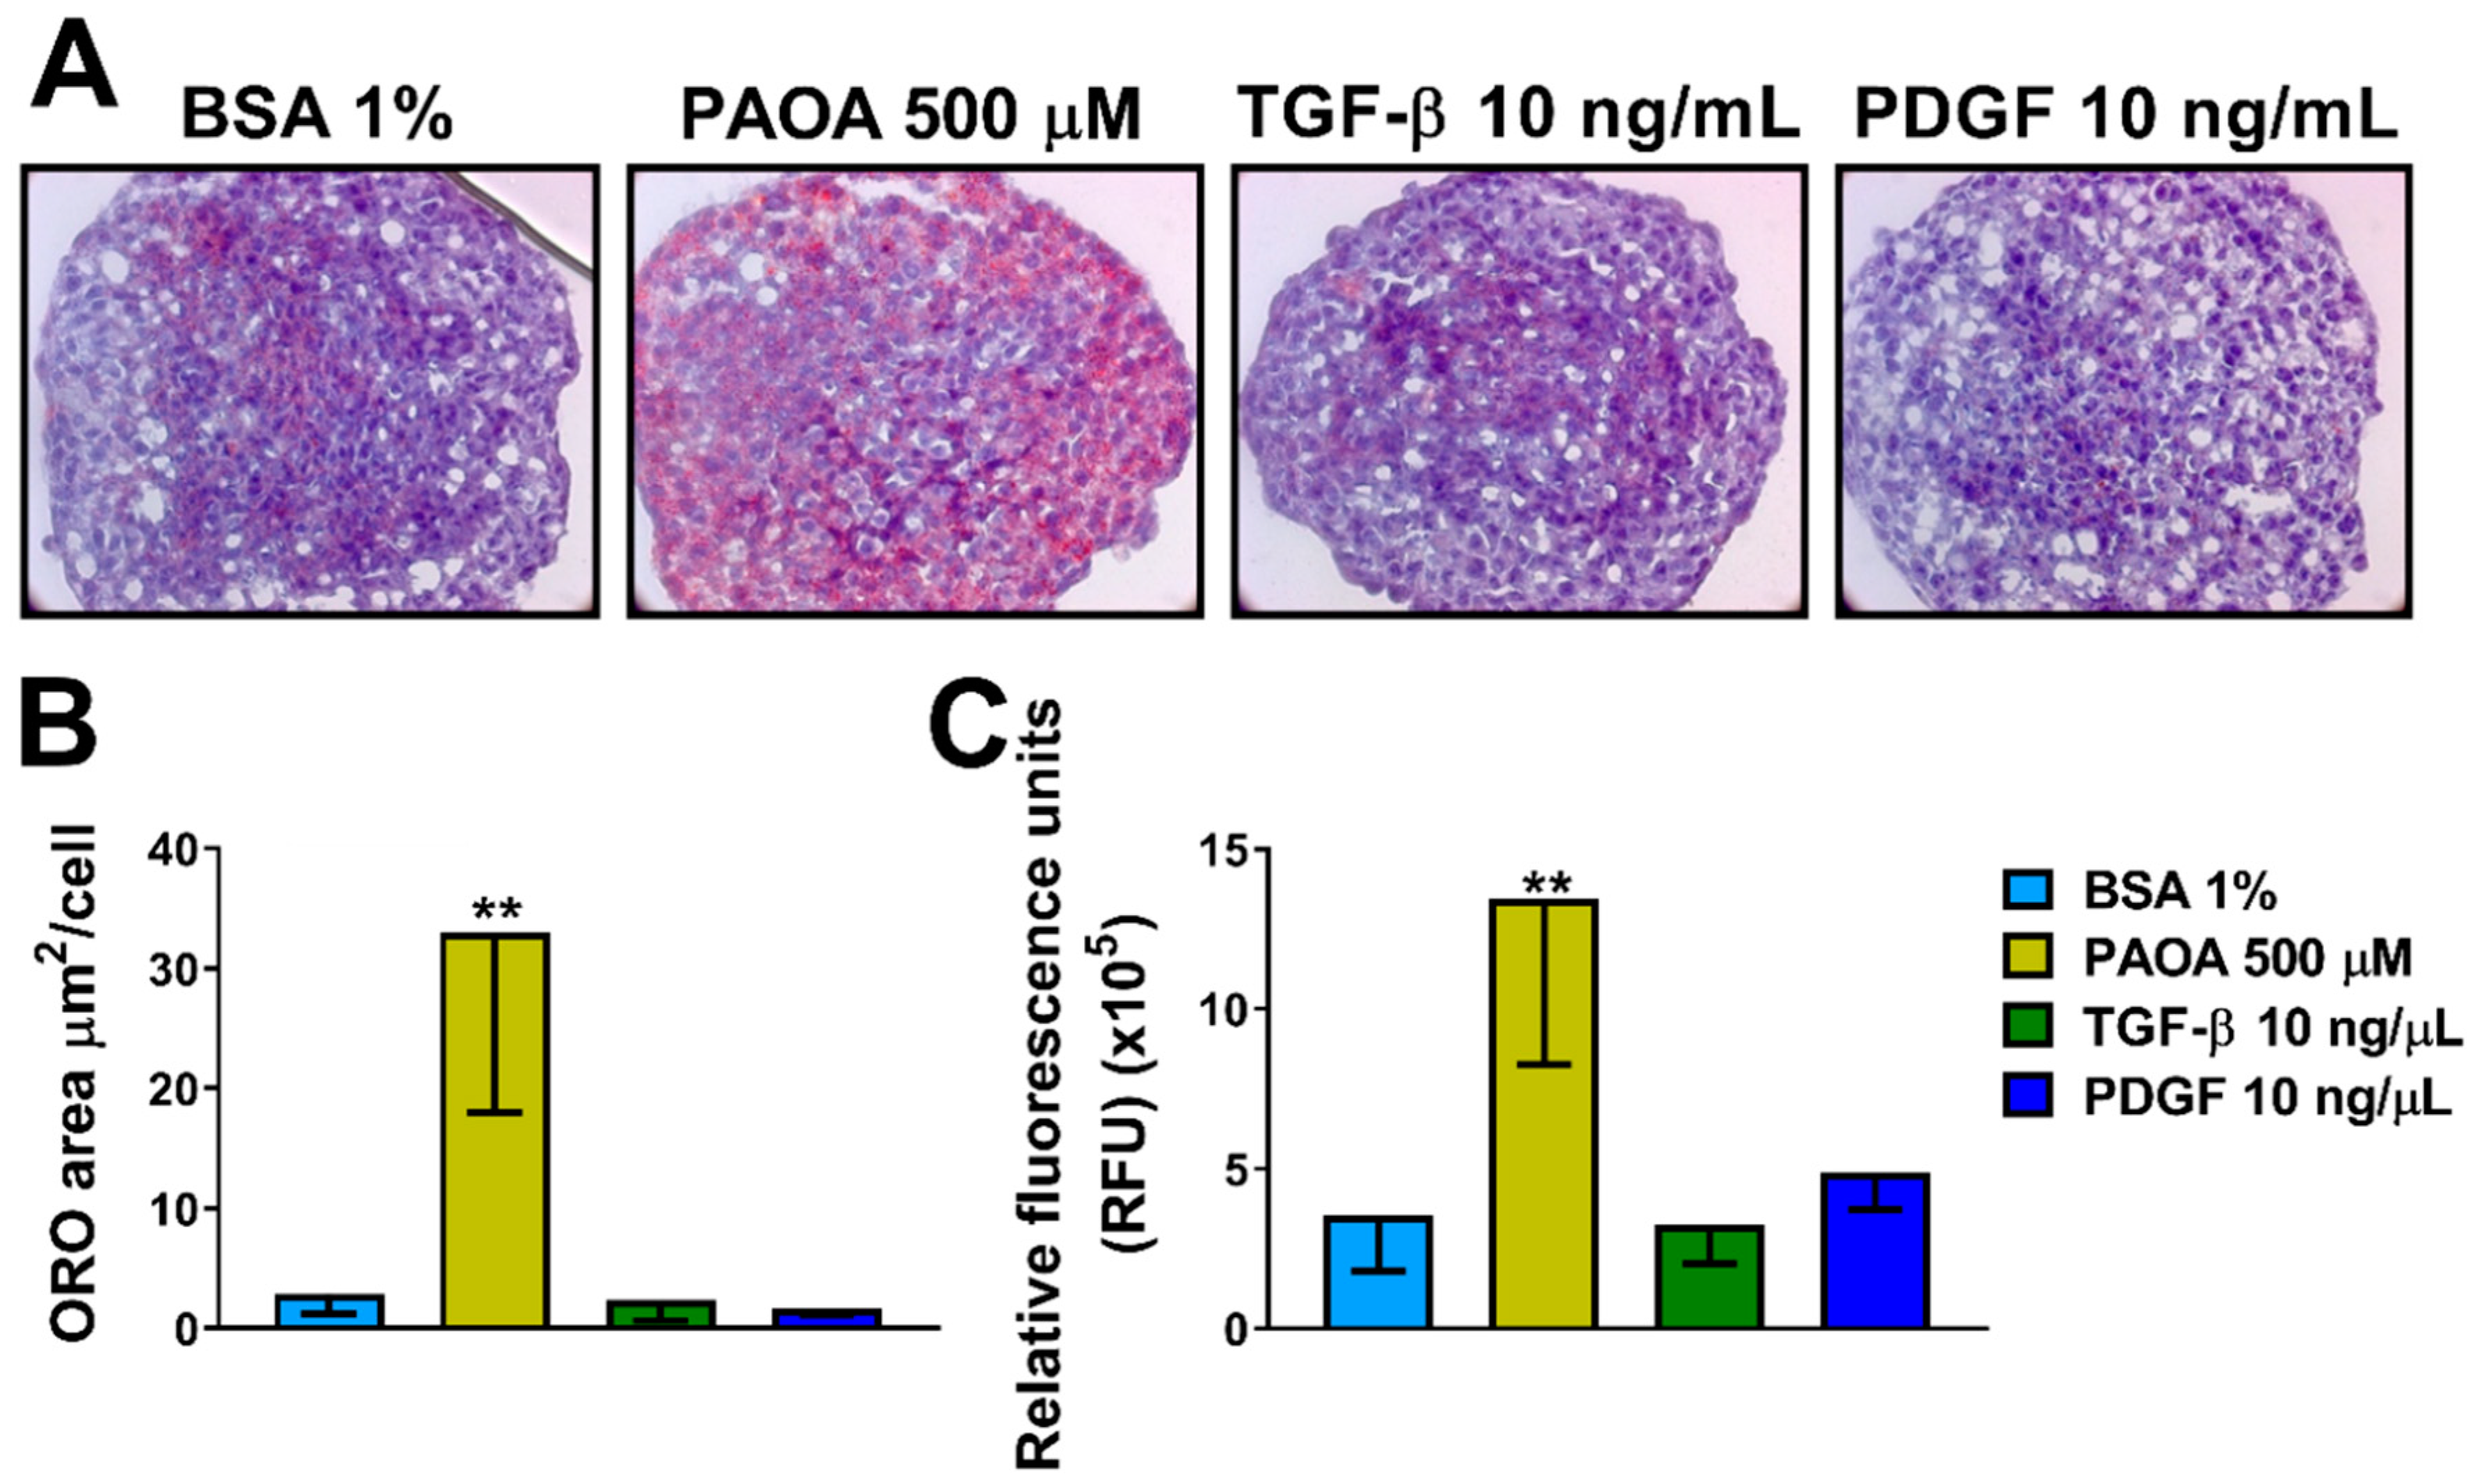
2.2. Incubation of Multilineage 3D Spheroids with Fatty Acids Results in Higher Intra-Spheroidal Fat Content and Higher Secretion of APOB
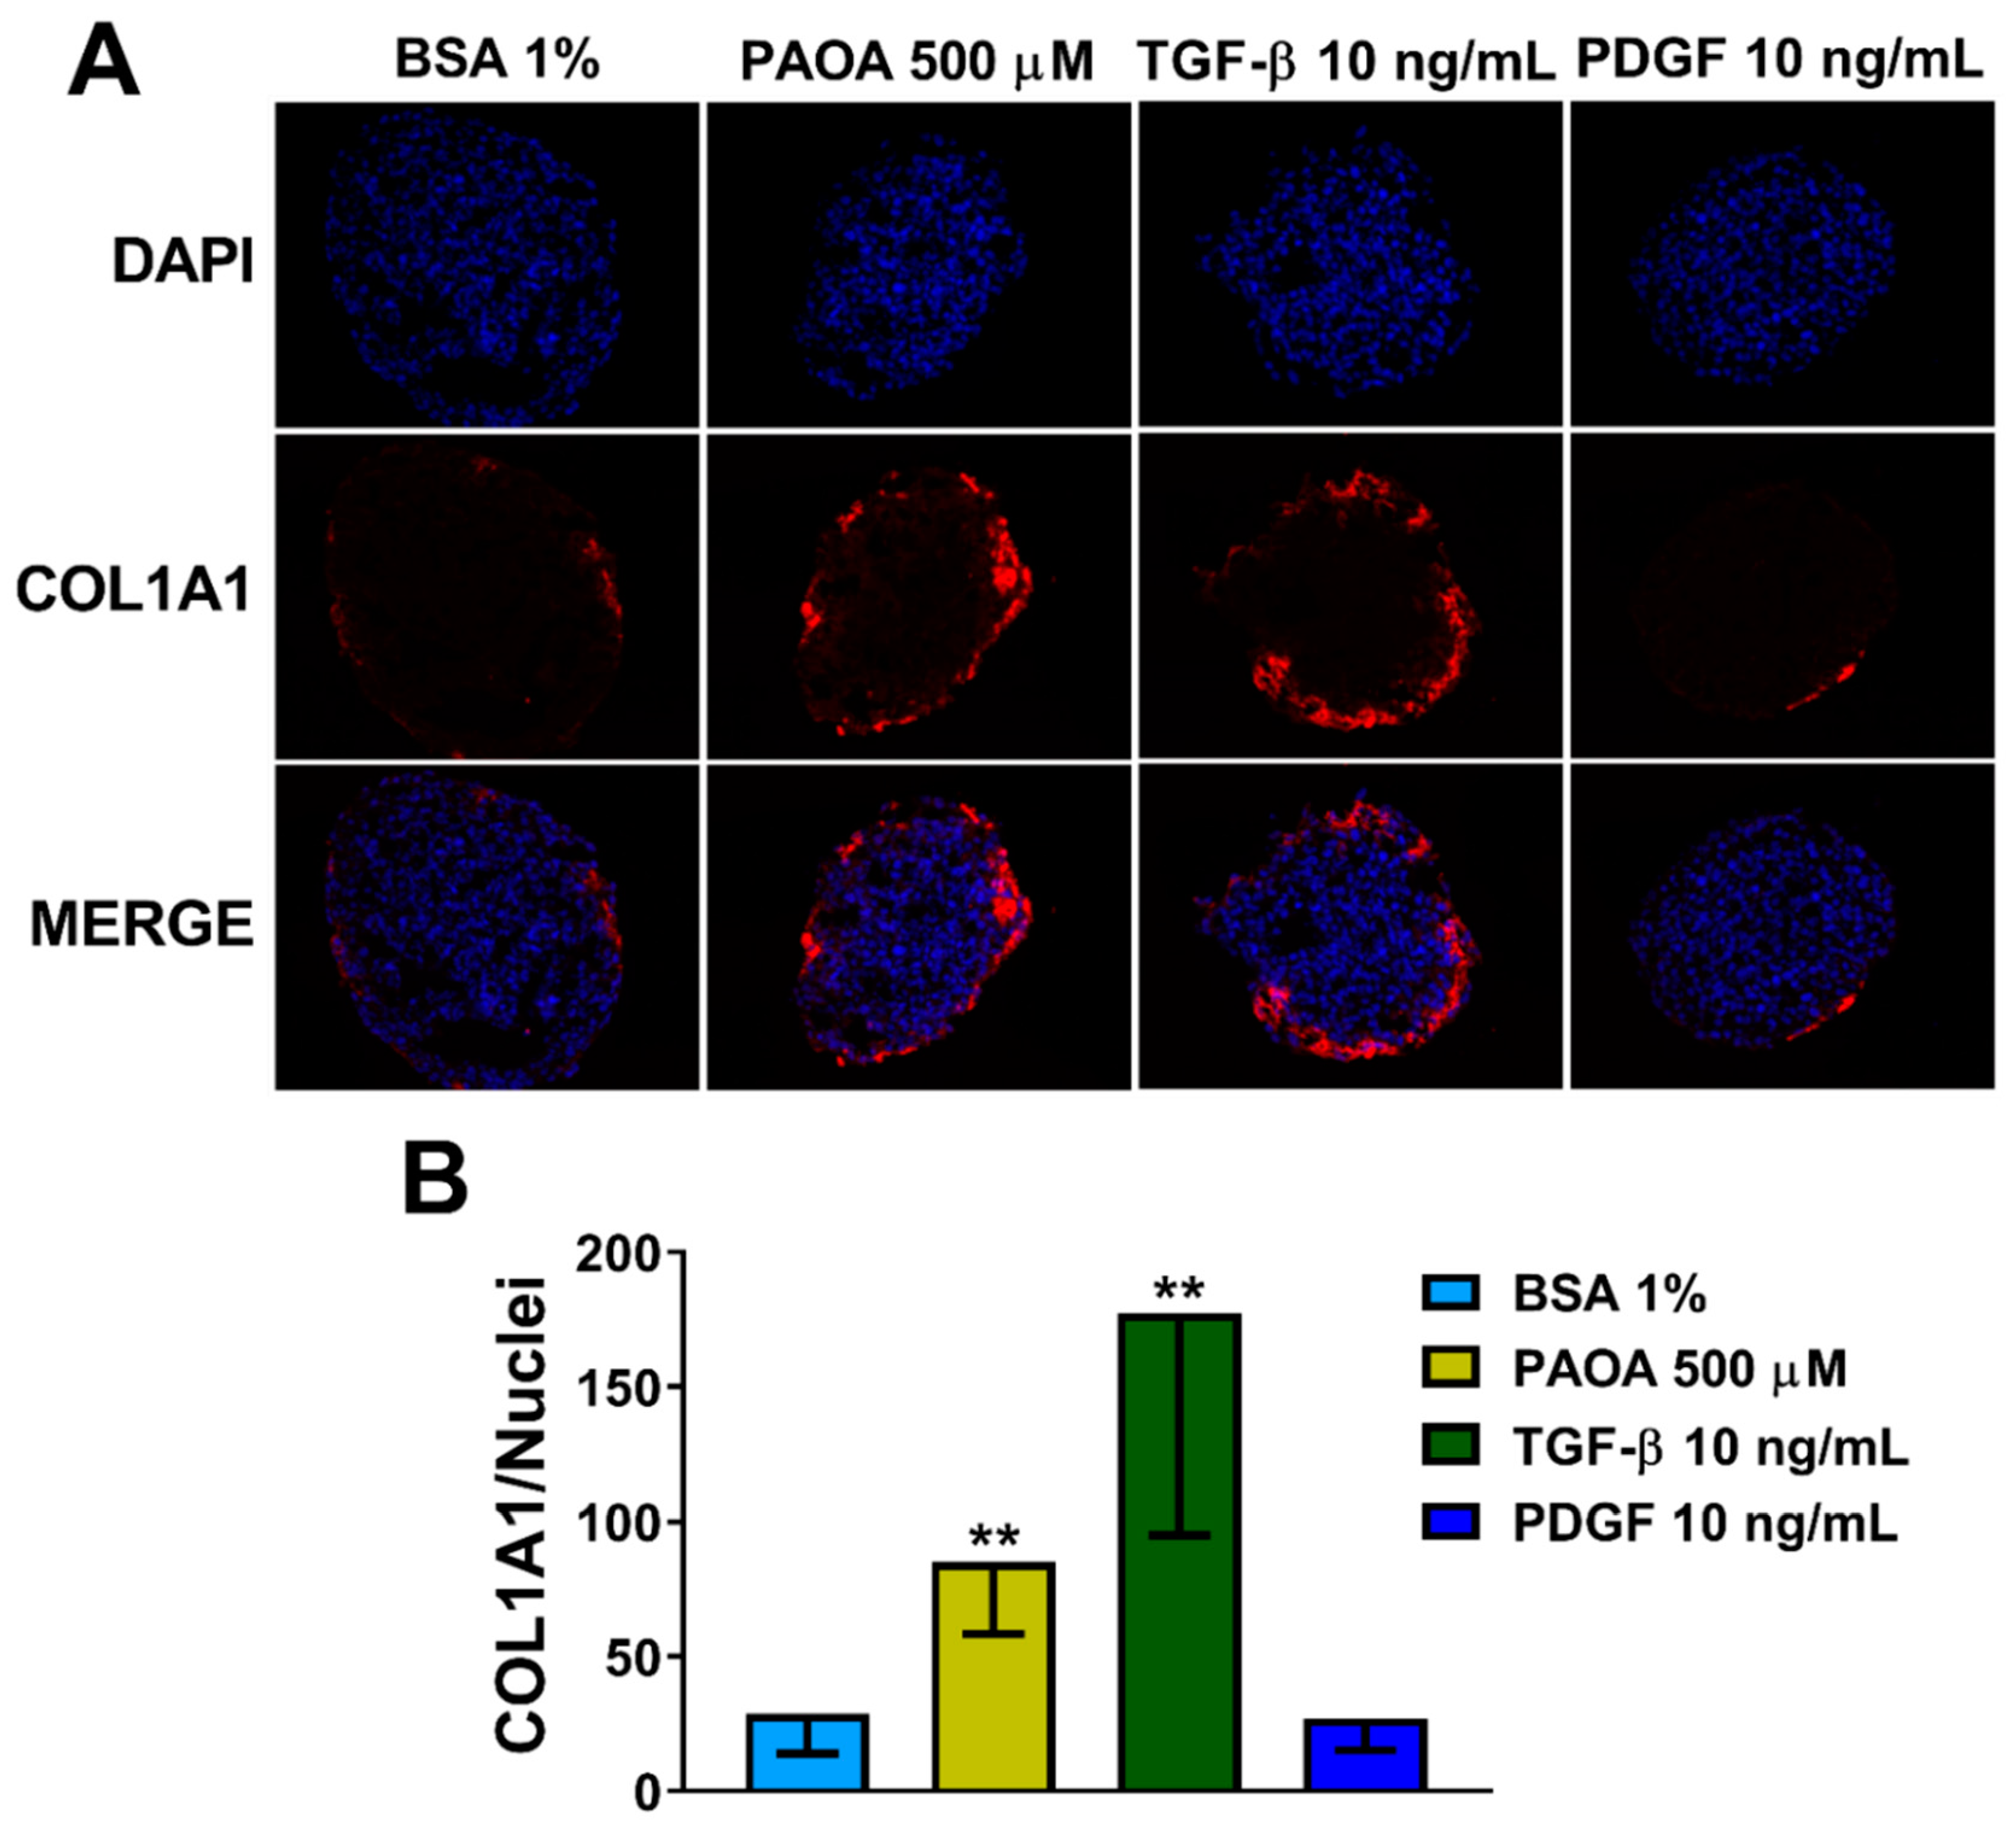
2.3. Incubation of Multilineage 3D Spheroids with Fatty Acids Results in Fibrosis
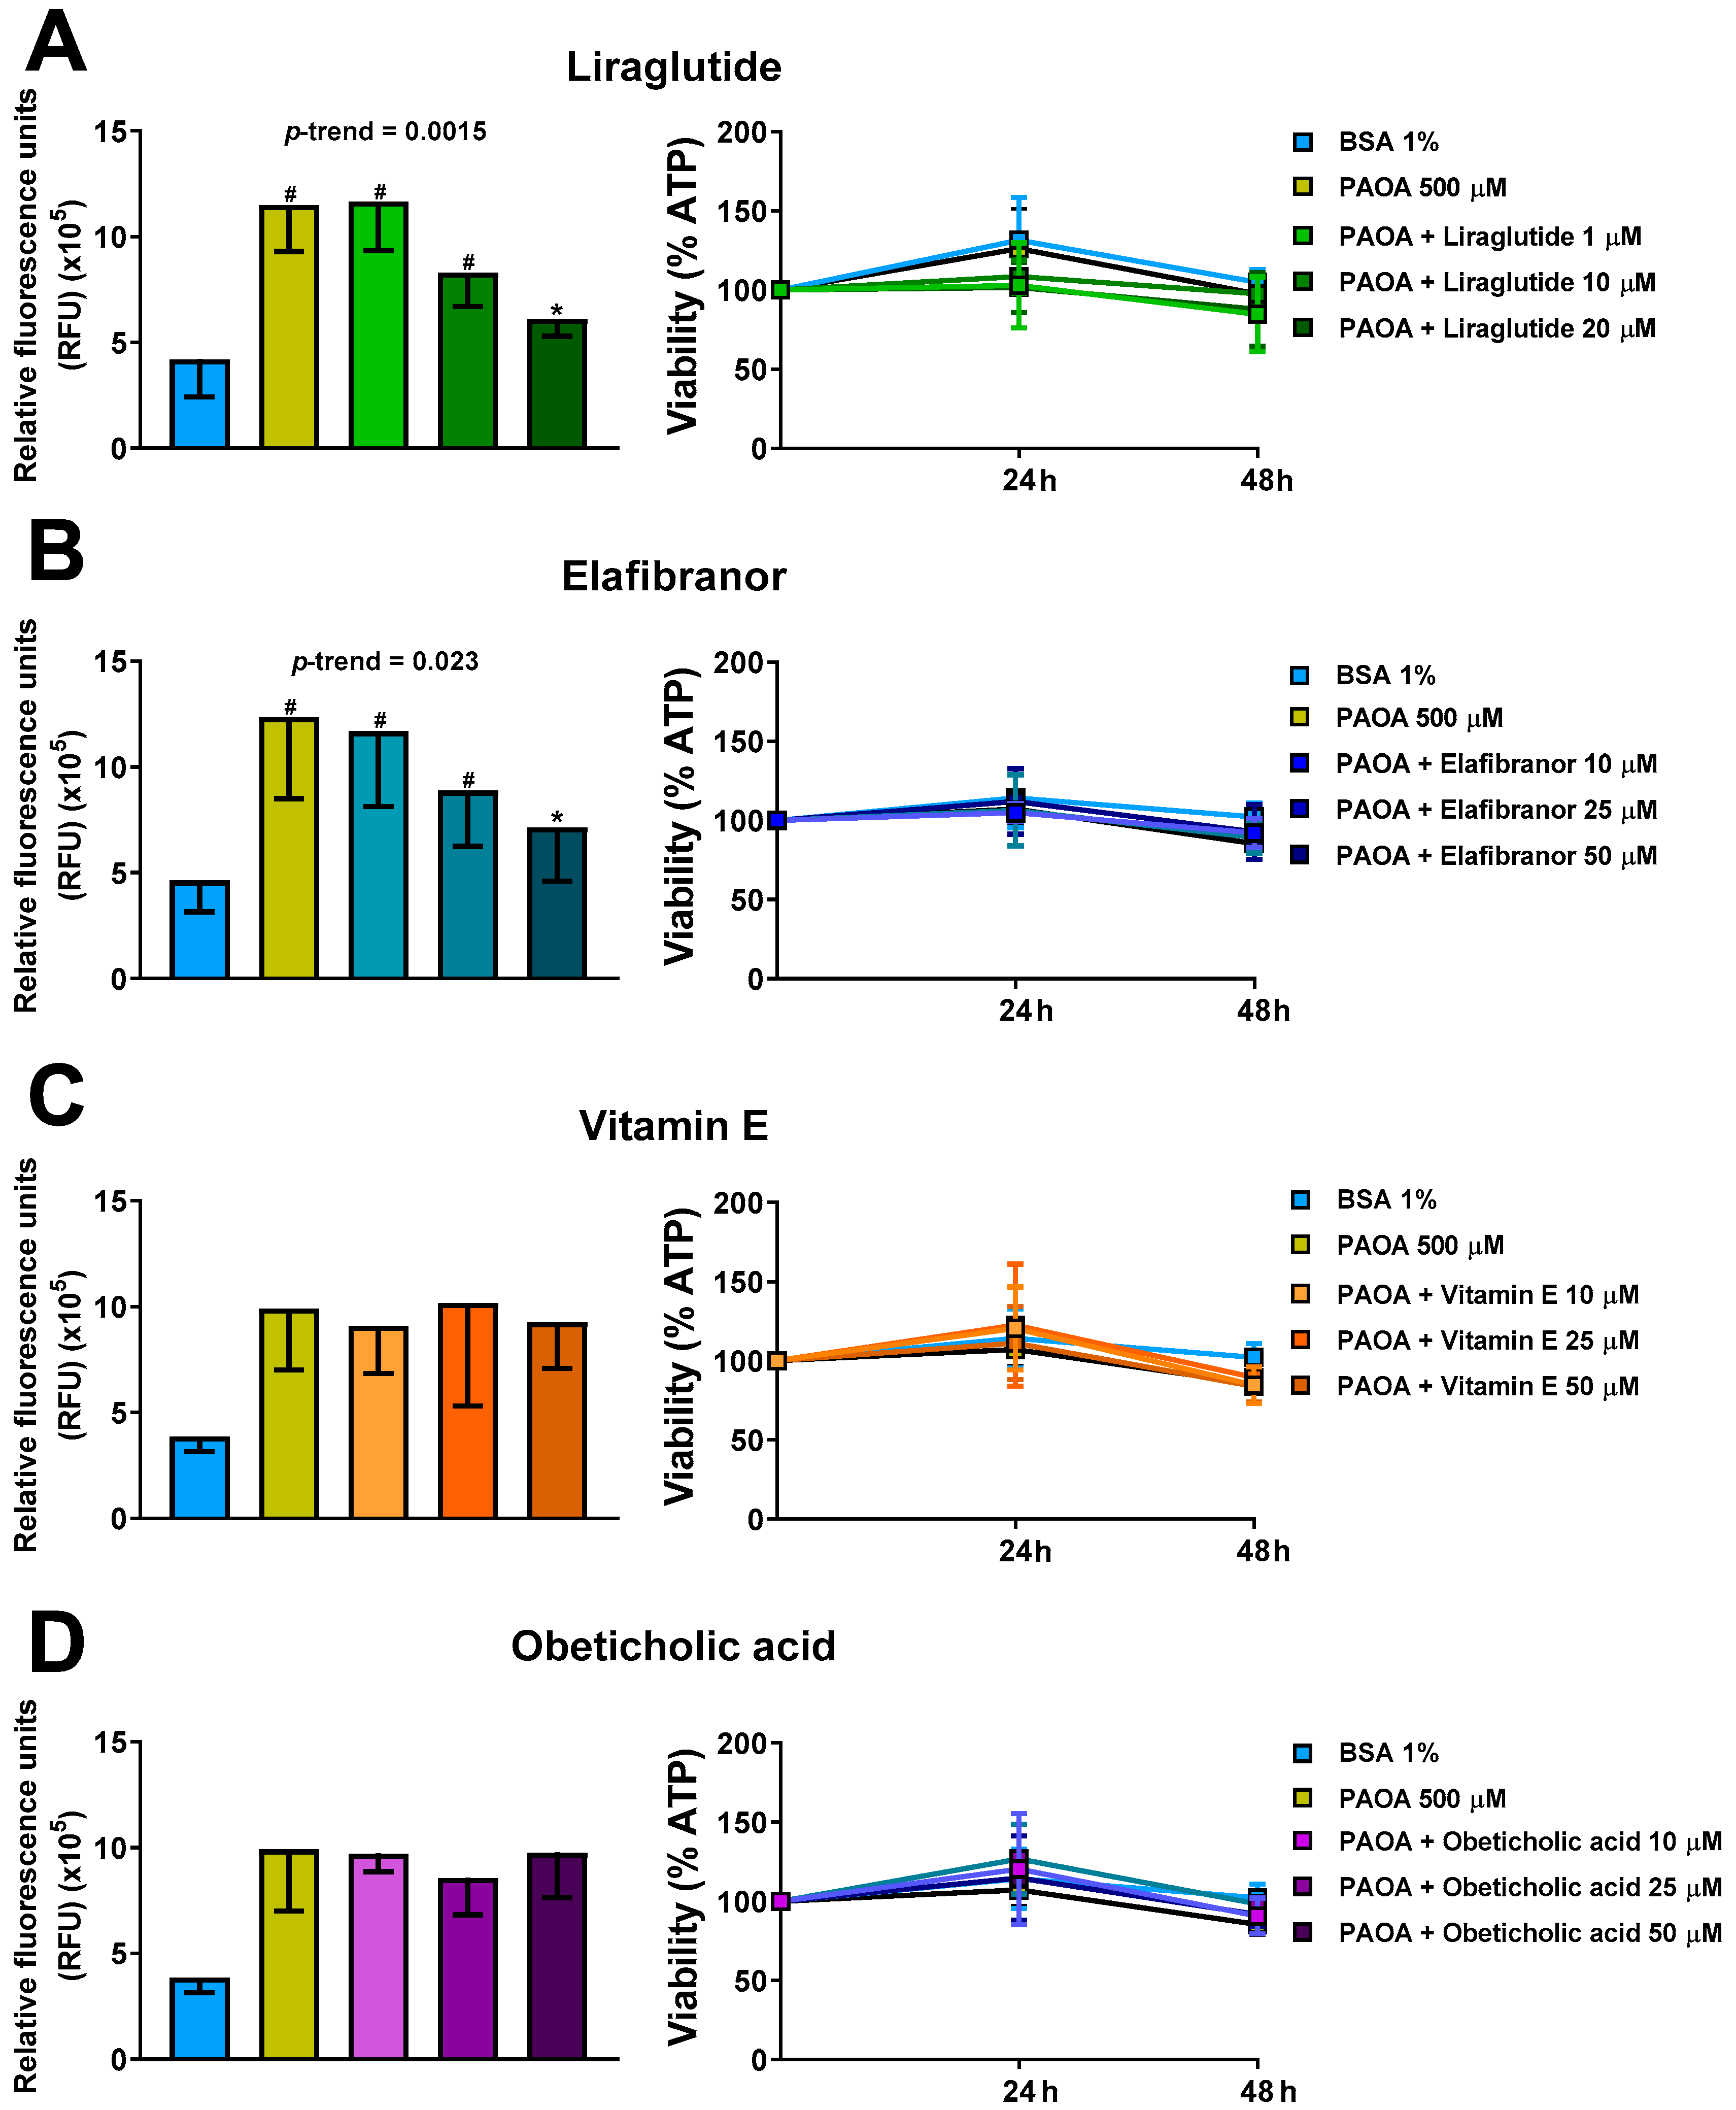
2.4. Prevention of Steatosis in Multilineage 3D Spheroids by Drug Treatment
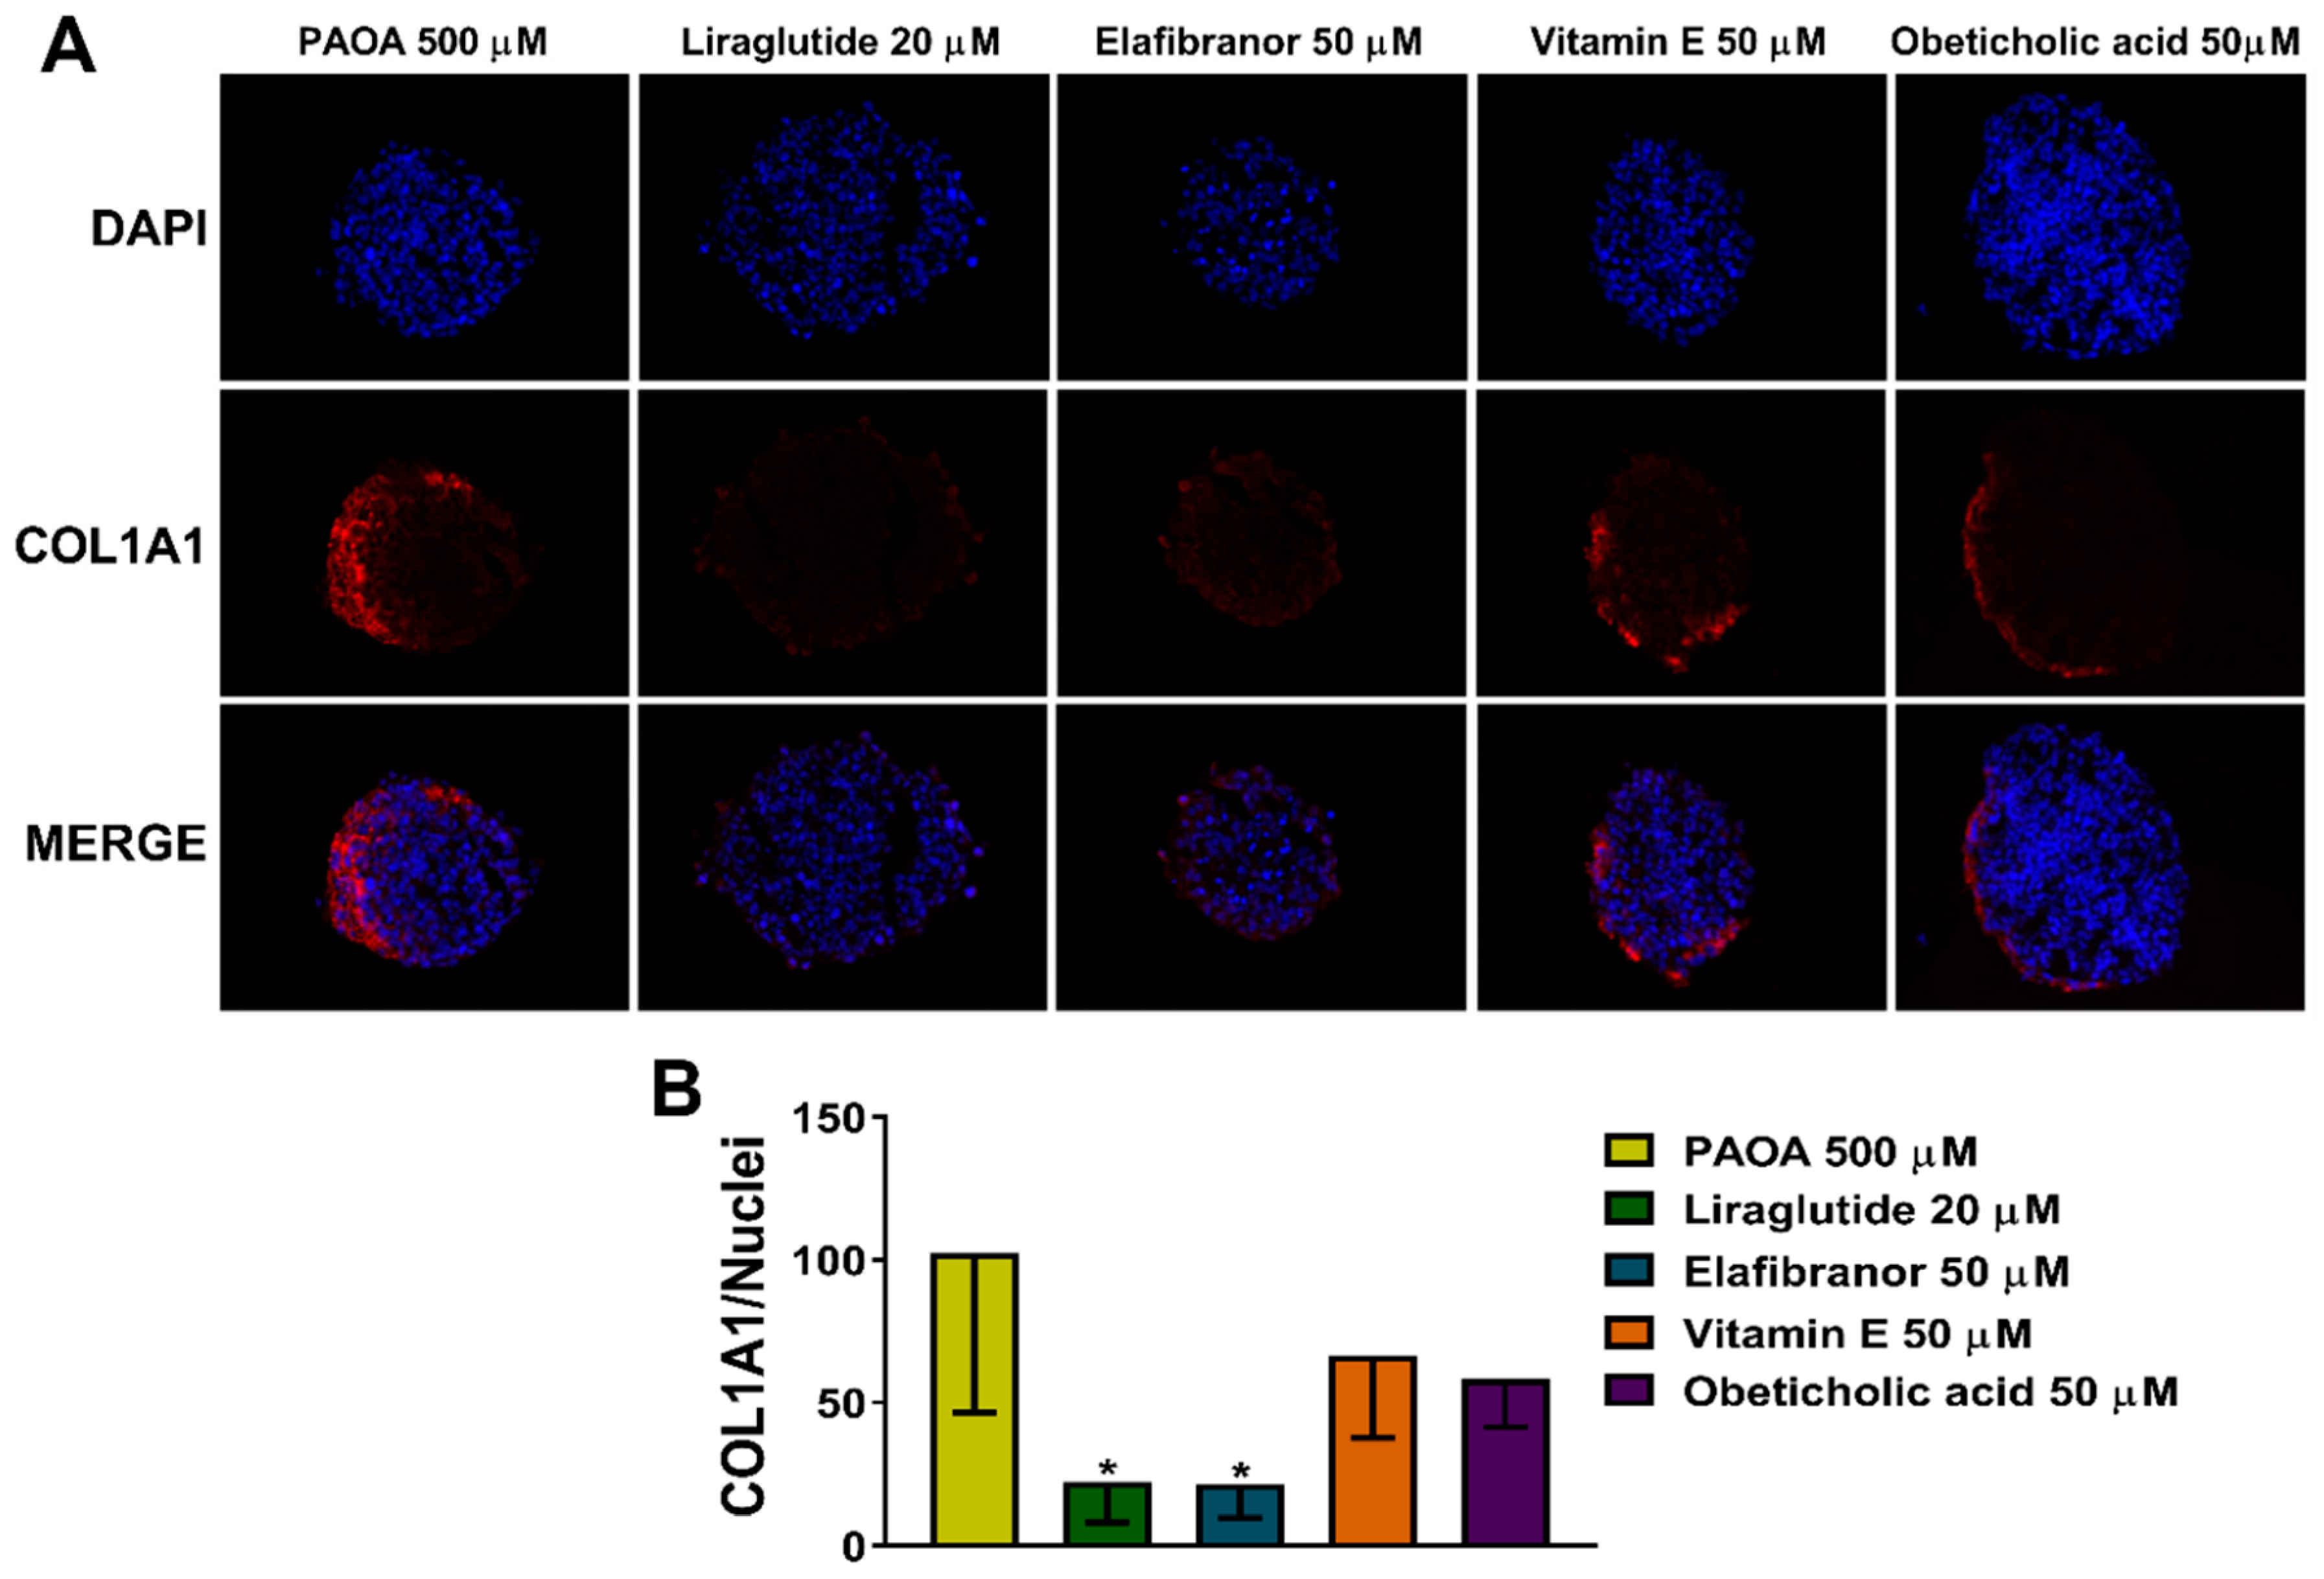
2.5. Reduction of COL1A1 Levels by Pharmacological Prevention of Steatosis
3. Discussion
4. Materials and Methods
4.1. Cell Lines
4.2. D Spheroid Culture
4.3. Induction of Steatosis
4.4. Drug Treatments
4.5. Lipid Assay
4.6. Cell Viability Assay
4.7. Immunoblotting
4.8. Spheroid and Tissue Imaging
4.9. Oil Red O (ORO) Staining
4.10. Immunofluorescence
4.11. Statistical Analysis
Supplementary Materials
Author Contributions
Funding
Conflicts of Interest
References
- Blachier, M.; Leleu, H.; Peck-Radosavljevic, M.; Valla, D.C.; Roudot-Thoraval, F. The burden of liver disease in Europe: A review of available epidemiological data. J. Hepatol. 2013, 58, 593–608. [Google Scholar] [CrossRef] [PubMed] [Green Version]
- Younossi, Z.M.; Koenig, A.B.; Abdelatif, D.; Fazel, Y.; Henry, L.; Wymer, M. Global epidemiology of nonalcoholic fatty liver disease-Meta-analytic assessment of prevalence, incidence, and outcomes. Hepatology 2016, 64, 73–84. [Google Scholar] [CrossRef] [PubMed] [Green Version]
- Brunt, E.M.; Wong, V.W.; Nobili, V.; Day, C.P.; Sookoian, S.; Maher, J.J.; Bugianesi, E.; Sirlin, C.B.; Neuschwander-Tetri, B.A.; Rinella, M.E. Nonalcoholic fatty liver disease. Nat. Rev. Dis. Primers 2015, 1, 15080. [Google Scholar] [CrossRef] [PubMed] [Green Version]
- Kleiner, D.E.; Brunt, E.M.; Van Natta, M.; Behling, C.; Contos, M.J.; Cummings, O.W.; Ferrell, L.D.; Liu, Y.C.; Torbenson, M.S.; Unalp-Arida, A.; et al. Design and validation of a histological scoring system for nonalcoholic fatty liver disease. Hepatology 2005, 41, 1313–1321. [Google Scholar] [CrossRef] [PubMed] [Green Version]
- Kozyra, M.; Johansson, I.; Nordling, Å.; Ullah, S.; Lauschke, V.M.; Ingelman-Sundberg, M. Human hepatic 3D spheroids as a model for steatosis and insulin resistance. Sci. Rep. 2018, 8, 14297. [Google Scholar] [CrossRef] [PubMed]
- Finkelstein, J.; Heemels, M.T.; Shadan, S.; Weiss, U. Lipids in health and disease. Nature 2014, 510, 47. [Google Scholar] [CrossRef]
- Geisler, C.E.; Hepler, C.; Higgins, M.R.; Renquist, B.J. Hepatic adaptations to maintain metabolic homeostasis in response to fasting and refeeding in mice. Nutr. Metab. 2016, 13, 62. [Google Scholar] [CrossRef]
- Dongiovanni, P.; Stender, S.; Pietrelli, A.; Mancina, R.M.; Cespiati, A.; Petta, S.; Pelusi, S.; Pingitore, P.; Badiali, S.; Maggioni, M.; et al. Causal relationship of hepatic fat with liver damage and insulin resistance in nonalcoholic fatty liver. J. Intern. Med. 2018, 283, 356–370. [Google Scholar] [CrossRef]
- Jacobs, A.; Warda, A.S.; Verbeek, J.; Cassiman, D.; Spincemaille, P. An Overview of Mouse Models of Nonalcoholic Steatohepatitis: From Past to Present. Curr. Protoc. Mouse Biol. 2016, 6, 185–200. [Google Scholar]
- Cole, B.K.; Feaver, R.E.; Wamhoff, B.R.; Dash, A. Non-alcoholic fatty liver disease (NAFLD) models in drug discovery. Expert Opin. Drug Discov. 2018, 13, 193–205. [Google Scholar] [CrossRef]
- Mazzoleni, G.; Di Lorenzo, D.; Steimberg, N. Modelling tissues in 3D: The next future of pharmaco-toxicology and food research? Genes Nutr. 2009, 4, 13–22. [Google Scholar] [CrossRef] [PubMed]
- Van de Bovenkamp, M.; Groothuis, G.M.; Meijer, D.K.; Olinga, P. Liver fibrosis in vitro: Cell culture models and precision-cut liver slices. Toxicol. In Vitro 2007, 21, 545–557. [Google Scholar] [CrossRef]
- Huh, D.; Hamilton, G.A.; Ingber, D.E. From 3D cell culture to organs-on-chips. Trends Cell Biol. 2011, 21, 745–754. [Google Scholar] [CrossRef]
- Pampaloni, F.; Reynaud, E.G.; Stelzer, E.H. The third dimension bridges the gap between cell culture and live tissue. Nat. Rev. Mol. Cell Biol. 2007, 8, 839–845. [Google Scholar] [CrossRef]
- Barbero-Becerra, V.J.; Giraudi, P.J.; Chávez-Tapia, N.C.; Uribe, M.; Tiribelli, C.; Rosso, N. The interplay between hepatic stellate cells and hepatocytes in an in vitro model of NASH. Toxicol. In Vitro 2015, 29, 1753–1758. [Google Scholar] [CrossRef]
- Dulai, P.S.; Singh, S.; Patel, J.; Soni, M.; Prokop, L.J.; Younossi, Z.; Sebastiani, G.; Ekstedt, M.; Hagstrom, H.; Nasr, P.; et al. Increased risk of mortality by fibrosis stage in nonalcoholic fatty liver disease: Systematic review and meta-analysis. Hepatology 2017, 65, 1557–1565. [Google Scholar] [CrossRef] [PubMed]
- Song, Y.; Kim, S.H.; Kim, K.M.; Choi, E.K.; Kim, J.; Seo, H.R. Activated hepatic stellate cells play pivotal roles in hepatocellular carcinoma cell chemoresistance and migration in multicellular tumor spheroids. Sci. Rep. 2016, 6, 36750. [Google Scholar] [CrossRef] [PubMed] [Green Version]
- Reeves, H.L.; Burt, A.D.; Wood, S.; Day, C.P. Hepatic stellate cell activation occurs in the absence of hepatitis in alcoholic liver disease and correlates with the severity of steatosis. J. Hepatol. 1996, 25, 677–683. [Google Scholar] [CrossRef]
- Friedman, S.L. Hepatic stellate cells: Protean, multifunctional, and enigmatic cells of the liver. Physiol. Rev. 2008, 88, 125–172. [Google Scholar] [CrossRef] [PubMed]
- Tsuchida, T.; Friedman, S.L. Mechanisms of hepatic stellate cell activation. Nat. Rev. Gastroenterol. Hepatol. 2017, 14, 397–411. [Google Scholar] [CrossRef]
- Carpino, G.; Morini, S.; Ginanni Corradini, S.; Franchitto, A.; Merli, M.; Siciliano, M.; Gentili, F.; Onetti Muda, A.; Berloco, P.; et al. Alpha-SMA expression in hepatic stellate cells and quantitative analysis of hepatic fibrosis in cirrhosis and in recurrent chronic hepatitis after liver transplantation. Dig. Liver Dis. 2005, 37, 349–356. [Google Scholar] [CrossRef]
- Sokolović, A.; Sokolović, M.; Boers, W.; Elferink, R.P.; Bosma, P.J. Insulin-like growth factor binding protein 5 enhances survival of LX2 human hepatic stellate cells. Fibrogenesis Tissue Repair 2010, 3, 3. [Google Scholar] [CrossRef]
- Pingitore, P.; Romeo, S. The role of PNPLA3 in health and disease. Biochim. Biophys. Acta Mol. Cell Biol. Lipids 2019, 1864, 900–906. [Google Scholar] [CrossRef]
- Kumari, M.; Schoiswohl, G.; Chitraju, C.; Paar, M.; Cornaciu, I.; Rangrez, A.Y.; Wongsiriroj, N.; Nagy, H.M.; Ivanova, P.T.; Scott, S.A.; et al. Adiponutrin Functions as a Nutritionally Regulated Lysophosphatidic Acid Acyltransferase. Cell Metab. 2012, 15, 691–702. [Google Scholar] [CrossRef] [Green Version]
- Kumashiro, N.; Yoshimura, T.; Cantley, J.L.; Majumdar, S.K.; Guebre-Egziabher, F.; Kursawe, R.; Vatner, D.F.; Fat, I.; Kahn, M.; Erion, D.M.; et al. Role of patatin-like phospholipase domain-containing 3 on lipid-induced hepatic steatosis and insulin resistance in rats. Hepatology 2013, 57, 1763–1772. [Google Scholar] [CrossRef] [PubMed]
- Linden, D.; Ahnmark, A.; Pingitore, P.; Ciociola, E.; Ahlstedt, I.; Andreasson, A.C.; Sasidharan, K.; Madeyski-Bengtson, K.; Zurek, M.; Mancina, R.M.; et al. Pnpla3 silencing with antisense oligonucleotides ameliorates nonalcoholic steatohepatitis and fibrosis in Pnpla3 I148M knock-in mice. Mol. Metab. 2019, 22, 49–61. [Google Scholar] [CrossRef] [PubMed]
- Pirazzi, C.; Adiels, M.; Burza, M.A.; Mancina, R.M.; Levin, M.; Stahlman, M.; Taskinen, M.R.; Orho-Melander, M.; Perman, J.; Pujia, A.; et al. Patatin-like phospholipase domain-containing 3 (PNPLA3) I148M (rs738409) affects hepatic VLDL secretion in humans and in vitro. J. Hepatol. 2012, 57, 1276–1282. [Google Scholar] [CrossRef] [PubMed]
- Pirazzi, C.; Valenti, L.; Motta, B.M.; Pingitore, P.; Hedfalk, K.; Mancina, R.M.; Burza, M.A.; Indiveri, C.; Ferro, Y.; Montalcini, T.; et al. PNPLA3 has retinyl-palmitate lipase activity in human hepatic stellate cells. Hum. Mol. Genet. 2014, 23, 4077–4085. [Google Scholar] [CrossRef] [PubMed] [Green Version]
- Pingitore, P.; Dongiovanni, P.; Motta, B.M.; Meroni, M.; Lepore, S.M.; Mancina, R.M.; Pelusi, S.; Russo, C.; Caddeo, A.; Rossi, G.; et al. PNPLA3 overexpression results in reduction of proteins predisposing to fibrosis. Hum. Mol. Genet. 2016, 25, 5212–5222. [Google Scholar] [CrossRef] [Green Version]
- Kovarova, M.; Konigsrainer, I.; Konigsrainer, A.; Machicao, F.; Haring, H.U.; Schleicher, E.; Peter, A. The Genetic Variant I148M in PNPLA3 Is Associated with Increased Hepatic Retinyl-Palmitate Storage in Humans. J. Clin. Endocr. Metab. 2015, 100, E1568–E1574. [Google Scholar] [CrossRef]
- Mondul, A.; Mancina, R.M.; Merlo, A.; Dongiovanni, P.; Rametta, R.; Montalcini, T.; Valenti, L.; Albanes, D.; Romeo, S. PNPLA3 I148M Variant Influences Circulating Retinol in Adults with Nonalcoholic Fatty Liver Disease or Obesity. J. Nutr. 2015, 145, 1687–1691. [Google Scholar] [CrossRef] [PubMed]
- Hyysalo, J.; Gopalacharyulu, P.; Bian, H.; Hyotylainen, T.; Leivonen, M.; Jaser, N.; Juuti, A.; Honka, M.J.; Nuutila, P.; Olkkonen, V.M.; et al. Circulating triacylglycerol signatures in nonalcoholic fatty liver disease associated with the I148M variant in PNPLA3 and with obesity. Diabetes 2014, 63, 312–322. [Google Scholar] [CrossRef] [PubMed]
- Dongiovanni, P.; Petta, S.; Mannisto, V.; Mancina, R.M.; Pipitone, R.; Karja, V.; Maggioni, M.; Kakela, P.; Wiklund, O.; Mozzi, E.; et al. Statin use and non-alcoholic steatohepatitis in at risk individuals. J. Hepatol. 2015, 63, 705–712. [Google Scholar] [CrossRef]
- Oscarsson, J.; Onnerhag, K.; Riserus, U.; Sunden, M.; Johansson, L.; Jansson, P.A.; Moris, L.; Nilsson, P.M.; Eriksson, J.W.; Lind, L. Effects of free omega-3 carboxylic acids and fenofibrate on liver fat content in patients with hypertriglyceridemia and non-alcoholic fatty liver disease: A double-blind, randomized, placebo-controlled study. J. Clin. Lipidol. 2018, 12, 1390–1403. [Google Scholar] [CrossRef] [PubMed]
- Scorletti, E.; West, A.L.; Bhatia, L.; Hoile, S.P.; McCormick, K.G.; Burdge, G.C.; Lillycrop, K.A.; Clough, G.F.; Calder, P.C.; Byrne, C.D. Treating liver fat and serum triglyceride levels in NAFLD, effects of PNPLA3 and TM6SF2 genotypes: Results from the WELCOME trial. J. Hepatol. 2015, 63, 1476–1483. [Google Scholar] [CrossRef] [PubMed] [Green Version]
- Liu, Y.; Fernandez, C.A.; Smith, C.; Yang, W.; Cheng, C.; Panetta, J.C.; Kornegay, N.; Liu, C.; Ramsey, L.B.; Karol, S.E.; et al. Genome-Wide Study Links PNPLA3 Variant with Elevated Hepatic Transaminase After Acute Lymphoblastic Leukemia Therapy. Clin. Pharmacol. Ther. 2017, 102, 131–140. [Google Scholar] [CrossRef] [PubMed]
- Moreira, R.K. Hepatic stellate cells and liver fibrosis. Arch. Pathol. Lab. Med. 2007, 131, 1728–1734. [Google Scholar]
- Seki, E.; De Minicis, S.; Osterreicher, C.H.; Kluwe, J.; Osawa, Y.; Brenner, D.A.; Schwabe, R.F. TLR4 enhances TGF-beta signaling and hepatic fibrosis. Nat. Med. 2007, 13, 1324–1332. [Google Scholar] [CrossRef]
- De Minicis, S.; Seki, E.; Uchinami, H.; Kluwe, J.; Zhang, Y.; Brenner, D.A.; Schwabe, R.F. Gene expression profiles during hepatic stellate cell activation in culture and in vivo. Gastroenterology 2007, 132, 1937–1946. [Google Scholar] [CrossRef]
- Kocabayoglu, P.; Lade, A.; Lee, Y.A.; Dragomir, A.C.; Sun, X.; Fiel, M.I.; Thung, S.; Aloman, C.; Soriano, P.; Hoshida, Y.; et al. β-PDGF receptor expressed by hepatic stellate cells regulates fibrosis in murine liver injury, but not carcinogenesis. J. Hepatol. 2015, 63, 141–147. [Google Scholar] [CrossRef]
- Arab, J.P.; Arrese, M.; Trauner, M. Recent Insights into the Pathogenesis of Nonalcoholic Fatty Liver Disease. Annu. Rev. Pathol. 2018, 13, 321–350. [Google Scholar] [CrossRef] [PubMed]
- Li, C.L.; Tian, T.; Nan, K.J.; Zhao, N.; Guo, Y.H.; Cui, J.; Wang, J.; Zhang, W.G. Survival advantages of multicellular spheroids vs. monolayers of HepG2 cells in vitro. Oncol. Rep. 2008, 20, 1465–1471. [Google Scholar] [CrossRef]
- Adiels, M.; Taskinen, M.R.; Packard, C.; Caslake, M.J.; Soro-Paavonen, A.; Westerbacka, J.; Vehkavaara, S.; Häkkinen, A.; Olofsson, S.O.; Yki-Järvinen, H.; et al. Overproduction of large VLDL particles is driven by increased liver fat content in man. Diabetologia 2006, 49, 755–765. [Google Scholar] [CrossRef] [Green Version]
- Xu, N.; Hurtig, M.; Zhang, X.Y.; Ye, Q.; Nilsson-Ehle, P. Transforming growth factor-beta down-regulates apolipoprotein M in HepG2 cells. Biochim. Biophys. Acta 2004, 1683, 33–37. [Google Scholar] [CrossRef]
- Chavez-Tapia, N.C.; Rosso, N.; Tiribelli, C. Effect of intracellular lipid accumulation in a new model of non-alcoholic fatty liver disease. BMC Gastroenterol. 2012, 12, 20. [Google Scholar] [CrossRef]
- Giraudi, P.J.; Becerra, V.J.; Marin, V.; Chavez-Tapia, N.C.; Tiribelli, C.; Rosso, N. The importance of the interaction between hepatocyte and hepatic stellate cells in fibrogenesis induced by fatty accumulation. Exp. Mol. Pathol. 2015, 98, 85–92. [Google Scholar] [CrossRef]
- Seet, L.F.; Toh, L.Z.; Chu, S.W.L.; Finger, S.N.; Chua, J.L.L.; Wong, T.T. Upregulation of distinct collagen transcripts in post-surgery scar tissue: A study of conjunctival fibrosis. Dis. Model. Mech. 2017, 10, 751–760. [Google Scholar] [CrossRef] [PubMed]
- Pan, X.; Chen, Z.; Huang, R.; Yao, Y.; Ma, G. Transforming growth factor β1 induces the expression of collagen type I by DNA methylation in cardiac fibroblasts. PLoS ONE 2013, 8, e60335. [Google Scholar] [CrossRef] [PubMed]
- Johnston, E.F.; Gillis, T.E. Transforming growth factor beta-1 (TGF-β1) stimulates collagen synthesis in cultured rainbow trout cardiac fibroblasts. J. Exp. Biol. 2017, 220 Pt 14, 2645–2653. [Google Scholar] [CrossRef]
- Brenner, D.A.; Veloz, L.; Jaenisch, R.; Alcorn, J.M. Stimulation of the collagen alpha 1 (I) endogenous gene and transgene in carbon tetrachloride-induced hepatic fibrosis. Hepatology 1993, 17, 287–292. [Google Scholar] [PubMed]
- Friedman, S.L. Hepatic stellate cells. Prog. Liver Dis. 1996, 14, 101–130. [Google Scholar]
- Milani, S.; Herbst, H.; Schuppan, D.; Surrenti, C.; Riecken, E.O.; Stein, H. Cellular localization of type I III and IV procollagen gene transcripts in normal and fibrotic human liver. Am. J. Pathol. 1990, 137, 59–70. [Google Scholar] [PubMed]
- Yin, C.; Evason, K.J.; Asahina, K.; Stainier, D.Y. Hepatic stellate cells in liver development, regeneration, and cancer. J. Clin. Investig. 2013, 123, 1902–1910. [Google Scholar] [CrossRef] [PubMed] [Green Version]
- Armstrong, M.J.; Gaunt, P.; Aithal, G.P.; Barton, D.; Hull, D.; Parker, R.; Hazlehurst, J.M.; Guo, K.; Abouda, G.; Aldersley, M.A.; et al. Liraglutide safety and efficacy in patients with non-alcoholic steatohepatitis (LEAN): A multicentre, double-blind, randomised, placebo-controlled phase 2 study. Lancet 2016, 387, 679–690. [Google Scholar] [CrossRef]
- Neuschwander-Tetri, B.A.; Loomba, R.; Sanyal, A.J.; Lavine, J.E.; Van Natta, M.L.; Abdelmalek, M.F.; Chalasani, N.; Dasarathy, S.; Diehl, A.M.; Hameed, B.; et al. Farnesoid X nuclear receptor ligand obeticholic acid for non-cirrhotic, non-alcoholic steatohepatitis (FLINT): A multicentre, randomised, placebo-controlled trial. Lancet 2015, 385, 956–965. [Google Scholar] [CrossRef]
- Ratziu, V.; Harrison, S.A.; Francque, S.; Bedossa, P.; Lehert, P.; Serfaty, L.; Romero-Gomez, M.; Boursier, J.; Abdelmalek, M.; Caldwell, S.; et al. Elafibranor, an Agonist of the Peroxisome Proliferator-Activated Receptor-α and -δ, Induces Resolution of Nonalcoholic Steatohepatitis Without Fibrosis Worsening. Gastroenterology 2016, 150, 1147–1159.e5. [Google Scholar] [CrossRef]
- Tølbøl, K.S.; Kristiansen, M.N.; Hansen, H.H.; Veidal, S.S.; Rigbolt, K.T.; Gillum, M.P.; Jelsing, J.; Vrang, N.; Feigh, M. Metabolic and hepatic effects of liraglutide, obeticholic acid and elafibranor in diet-induced obese mouse models of biopsy-confirmed nonalcoholic steatohepatitis. World J. Gastroenterol. 2018, 24, 179–194. [Google Scholar] [CrossRef]
- Gupta, N.A.; Mells, J.; Dunham, R.M.; Grakoui, A.; Handy, J.; Saxena, N.K.; Anania, F.A. Glucagon-like peptide-1 receptor is present on human hepatocytes and has a direct role in decreasing hepatic steatosis in vitro by modulating elements of the insulin signaling pathway. Hepatology 2010, 51, 1584–1592. [Google Scholar] [CrossRef]
- Madhu, D.; Hammad, M.; Kavalakatt, S.; Khadir, A.; Tiss, A. GLP-1 Analogue, Exendin-4, Modulates MAPKs Activity but not the Heat Shock Response in Human HepG2 Cells. Proteom. Clin. Appl. 2018, 12, 1600169. [Google Scholar] [CrossRef]
- Nicoletti, A.; Kaveri, S.; Caligiuri, G.; Bariéty, J.; Hansson, G.K. Immunoglobulin treatment reduces atherosclerosis in apo E knockout mice. J. Clin. Investig. 1998, 102, 910–918. [Google Scholar] [CrossRef] [PubMed]
- El Hadi, H.; Vettor, R.; Rossato, M. Vitamin E as a Treatment for Nonalcoholic Fatty Liver Disease: Reality or Myth? Antioxidants 2018, 7, 12. [Google Scholar] [CrossRef] [PubMed]


© 2019 by the authors. Licensee MDPI, Basel, Switzerland. This article is an open access article distributed under the terms and conditions of the Creative Commons Attribution (CC BY) license (http://creativecommons.org/licenses/by/4.0/).
Share and Cite
Pingitore, P.; Sasidharan, K.; Ekstrand, M.; Prill, S.; Lindén, D.; Romeo, S. Human Multilineage 3D Spheroids as a Model of Liver Steatosis and Fibrosis. Int. J. Mol. Sci. 2019, 20, 1629. https://0-doi-org.brum.beds.ac.uk/10.3390/ijms20071629
Pingitore P, Sasidharan K, Ekstrand M, Prill S, Lindén D, Romeo S. Human Multilineage 3D Spheroids as a Model of Liver Steatosis and Fibrosis. International Journal of Molecular Sciences. 2019; 20(7):1629. https://0-doi-org.brum.beds.ac.uk/10.3390/ijms20071629
Chicago/Turabian StylePingitore, Piero, Kavitha Sasidharan, Matias Ekstrand, Sebastian Prill, Daniel Lindén, and Stefano Romeo. 2019. "Human Multilineage 3D Spheroids as a Model of Liver Steatosis and Fibrosis" International Journal of Molecular Sciences 20, no. 7: 1629. https://0-doi-org.brum.beds.ac.uk/10.3390/ijms20071629