In Situ Detection of Endogenous HIV Activation by Dynamic Nuclear Polarization NMR and Flow Cytometry

 , and
, and 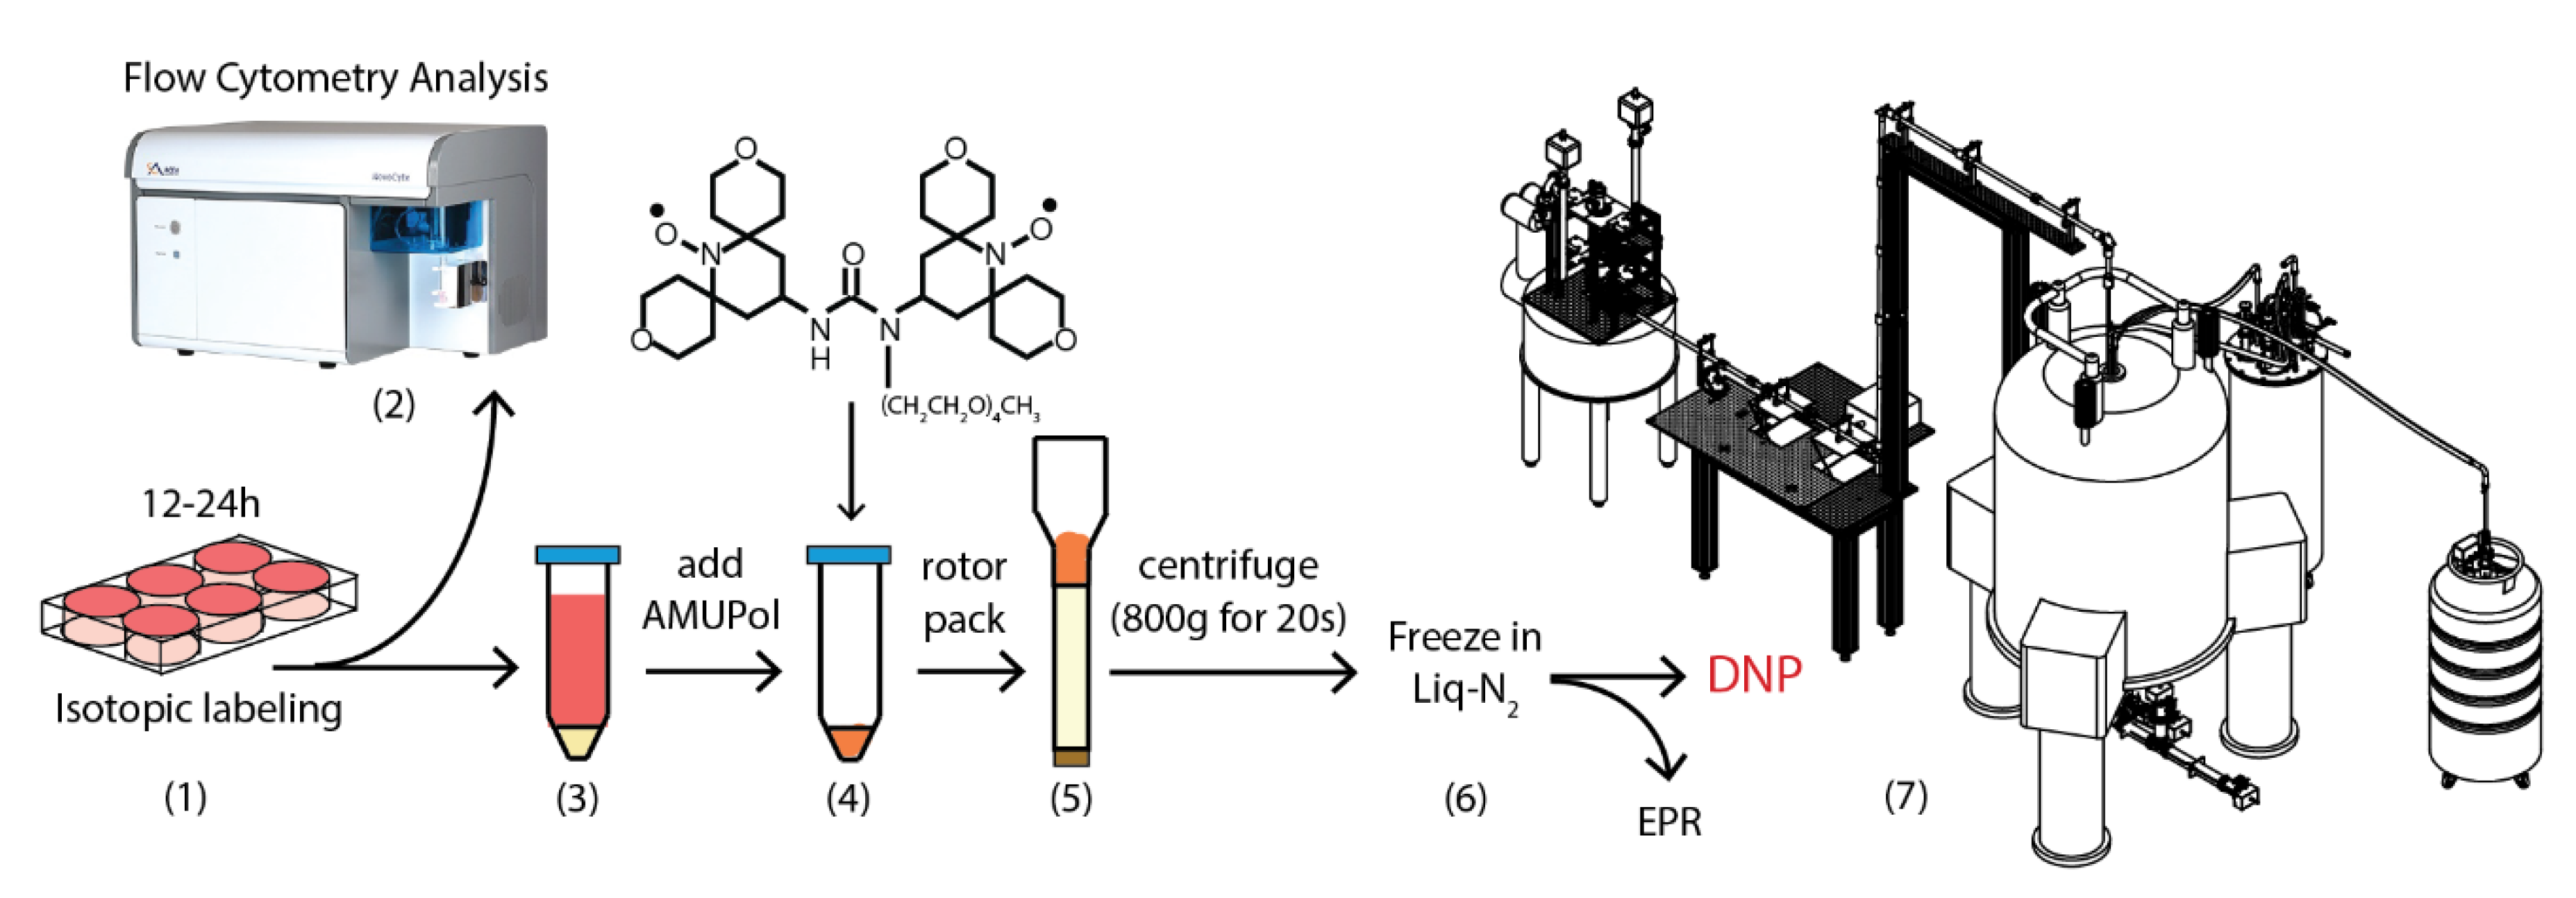
Abstract
:1. Introduction
2. Results and Discussion
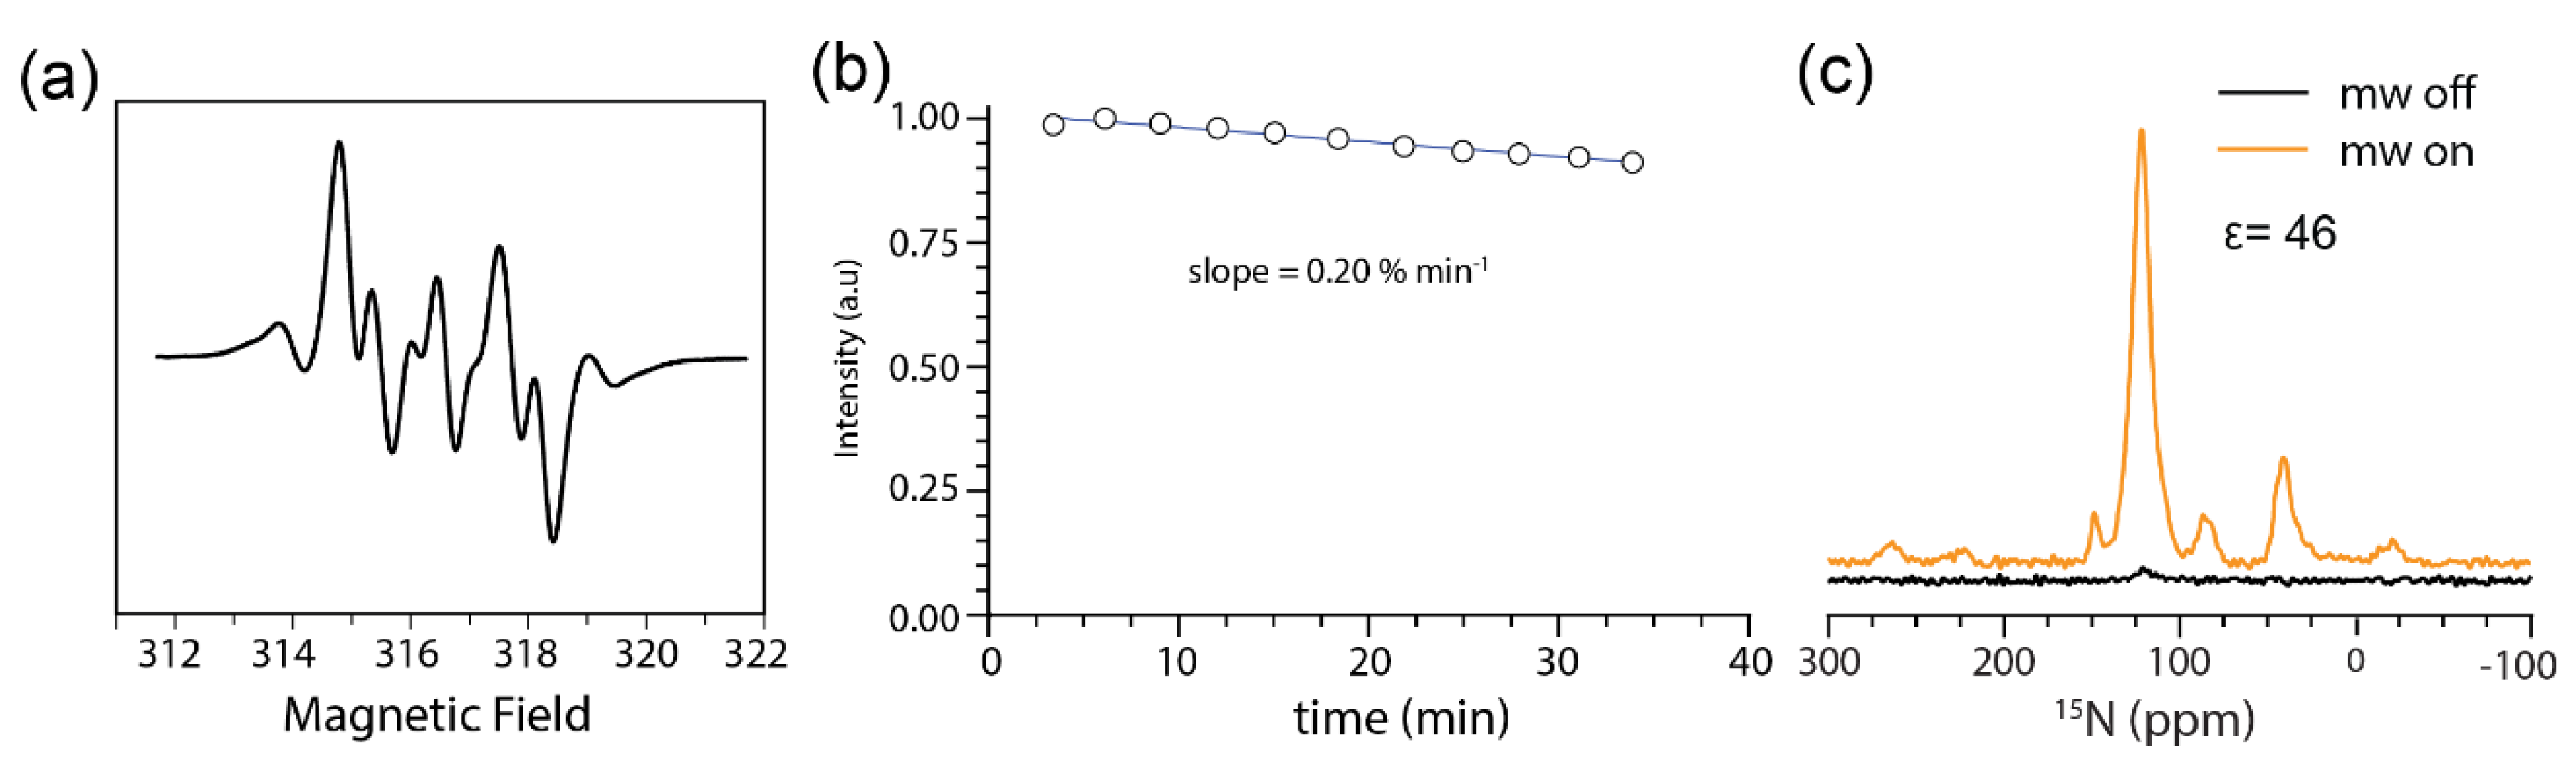
2.1. AMUPol is Stable in JLat T Cells
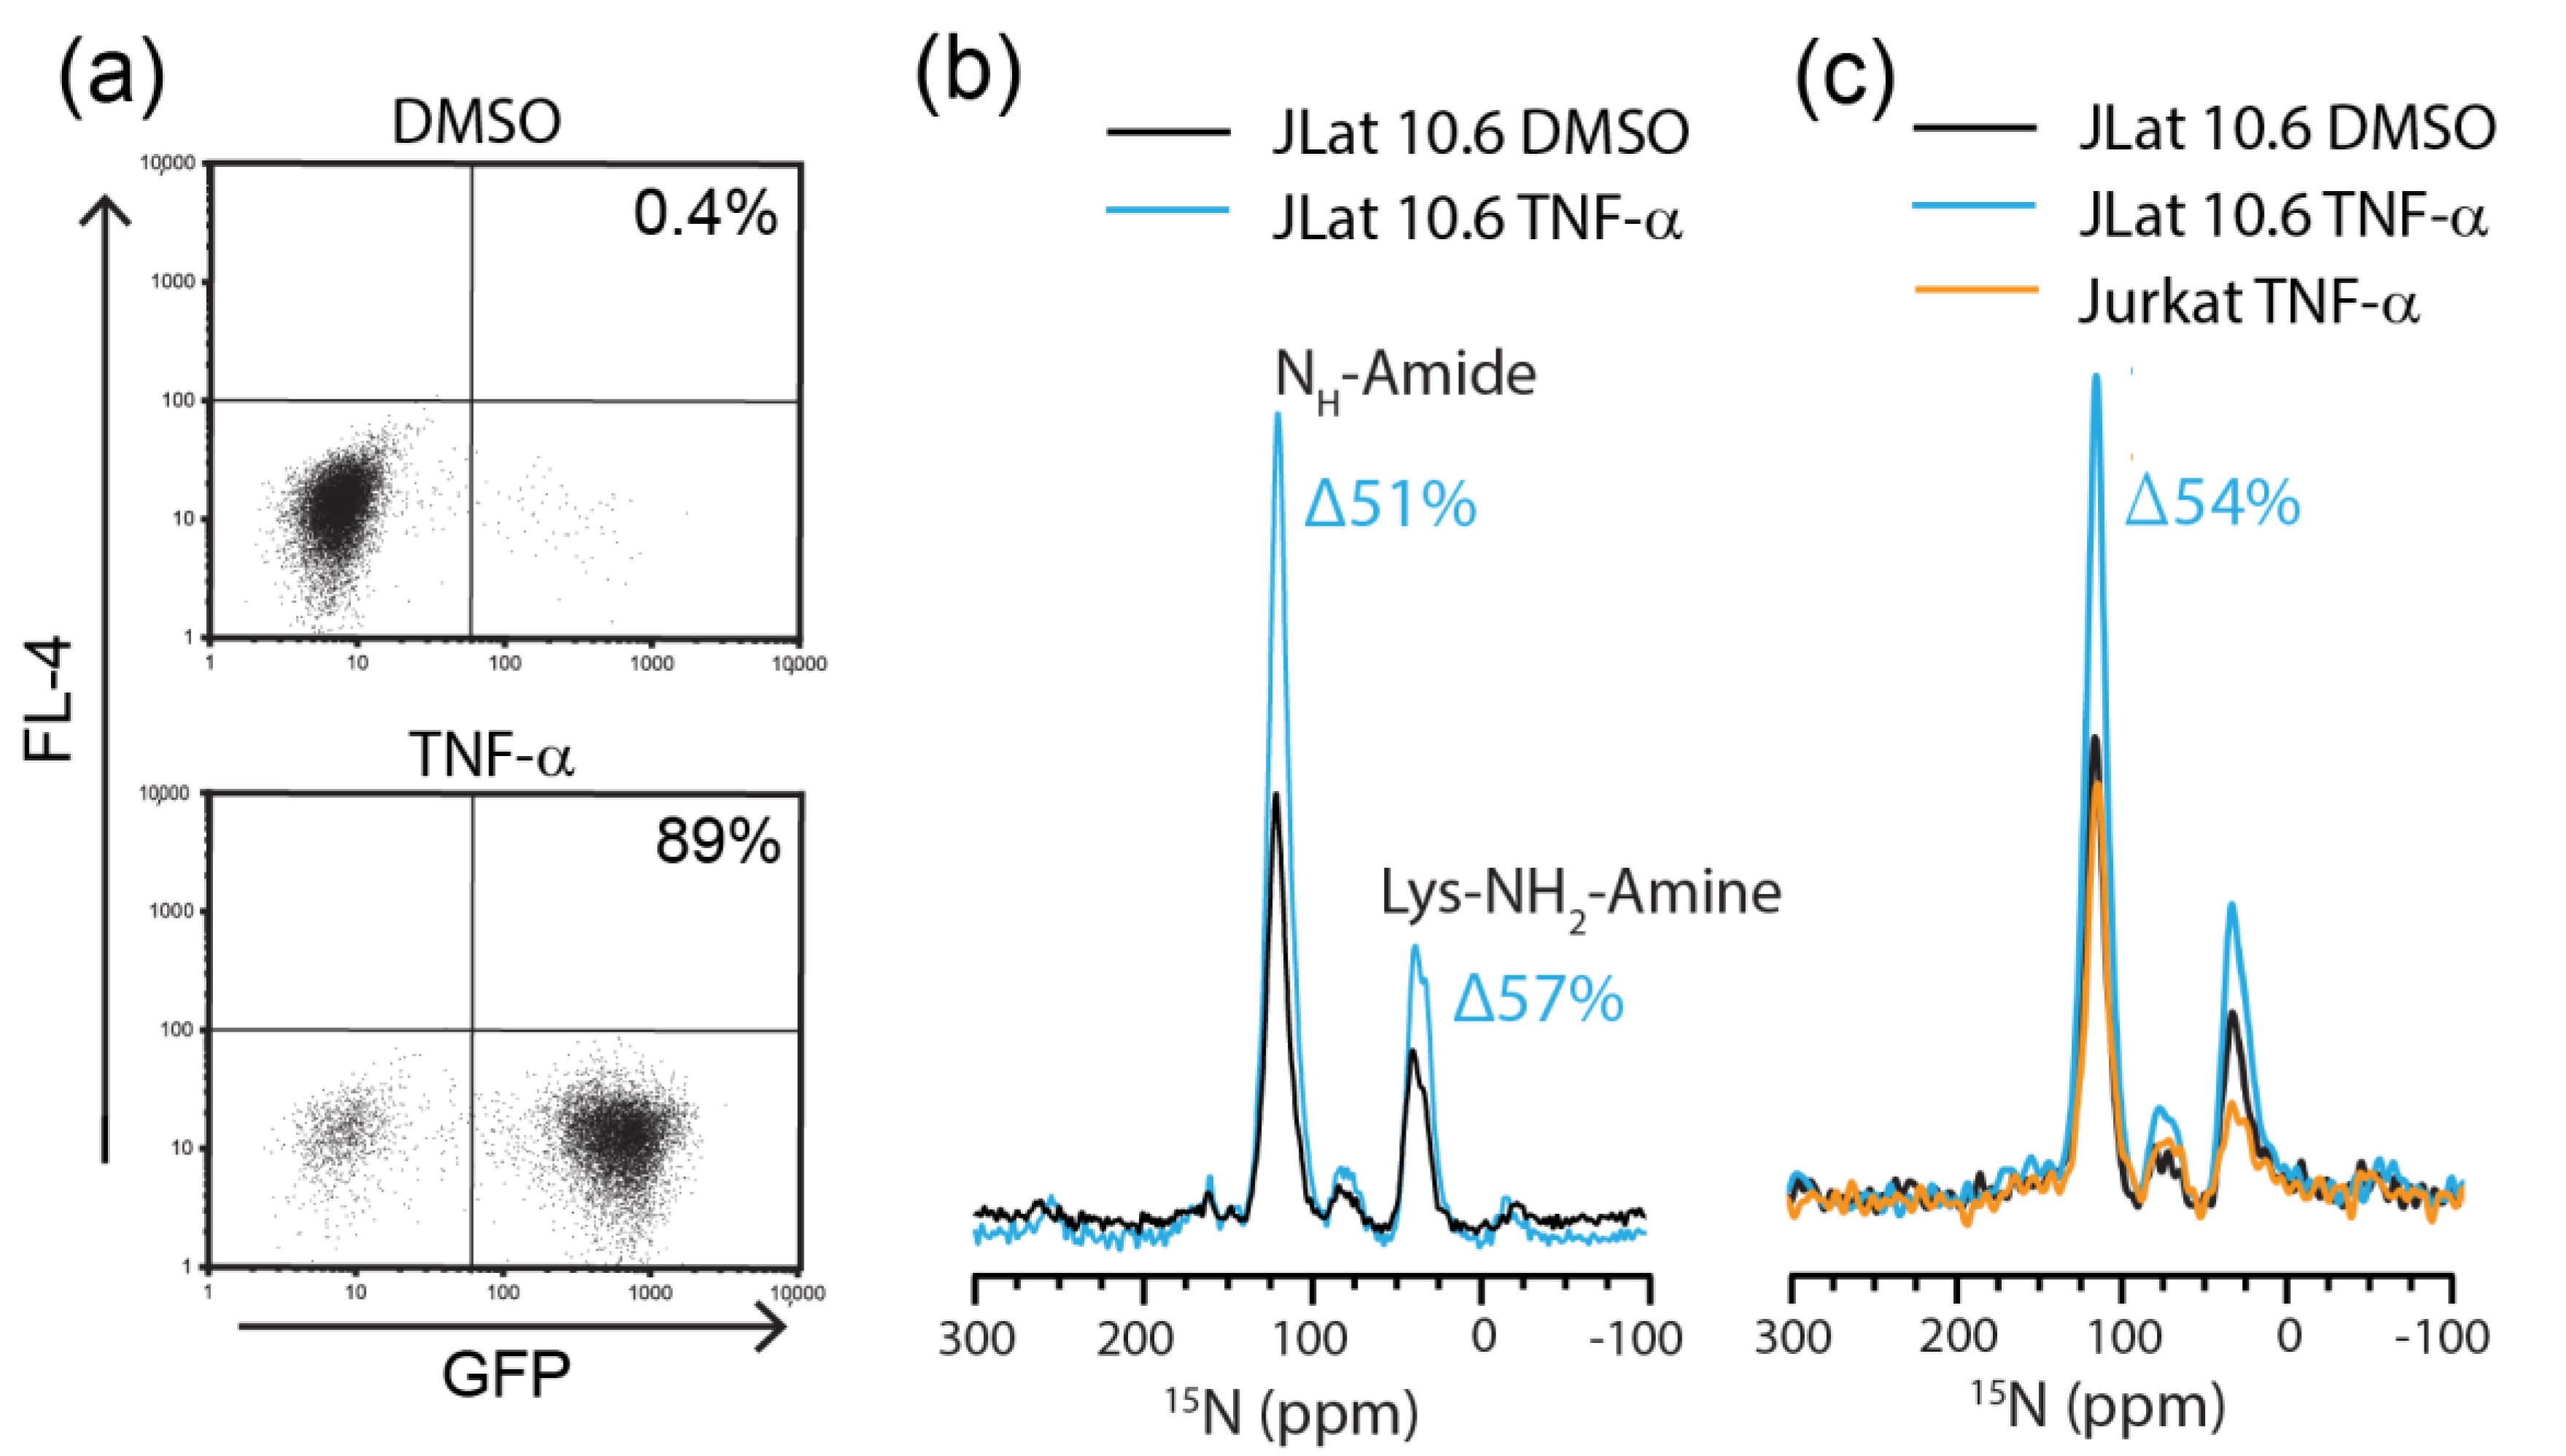
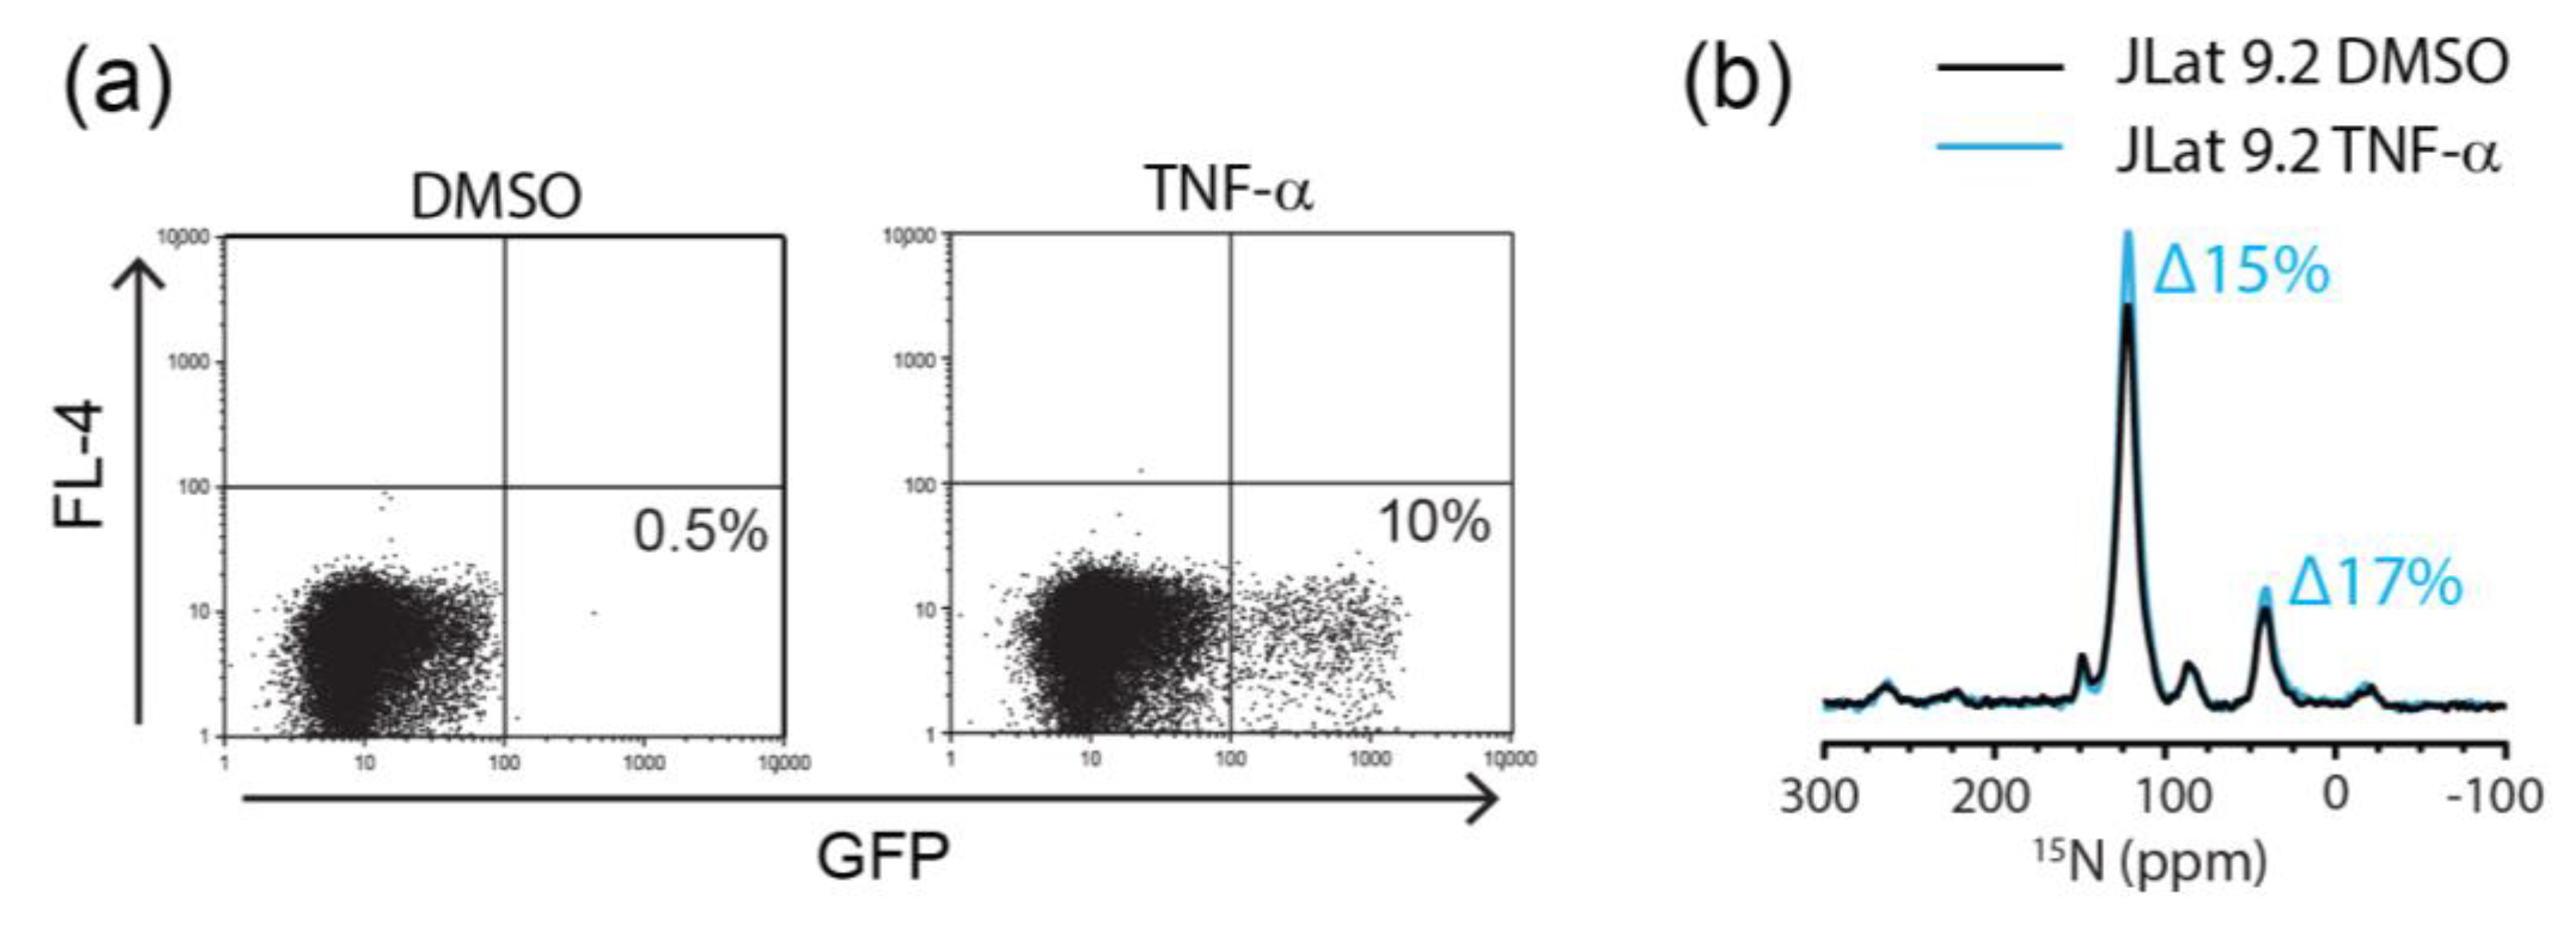
2.2. Detection of Endogenously Expressed HIV Proteins by DNP-MAS NMR
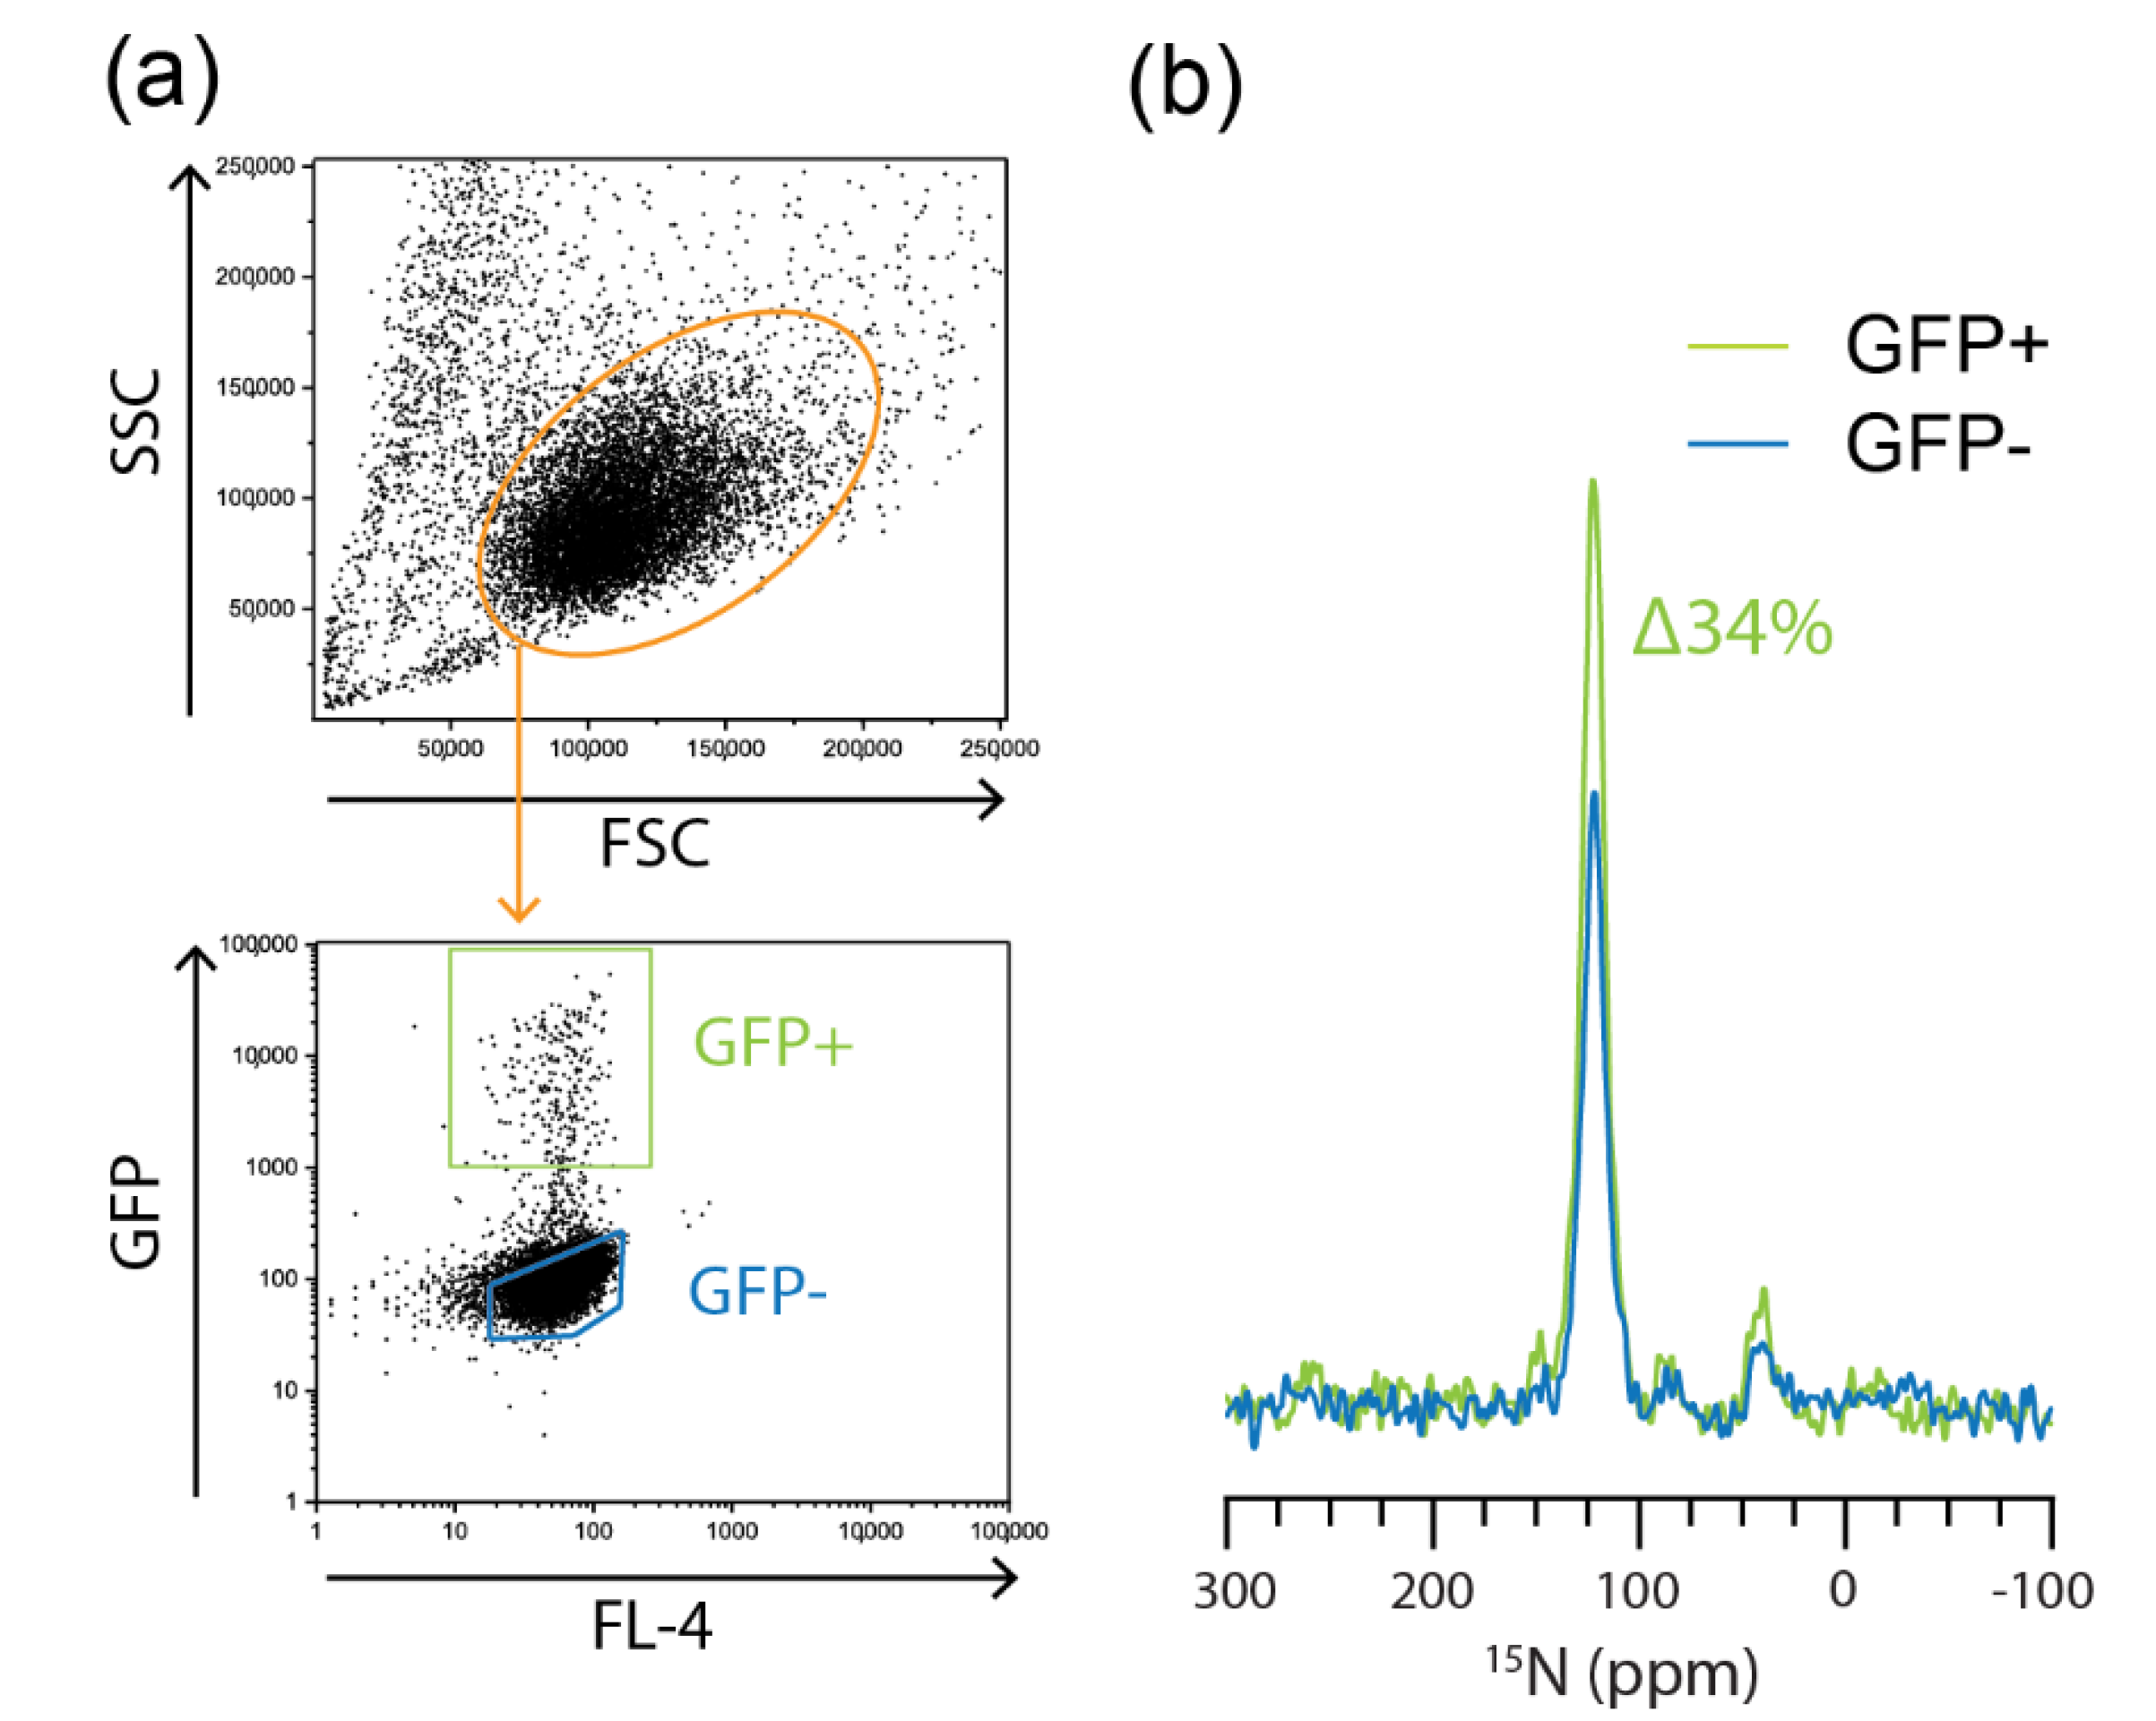
2.3. Flow Cytometric Sorting Improves Cell Homogeneity
3. Materials and Methods
3.1. Cell Lines and Cell Culture
3.2. HIV Reactivation
3.3. Sample Preparation
3.4. NMR Data Collection
3.5. EPR Analysis
3.6. Flow Cytometry Analysis
Supplementary Materials
Author Contributions
Funding
Acknowledgments
Conflicts of Interest
Abbreviations
| cRPMI | Complete Roswell Park Memorial Institute |
| DNP | Dynamic nuclear polarizations |
| FACS | Fluorescence-activated cell sorting |
| HIV | Human immunodeficiency virus |
| JLat | Jurkat latency model |
| NMR | Nuclear magnetic resonance |
| PKC | Protein kinase C |
| TNF-α | Tumor necrosis factor alpha |
| DMSO | Dimethyl sulfoxide |
| GFP | Green fluorescent protein |
| MAS | Magic angle spinning |
| HEK | Human embryonic kidney cells |
| PBS | Phosphate buffered saline |
| CPMAS | Cross polarization magic angle spinning |
References
- Yang, H.; Staveness, D.; Ryckbosch, S.M.; Axtman, A.D.; Loy, B.A.; Barnes, A.B.; Pande, V.S.; Schaefer, J.; Wender, P.A.; Cegelski, L. REDOR NMR Reveals Multiple Conformers for a Protein Kinase C Ligand in a Membrane Environment. ACS Central Sci. 2018, 4, 89–96. [Google Scholar] [CrossRef] [Green Version]
- Tuttle, M.D.; Comellas, G.; Nieuwkoop, A.J.; Covell, D.J.; Berthold, D.A.; Kloepper, K.D.; Courtney, J.M.; Kim, J.K.; Barclay, A.M.; Kendall, A.; et al. Solid-state NMR structure of a pathogenic fibril of full-length human α-synuclein. Nat. Struct. Mol. Boil. 2016, 23, 409–415. [Google Scholar] [CrossRef]
- Petkova, A.T.; Ishii, Y.; Balbach, J.J.; Antzutkin, O.N.; Leapman, R.D.; Delaglio, F.; Tycko, R. A structural model for Alzheimer’s β-amyloid fibrils based on experimental constraints from solid state NMR. Proc. Natl. Acad. Sci. USA 2002, 99, 16742–16747. [Google Scholar] [CrossRef] [Green Version]
- Hoop, C.L.; Lin, H.-K.; Kar, K.; Magyarfalvi, G.; Lamley, J.M.; Boatz, J.C.; Mandal, A.; Lewandowski, J.R.; Wetzel, R.; Van Der Wel, P.C. Huntingtin exon 1 fibrils feature an interdigitated β-hairpin–based polyglutamine core. Proc. Natl. Acad. Sci. USA 2016, 113, 1546–1551. [Google Scholar] [CrossRef] [Green Version]
- Kang, X.; Kirui, A.; Muszyński, A.; Widanage, M.C.D.; Chen, A.; Azadi, P.; Wang, P.; Mentink-Vigier, F.; Wang, T. Molecular architecture of fungal cell walls revealed by solid-state NMR. Nat. Commun. 2018, 9, 2747. [Google Scholar] [CrossRef] [Green Version]
- Wang, T.; Phyo, P.; Hong, M. Multidimensional solid-state NMR spectroscopy of plant cell walls. Solid State Nucl. Magn. Reson. 2016, 78, 56–63. [Google Scholar] [CrossRef] [Green Version]
- Han, Y.; Ahn, J.; Concel, J.; Byeon, I.-J.L.; Gronenborn, A.M.; Yang, J.; Polenova, T. Solid-State NMR Studies of HIV-1 Capsid Protein Assemblies. J. Am. Chem. Soc. 2010, 132, 1976–1987. [Google Scholar] [CrossRef] [Green Version]
- Barbet-Massin, E.; Felletti, M.; Schneider, R.; Jehle, S.; Communie, G.; Martinez, N.; Jensen, M.R.; Ruigrok, R.W.; Emsley, L.; Lesage, A.; et al. Insights into the Structure and Dynamics of Measles Virus Nucleocapsids by 1H-detected Solid-state NMR. Biophys. J. 2014, 107, 941–946. [Google Scholar] [CrossRef] [Green Version]
- Sackett, K.; Nethercott, M.J.; Zheng, Z.; Weliky, D.P. Solid-state NMR spectroscopy of the HIV gp41 membrane fusion protein supports intermolecular antiparallel β sheet fusion peptide structure in the final six-helix bundle state. J. Mol. Boil. 2013, 426, 1077–1094. [Google Scholar] [CrossRef] [Green Version]
- Yao, H.; Lee, M.W.; Waring, A.J.; Wong, G.C.L.; Hong, M. Viral fusion protein transmembrane domain adopts β-strand structure to facilitate membrane topological changes for virus–cell fusion. Proc. Natl. Acad. Sci. USA 2015, 112, 10926–10931. [Google Scholar] [CrossRef] [Green Version]
- Werby, S.H.; Cegelski, L. Spectral comparisons of mammalian cells and intact organelles by solid-state NMR. J. Struct. Boil. 2018, 206, 49–54. [Google Scholar] [CrossRef]
- Inomata, K.; Ohno, A.; Tochio, H.; Isogai, S.; Tenno, T.; Nakase, I.; Takeuchi, T.; Futaki, S.; Ito, Y.; Hiroaki, H.; et al. High-resolution multi-dimensional NMR spectroscopy of proteins in human cells. Nature 2009, 458, 106–109. [Google Scholar] [CrossRef]
- Sakakibara, D.; Sasaki, A.; Ikeya, T.; Hamatsu, J.; Hanashima, T.; Mishima, M.; Yoshimasu, M.; Hayashi, N.; Mikawa, T.; Wälchli, M.; et al. Protein structure determination in living cells by in-cell NMR spectroscopy. Nature 2009, 458, 102–105. [Google Scholar] [CrossRef]
- Selenko, P.; Serber, Z.; Gadea, B.; Ruderman, J.; Wagner, G. Quantitative NMR analysis of the protein G B1 domain in Xenopus laevis egg extracts and intact oocytes. Proc. Natl. Acad. Sci. USA 2006, 103, 11904–11909. [Google Scholar] [CrossRef] [Green Version]
- Theillet, F.-X.; Binolfi, A.; Bekei, B.; Martorana, A.; Rose, H.M.; Stuiver, M.; Verzini, S.; Lorenz, R.; Van Rossum, M.; Goldfarb, D.; et al. Structural disorder of monomeric α-synuclein persists in mammalian cells. Nature 2016, 530, 45–50. [Google Scholar] [CrossRef] [Green Version]
- Poulhazan, A.; Arnold, A.A.; Warschawski, D.; Marcotte, I. Unambiguous Ex Situ and in Cell 2D 13C Solid-State NMR Characterization of Starch and Its Constituents. Int. J. Mol. Sci. 2018, 19, 3817. [Google Scholar] [CrossRef] [Green Version]
- Kubicki, D.J.; Rossini, A.J.; Purea, A.; Zagdoun, A.; Ouari, O.; Tordo, P.; Engelke, F.; Lesage, A.; Emsley, L. Amplifying Dynamic Nuclear Polarization of Frozen Solutions by Incorporating Dielectric Particles. J. Am. Chem. Soc. 2014, 136, 15711–15718. [Google Scholar] [CrossRef]
- König, A.; Schölzel, D.; Uluca, B.; Viennet, T.; Akbey, Ü.; Heise, H. Hyperpolarized MAS NMR of unfolded and misfolded proteins. Solid State Nucl. Magn. Reson. 2019, 98, 1–11. [Google Scholar] [CrossRef]
- Gupta, R.; Lu, M.; Hou, G.; Caporini, M.A.; Rosay, M.; Maas, W.; Struppe, J.; Suiter, C.; Ahn, J.; Byeon, I.-J.L.; et al. Dynamic Nuclear Polarization Enhanced MAS NMR Spectroscopy for Structural Analysis of HIV-1 Protein Assemblies. J. Phys. Chem. B 2016, 120, 329–339. [Google Scholar] [CrossRef] [Green Version]
- Joedicke, L.; Mao, J.; Kuenze, G.; Reinhart, C.; Kalavacherla, T.; A Jonker, H.R.; Richter, C.; Schwalbe, H.; Meiler, J.; Preu, J.; et al. The molecular basis of subtype selectivity of human kinin G-protein-coupled receptors. Nat. Methods 2018, 14, 284–290. [Google Scholar] [CrossRef]
- Smith, A.N.; Caporini, M.A.; Fanucci, G.E.; Long, J.R. A Method for Dynamic Nuclear Polarization Enhancement of Membrane Proteins. Angew. Chem. Int. Ed. 2014, 54, 1542–1546. [Google Scholar] [CrossRef] [PubMed]
- Wylie, B.J.; Dzikovski, B.G.; Pawsey, S.; Caporini, M.; Rosay, M.; Freed, J.H.; McDermott, A.E. Dynamic nuclear polarization of membrane proteins: Covalently bound spin-labels at protein-protein interfaces. J. Biomol. NMR 2015, 61, 361–367. [Google Scholar] [CrossRef] [Green Version]
- Linser, R.; Dasari, M.; Hiller, M.; Higman, V.A.; Fink, U.; Del Amo, J.M.L.; Markovic, S.; Handel, L.; Kessler, B.; Schmieder, P.; et al. Proton-Detected Solid-State NMR Spectroscopy of Fibrillar and Membrane Proteins. Angew. Chem. Int. Ed. 2011, 50, 4508–4512. [Google Scholar] [CrossRef] [Green Version]
- Albert, B.J.; Gao, C.; Sesti, E.L.; Saliba, E.P.; Alaniva, N.; Scott, F.J.; Sigurdsson, S.T.; Barnes, A.B. Dynamic Nuclear Polarization NMR in Human Cells Using Fluorescent Polarizing Agents. Biochemistry 2019, 57, 4741–4746. [Google Scholar] [CrossRef] [Green Version]
- Sauvee, C.; Rosay, M.; Casano, G.; Aussenac, F.; Weber, R.T.; Ouari, O.; Tordo, P. Highly Efficient, Water-Soluble Polarizing Agents for Dynamic Nuclear Polarization at High Frequency. Angew. Chemie Int. Ed. 2013, 52, 10858. [Google Scholar] [CrossRef] [PubMed]
- Sani, M.-A.; Zhu, S.; Hofferek, V.; Separovic, F. Nitroxide spin–labeled peptides for DNP-NMR in-cell studies. FASEB J. 2019, 33, 11021–11027. [Google Scholar] [CrossRef] [PubMed] [Green Version]
- Schlagnitweit, J.; Sandoz, S.F.; Jaworski, A.; Guzzetti, I.; Aussenac, F.; Carbajo, R.J.; Chiarparin, E.; Pell, A.J.; Petzold, K. Observing an Antisense Drug Complex in Intact Human Cells by in-Cell NMR Spectroscopy. ChemBioChem 2019, 20, 2474–2478. [Google Scholar] [CrossRef] [PubMed]
- Narasimhan, S.; Scherpe, S.; Paioni, A.L.; Van Der Zwan, J.; Folkers, G.E.; Ovaa, H.; Baldus, M. DNP-Supported Solid-State NMR Spectroscopy of Proteins Inside Mammalian Cells. Angew. Chem. Int. Ed. 2019, 58, 12969–12973. [Google Scholar] [CrossRef] [Green Version]
- Yamamoto, K.; Caporini, M.A.; Im, S.-C.; Waskell, L.; Ramamoorthy, A. Cellular solid-state NMR investigation of a membrane protein using dynamic nuclear polarization. Biochim. et Biophys. Acta (BBA) - Bioenerg. 2014, 1848, 342–349. [Google Scholar] [CrossRef] [PubMed] [Green Version]
- Finzi, D.; Hermankova, M.; Pierson, T.; Carruth, L.M.; Buck, C.B.; Chaisson, R.E.; Quinn, T.C.; Chadwick, K.; Margolick, J.; Brookmeyer, R.; et al. Identification of a Reservoir for HIV-1 in Patients on Highly Active Antiretroviral Therapy. Sci. 1997, 278, 1295–1300. [Google Scholar] [CrossRef]
- Wong, J.K.; Hezareh, M.; Günthard, H.F.; Havlir, D.V.; Ignacio, C.C.; Spina, C.A.; Richman, D.D. Recovery of Replication-Competent HIV Despite Prolonged Suppression of Plasma Viremia. Sci. 1997, 278, 1291–1295. [Google Scholar] [CrossRef]
- Chun, T.-W.; Carruth, L.; Finzi, D.; Shen, X.; DiGiuseppe, J.A.; Taylor, H.; Hermankova, M.; Chadwick, K.; Margolick, J.; Quinn, T.C.; et al. Quantification of latent tissue reservoirs and total body viral load in HIV-1 infection. Nature 1997, 387, 183–188. [Google Scholar] [CrossRef] [PubMed]
- Gulick, R.; Mellors, J.W.; Havlir, D.; Eron, J.J.; Gonzalez, C.; McMahon, D.; Richman, D.D.; Valentine, F.; Jonas, L.; Meibohm, A.; et al. Treatment with Indinavir, Zidovudine, and Lamivudine in Adults with Human Immunodeficiency Virus Infection and Prior Antiretroviral Therapy. New Engl. J. Med. 1997, 337, 734–739. [Google Scholar] [CrossRef] [Green Version]
- Hammer, S.M.; Squires, K.; Hughes, M.D.; Grimes, J.M.; Demeter, L.M.; Currier, J.; Eron, J.J.; Feinberg, J.E.; Balfour, H.H.; Deyton, L.R.; et al. A Controlled Trial of Two Nucleoside Analogues plus Indinavir in Persons with Human Immunodeficiency Virus Infection and CD4 Cell Counts of 200 per Cubic Millimeter or Less. New Engl. J. Med. 1997, 337, 725–733. [Google Scholar] [CrossRef] [Green Version]
- Xing, S.; Siliciano, R.F. Targeting HIV latency: Pharmacologic strategies toward eradication. Drug Discov. Today 2012, 18, 541–551. [Google Scholar] [CrossRef] [Green Version]
- Marsden, M.D.; Wu, X.; Navab, S.M.; Loy, B.A.; Schrier, A.J.; DeChristopher, B.A.; Shimizu, A.J.; Hardman, C.T.; Ho, S.; Ramirez, C.M.; et al. Characterization of designed, synthetically accessible bryostatin analog HIV latency reversing agents. Virol. 2018, 520, 83–93. [Google Scholar] [CrossRef]
- DeChristopher, B.A.; Loy, B.A.; Marsden, M.D.; Schrier, A.J.; Zack, J.A.; Wender, P.A. Designed, synthetically accessible bryostatin analogues potently induce activation of latent HIV reservoirs in vitro. Nat. Chem. 2012, 4, 705–710. [Google Scholar] [CrossRef]
- Albert, B.J.; Niu, A.; Ramani, R.; Marshall, G.R.; Wender, P.A.; Williams, R.M.; Ratner, L.; Barnes, A.B.; Kyei, G.B. Combinations of isoform-targeted histone deacetylase inhibitors and bryostatin analogues display remarkable potency to activate latent HIV without global T-cell activation. Sci. Rep. 2017, 7, 7456. [Google Scholar] [CrossRef] [Green Version]
- Matalon, S.; Rasmussen, T.A.; A Dinarello, C. Histone Deacetylase Inhibitors for Purging HIV-1 from the Latent Reservoir. Mol. Med. 2011, 17, 466–472. [Google Scholar] [CrossRef]
- Archin, N.M.; Liberty, A.L.; Kashuba, A.D.; Choudhary, S.K.; Kuruc, J.D.; Crooks, A.M.; Parker, D.C.; Anderson, E.M.; Kearney, M.F.; Strain, M.C.; et al. Administration of vorinostat disrupts HIV-1 latency in patients on antiretroviral therapy. Nature 2012, 487, 482. [Google Scholar] [CrossRef] [Green Version]
- Loy, B.A.; Lesser, A.B.; Staveness, D.; Billingsley, K.L.; Cegelski, L.; Wender, P.A. Toward a Biorelevant Structure of Protein Kinase C Bound Modulators: Design, Synthesis, and Evaluation of Labeled Bryostatin Analogues for Analysis with Rotational Echo Double Resonance NMR Spectroscopy. J. Am. Chem. Soc. 2015, 137, 3678–3685. [Google Scholar] [CrossRef] [PubMed] [Green Version]
- Jordan, A.; Bisgrove, D.; Verdin, E. HIV reproducibly establishes a latent infection after acute infection of T cells in vitro. EMBO J. 2003, 22, 1868–1877. [Google Scholar] [CrossRef] [Green Version]
- Jordan, A.; Defechereux, P.; Verdin, E. The site of HIV-1 integration in the human genome determines basal transcriptional activity and response to Tat transactivation. EMBO J. 2001, 20, 1726–1738. [Google Scholar] [CrossRef] [PubMed] [Green Version]
- William, S.A.; Chen, L.; Kwon, H.; Fenard, D.; Bisgrove, D.; Verdin, E.; Greene, W.C. Prostratin antagonizes HIV latency by activating NF-kB. J. Biol. Chem. 2014, 279, 42008–42017. [Google Scholar] [CrossRef] [PubMed] [Green Version]
- Duh, E.J.; Maury, W.J.; Folks, T.M.; Fauci, A.S.; Rabson, A.B. Tumor necrosis factor alpha activates human immunodeficiency virus type 1 through induction of nuclear factor binding to the NF-kB sites in the long terminal repeat. Proc. Natl. Acad. Sci. USA 1989, 86, 5974–5978. [Google Scholar] [CrossRef] [PubMed] [Green Version]
- McCoy, K.; Rogawski, R.; Stovicek, O.; McDermott, A.E. Stability of nitroxide biradical TOTAPOL in biological samples. J. Magn. Reson. 2019, 303, 115–120. [Google Scholar] [CrossRef]
- Krstić, I.; Hänsel, R.; Romainczyk, O.; Engels, J.W.; Dötsch, V.; Prisner, T.F.F. Long-Range Distance Measurements on Nucleic Acids in Cells by Pulsed EPR Spectroscopy. Angew. Chem. Int. Ed. 2011, 50, 5070–5074. [Google Scholar] [CrossRef]
- Igarashi, R.; Sakai, T.; Hara, H.; Tenno, T.; Tanaka, T.; Tochio, H.; Shirakawa, M. Distance Determination in Proteins inside Xenopus laevis Oocytes by Double Electron−Electron Resonance Experiments. J. Am. Chem. Soc. 2010, 132, 8228–8229. [Google Scholar] [CrossRef]
- Kathleen, A.; Liegler, T.; Al, P.E.T. Use of a Green Fluorescent Protein as a Marker for Human Immunodeficiency Virus Type 1 Infection. AIDS Res. Hum. Retrovir. 1997, 13, 1077–1081. [Google Scholar]
- Terahara, K.; Yamamoto, T.; Mitsuki, Y.-Y.; Shibusawa, K.; Ishige, M.; Mizukoshi, F.; Kobayashi, K.; Tsunetsugu-Yokota, Y. Fluorescent Reporter Signals, EGFP, and DsRed, Encoded in HIV-1 Facilitate the Detection of Productively Infected Cells and Cell-Associated Viral Replication Levels. Front. Microbiol. 2012, 2, 280. [Google Scholar] [CrossRef] [Green Version]
- Hernandez-Pando, R.; Rook, G.A. The role of TNF-alpha in T-cell-mediated inflammation depends on the Th1/Th2 cytokine balance. Immunology 1994, 82, 591–595. [Google Scholar] [PubMed]
- Bruner, K.M.; Hosmane, N.N.; Siliciano, R.F. Towards an HIV-1 cure: Measuring the latent reservoir. Trends Microbiol. 2015, 23, 192–203. [Google Scholar] [CrossRef] [PubMed] [Green Version]
- RPMI 1640. Available online: https://www.thermofisher.com/ch/en/home/technical-resources/media-formulation.114.html (accessed on 29 June 2020).
- Massiot, D.; Fayon, F.; Capron, M.; King, I.; Le Calvé, S.; Alonso, B.; Durand, J.-O.; Bujoli, B.; Gan, Z.; Hoatson, G. Modelling one- and two-dimensional solid-state NMR spectra. Magn. Reson. Chem. 2001, 40, 70–76. [Google Scholar] [CrossRef]


© 2020 by the authors. Licensee MDPI, Basel, Switzerland. This article is an open access article distributed under the terms and conditions of the Creative Commons Attribution (CC BY) license (http://creativecommons.org/licenses/by/4.0/).
Share and Cite
Overall, S.A.; Price, L.E.; Albert, B.J.; Gao, C.; Alaniva, N.; Judge, P.T.; Sesti, E.L.; Wender, P.A.; Kyei, G.B.; Barnes, A.B. In Situ Detection of Endogenous HIV Activation by Dynamic Nuclear Polarization NMR and Flow Cytometry. Int. J. Mol. Sci. 2020, 21, 4649. https://0-doi-org.brum.beds.ac.uk/10.3390/ijms21134649
Overall SA, Price LE, Albert BJ, Gao C, Alaniva N, Judge PT, Sesti EL, Wender PA, Kyei GB, Barnes AB. In Situ Detection of Endogenous HIV Activation by Dynamic Nuclear Polarization NMR and Flow Cytometry. International Journal of Molecular Sciences. 2020; 21(13):4649. https://0-doi-org.brum.beds.ac.uk/10.3390/ijms21134649
Chicago/Turabian StyleOverall, Sarah A., Lauren E. Price, Brice J. Albert, Chukun Gao, Nicholas Alaniva, Patrick T. Judge, Erika L. Sesti, Paul A. Wender, George B. Kyei, and Alexander B. Barnes. 2020. "In Situ Detection of Endogenous HIV Activation by Dynamic Nuclear Polarization NMR and Flow Cytometry" International Journal of Molecular Sciences 21, no. 13: 4649. https://0-doi-org.brum.beds.ac.uk/10.3390/ijms21134649