MCF7 Spheroid Development: New Insight about Spatio/Temporal Arrangements of TNTs, Amyloid Fibrils, Cell Connections, and Cellular Bridges

 , , , , and
Abstract
:1. Introduction
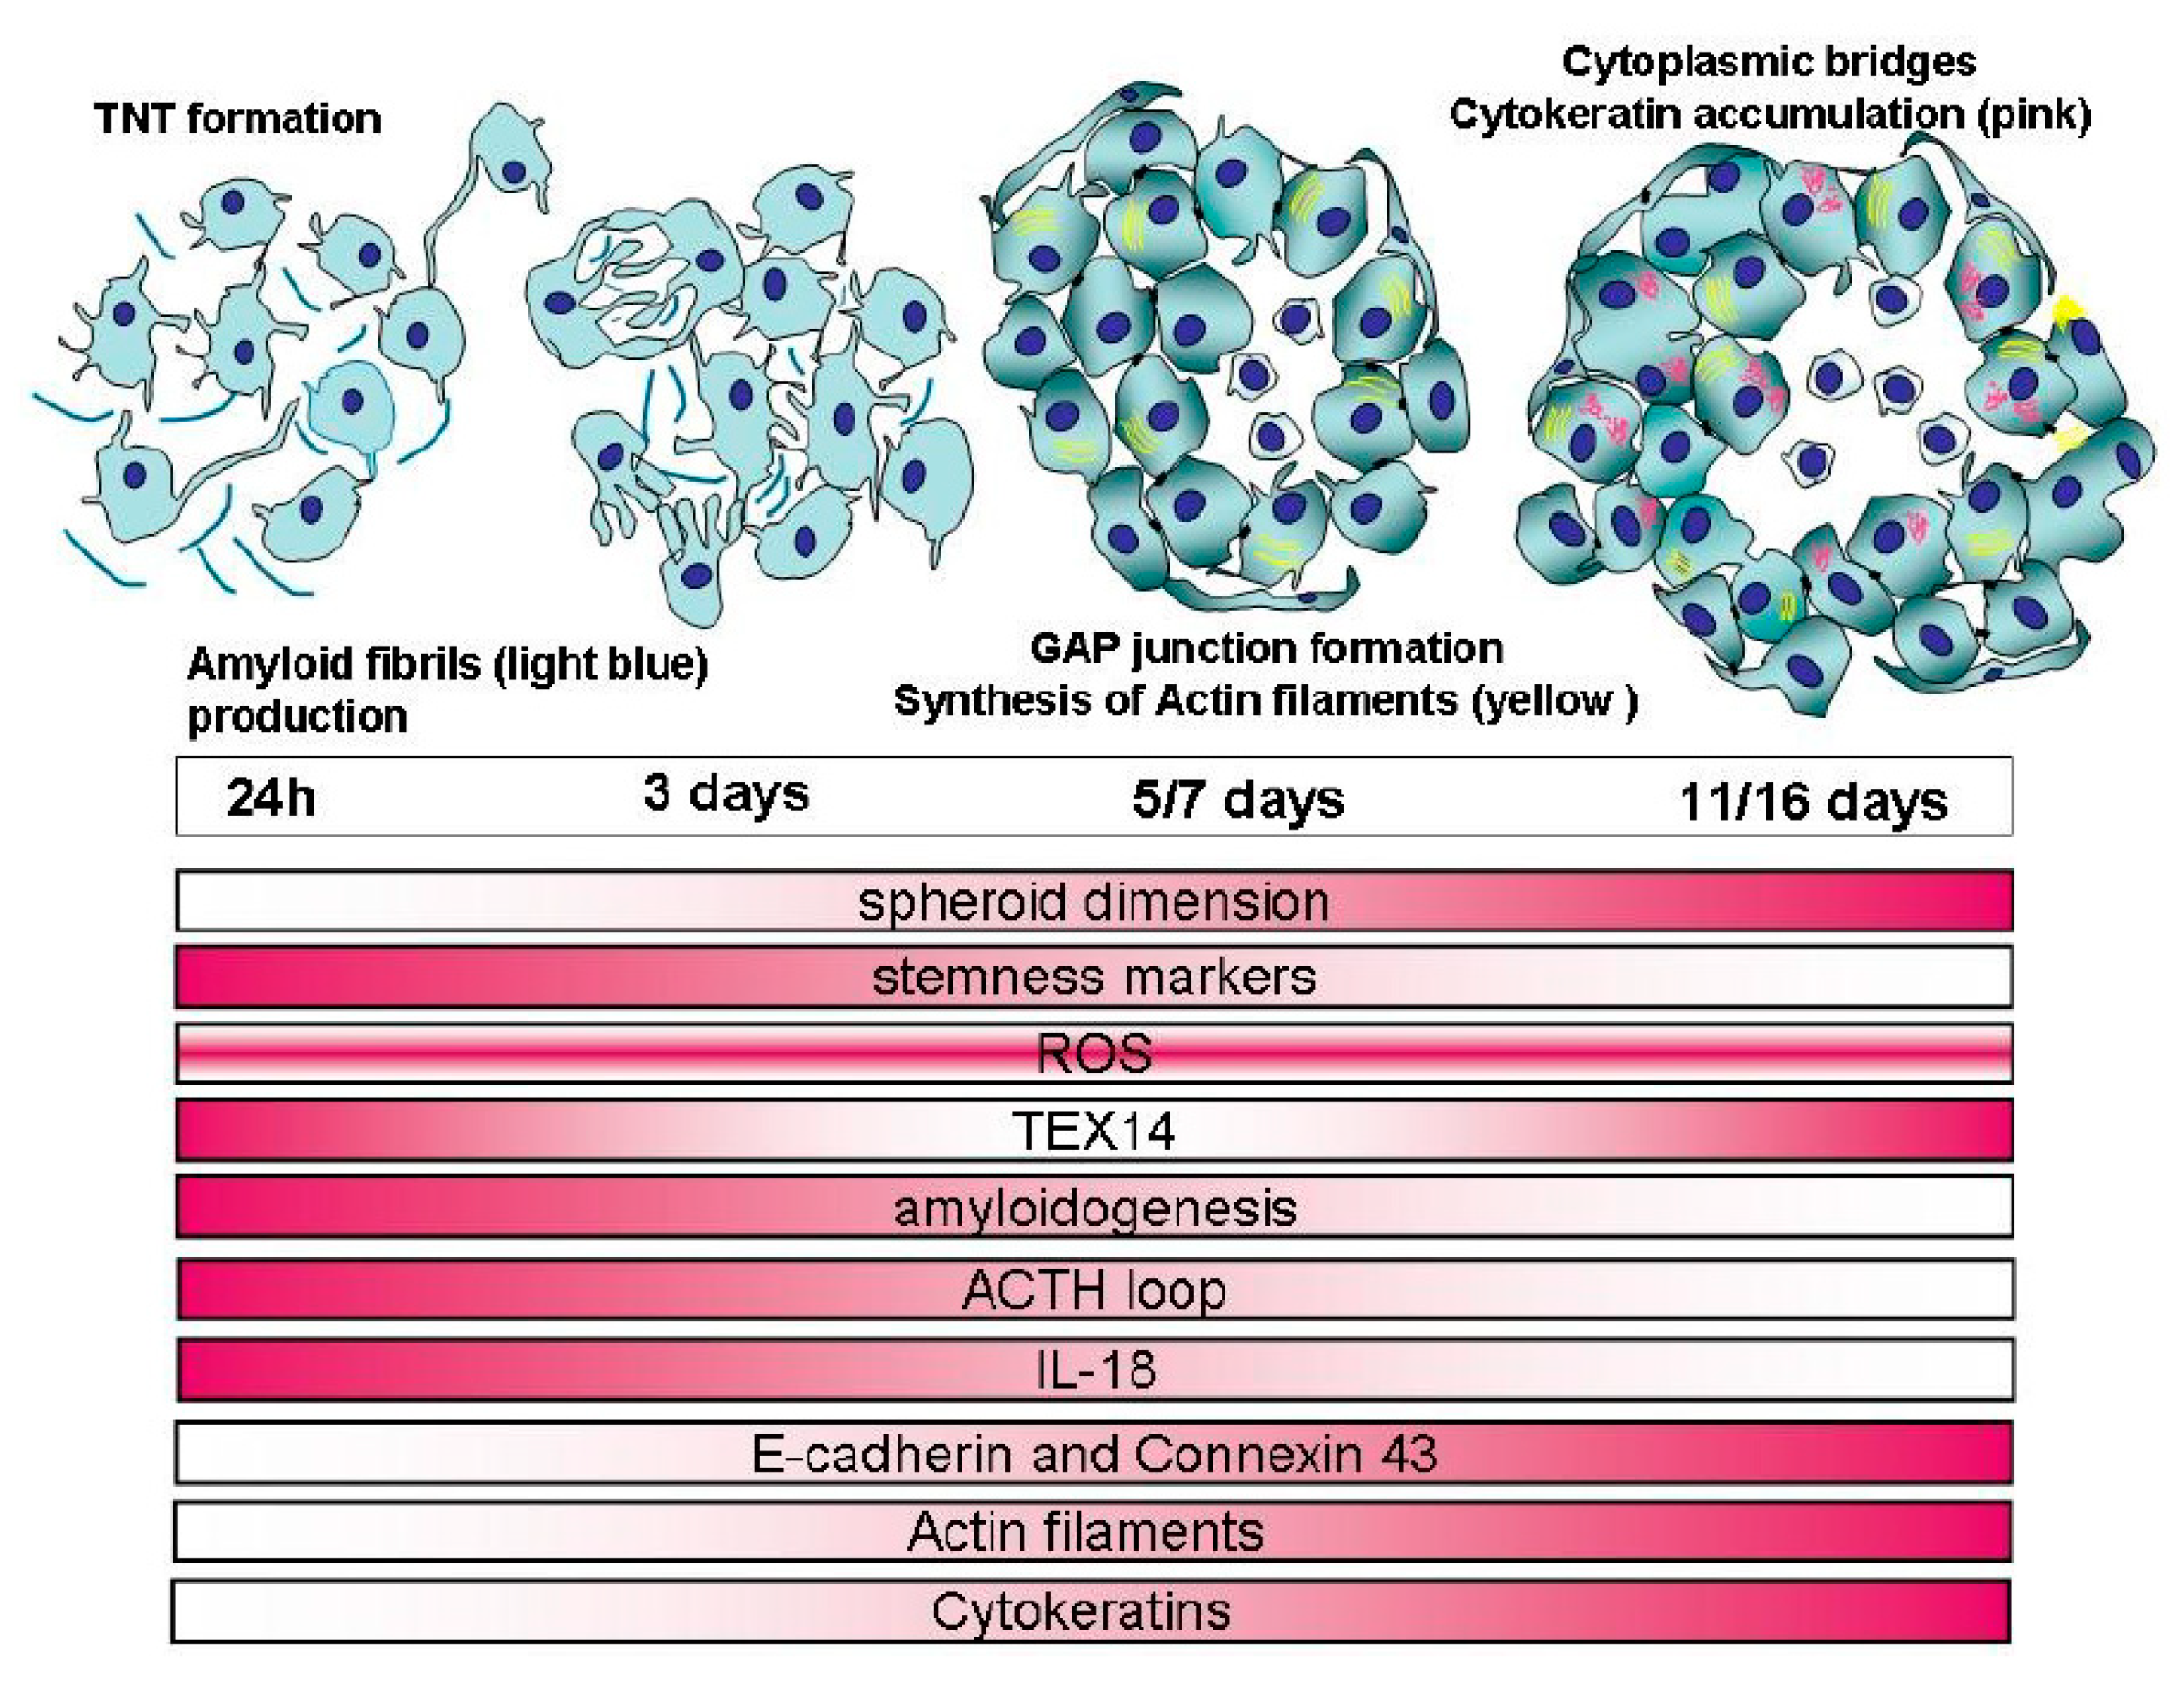
2. Results
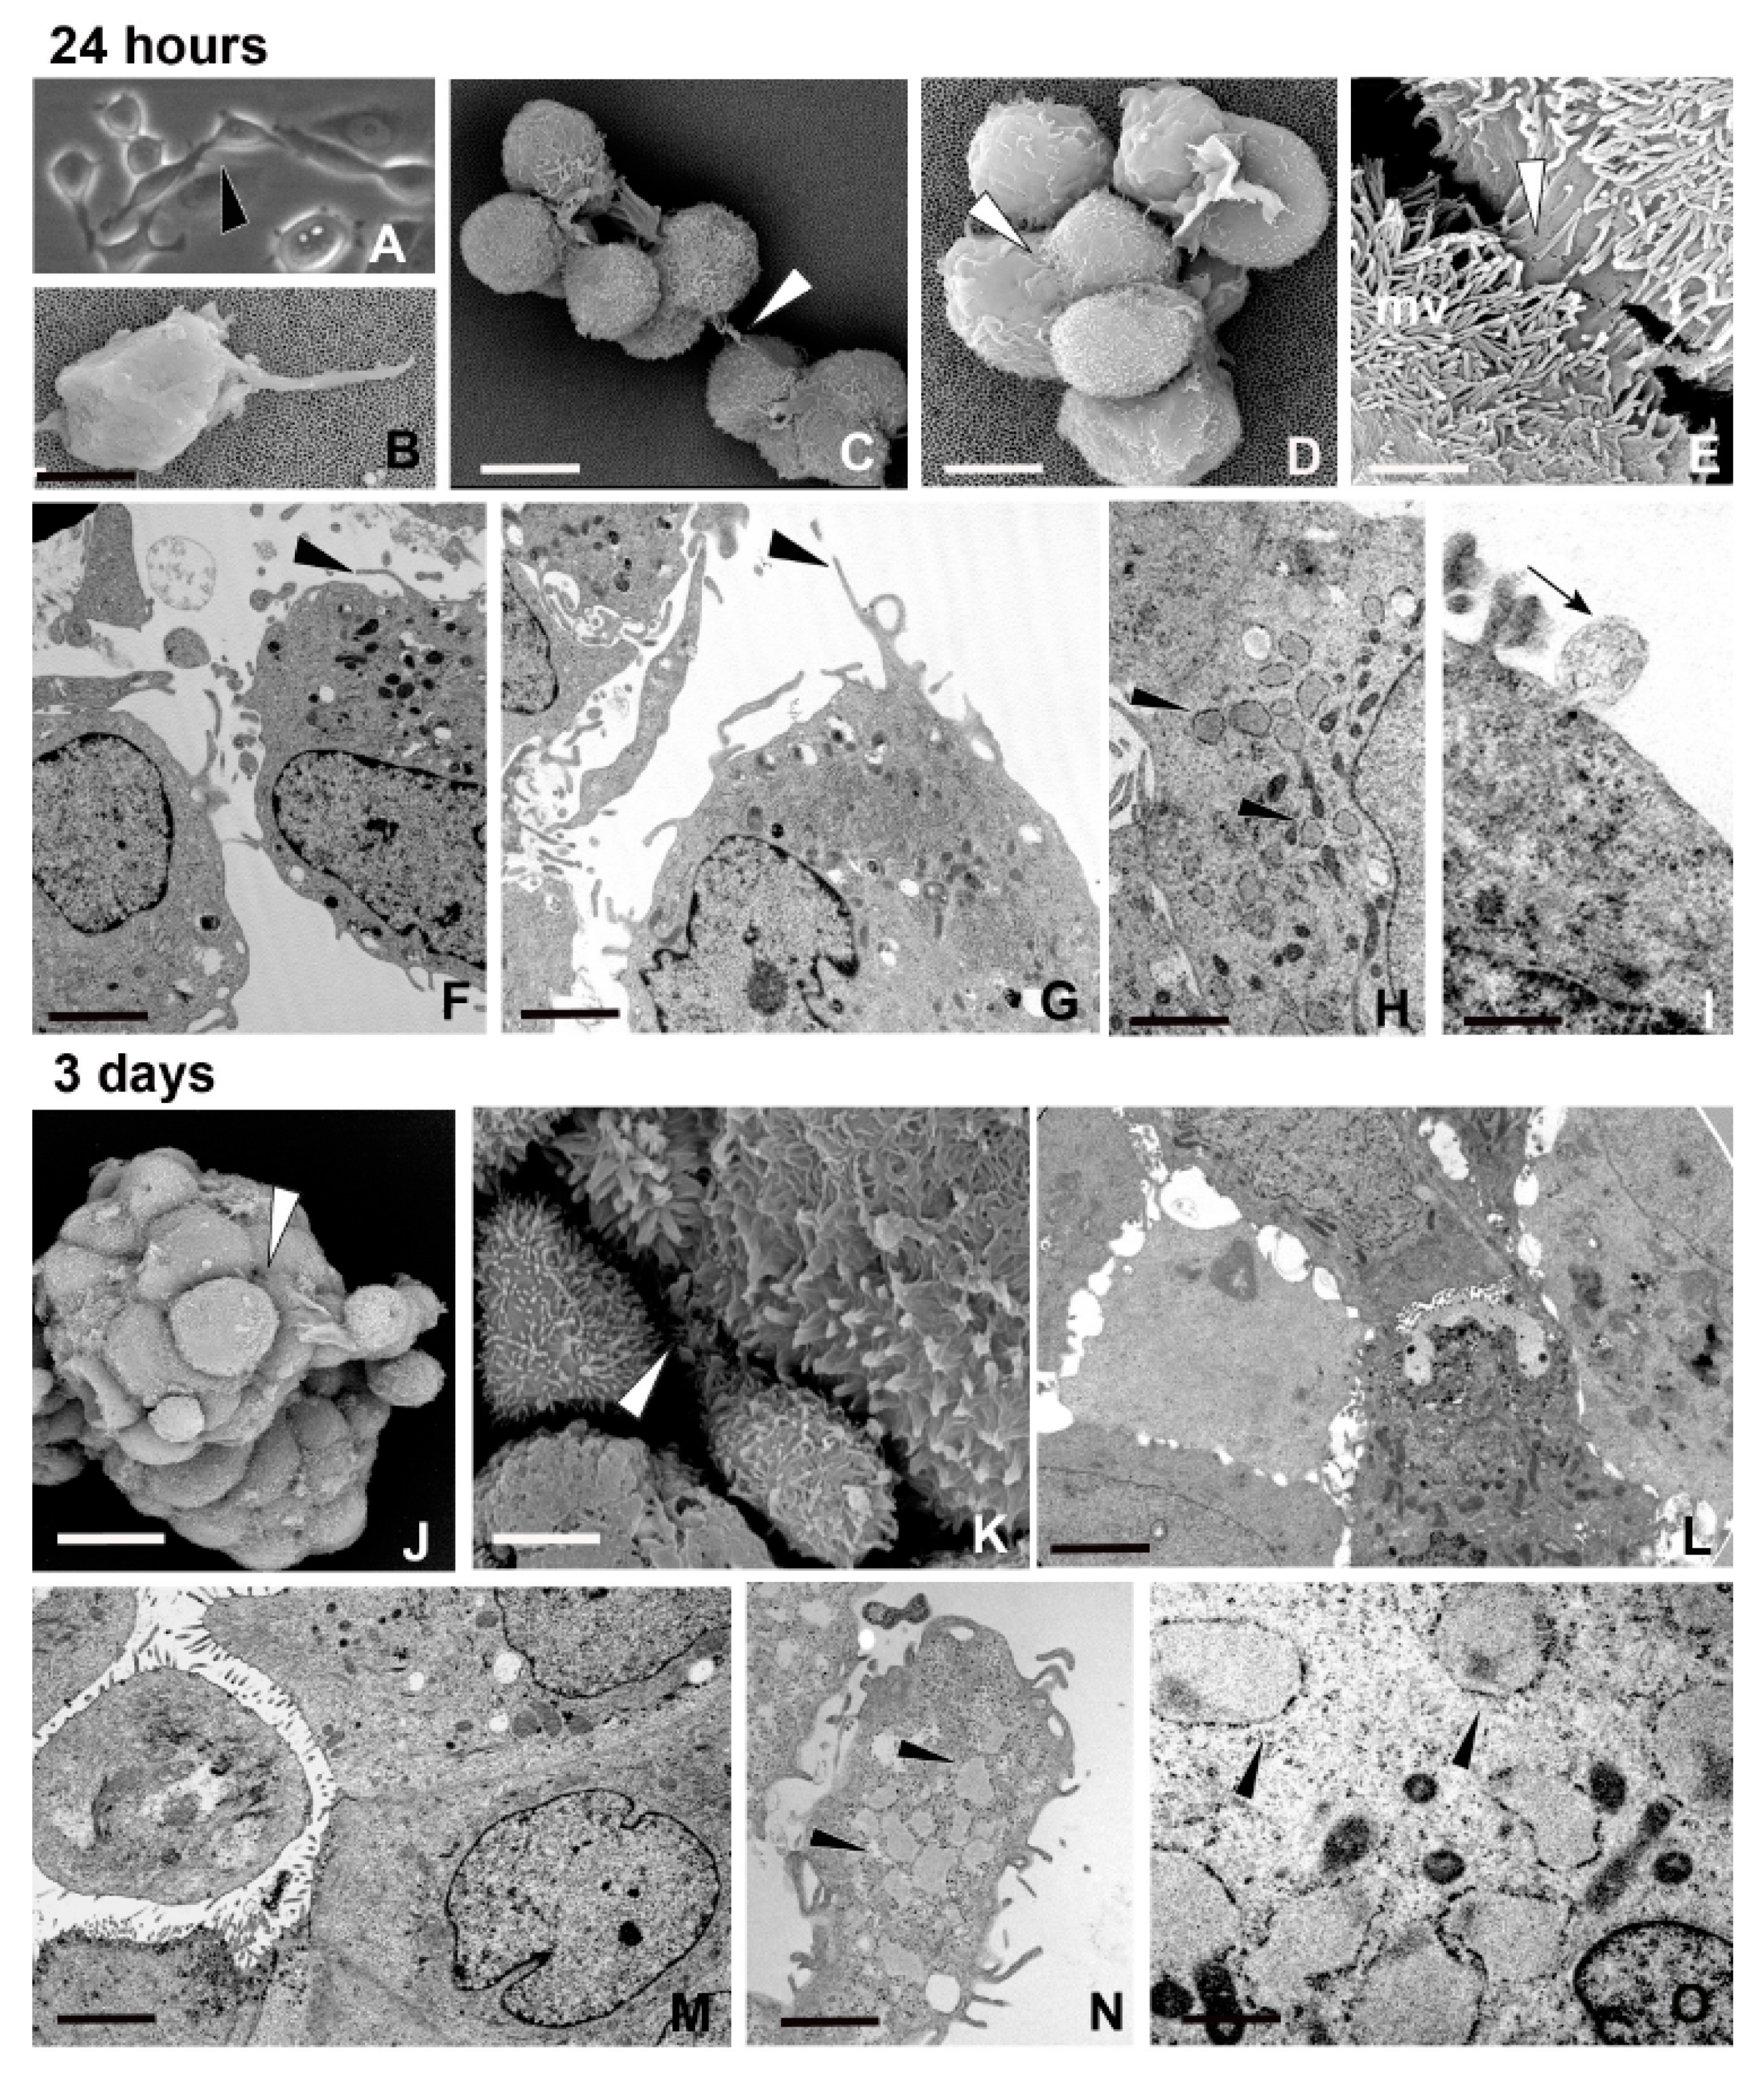
2.1. Spheroid Formation: Morphology and Behaviour of MCF7 Cells
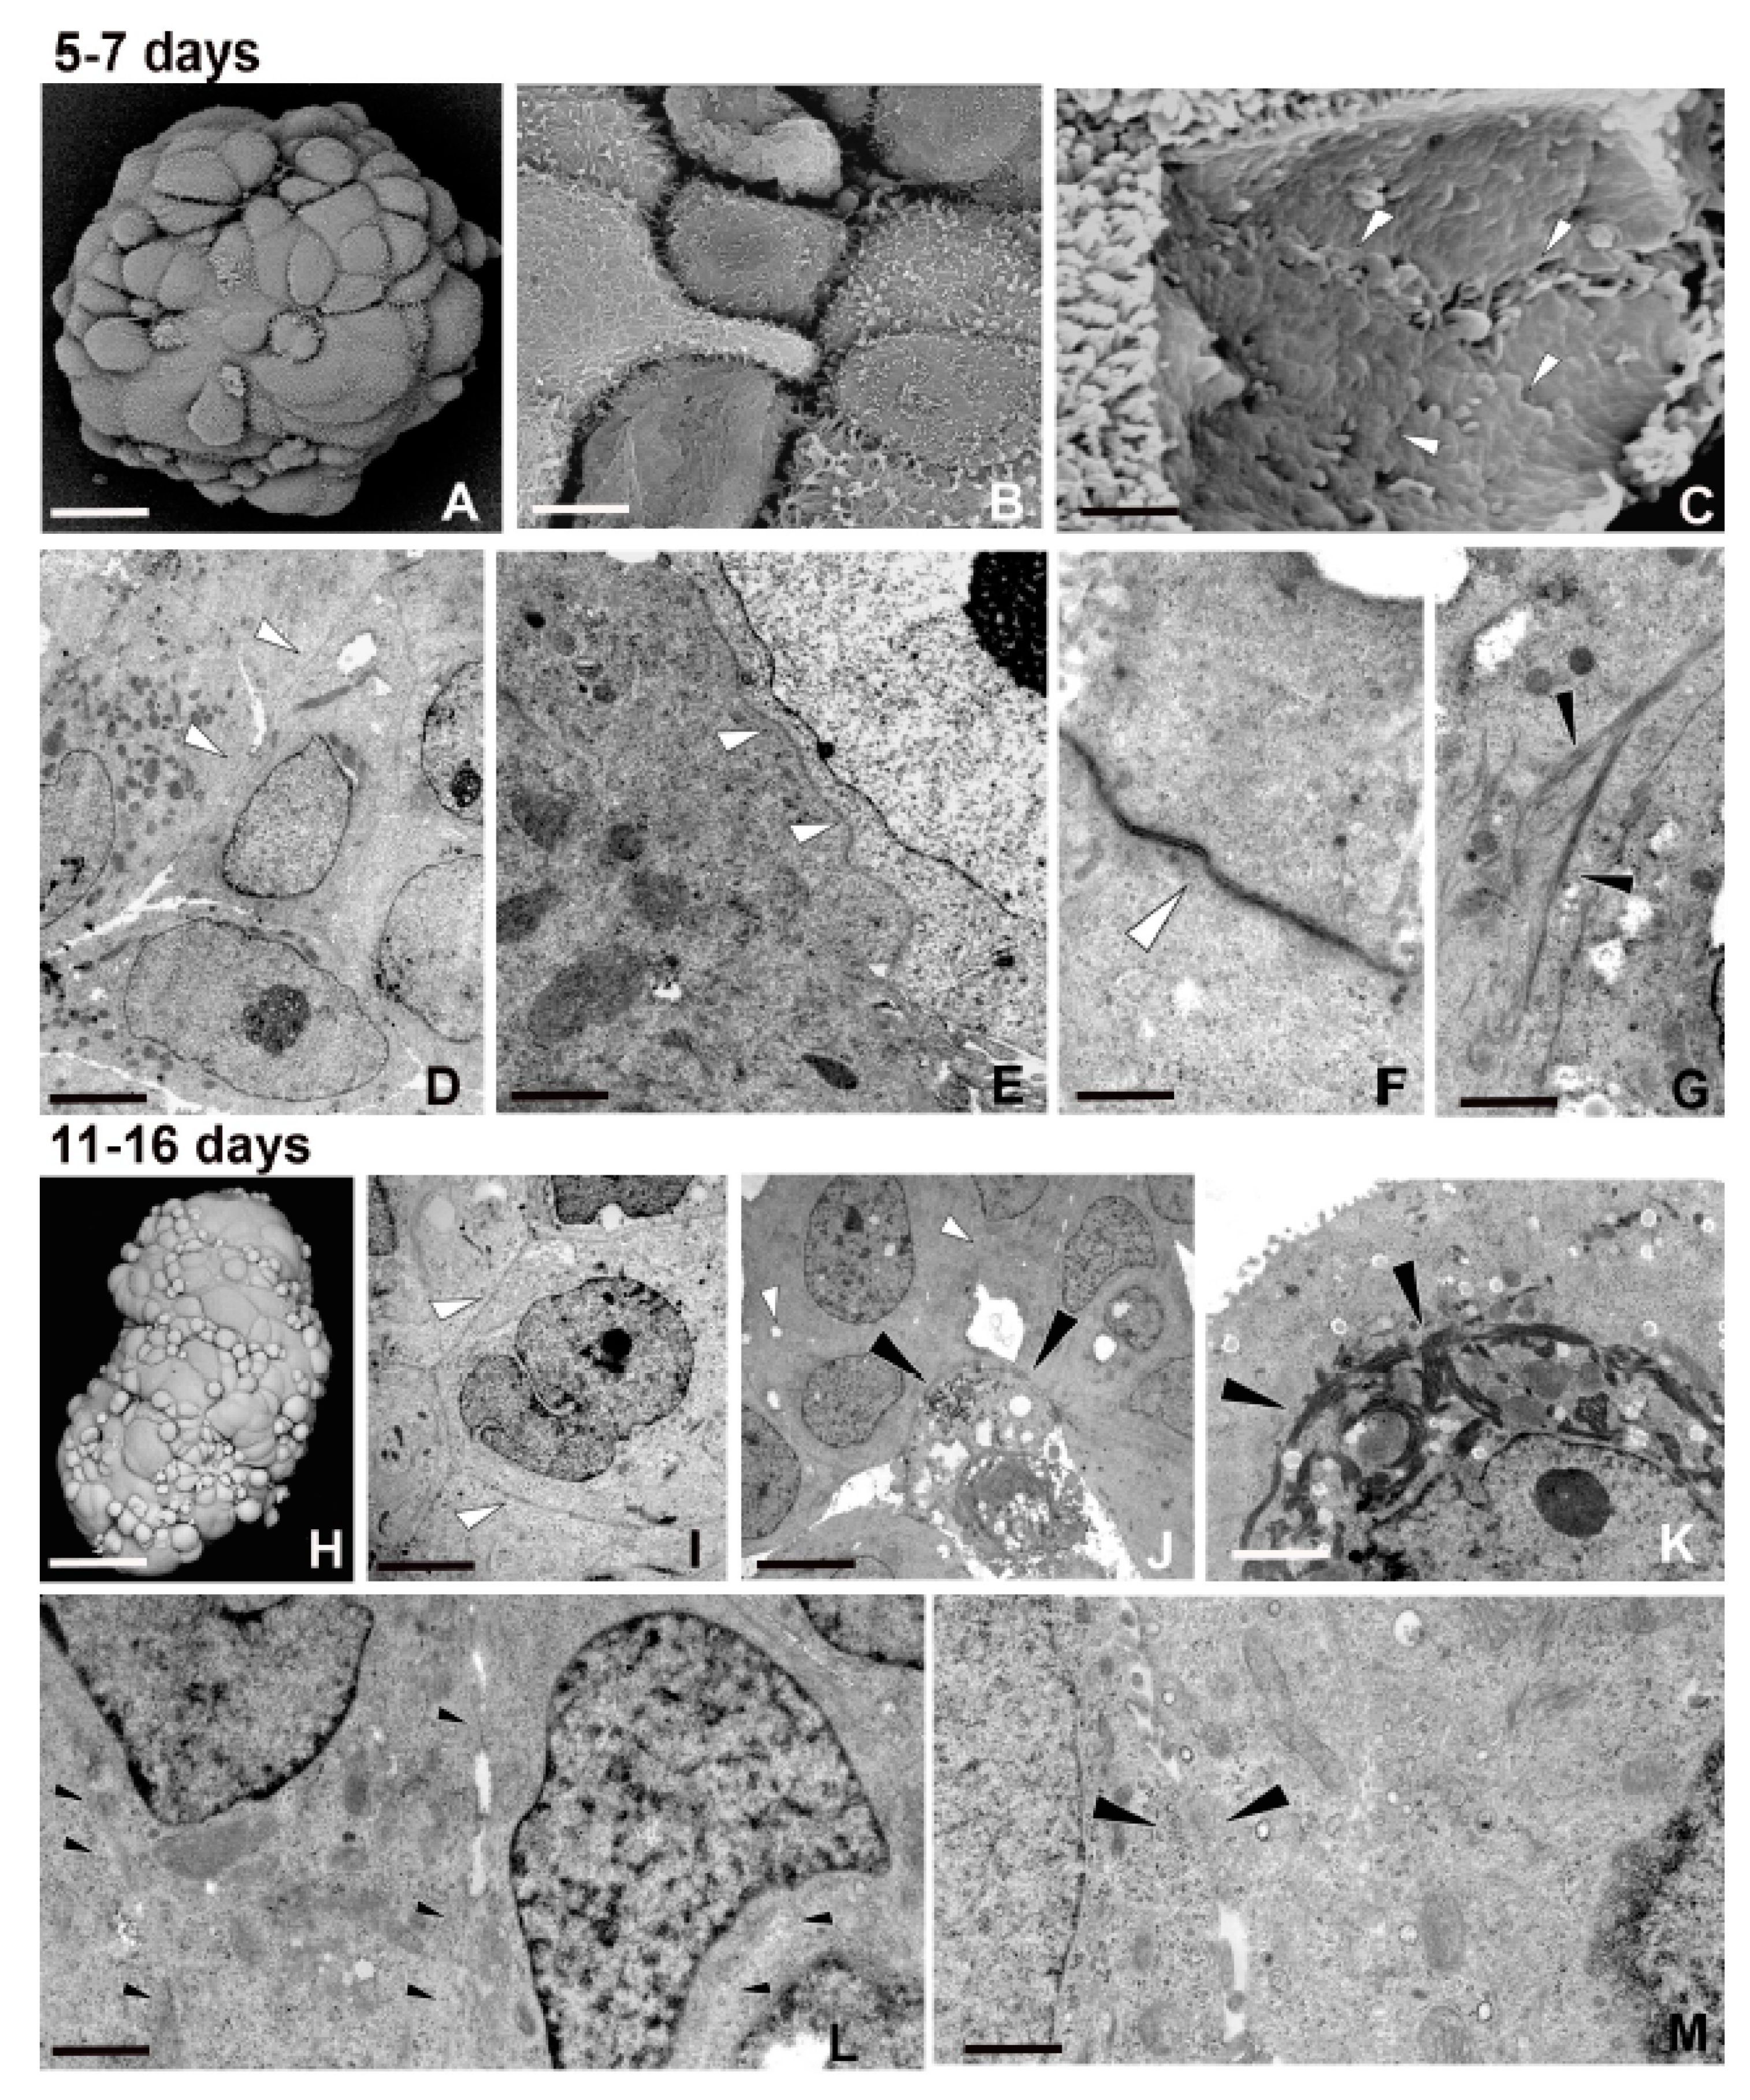
2.2. Closely Related Events During Spheroid Maturation
2.2.1. Early TNT Formation
2.2.2. Synthesis of Amyloid Fibrils
2.2.3. Intracellular ROS Evaluation
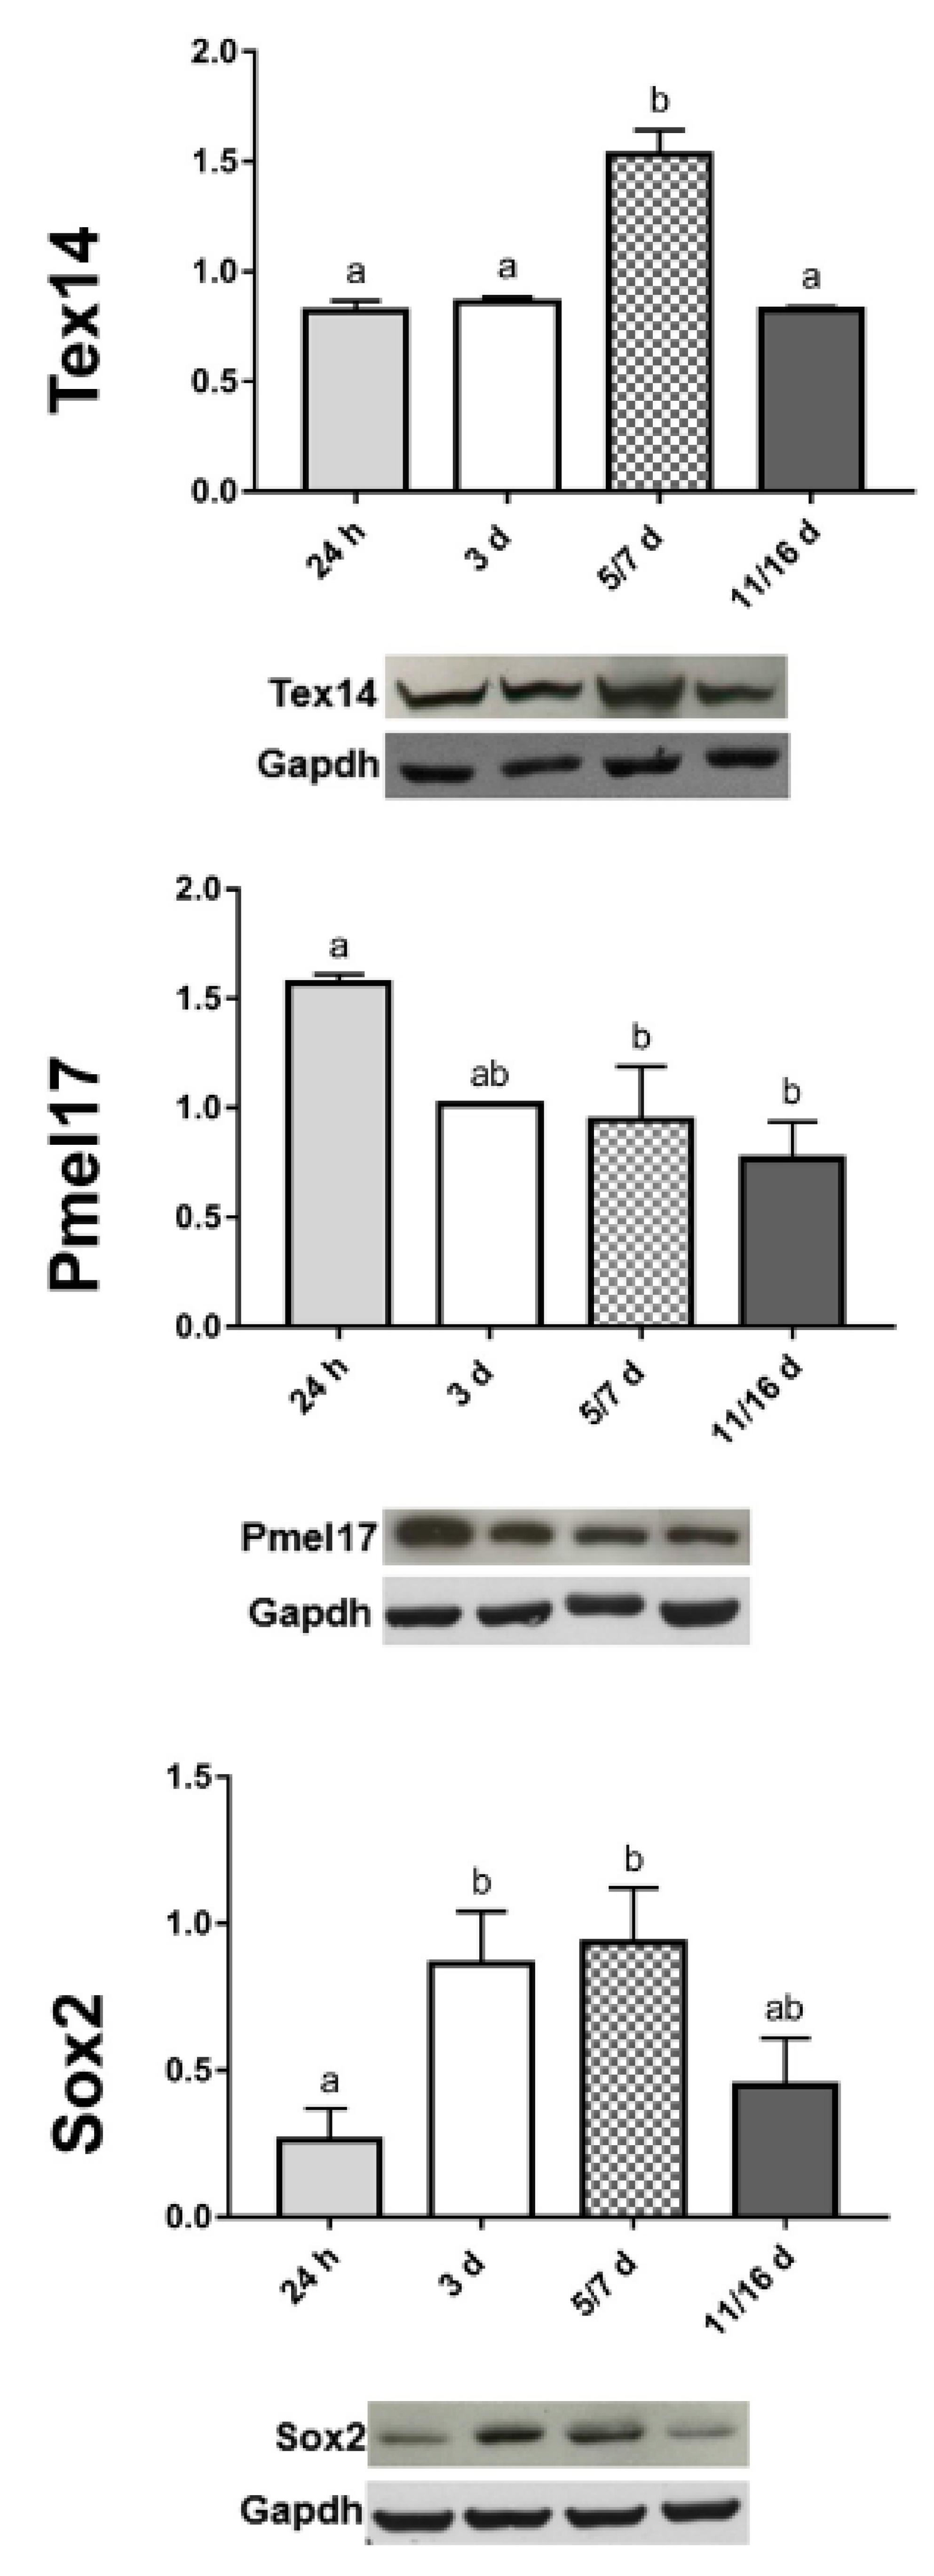
2.2.4. Expression of Stemness Markers
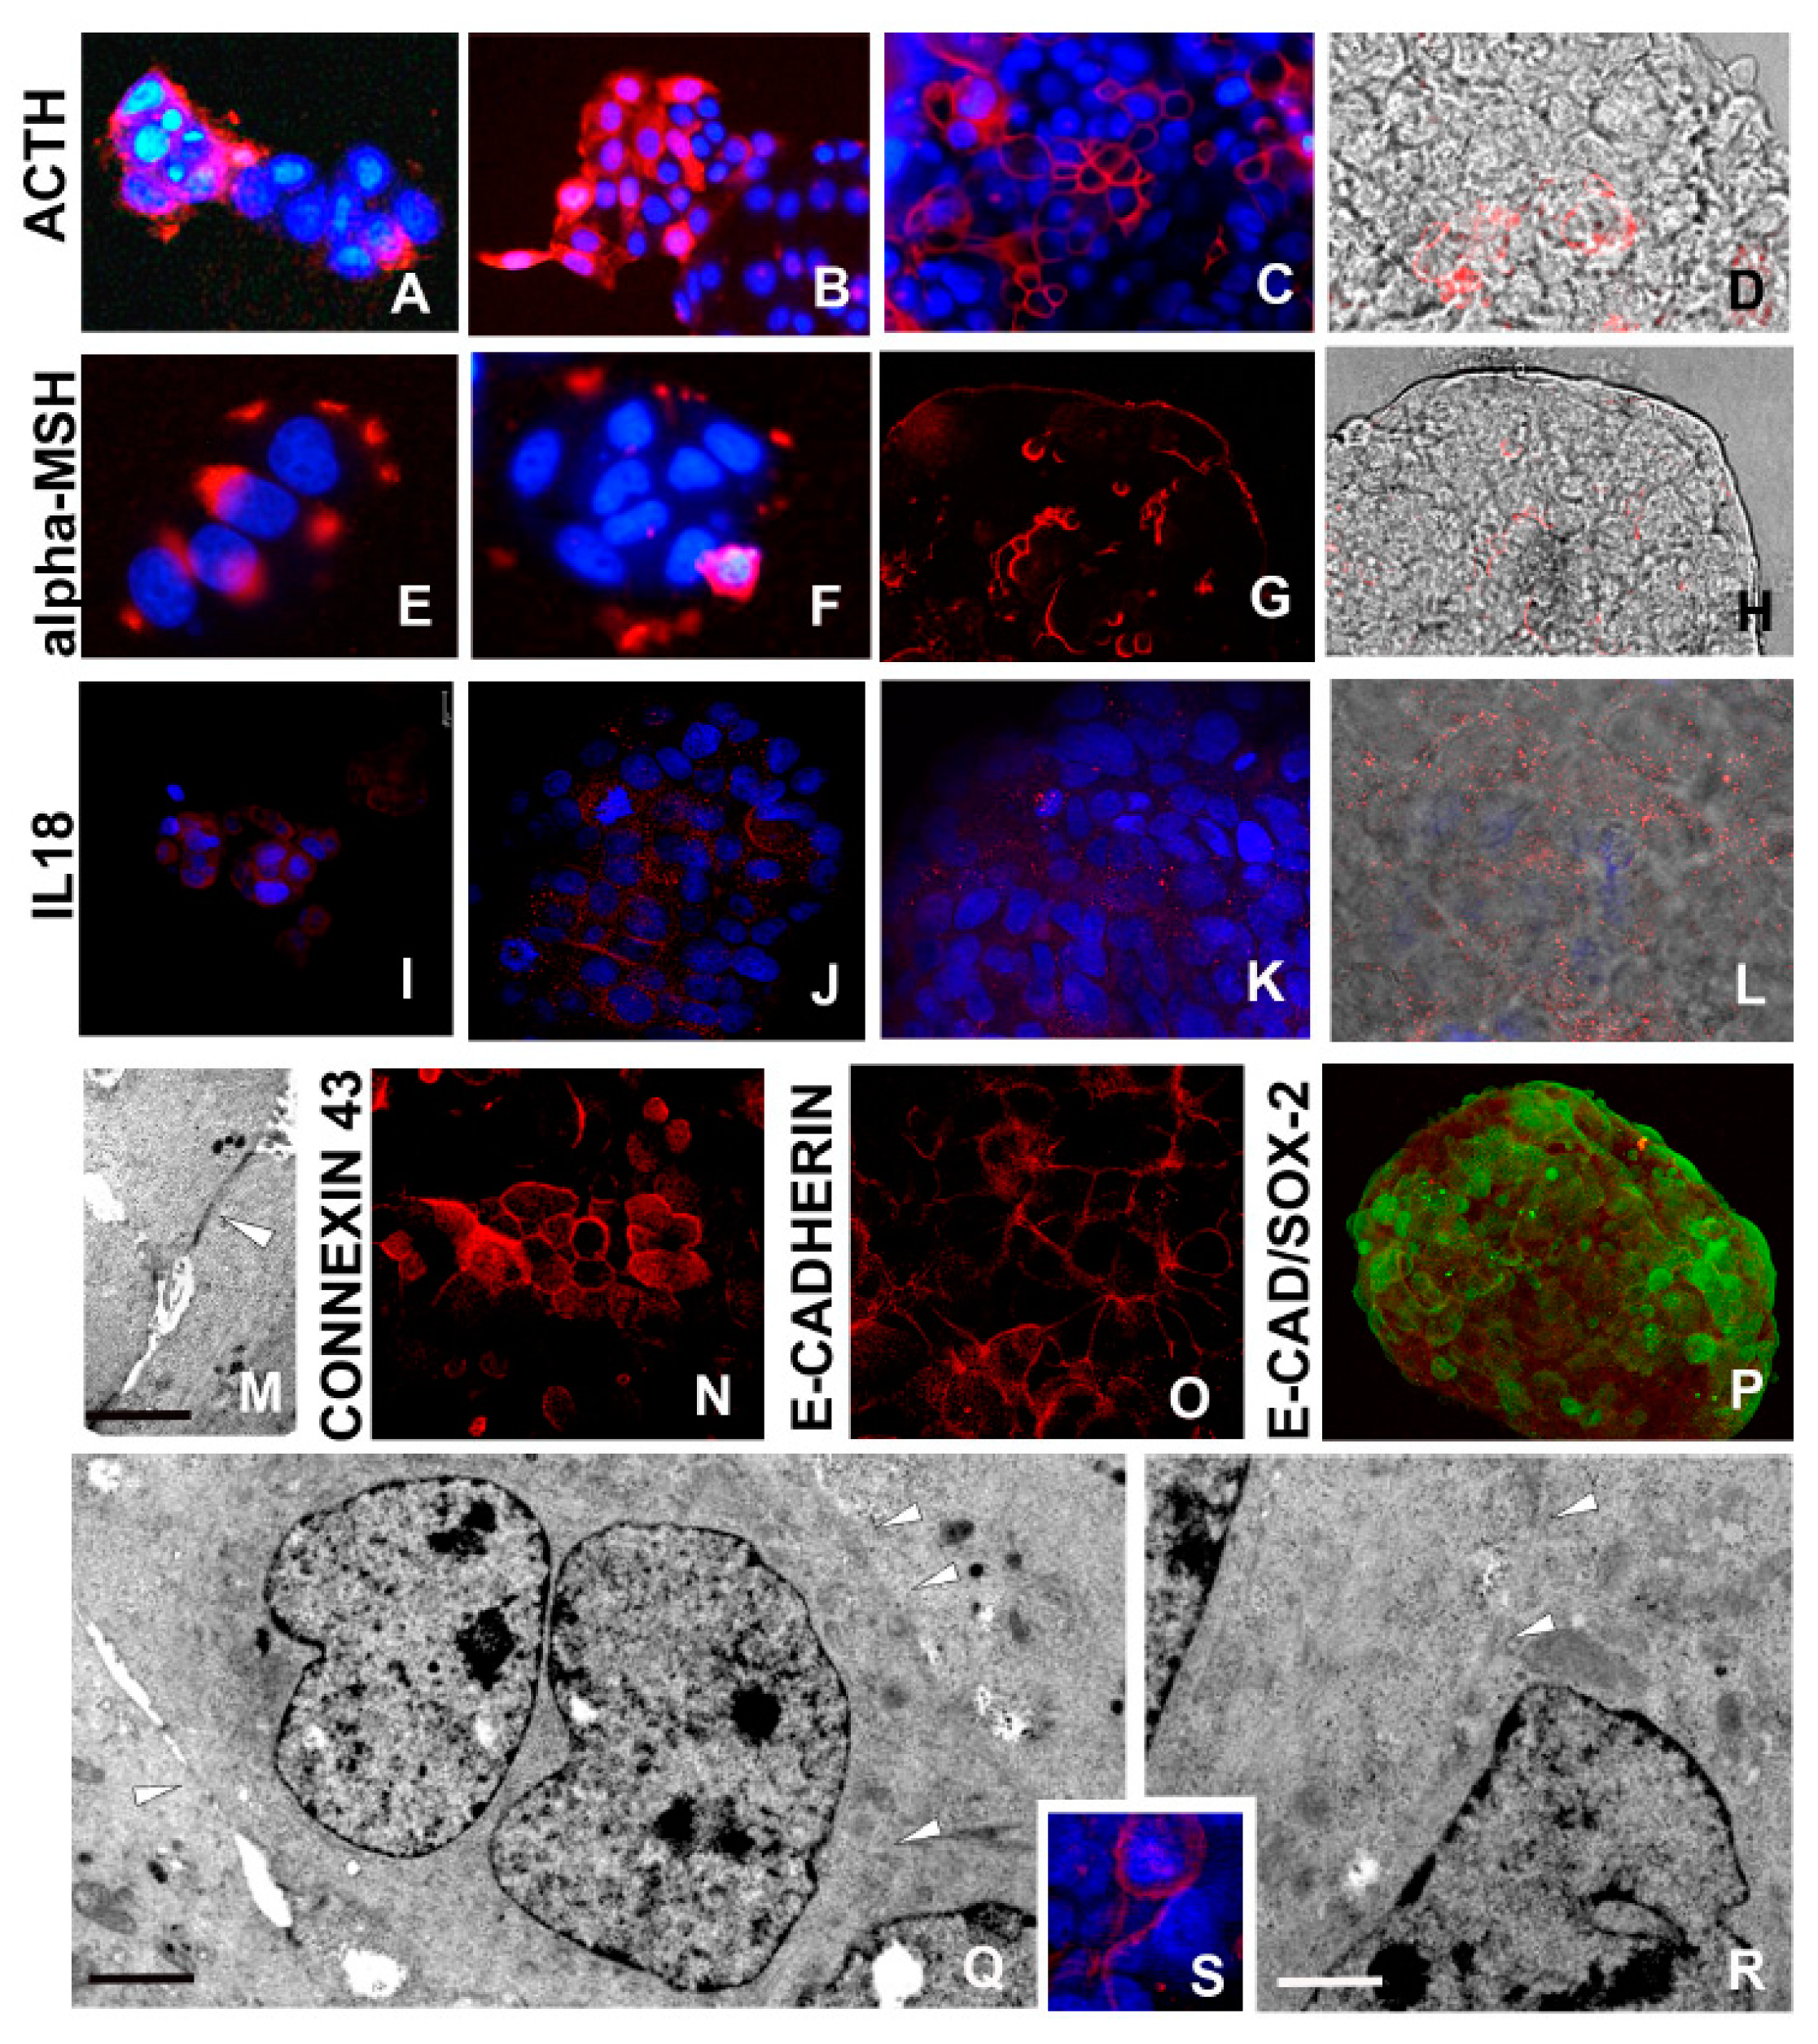
2.2.5. ACTH/α-MSH Axis Activation
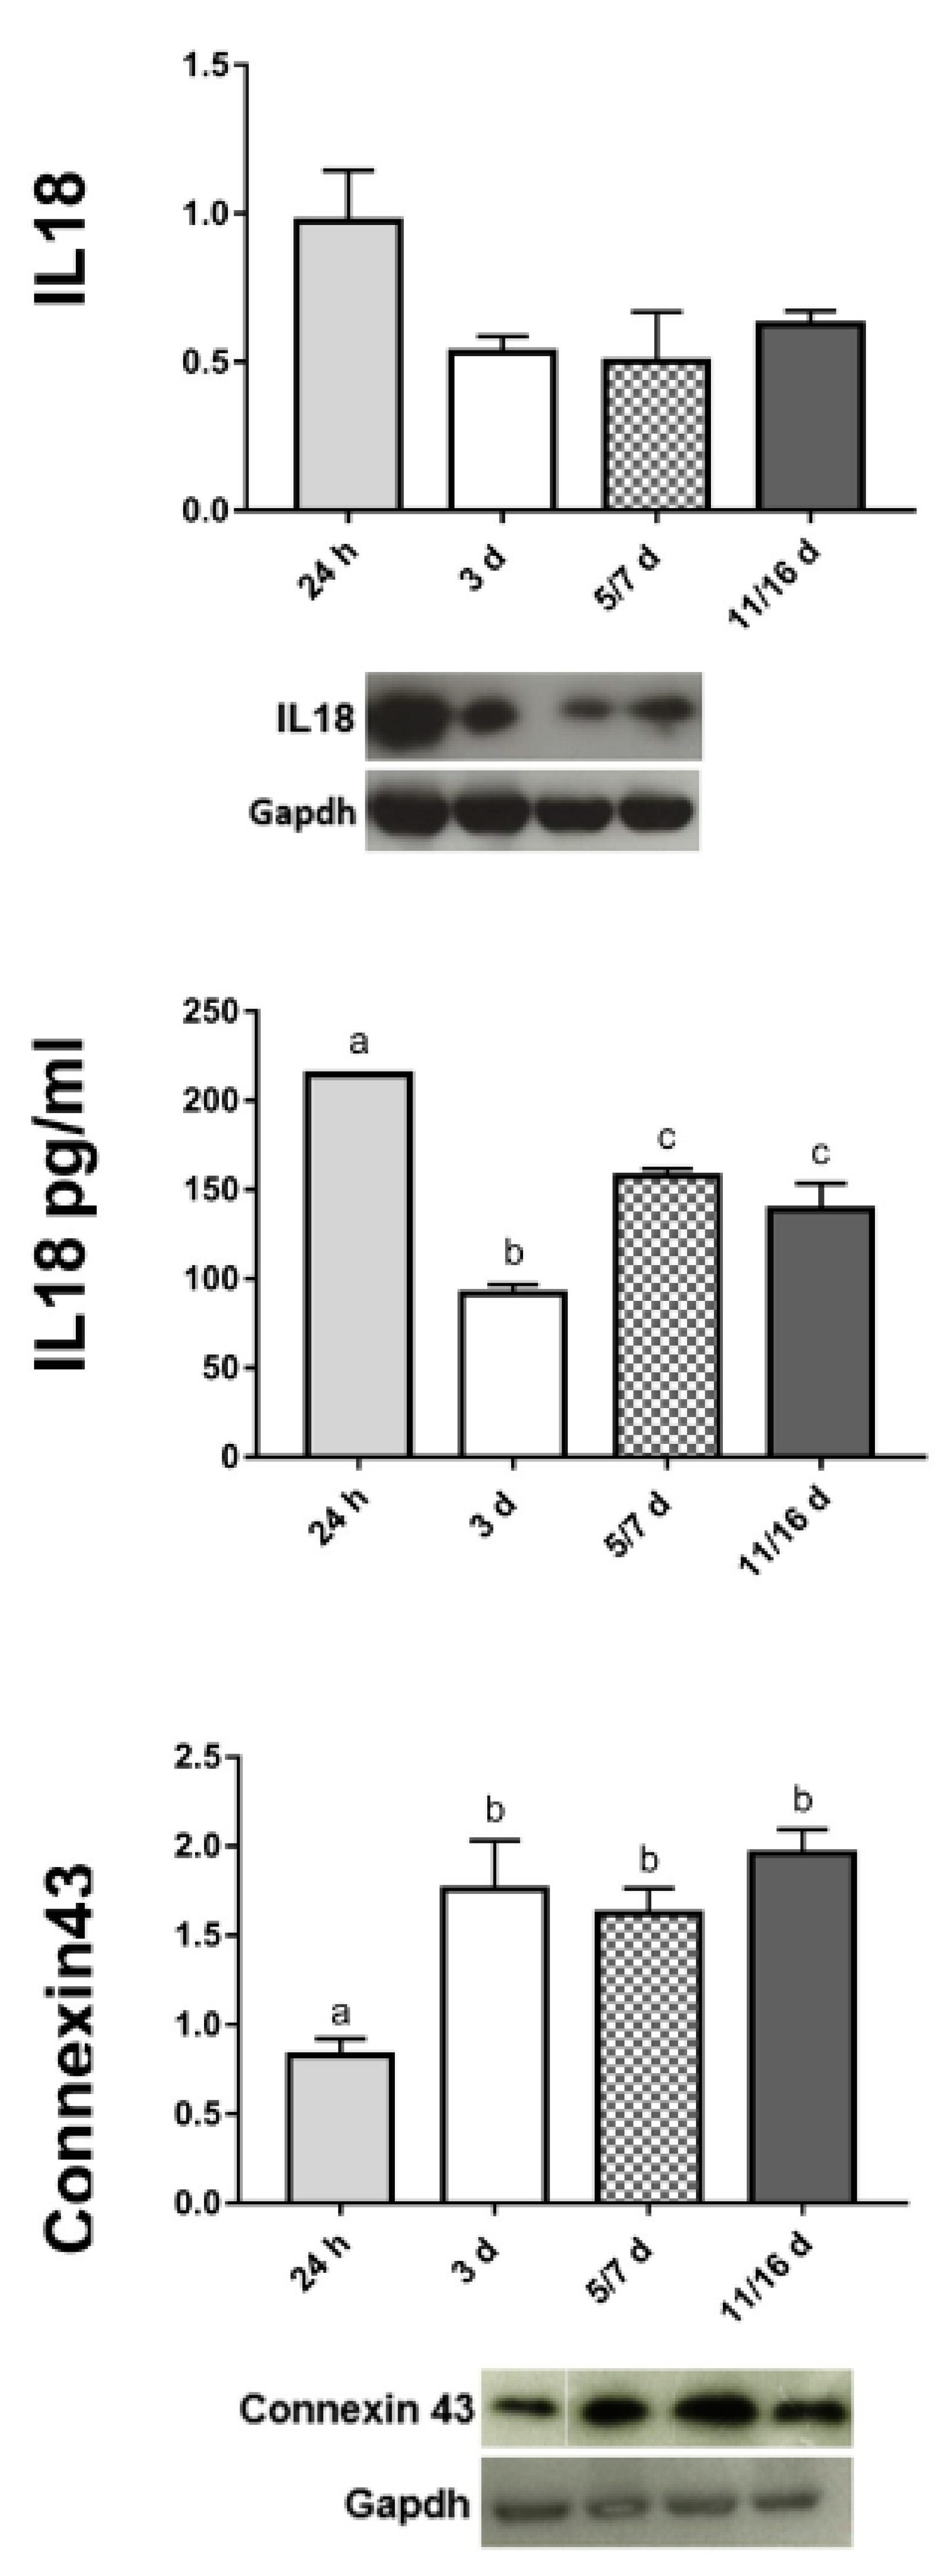
2.2.6. Interleukin-18 (IL18) Production
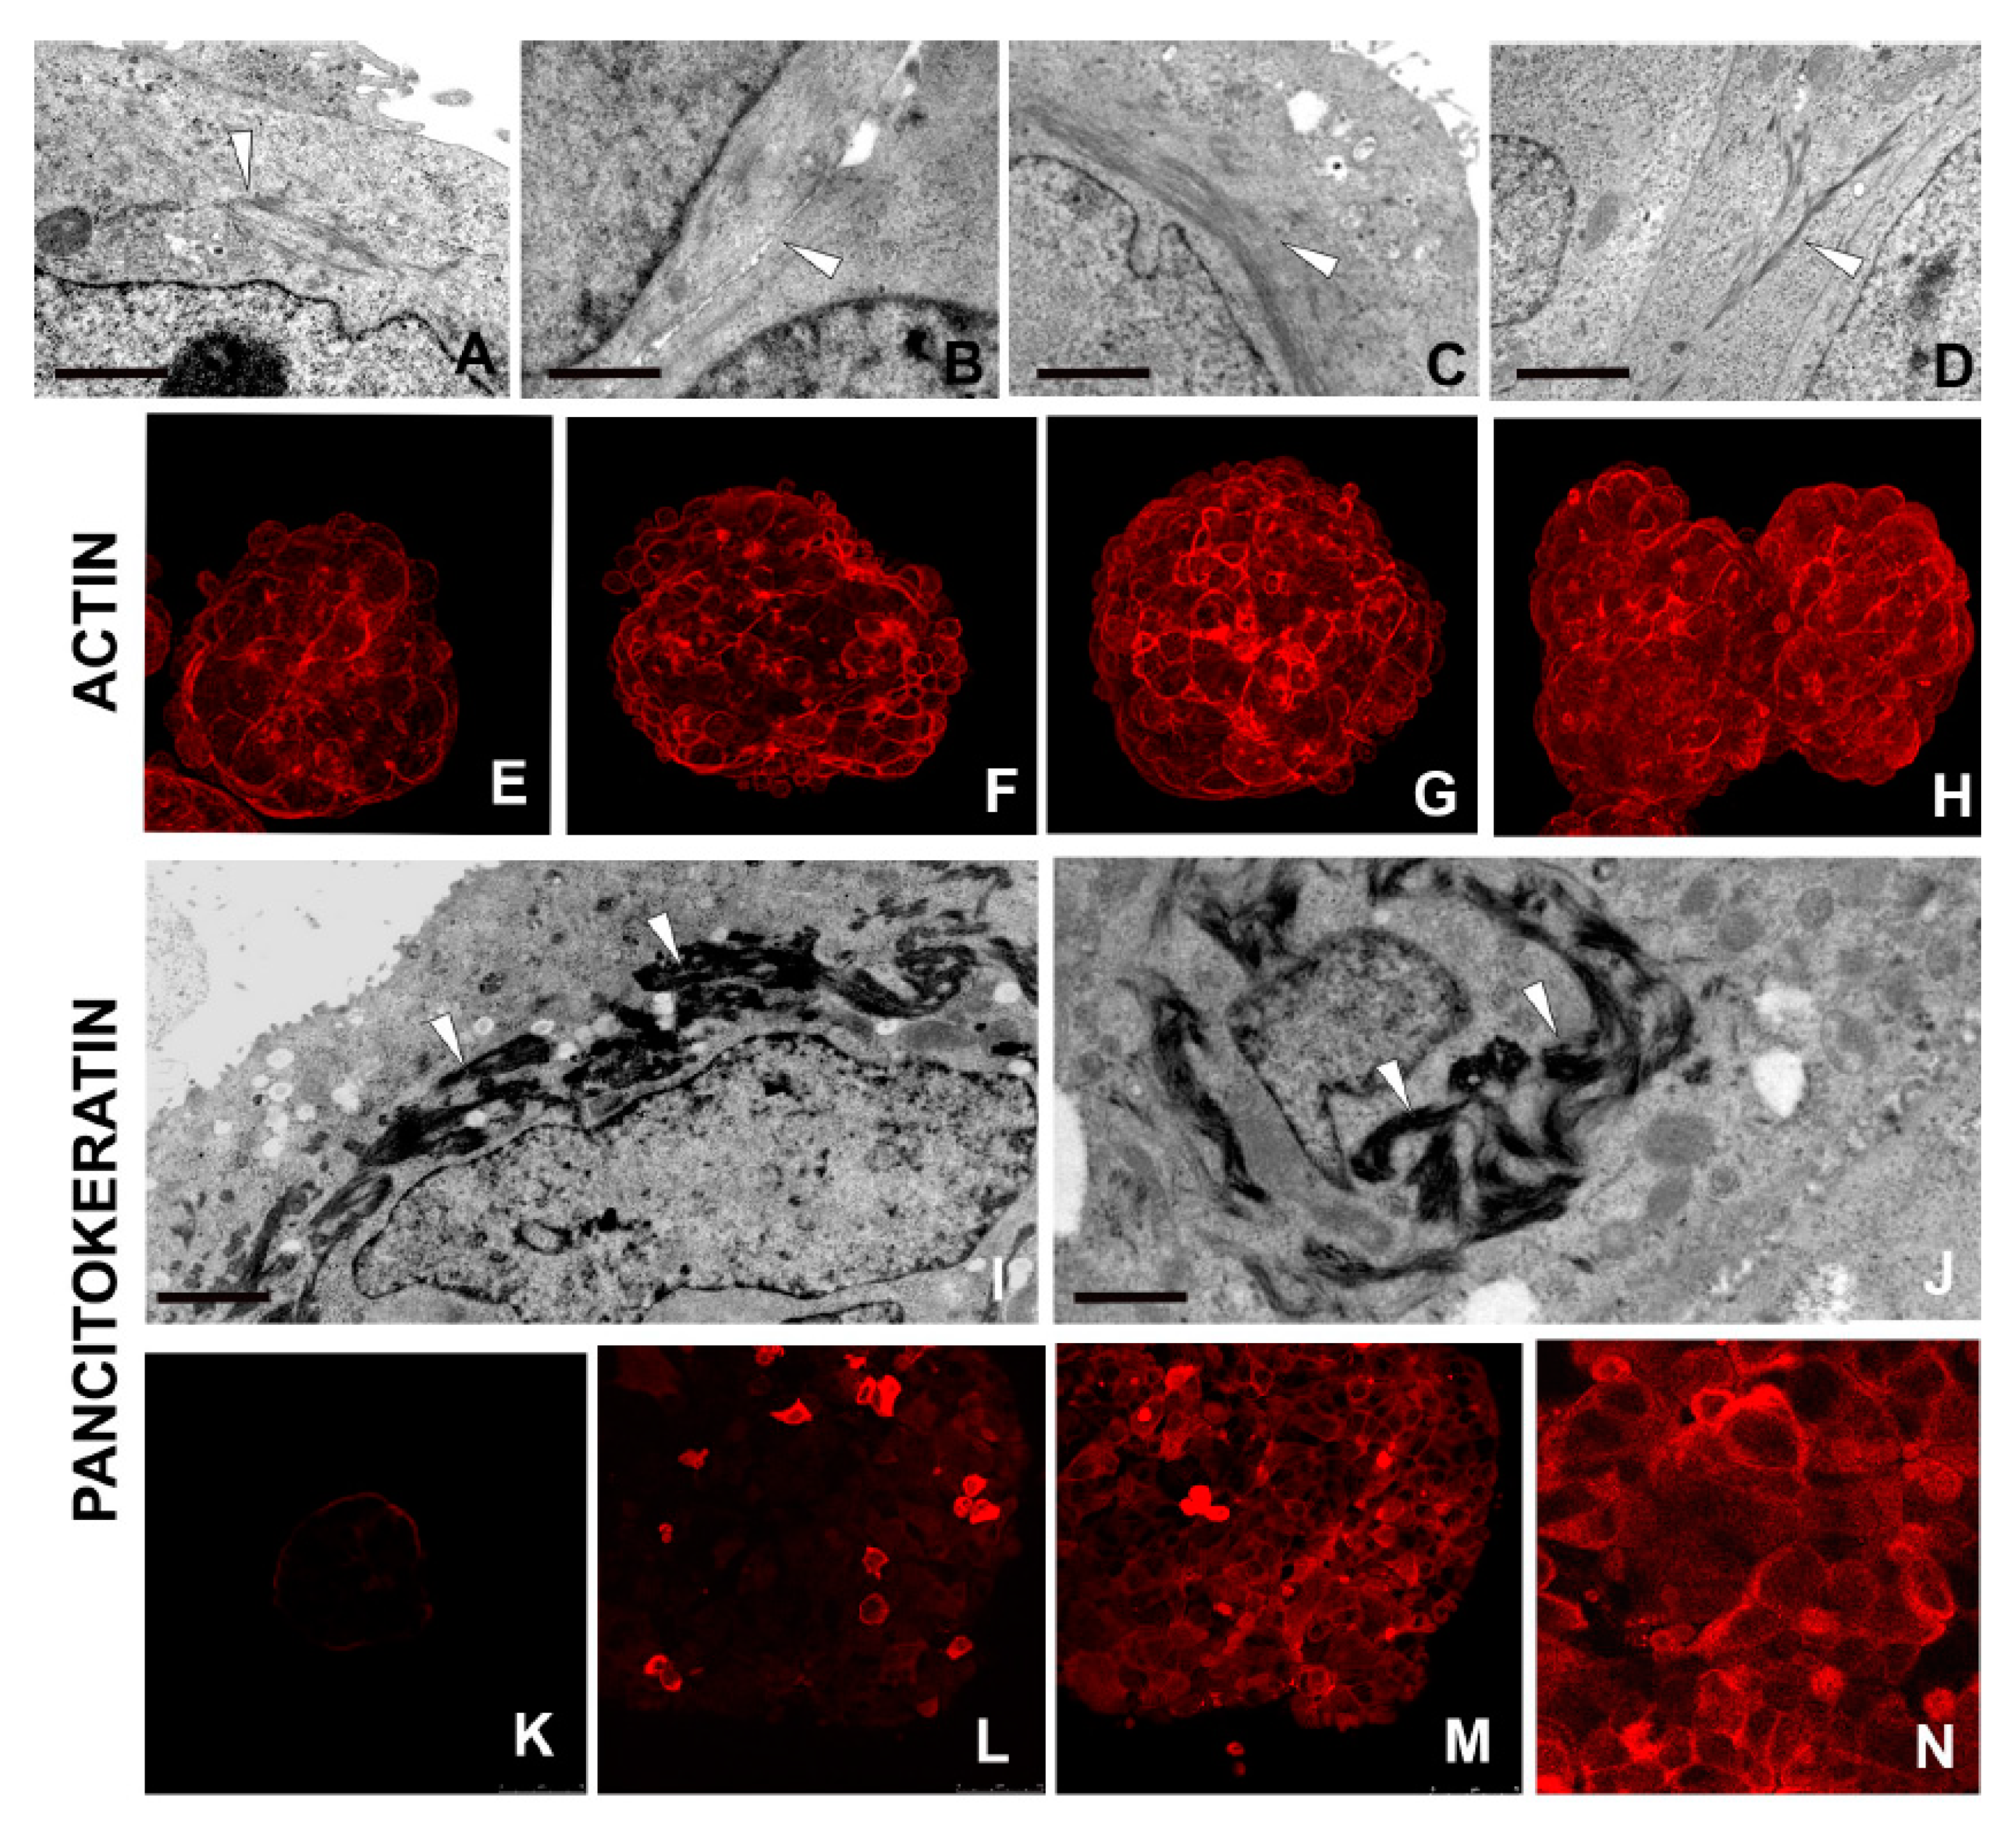
2.2.7. Cell–Cell Connections
2.2.8. Synthesis of Actin and Cytokeratin Filaments
2.3. Functional Studies
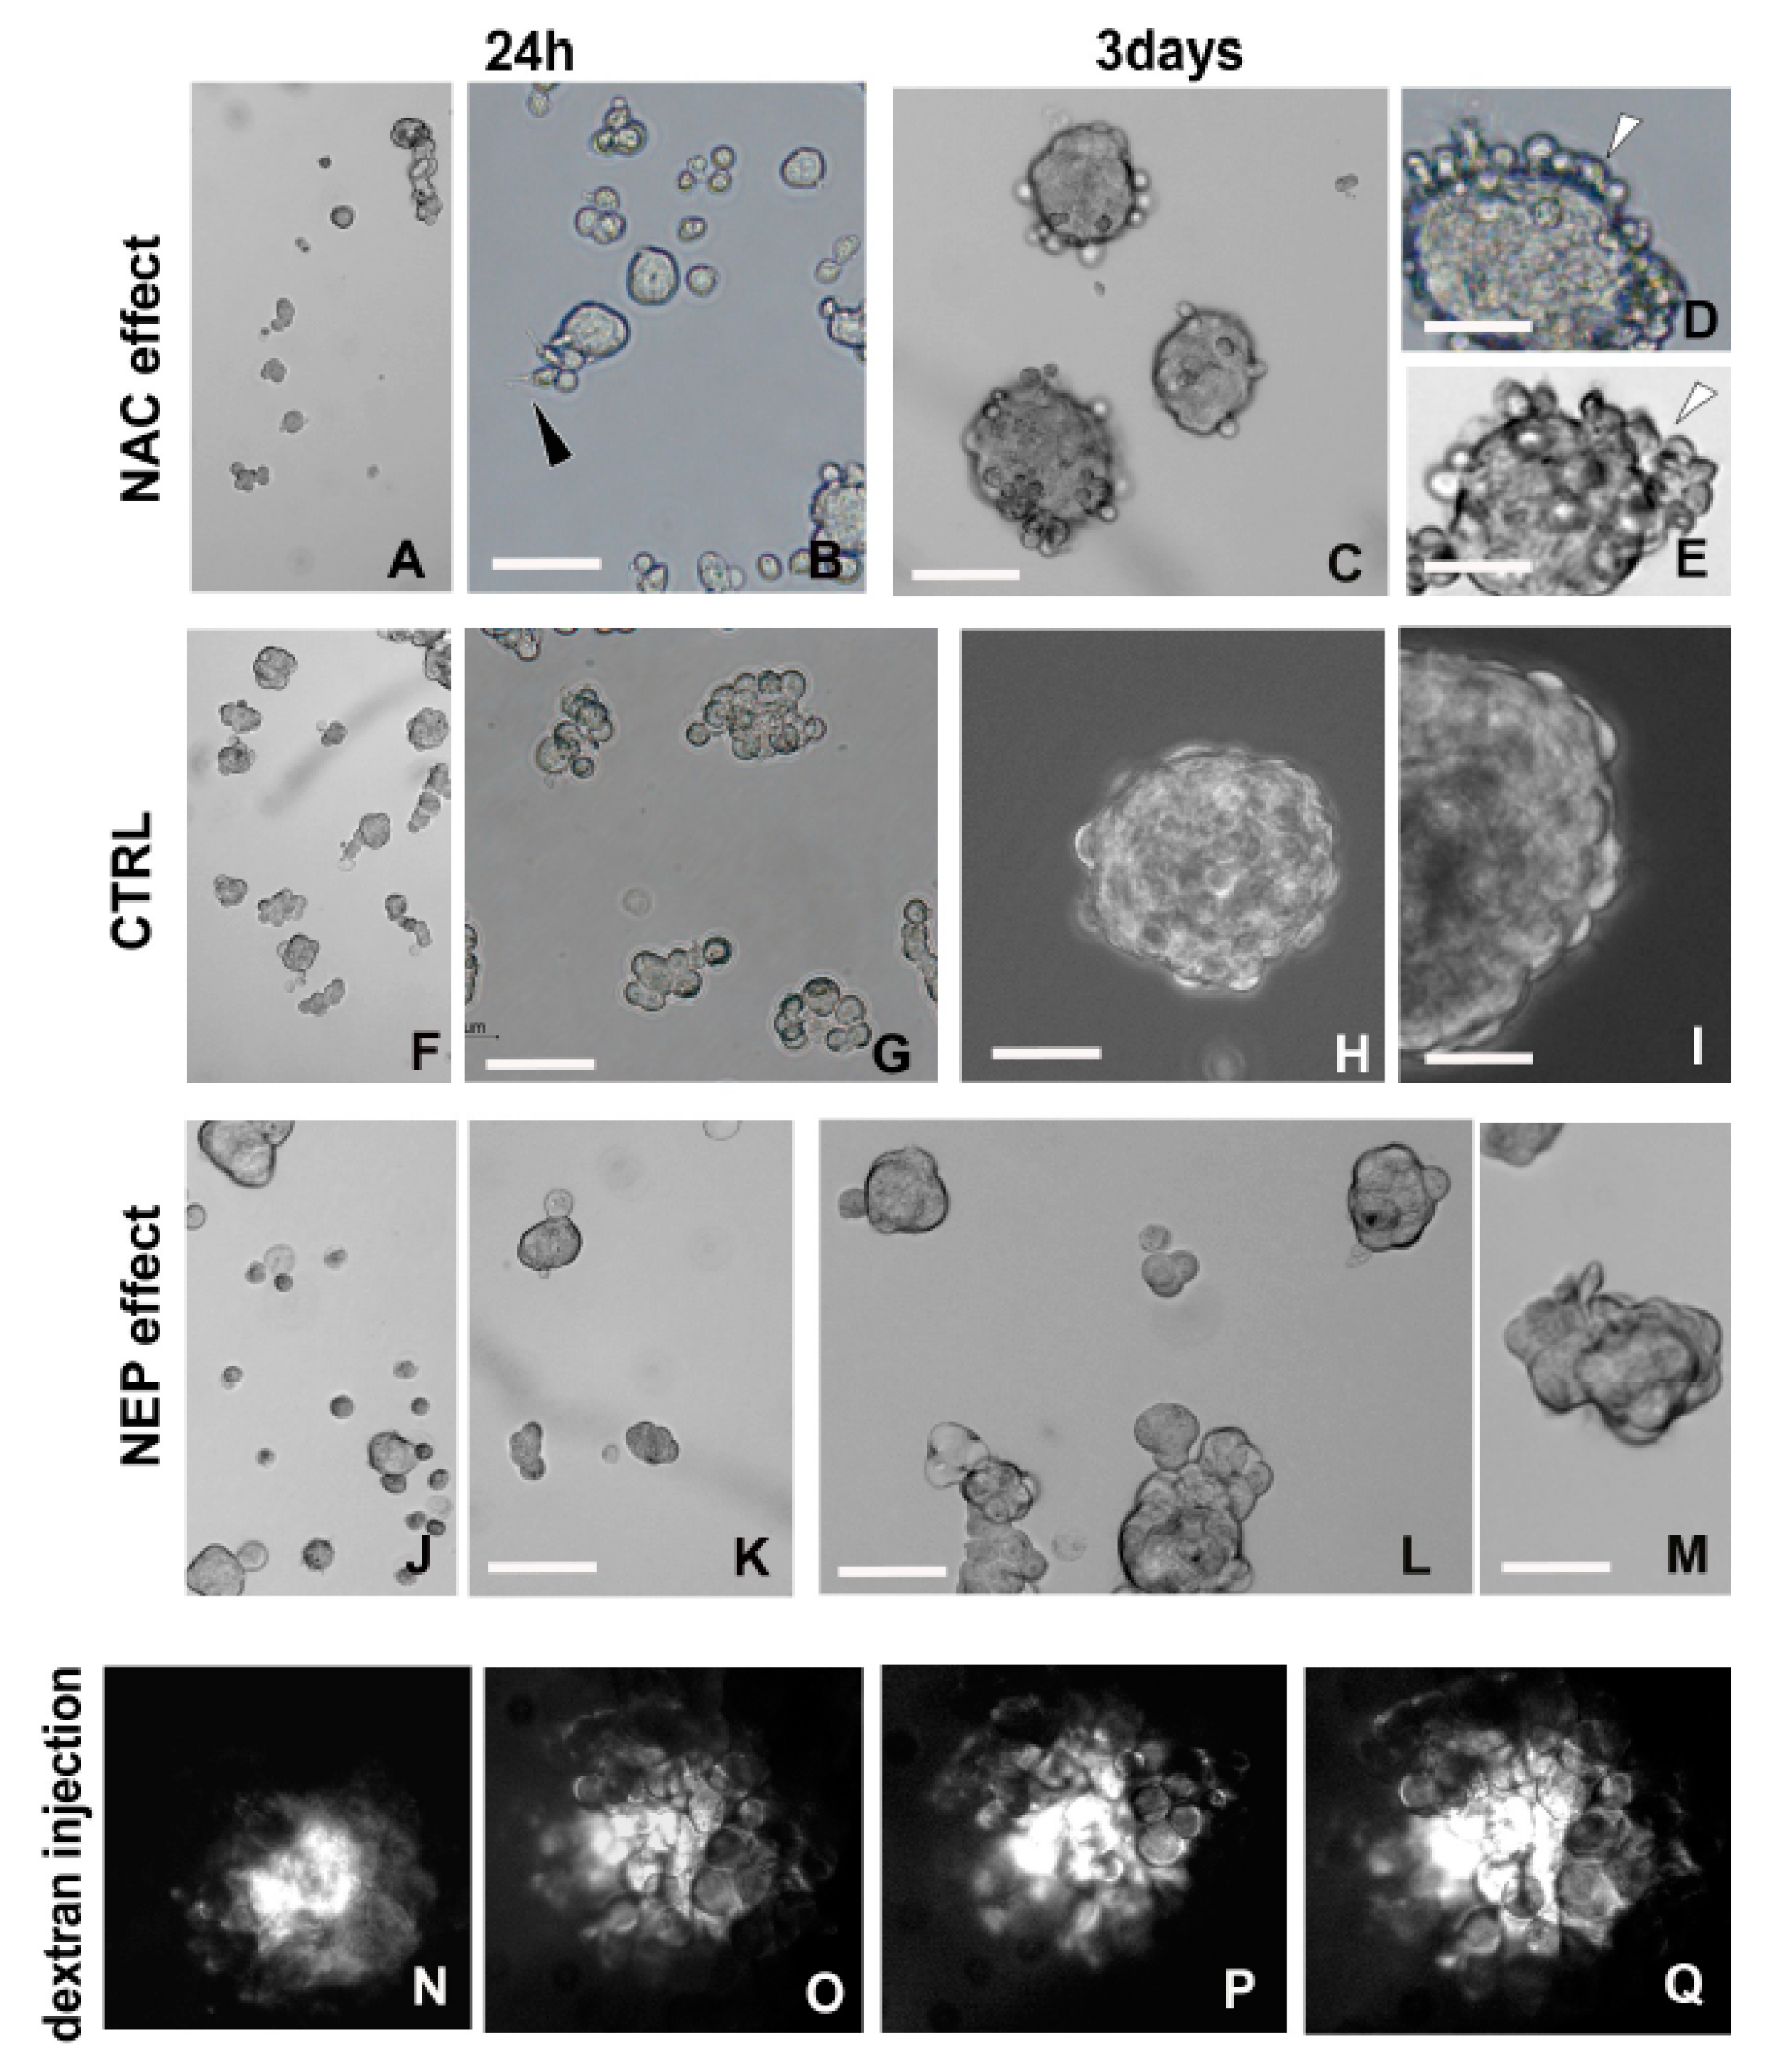
2.3.1. Detoxifying Agent: NAC Treatment
2.3.2. Amyloid-Degrading Enzyme: NEP Administration
2.3.3. Fluorescent Dextran Microinjection
3. Discussion
4. Materials and Methods
4.1. Cell Line and Monolayer Culture
4.2. Aggregate and Spheroid Culture
4.3. Morphological Analysis
4.3.1. Measures of Aggregates and Spheroids
4.3.2. Light Microscopy, and Transmission (TEM) and Scanning (SEM) Electron Microscopy
4.3.3. Immunocytochemistry
4.3.4. Actin Filaments
4.3.5. Tunneling Nanotubes and Intercellular Bridge Characterization
4.4. Western Blot
4.5. ELISA Assay
4.6. Functional Studies
4.6.1. Intracellular ROS Evaluation
4.6.2. Treatment with ROS Scavenger
4.6.3. Treatments with NEP Degrading Enzyme
4.6.4. Fluorescent Dextran Microinjection
4.6.5. Statistical Analysis
5. Conclusions
Supplementary Materials
Author Contributions
Funding
Acknowledgments
Conflicts of Interest
References
- De Sousa, E.; Melo, F.; Vermeulen, L.; Fessler, E.; Medema, J.P. Cancer heterogeneity—A multifaceted view. EMBO Rep. 2013, 14, 686–695. [Google Scholar]
- McGranahan, N.; Swanton, C. Biological and therapeutic impact of intratumor heterogeneity in cancer evolution. Cancer Cell 2015, 27, 15–26. [Google Scholar] [CrossRef] [PubMed] [Green Version]
- Lloyd, M.C.; Cunningham, J.J.; Bui, M.M.; Gillies, R.J.; Brown, J.S.; Gatenby, R.A. Darwinian Dynamics of Intratumoral Heterogeneity: Not Solely Random Mutations but Also Variable Environmental Selection Forces. Cancer Res. 2016, 76, 3136–3144. [Google Scholar] [CrossRef] [PubMed] [Green Version]
- Gentric, G.; Mieulet, V.; Mechta-Grigoriou, F. Heterogeneity in Cancer Metabolism: New Concept in an Old Field. Antioxid. Redox Signal. 2017, 26, 462–485. [Google Scholar] [CrossRef] [Green Version]
- Noorbakhsh, J.; Kim, H.; Namburi, S.; Chuang, J.H. Distribution-based measures of tumor heterogeneity are sensitive to mutation calling and lack strong clinical predictive power. Sci. Rep. 2018, 8, 11445. [Google Scholar] [CrossRef] [Green Version]
- Finicelli, M.; Benedetti, G.; Squillaro, T.; Pistilli, B.; Marcellusi, A.; Mariani, P.; Santinelli, A.; Latini, L.; Galderisi, U.; Giordano, A. Expression of stemness genes in primary breast cancer tissues: The role of SOX2 as a prognostic marker for detection of early recurrence. Oncotarget 2014, 5, 9678–9688. [Google Scholar] [CrossRef] [Green Version]
- Wang, Z.; Zhao, K.; Hackert, T.; Zöller, M. CD44/CD44v6 a Reliable Companion in Cancer-Initiating Cell Maintenance and Tumor Progression. Front. Cell Dev. Biol. 2018, 6, 1033–1043. [Google Scholar] [CrossRef] [Green Version]
- Chen, S.-F.; Chang, Y.-C.; Nieh, S.; Liu, C.-L.; Yang, C.-Y.; Lin, Y.-S. Nonadhesive Culture System as a Model of Rapid Sphere Formation with Cancer Stem Cell Properties. PLoS ONE 2012, 7, e31864. [Google Scholar] [CrossRef] [Green Version]
- Weigelt, B.; Ghajar, C.M.; Bissell, M.J. The need for complex 3D culture models to unravel novel pathways and identify accurate biomarkers in breast cancer. Adv. Drug Deliv. Rev 2014, 69–70, 42–51. [Google Scholar] [CrossRef] [Green Version]
- Nath, S.; Devi, G.R. Three-Dimensional Culture Systems in Cancer Research: Focus on Tumor Spheroid Model. Pharmacol. Ther. 2016, 163, 94–108. [Google Scholar] [CrossRef] [Green Version]
- Colella, G.; Fazioli, F.; Gallo, M.; De Chiara, A.; Apice, G.; Ruosi, C.; Cimmino, A.; de Nigris, F. Sarcoma Spheroids and Organoids—Promising Tools in the Era of Personalized Medicine. Int. J. Mol. Sci. 2018, 19, 615. [Google Scholar] [CrossRef] [PubMed] [Green Version]
- Pauly, M.G.; Krajka, V.; Stengel, F.; Seibler, P.; Klein, C.; Capetian, P. Adherent vs. Free-Floating Neural Induction by Dual SMAD Inhibition for Neurosphere Cultures Derived from Human Induced Pluripotent Stem Cells. Front. Cell Dev. Biol. 2018, 6, 3. [Google Scholar] [CrossRef] [Green Version]
- Schmidt, H.H.; Stocker, R.; Vollbracht, C.; Paulsen, G.; Riley, D.; Daiber, A.; Cuadrado, A. Antioxidant in Translational Medicine. Antioxid. Redox Signal. 2015, 23, 1130–1143. [Google Scholar] [CrossRef] [Green Version]
- Dittmar, T.; Zänke, K.S. Role of Cancer Stem Cells in Cancer Biology and Therapy, 1st ed.; Taylor and Francis Group: London, UK, 2013. [Google Scholar]
- Saha, S.; Mukherjee, S.; Khan, P.; Kajal, K.; Mazumdar, M.; Manna, A.; Mukherjee, S.; De, S.; Jana, D.; Sarkar, D.K.; et al. Aspirin Suppresses the Acquisition of Chemoresistance in Brest Cancer by Disrupting and NfkB-IL6 Signaling Axis Responsible for the Generation of Cancer Stem Cells. Cancer Res. 2016, 76, 2000–2012. [Google Scholar] [CrossRef] [Green Version]
- Holliday, D.L.; Speirs, V. Choosing the right cell line for breast cancer research. Breast Cancer Res. 2011, 13, 215–222. [Google Scholar] [CrossRef] [Green Version]
- Ady, J.W.; Desir, S.; Thayanithy, V.; Vogel, R.I.; Moreira, A.L.; Downey, R.J.; Fong, Y.; Manova-Todorova, K.; Moore, M.A.S.; Lou, E. Intercellular communication in malignant pleural mesothelioma: Properties of tunneling nanotubes. Front. Physiol. 2014, 5, 400. [Google Scholar] [CrossRef] [PubMed]
- Asencio-Barría, C.; Defamie, N.; Sáez, J.C.; Mesnil, M.; Godoy, A.S. Direct intercellular communications and cancer: A snapshot of the biological roles of connexins in prostate cancer. Cancers 2019, 11, 1370. [Google Scholar]
- Rustom, A. The missing link: Does tunnelling nanotube-based supercellularity provide a new understanding of chronic and lifestyle diseases? Open Biol. 2016, 6, 160057. [Google Scholar] [CrossRef] [PubMed] [Green Version]
- Lou, E.; Fujisawa, S.; Barlas, A.; Romin, Y.; Manova-Todorova, K.; Moore, M.A.S.; Subramanian, S. Tunneling nanotubes: A new paradigm for studying intercellular communication and therapeutics in cancer. Commun. Integr. Biol. 2012, 5, 399–403. [Google Scholar] [CrossRef] [Green Version]
- Ariazi, J.; Benowitz, A.; De Biasi, V.; Den Boer, M.L.; Cherqui, S.; Cui, H.; Douillet, N.; Eugenin, E.A.; Favre, D.; Goodman, S.; et al. Tunneling Nanotubes and Gap Junctions-Their Role in Long-Range Intercellular Communication During Development, Health, and Disease Conditions. Front. Mol. Neurosci. 2017, 10, 333. [Google Scholar] [CrossRef]
- Liang, D. A Salutary Role of Reactive Oxygen Species in Intercellular Tunnel-Mediated Communication. Front. Cell Dev. Biol. 2018, 6, 2. [Google Scholar] [CrossRef] [Green Version]
- Pasquier, J.; Guerrouahen, B.S.; Thawadi, H.A.; Ghiabi, P.; Maleki, M.; Abu-Kaoud, N.; Jacob, A.; Mirshahi, M.; Galas, L.; Rafii, S.; et al. Preferential transfer of mitochondria from endothelial to cancer cells through tunneling nanotubes modulates chemoresistance. J. Trans. Med. 2013, 11, 94. [Google Scholar] [CrossRef] [PubMed] [Green Version]
- Abounit, S.; Zurzolo, C. Wiring through tunnelling nanotubes—From electrical signals to organelle transfer. J. Cell Sci. 2012, 125, 1089–1098. [Google Scholar] [CrossRef] [PubMed] [Green Version]
- Goliwas, K.F.; Marshall, L.E.; Ransaw, E.L.; Berry, J.L.; Frost, A.R. A recapitulative three-dimensional model of breast carcinoma requires perfusion for multi-week growth. J. Tissue Eng. 2016, 7, 1–15. [Google Scholar] [CrossRef] [PubMed]
- Fowler, D.M.; Koulov, A.V.; Alory-Jost, C.; Marks, M.; Balch, W.E.; and Kelly, J.W. Functional amyloid formation within mammalian tissue. PLoS Biol. 2006, 4, 6–26. [Google Scholar] [CrossRef] [PubMed]
- Mostaert, A.S.; Jarvis, S.P. Beneficial characteristics of mechanically functional amyloid fibrils evolutionarily preserved in natural adhesives. Nanotechnology 2007, 18, 44010–44015. [Google Scholar] [CrossRef]
- Grimaldi, A.; Girardello, R.; Malagoli, D.; Falabella, P.; Tettamanti, G.; Valvassori, R.; Ottaviani, E.; de Eguileor, M. Amyloid/Melanin distinctive mark in invertebrate immunity. Inv. Surv. J. 2012, 9, 153–162. [Google Scholar]
- Grimaldi, A.; Tettamanti, G.; Girardello, R.; Pulze, L.; Valvassori, R.; Malagoli, D.; Ottaviani, E.; de Eguileor, M. Functional amyloid formation in LPS activated cells from invertebrates to vertebrates. Inv. Surv. J. 2014, 11, 286–297. [Google Scholar]
- Dayem, A.A.; Choi, H.Y.; Kim, J.H.; Cho, S.G. Role of Oxidative Stress in Stem, Cancer, and Cancer Stem Cells. Cancers 2010, 2, 859–884. [Google Scholar] [CrossRef] [Green Version]
- Goldsbury, C.; Whiteman, I.T.; Jeong, E.V.; Yun-An, L. Oxidative stress increases levels of endogenous amyloid-β peptides secreted from primary chick brain neurons. Aging Cell 2008, 7, 771–775. [Google Scholar] [CrossRef]
- Cheignon, C.; Tomas, M.; Bonnefont-Rousselot, D.; Faller, P.; Hureau, C.; Collin, F. Oxidative stress and the amyloid beta peptide in Alzheimer’s disease. Redox Biol. 2018, 14, 450–464. [Google Scholar] [CrossRef] [PubMed]
- Zani, B.G.; Edelman, E.R. Cellular Bridges: Routes for Intercellular Communication and Cell Migration. Commun. Integr. Biol. 2010, 3, 215–220. [Google Scholar] [CrossRef] [PubMed]
- Haglund, K.; Nezis, I.P.; Stenmark, H. Structure and functions of stable intercellular bridges formed by incomplete cytokinesis during development. Commun. Integr. Biol. 2011, 4, 1–9. [Google Scholar] [CrossRef] [PubMed] [Green Version]
- Ivascu, A.; Kubbies, M. Diversity of cell-mediated adhesions in breast cancer spheroids. Int. J. Oncol. 2007, 31, 1403–1413. [Google Scholar] [CrossRef] [Green Version]
- Cao, S.S.; Kaufman, R.J. Endoplasmic reticulum stress and oxidative stress in cell fate decision and human disease. Antioxid Redox Signal 2014, 21, 396–413. [Google Scholar] [CrossRef]
- Vazquez-Martin, A.; Cufí, S.; López-Bonet, E.; Corominas-Faja, B.; Cuyàs, E.; Vellon, L.; Iglesias, J.M.; Leis, O.; Martin, A.; Menendez, J. Reprogramming of non-genomic estrogen signaling by the stemness factor SOX2 enhances the tumor-initiating capacity of breast cancer cells. Cell Cycle 2013, 12, 3471–3477. [Google Scholar] [CrossRef] [Green Version]
- Piva, M.; Domenici, G.; Iriondo, O.; Rábano, M.; Simões, B.M.; Comaills, V.; Barredo, I.; López-Ruiz, J.A.; Zabalza, I.; Kypta, R.; et al. Sox2 promotes tamoxifen resistance in breast cancer cells. EMBO Mol. Med. 2013, 6, 66–79. [Google Scholar] [CrossRef]
- Bossù, P.; Ciaramella, A.; Salani, F.; Vanni, D.; Palladino, I.; Caltagirone, C.; Scapigliati, G. Interleukin-18, from neuroinflammation to Alzheimer’s disease. Curr. Pharm. Des. 2010, 16, 4213–4224. [Google Scholar] [CrossRef]
- Ikawa, K.; Sugimura, K. AIP1 and cofilin ensure a resistance to tissue tension and promote directional cell rearrangement. Nat. Commun. 2018, 9. [Google Scholar] [CrossRef] [Green Version]
- Moll, R.; Divo, M.; Langbein, L. The human keratins: Biology and pathology. Histochem. Cell Biol. 2008, 129, 705–733. [Google Scholar] [CrossRef] [Green Version]
- Shadfar, S.; Hwang, C.J.; Lim, M.S.; Choi, D.-Y.; Hong, J.T. Involvement of inflammation in Alzheimer’s disease pathogenesis and therapeutic potential of anti-inflammatory agents. Arch. Pharm. Res. 2015, 32, 2106–2119. [Google Scholar] [CrossRef] [PubMed]
- Wang, D.S.; Dickson, D.W.; Malter, J.S. b-Amyloid degradation in Alzheimer’s disease. J. Biomed. Biotechnol. 2006, 2006, 58406. [Google Scholar] [CrossRef] [PubMed] [Green Version]
- El-Amouri, S.; Zhu, H.; Yu, J.; Marr, R.; Verma, I.M.; Kindy, M.S. Neprilysin: An enzyme candidate to slow the progression of Alzheimer’s disease. Am. J. Pathol. 2008, 172, 1342–1354. [Google Scholar] [CrossRef] [PubMed] [Green Version]
- Meilandt, W.J.; Cisse, M.; Ho, K.; Wu, T.; Esposito, L.A.; Scearce-Levie, K.; Cheng, I.H.; Yu, G.; Mucke, L. Neprilysin overexpression inhibits plaque formation but fails to reduce pathogenic Abeta oligomers and associated cognitive deficits in human amyloid precursor protein transgenic mice. J. Neurosci. 2009, 29, 1977–1986. [Google Scholar] [CrossRef] [Green Version]
- Hafez, D.; Huang, J.Y.; Huynh, A.M.; Valtierra, S.; Rockenstein, E.; Bruno, A.M.; Lu, B.; Des Grosseillers, L.; Masliah, E.; Marr, R.A. Neprilysin-2 is an important b-amyloid degrading enzyme. Am. J. Pathol. 2011, 178, 306–312. [Google Scholar] [CrossRef]
- Mese, G.; Richard, G.; White, T.W. Gap Junctions: Basic Structure and Function. J. Invest. Dermatol. 2007, 127, 2516–2524. [Google Scholar] [CrossRef] [Green Version]
- Meng, W.; Takeichi, M. Adherens Junction: Molecular Architecture and Regulation. Cold Spring Harb. Perspect Biol. 2009, 1, e002899. [Google Scholar] [CrossRef] [Green Version]
- Beyer, E.C.; Berthoud, V.M. Gap junctions gene and protein families: Connexins, innexins, and pannexins. Biochim. Biophys. Acta 2018, 1860, 5–8. [Google Scholar] [CrossRef]
- Aktipis, C.A.; Boddy, A.M.; Jansen, G.; Hibner, U.; Hochberg, M.E.; Maley, C.C.; Wilkinson, G.S. Cancer across the tree of life: Cooperation and cheating in multicellularity. Phil. Trans. R. Soc. B 2015, 370, 20140219. [Google Scholar] [CrossRef] [Green Version]
- Lou, E. Intercellular Conduits in Tumors: The New Social Network. Trends Cancer 2016, 2, 3–5. [Google Scholar] [CrossRef] [Green Version]
- Greenbaum, M.P.; Yan, W.; WU, M.-H.; Lin, Y.-N.; Agno, J.E.; Sharma, M.; Braun, R.E.; Rajkovic, A.; Matzuk, M.M. TEX14 is essential for intercellular bridges and fertility in male mice. Proc. Natl. Acad. Sci. USA 2006, 103, 4982–4987. [Google Scholar] [CrossRef] [PubMed] [Green Version]
- Greenbaum, M.P.; Iwamori, T.; Buchold, G.M.; Matzuk, M.M. Germ Cell Intercellular Bridges. Cold Spring Harb. Perspect Biol. 2011, 3, a005850. [Google Scholar] [CrossRef] [PubMed] [Green Version]
- Harper, D.C.; Theos, A.C.; Herman, K.E.; Tenza, D.; Raposo, G.; Marks, M.S. Premelanosome amyloid-like fibrils are composed of only golgi-processed forms of Pmel17 that have been proteolytically processed in endosomes. J. Biol. Chem. 2008, 283, 2307–2322. [Google Scholar] [CrossRef] [Green Version]
- Maury, C.P. Self-propagating b-sheet polypeptide structures as prebiotic informational molecular entities: The amyloid world. Orig. Life Evol. Biosph. 2009, 39, 141–150. [Google Scholar] [CrossRef] [PubMed]
- Maury, C.P. The emerging concept of functional amyloid. J. Intern. Med. 2009, 265, 329–334. [Google Scholar] [CrossRef]
- Falabella, P.; Riviello, L.; Pascale, M.; Di Lelio, I.; Tettamanti, G.; Grimaldi, A.; Iannone, C.; Monti, M.; Pucci, P.; Tamburro, A.M.; et al. Functional amyloids in insect immune response. Insect Biochem. Mol. Biol. 2012, 42, 203–211. [Google Scholar] [CrossRef]
- Kelly, J.W.; Balch, W.E. Amyloid as natural product. J. Cell Biol. 2003, 161, 461–466. [Google Scholar] [CrossRef] [Green Version]
- Slominski, A.; Zbytek, B.; Szczesniewski, A.; Semak, I.; Kaminski, J.; Sweatman, T.; Wortsman, J. CRH stimulation of corticosteroids production in melanocytes is mediated by ACTH. Am. J. Physiol. Endocrinol. Metab. 2005, 288, 701–706. [Google Scholar] [CrossRef] [Green Version]
- Chiti, F.; Dobson, C.M. Protein misfolding, functional amyloid, and human disease. Annu. Rev. Biochem. 2006, 75, 333–366. [Google Scholar] [CrossRef] [Green Version]
- Hornsveld, M.; Dansen, T.B. The Hallmarks of Cancer from a Redox Perspective. Antiox. Redox Signal. 2016, 25, 300–325. [Google Scholar] [CrossRef]
- Phillips, S.L.; Williams, C.B.; Zambrano, J.N.; Williams, C.J.; Yeh, E.S. Connexin 43 in the development and progression of breast cancer: What’s the connection? (Review). Int. J. Oncol. 2017, 51, 1005–1013. [Google Scholar] [CrossRef] [PubMed] [Green Version]
- Pennarossa, G.; Maffei, S.; Tettamanti, G.; Congiu, T.; de Eguileor, M.; Gandolfi, F.; Brevini, T.A.L. Intercellular bridges are essential for human parthenogenetic cell survival. Mechan. Develop. 2015, 136, 30–39. [Google Scholar] [CrossRef] [PubMed]
- Vidulescu, C.; Clejan, S.; O’Connor, K.C. Vesicle traffic through intercellular bridges in DU 145 human prostate cancer cells. J. Cell. Mol. Med. 2004, 8, 388–396. [Google Scholar] [CrossRef] [PubMed]
- Trosko, J.E.; Chang, C.-C.; Upham, B.L.; Tai, M.-H. Ignored Hallmarks of Carcinogenesis: Stem Cells and Cell-Cell Communication. Ann. N.Y. Acad. Sci. 2004, 1028, 192–201. [Google Scholar] [CrossRef] [PubMed]
- Trosko, J.E. The gap junction as a “Biological Rosetta Stone”: Implications of evolution, stem cells to homeostatic regulation of health and disease in the Barker hypothesis. J. Cell Comm. Signal. 2011, 5, 53–66. [Google Scholar] [CrossRef] [Green Version]
- Mondal, G.; Ohashi, A.; Yang, L.; Rowley, M.; Couch, F.J. Tex14, a Plk1 regulated protein, is required for kinetochore-microtubule attachment and regulation of the spindle assembly checkpoint. Mol. Cell. 2012, 45, 680–695. [Google Scholar] [CrossRef] [Green Version]
- Magin, T.M.; Vijayaraj, P.; Leube, R.E. Structural and regulatory functions of keratins. Exp. Cell Res. 2007, 313, 2021–2032. [Google Scholar] [CrossRef]
- Sanghvi-Shah, R.; Weber, G.F. Intermediate Filaments at the Junction of Mechanotransduction, Migration, and Development. Front. Cell Dev. Biol. 2017, 5, 81. [Google Scholar] [CrossRef]
- Pastor-Pareja, J.C.; Xu, T. Dissecting Social Cell Biology and Tumors Using Drosophila genetics. Annu. Rev. Genet. 2013, 47, 51–74. [Google Scholar] [CrossRef] [Green Version]
- Hirschhaeuser, F.; Menne, H.; Dittfeld, C.; West, J.; Mueller-Klieser, W.; Kunz-Schughart, L.A. Multicellular tumor spheroids: An underestimated tool is catching up again. J. Biotechnol. 2010, 148, 3–15. [Google Scholar] [CrossRef]
- Eiraku, M.; Takata, N.; Ishibashi, H.; Kawada, M.; Sakakura, E.; Okuda, S. Self-organizing optic-cup morphogenesis in three-dimensional culture. Nature 2011, 472, 51–56. [Google Scholar] [CrossRef] [PubMed]
- Takasato, M.; Er, P.X.; Chiu, H.S.; Little, M.H. Generating kidney organoids from human pluripotent stem cells. Nat. Protoc. 2016, 11, 1681–1692. [Google Scholar] [CrossRef] [PubMed] [Green Version]
- Thakuri, P.S.; Liu, C.; Luker, G.D.; Tavana, H. Biomaterials-Based Approaches to Tumor Spheroid and Organoid Modeling. Adv. Healthc. Mater. 2018, 7, e1700980. [Google Scholar] [CrossRef] [PubMed]
- Qu, Y.; Han, B.; Yu, Y.; Yao, W.; Bose, S.; Karlan, B.Y.; Giuliano, A.E.; Cui, X. Evaluation of MCF10A as a Reliable Model for Normal Human Mammary Epithelial Cells. PLoS ONE 2015, 10, e0131285. [Google Scholar] [CrossRef] [Green Version]
- Felton, V.M.; Borok, Z.; Willis, B.C. N-acetylcysteine inhibits alveolar epithelial-mesenchymal transition. Am.J. Physiol. Lung Cell Mol. Physiol. 2009, 297, L805–L812. [Google Scholar] [CrossRef] [Green Version]
- Finn, N.A.; Kemp, M.L. Pro-oxidant and antioxidant effects of N-acetylcysteine regulate doxorubicin-induced NF-kappa B activity in leukemic cells. Mol. Biosyst. 2012, 8, 650–662. [Google Scholar] [CrossRef] [Green Version]
- Sung-Gook, C.; Sang-Mi, W.; Seong-Gyu, K. Butein suppresses breast cancer growth by reducing a production of intracellular reactive species. J. Exp. Clin. Cancer Res. 2014, 33, 51. [Google Scholar]
- Kelm, J.M.; Timmins, N.E.; Brown, C.J.; Fussenegger, M.; Nielsen, L.K. Method for generation of homogeneous multicellular tumor spheroids applicable to a wide variety of cell types. Biotechnol. Bioeng. 2003, 83, 173–180. [Google Scholar] [CrossRef]
- Le Vine, H., III. Quantification of β-sheet amyloid fibril structures with thioflavin T. Methods Enzymol. 1999, 309, 274–284. [Google Scholar]
- Pulze, L.; Bassani, B.; Gini, E.; D’Antona, P.; Grimaldi, A.; Luini, A.; Marino, F.; Noonan, D.M.; Tettamanti, G.; Valvassori, R.; et al. NET amyloidogenic backbone in human activated neutrophils. Clin. Exp. Immunol. 2015, 183, 469–479. [Google Scholar] [CrossRef] [Green Version]
- Goldschmidt, L.; Teng, P.K.; Riek, R.; Eisenberg, D. Identifying the amylome, proteins capable of forming amyloid-like fibrils. Proc. Natl. Acad. Sci. USA 2010, 107, 3487–3492. [Google Scholar] [CrossRef] [PubMed] [Green Version]
- Greenwald, J.; Riek, R. Biology of Amyloid: Structure, Function, and Regulation. Structure 2010, 18, 1244–1260. [Google Scholar] [CrossRef] [PubMed]


| Antibody | Description | Company | Application | Dilution |
|---|---|---|---|---|
| SSEA-4 | Mouse monoclonal [MC813] | Cell Signaling Technology | IF | 1:500 |
| Sox2 | Rabbit polyclonal | Proteintech | IF | 1:100 |
| WB | 1:2000 | |||
| Connexin 43 | Rabbit polyclonal | Assay biotech | IF | 1:100 |
| WB | 1:500 | |||
| E-cadherin | Mouse monoclonal [SHE78-7] | Calbiochelm | IF | 1:500 |
| Pan-Cytokeratin | Mouse monoclonal [C-11] | GeneTex | IF | 1:200 |
| TEX14 | Rabbit polyclonal | Proteintech | IF | 1:200 |
| WB | 1:1000 | |||
| Pmel17 | Mouse monoclonal [HMB45] | Abcam | IF | 1:200 |
| WB | 1:400 | |||
| ACTH | Rabbit polyclonal | Abcam | IF | 1:100 |
| α-MSH | Rabbit polyclonal | Abcam | IF | 1:100 |
| IL18 | Rabbit polyclonal | Thermo Scientific | IF | 1:50 |
| WB | 1:1000 | |||
| GAPDH | Rabbit polyclonal | Proteintech | WB | 1:8000 |
© 2020 by the authors. Licensee MDPI, Basel, Switzerland. This article is an open access article distributed under the terms and conditions of the Creative Commons Attribution (CC BY) license (http://creativecommons.org/licenses/by/4.0/).
Share and Cite
Pulze, L.; Congiu, T.; Brevini, T.A.L.; Grimaldi, A.; Tettamanti, G.; D’Antona, P.; Baranzini, N.; Acquati, F.; Ferraro, F.; de Eguileor, M. MCF7 Spheroid Development: New Insight about Spatio/Temporal Arrangements of TNTs, Amyloid Fibrils, Cell Connections, and Cellular Bridges. Int. J. Mol. Sci. 2020, 21, 5400. https://0-doi-org.brum.beds.ac.uk/10.3390/ijms21155400
Pulze L, Congiu T, Brevini TAL, Grimaldi A, Tettamanti G, D’Antona P, Baranzini N, Acquati F, Ferraro F, de Eguileor M. MCF7 Spheroid Development: New Insight about Spatio/Temporal Arrangements of TNTs, Amyloid Fibrils, Cell Connections, and Cellular Bridges. International Journal of Molecular Sciences. 2020; 21(15):5400. https://0-doi-org.brum.beds.ac.uk/10.3390/ijms21155400
Chicago/Turabian StylePulze, Laura, Terenzio Congiu, Tiziana A. L. Brevini, Annalisa Grimaldi, Gianluca Tettamanti, Paola D’Antona, Nicolò Baranzini, Francesco Acquati, Federico Ferraro, and Magda de Eguileor. 2020. "MCF7 Spheroid Development: New Insight about Spatio/Temporal Arrangements of TNTs, Amyloid Fibrils, Cell Connections, and Cellular Bridges" International Journal of Molecular Sciences 21, no. 15: 5400. https://0-doi-org.brum.beds.ac.uk/10.3390/ijms21155400