The Alleviation of Photosynthetic Damage in Tomato under Drought and Cold Stress by High CO2 and Melatonin

 , , , ,
Abstract
:1. Introduction
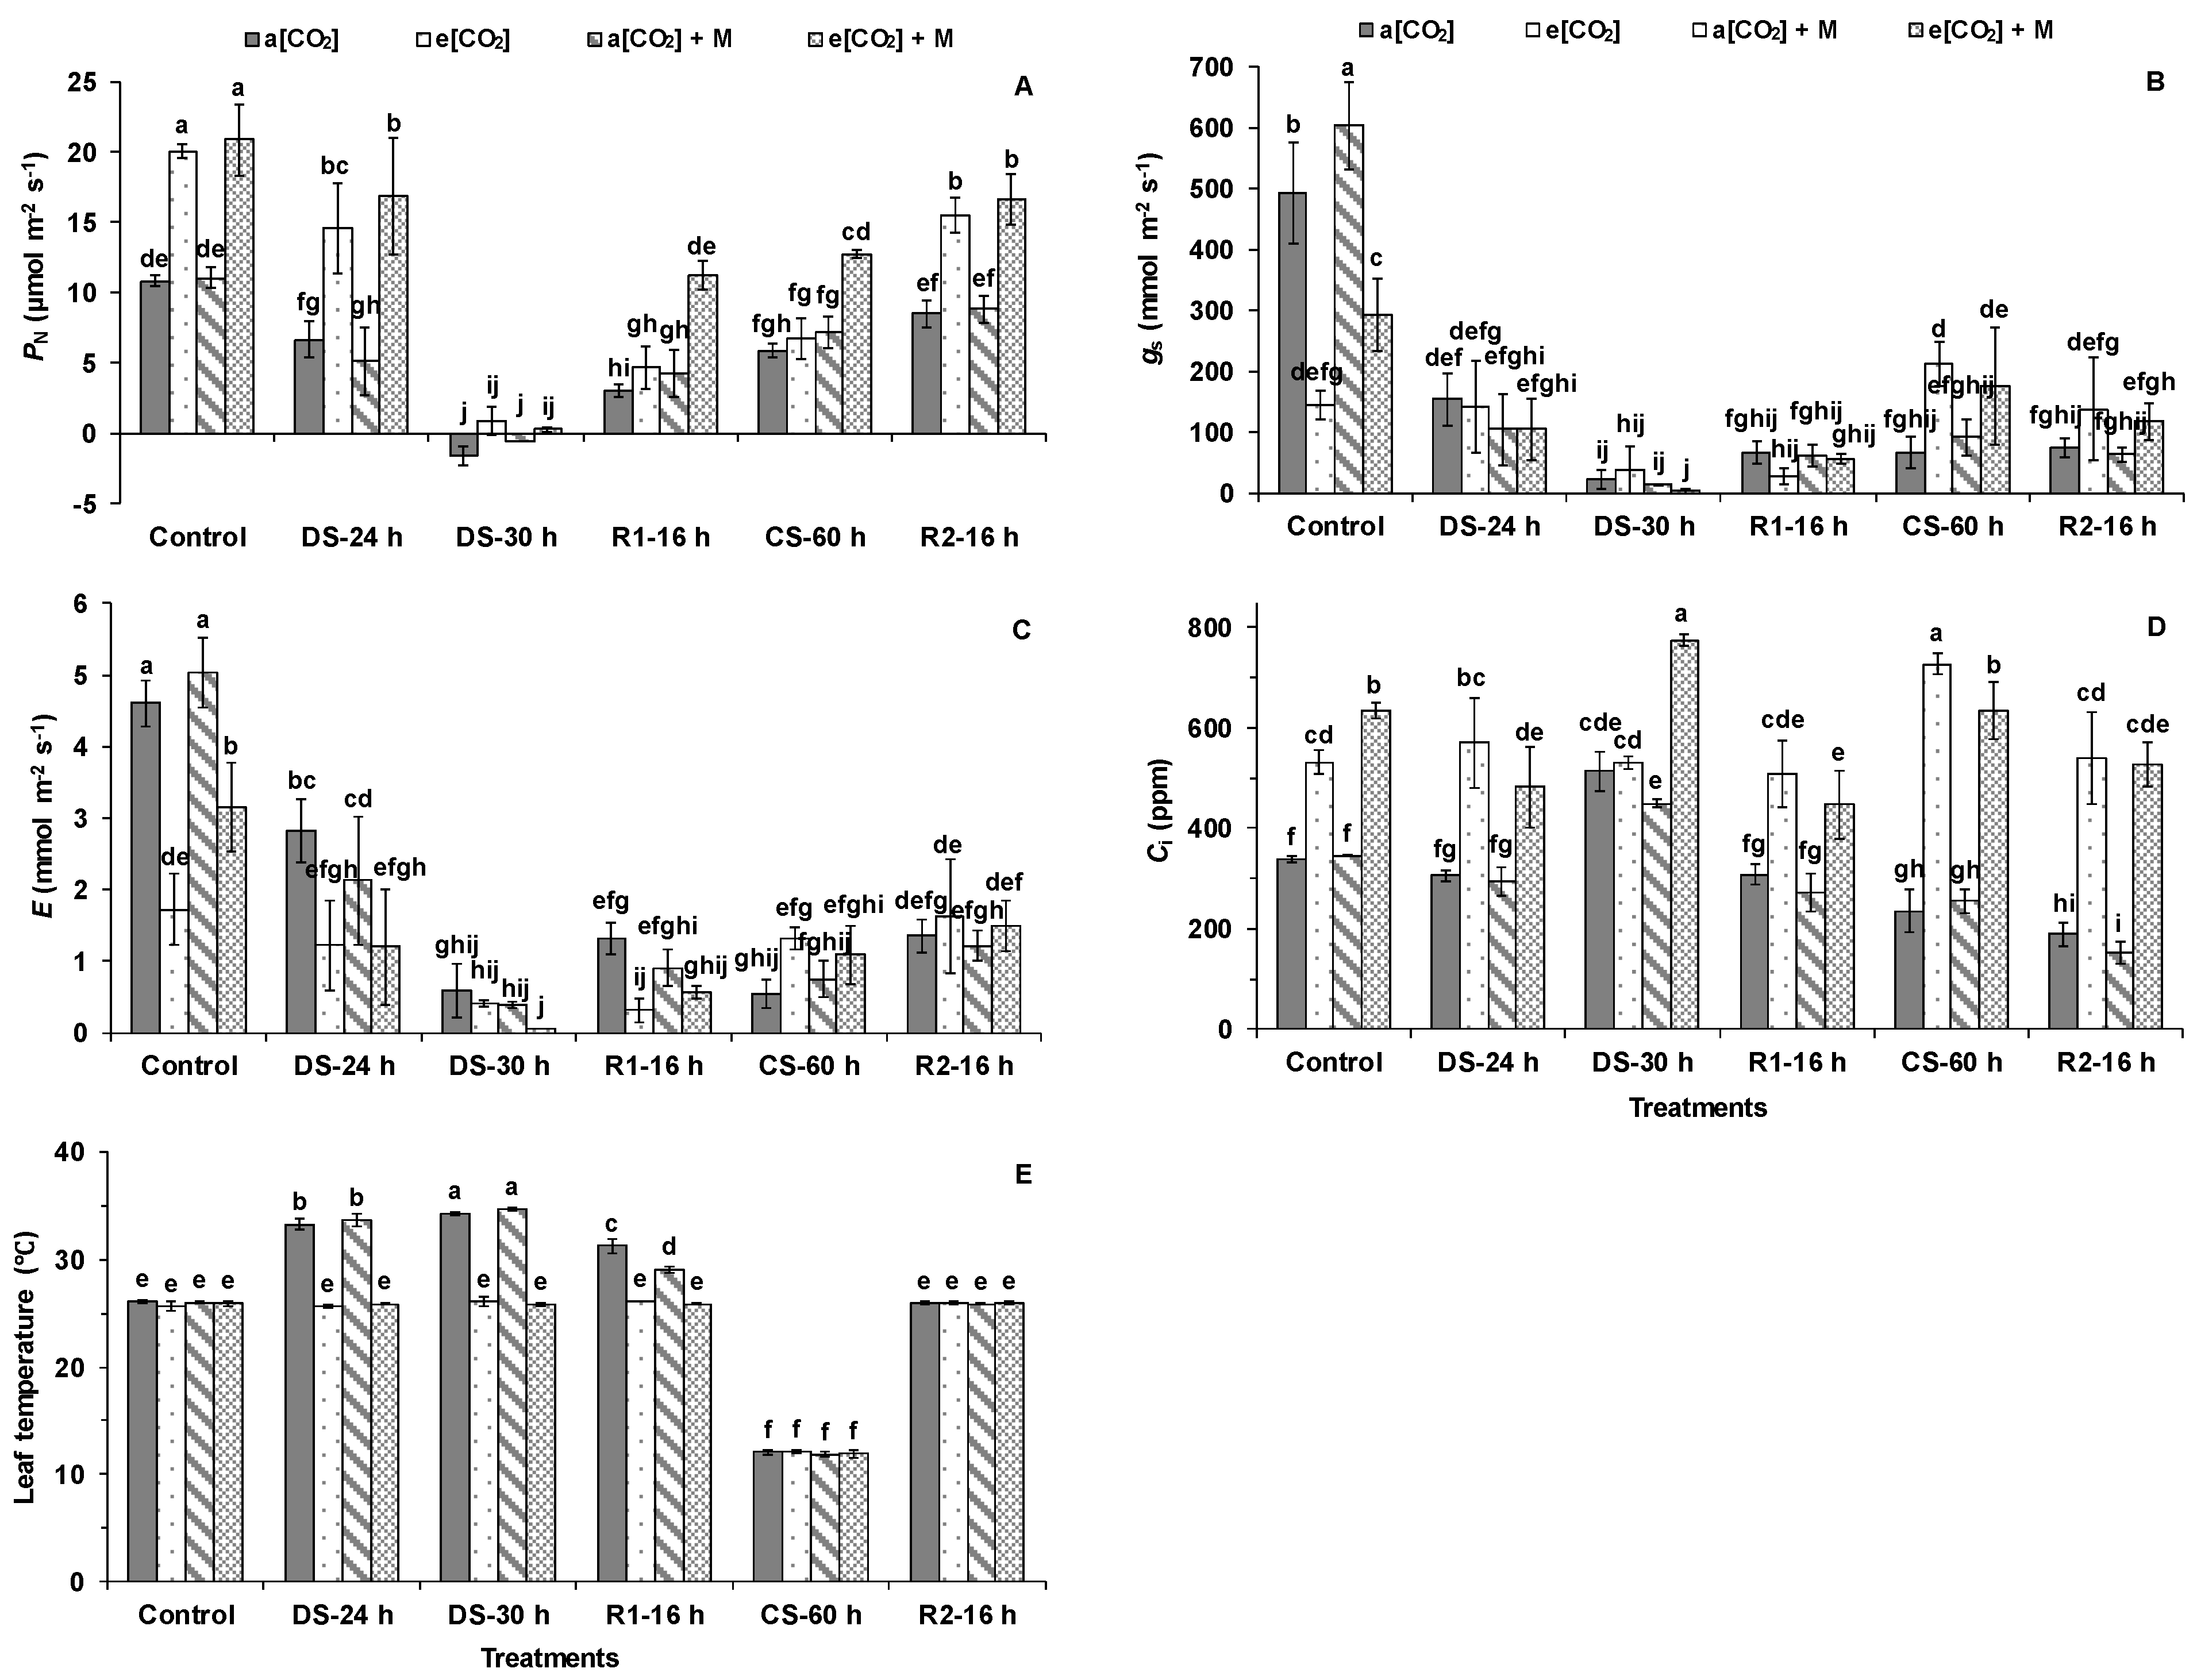
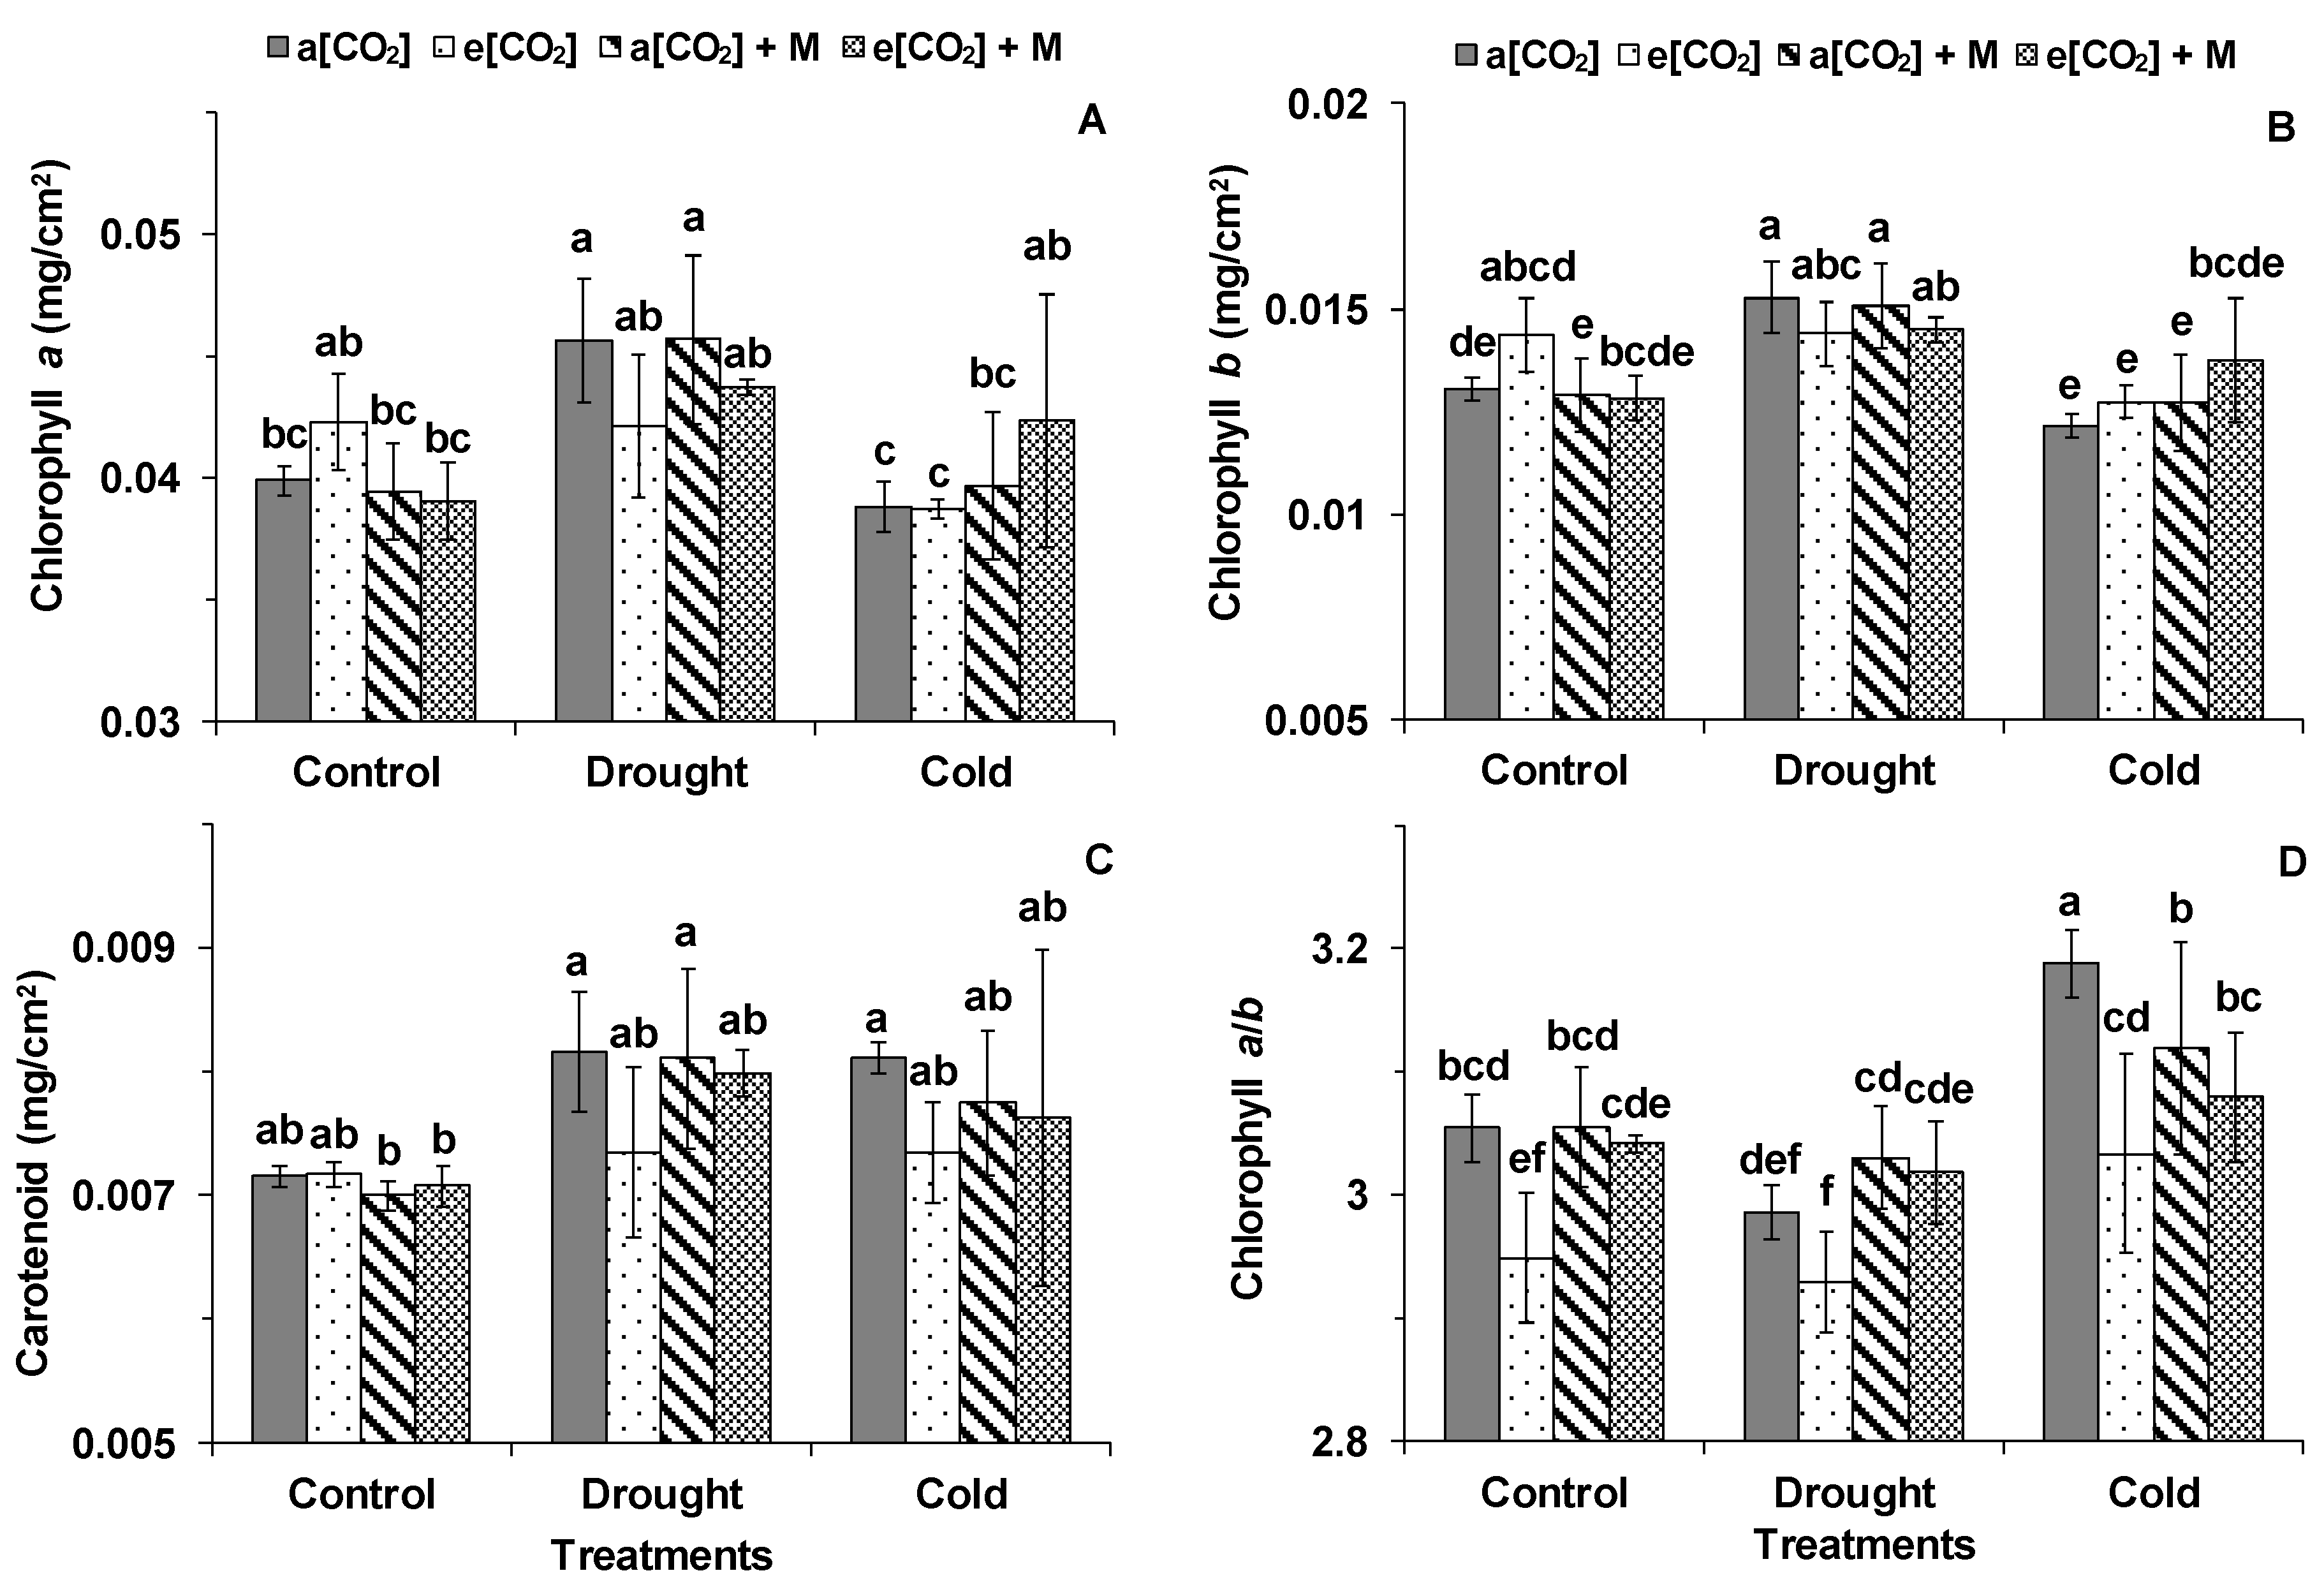
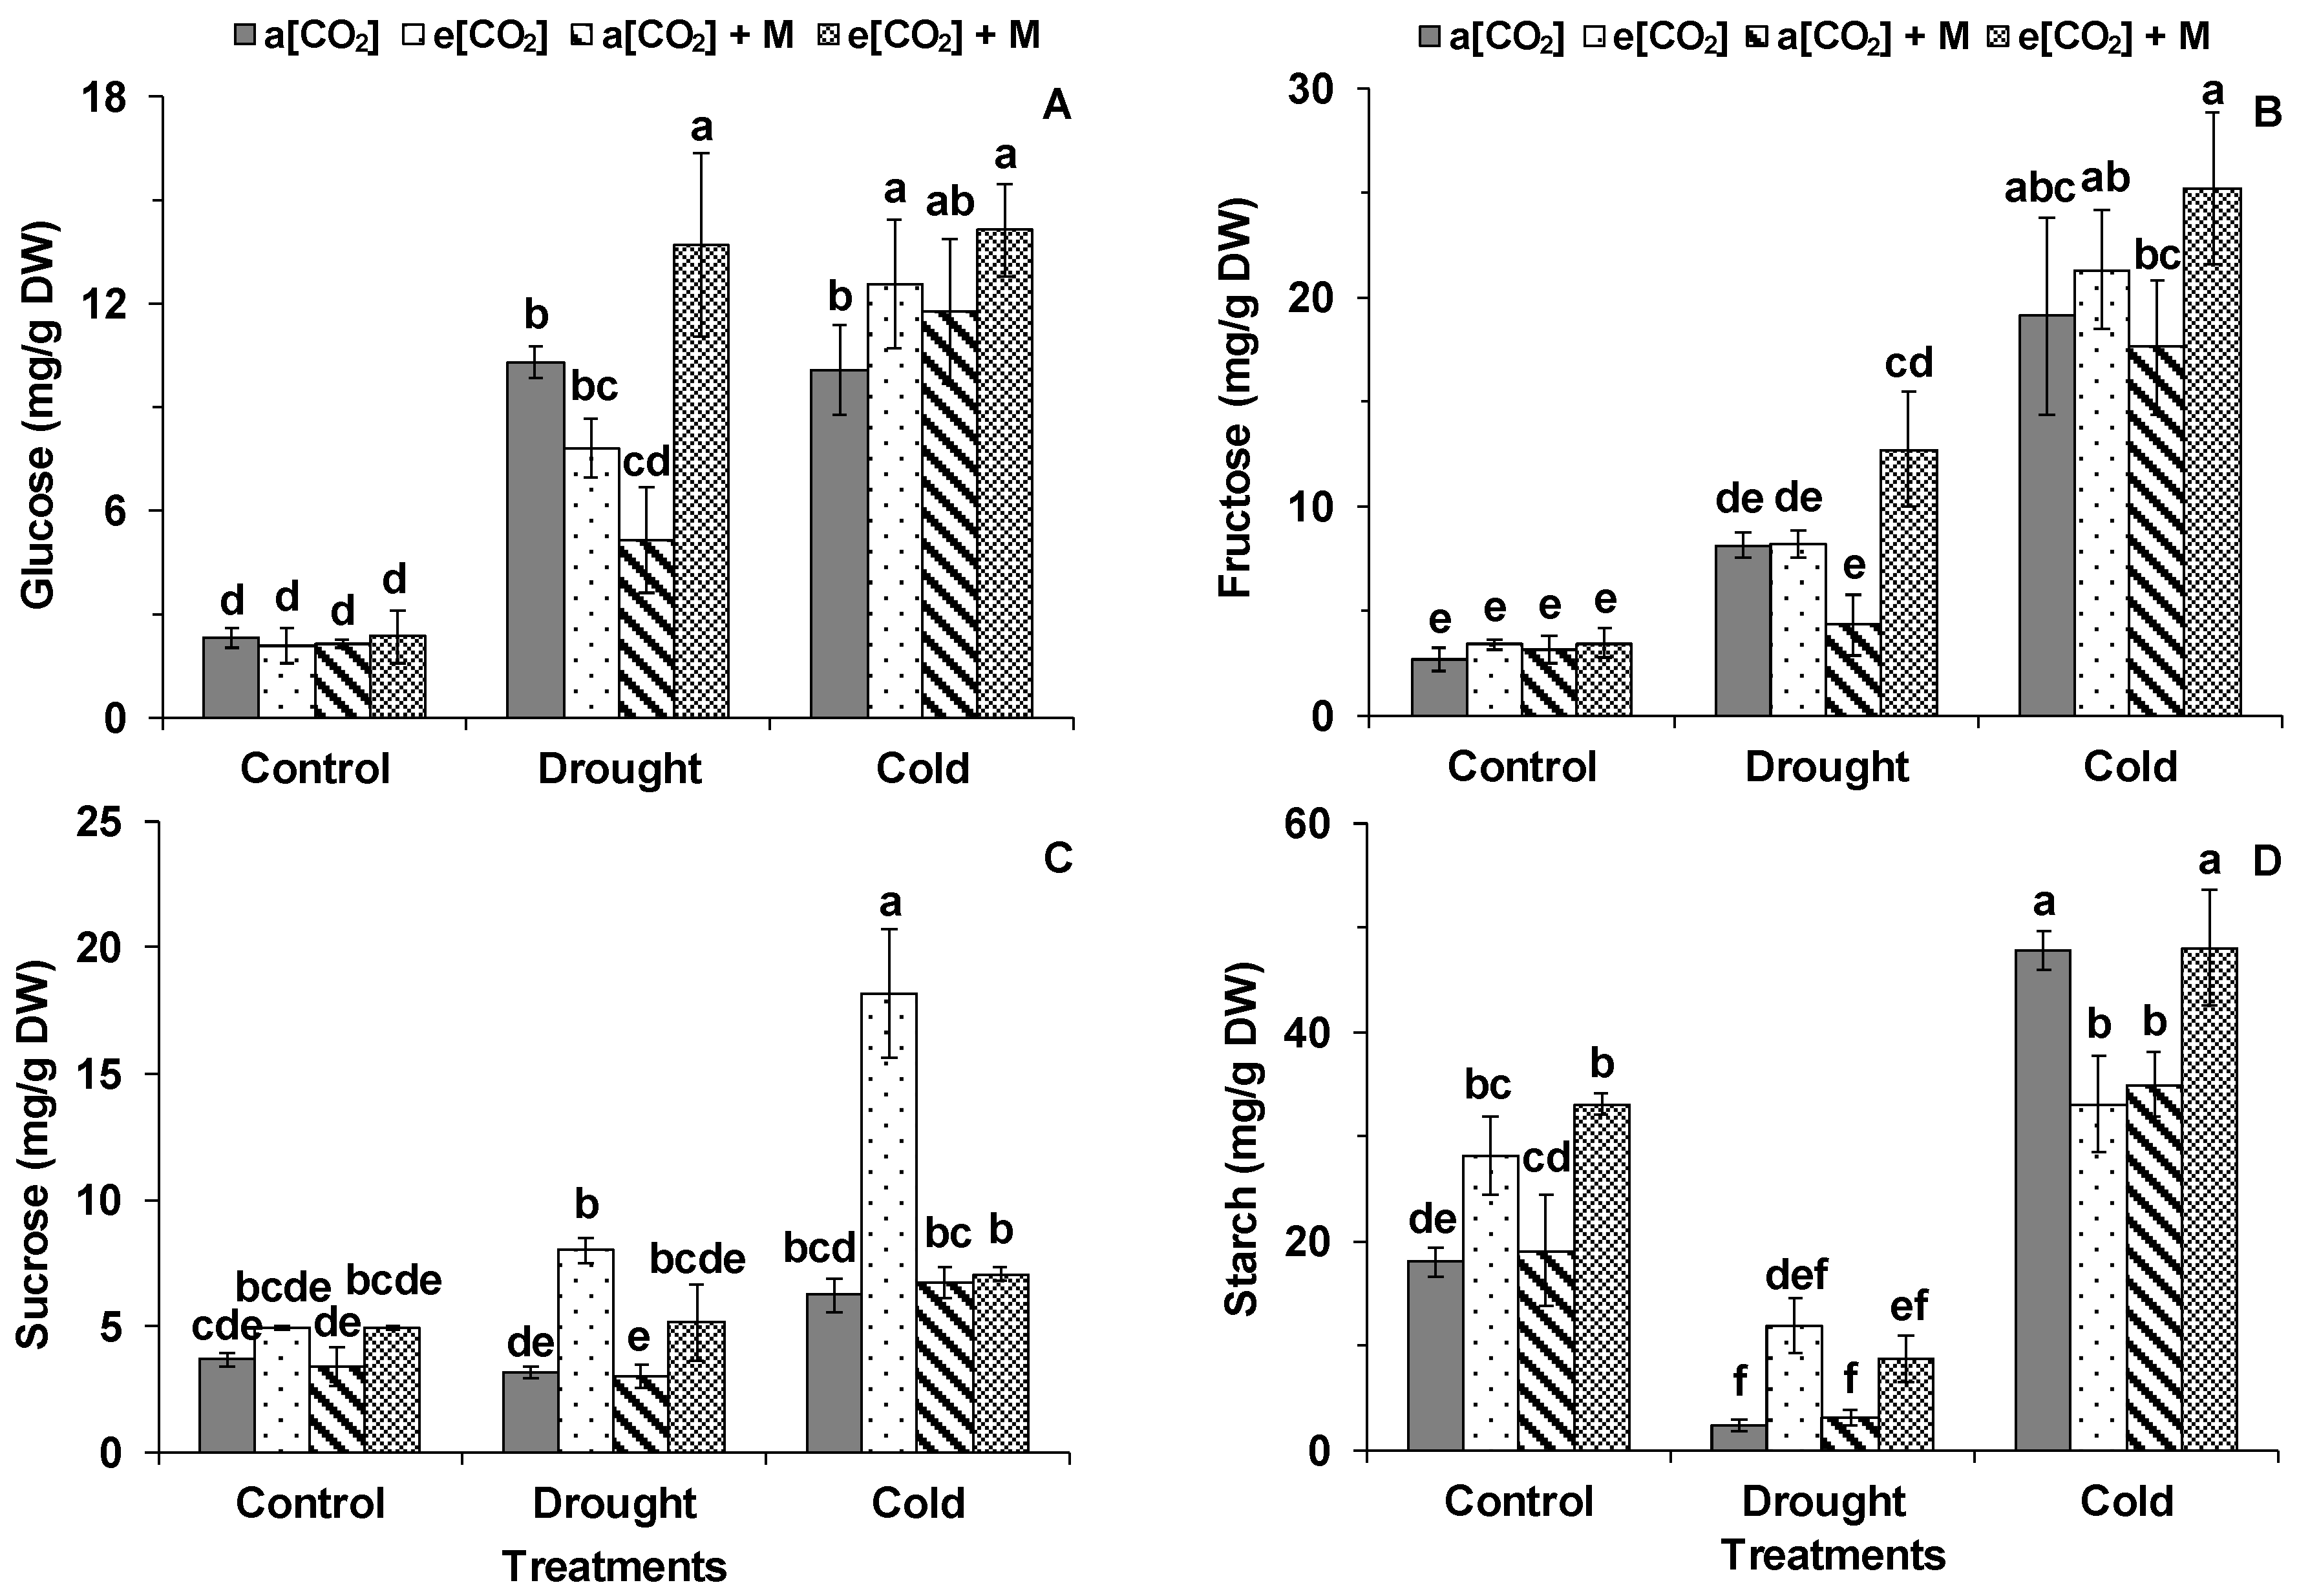
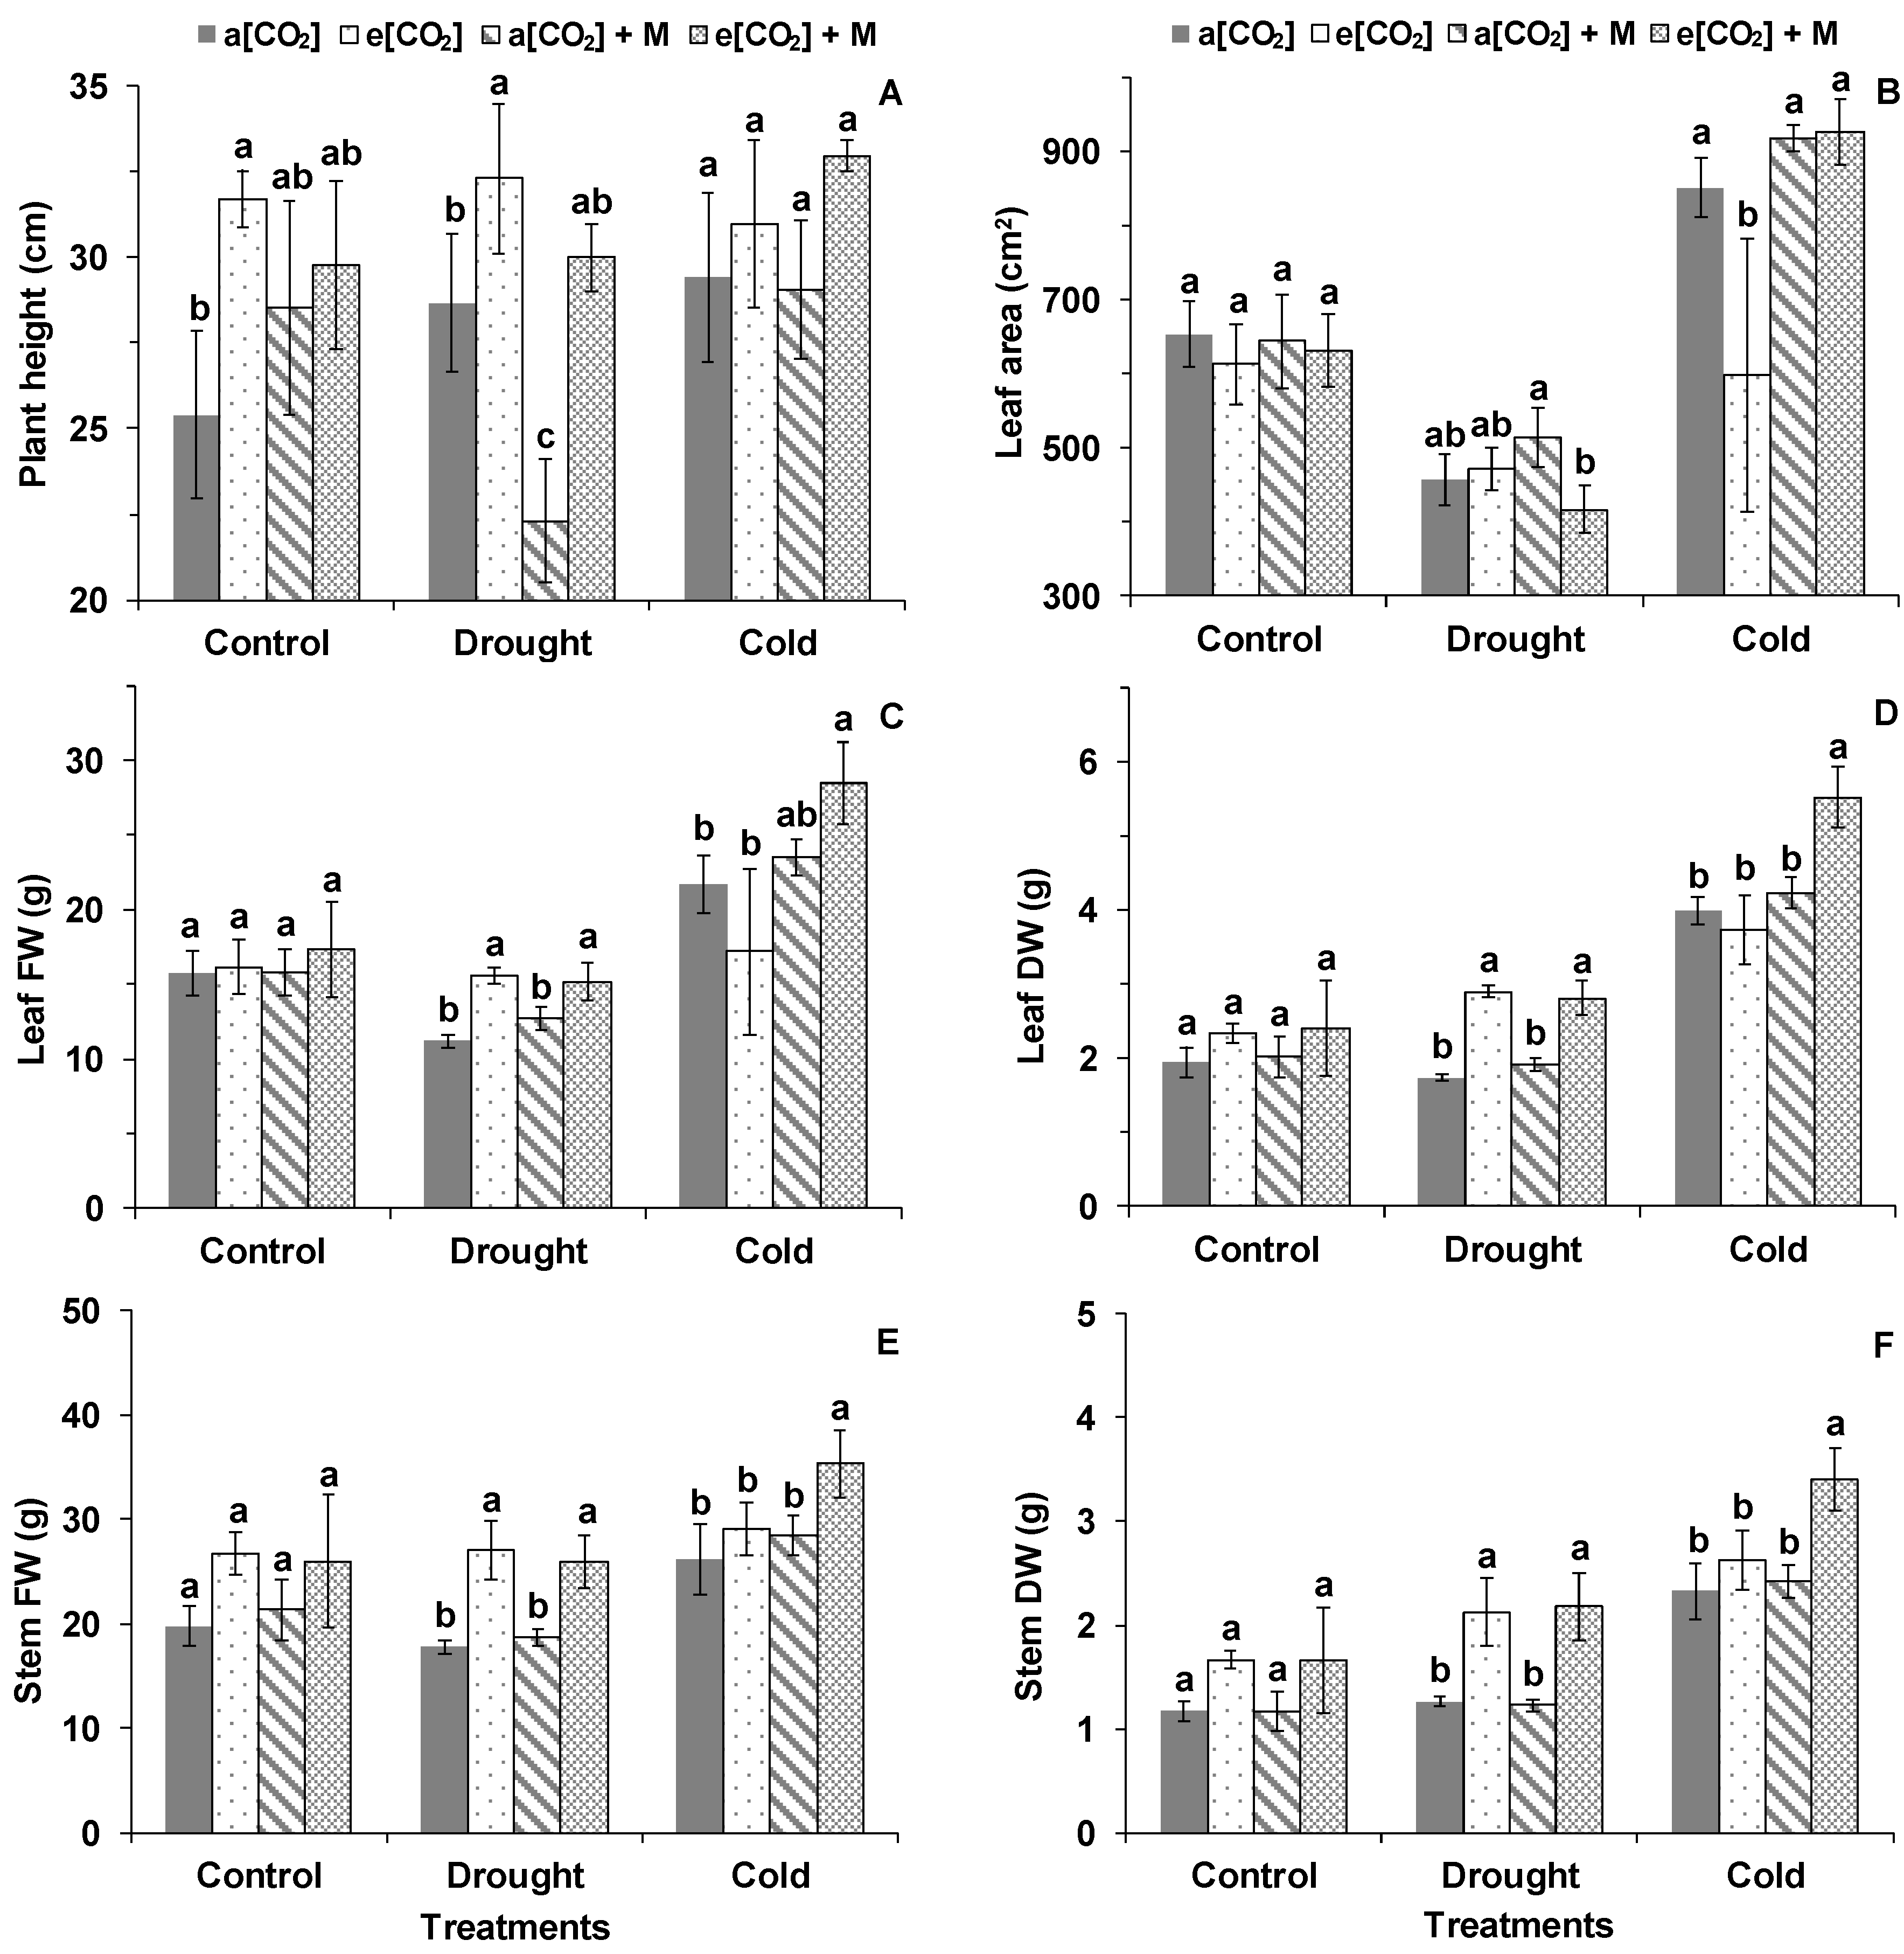
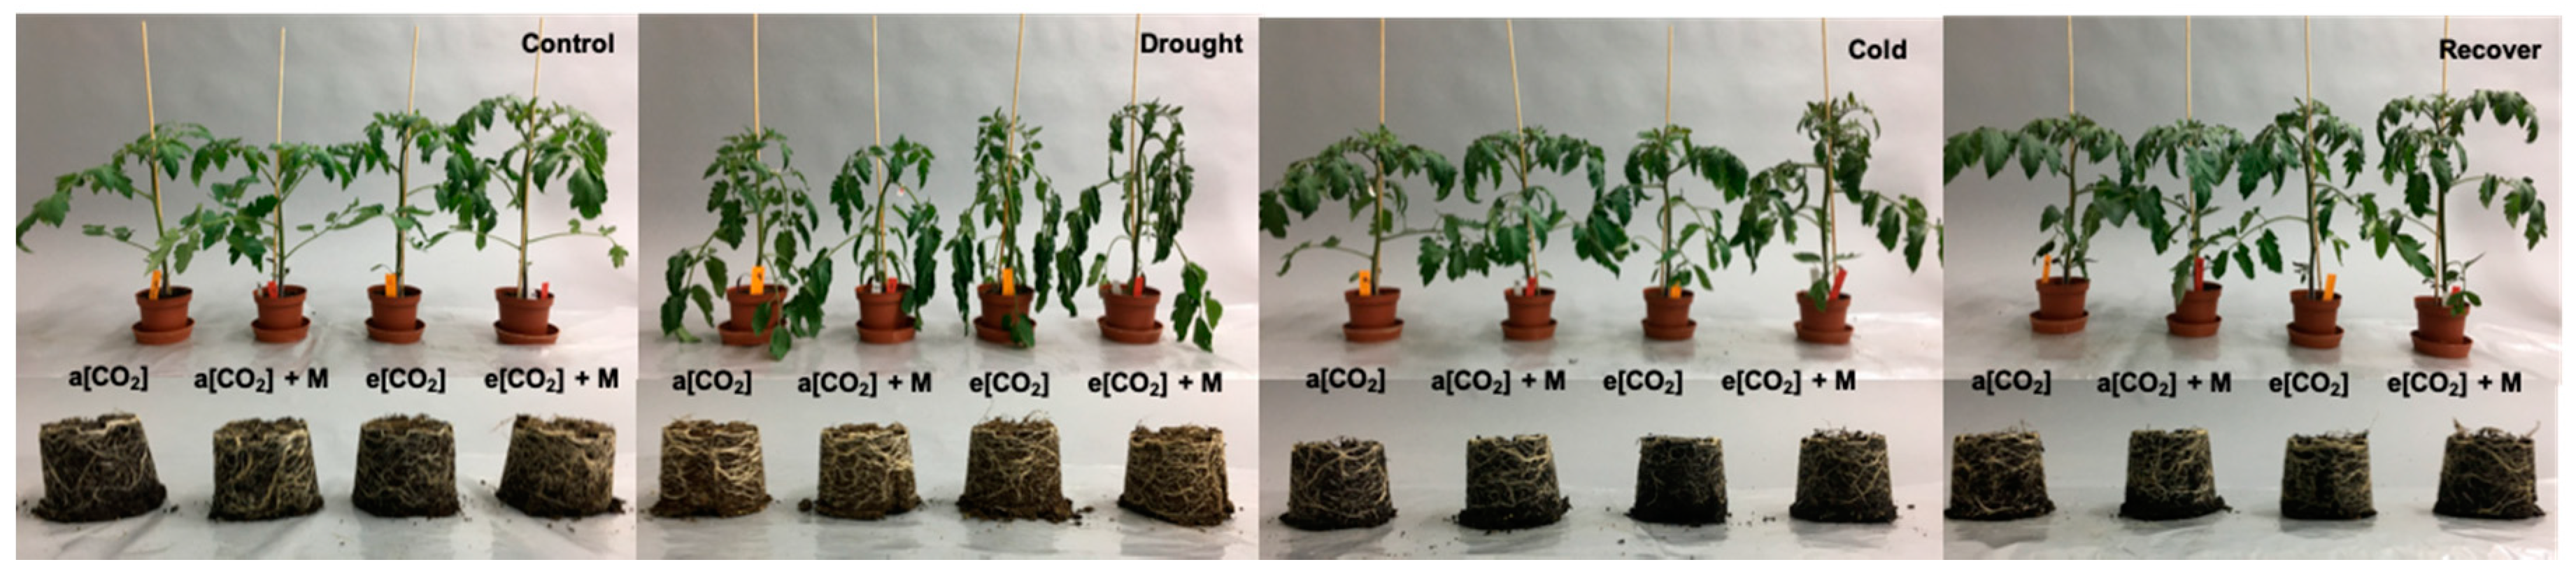
2. Results
3. Discussion
3.1. Effects of e[CO2] on Tomato Photosynthesis
3.2. The Melatonin Played Positive Roles in Tomato Plants Grown Under Cold and e[CO2]
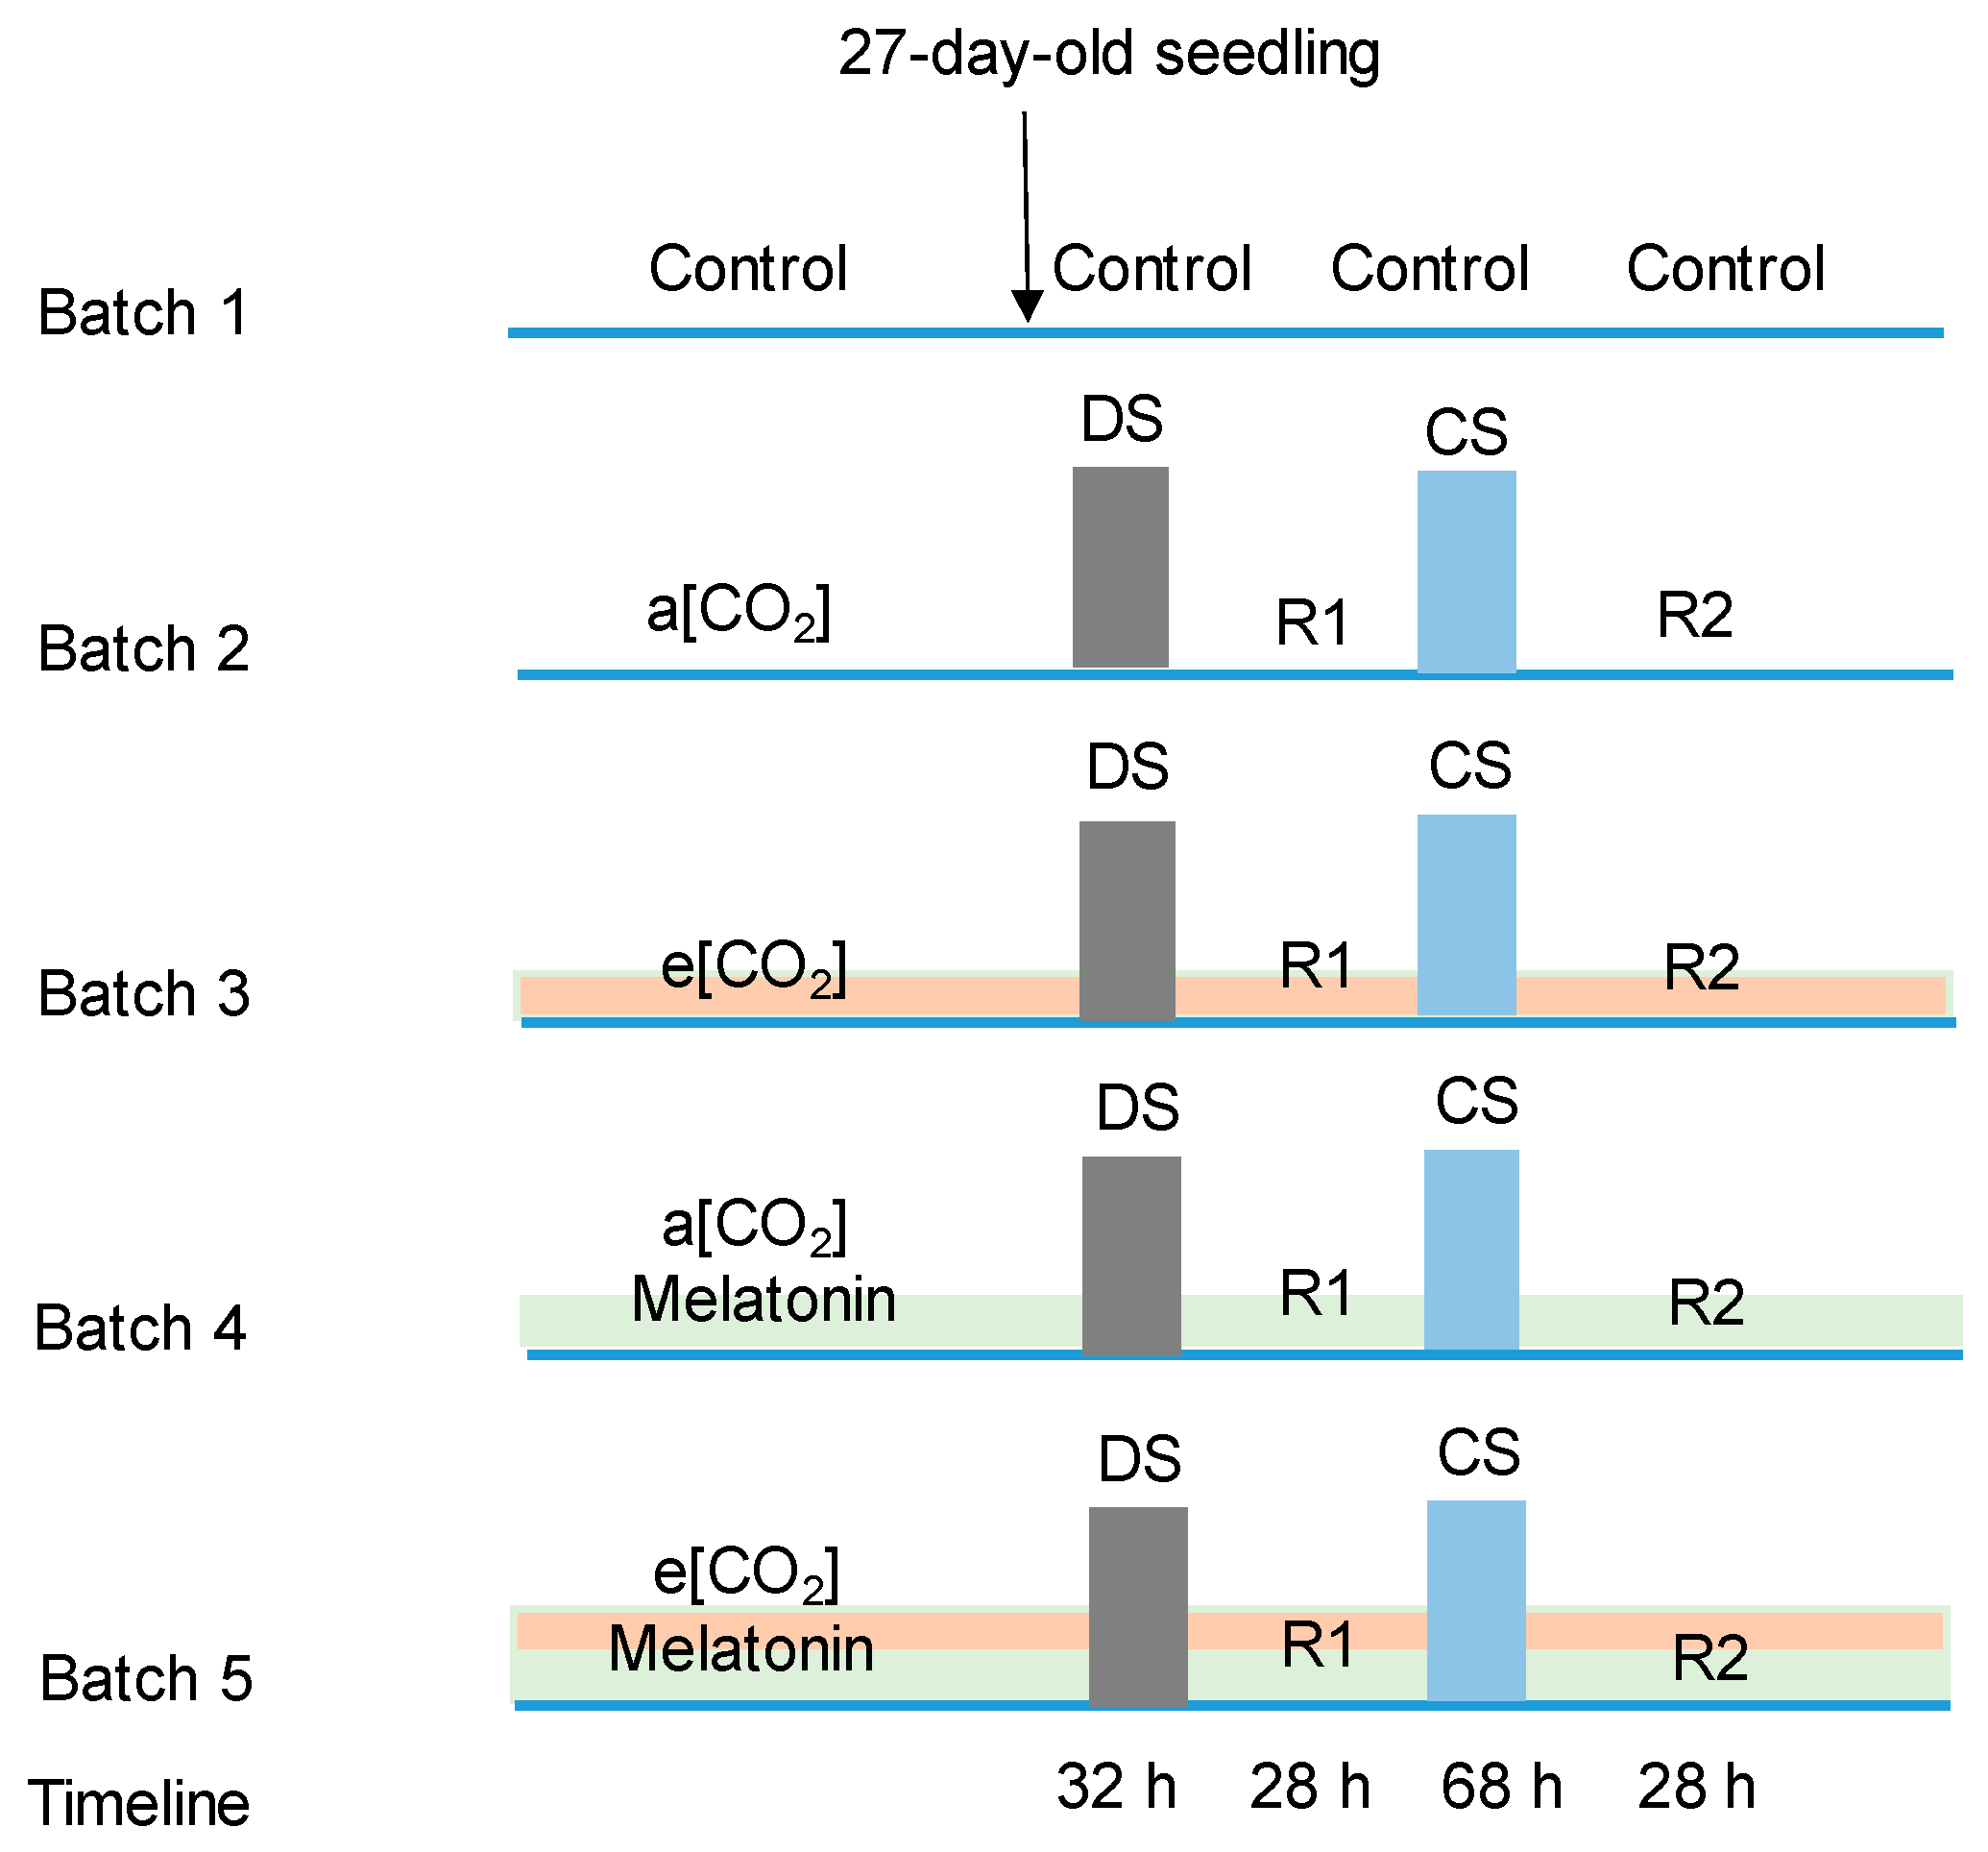
4. Materials and Methods
Growth Environmental Condition and Treatments
Supplementary Materials
Author Contributions
Funding
Acknowledgments
Conflicts of Interest
References
- Smith, K.; Woodward, A.; Campbell-Lendrum, D.; Chadee, D.; Honda, Y.; Liu, Q.; Olwoch, J.; Revich, B.; Sauerborn, R.; Aranda, C.; et al. Human health: Impacts, adaptation, and co-benefits. In Climate Change 2014: Impacts, Adaptation, and Vulnerability. Part A: Global and Sectoral Aspects. Contribution of Working Group II to the Fifth Assessment Report of the Intergovernmental Panel on Climate Change; Field, C.B., Barros, V., Dokken, D.J., Eds.; Cambridge University Press: Cambridge, UK, 2014. [Google Scholar]
- Dhankher, O.P.; Foyer, C.H. Climate resilient crops for improving global food security and safety. Plant Cell Environ. 2018, 41, 877–884. [Google Scholar] [CrossRef]
- Allen, D.J.; Ort, D.R. Impacts of chilling temperatures on photosynthesis in warm-climate plants. Trends Plant Sci. 2001, 6, 36–42. [Google Scholar] [CrossRef]
- Cattivelli, L.; Rizza, F.; Badeck, F.; Mazzucotelli, E.; Mastrangelo, A.M.; Francia, E.; Marè, C.; Tondelli, A.; Stanca, A.M. Drought tolerance improvement in crop plants: An integrated view from breeding to genomics. Field Crop. Res. 2008, 105, 1–14. [Google Scholar] [CrossRef]
- Reich, P.B.; Hobbie, S.; Lee, T.; Pastore, M.A. Unexpected reversal of C3versus C4grass response to elevated CO2during a 20-year field experiment. Science 2018, 360, 317–320. [Google Scholar] [CrossRef] [Green Version]
- Liu, J.; Hu, T.; Fang, L.; Peng, X.; Liu, F. CO2 elevation modulates the response of leaf gas exchange to progressive soil drying in tomato plants. Agric. For. Meteorol. 2019, 268, 181–188. [Google Scholar] [CrossRef]
- Swann, A.L.S. Plants and Drought in a Changing Climate. Curr. Clim. Chang. Rep. 2018, 4, 192–201. [Google Scholar] [CrossRef] [Green Version]
- Loik, M.E.; Huxman, T.E.; Hamerlynck, E.P.; Smith, S.D. Low temperature tolerance and cold acclimation for seedlings of three Mojave Desert Yucca species exposed to elevated CO2. J. Arid. Environ. 2000, 46, 43–56. [Google Scholar] [CrossRef]
- Zhu, X.; Liu, S.; Sun, L.; Song, F.; Liu, F.; Li, X. Cold Tolerance of Photosynthetic Electron Transport System Is Enhanced in Wheat Plants Grown Under Elevated CO2. Front. Plant Sci. 2018, 9. [Google Scholar] [CrossRef]
- Wang, P.; Sun, X.; Li, C.; Wei, Z.; Liang, D.; Ma, F. Long-term exogenous application of melatonin delays drought-induced leaf senescence in apple. J. Pineal Res. 2012, 54, 292–302. [Google Scholar] [CrossRef]
- Li, C.; Tan, D.-X.; Liang, D.; Chang, C.; Jia, D.; Ma, F. Melatonin mediates the regulation of ABA metabolism, free-radical scavenging, and stomatal behaviour in two Malus species under drought stress. J. Exp. Bot. 2015, 66, 669–680. [Google Scholar] [CrossRef] [Green Version]
- Cui, G.; Zhao, X.; Liu, S.; Sun, F.; Zhang, C.; Xi, Y. Beneficial effects of melatonin in overcoming drought stress in wheat seedlings. Plant Physiol. Biochem. 2017, 118, 138–149. [Google Scholar] [CrossRef]
- Fleta-Soriano, E.; Díaz, L.; Bonet, E.; Munné-Bosch, S. Melatonin may exert a protective role against drought stress in maize. J. Agron. Crop. Sci. 2017, 203, 286–294. [Google Scholar] [CrossRef]
- Posmyk, M.M.; Bałabusta, M.; Wieczorek, M.; Sliwinska, E.; Janas, K.M. Melatonin applied to cucumber (Cucumis sativus L.) seeds improves germination during chilling stress. J. Pineal Res. 2009, 46, 214–223. [Google Scholar] [CrossRef]
- Li, X.; Tan, D.; Jiang, D.; Liu, F. Melatonin enhances cold tolerance in drought-primed wild-type and abscisic acid-deficient mutant barley. J. Pineal Res. 2016, 61, 328–339. [Google Scholar] [CrossRef]
- Zhao, H.; Su, T.; Huo, L.; Wei, H.; Jiang, Y.; Xu, L.; Ma, F. Unveiling the mechanism of melatonin impacts on maize seedling growth: Sugar metabolism as a case. J. Pineal Res. 2015, 59, 255–266. [Google Scholar] [CrossRef]
- Li, X.; Brestic, M.; Tan, D.X.; Zivcak, M.; Zhu, X.; Liu, S.; Song, F.; Reiter, R.J.; Liu, F. Melatonin alleviates low PSI- limited carbon assimilation under elevated CO2 and enhances the cold tolerance of offspring in chlorophyll b- deficient mutant wheat. J. Pineal Res. 2018, 64, 12453. [Google Scholar] [CrossRef]
- Pazzagli, P.T.; Weiner, J.; Liu, F. Effects of CO 2 elevation and irrigation regimes on leaf gas exchange, plant water relations, and water use efficiency of two tomato cultivars. Agric. Water Manag. 2016, 169, 26–33. [Google Scholar] [CrossRef]
- Liu, J.; Wang, W.; Wang, L.; Sun, Y. Exogenous melatonin improves seedling health index and drought tolerance in tomato. Plant Growth Regul. 2015, 77, 317–326. [Google Scholar] [CrossRef]
- Ding, F.; Wang, G.; Wang, M.; Zhang, S. Exogenous melatonin improves tolerance to water deficit by promoting cuticle formation in tomato plants. Molecules 2018, 23, 1605. [Google Scholar] [CrossRef] [Green Version]
- Yang, X.L.; Xu, H.; Li, D.; Gao, X.; Li, T.L.; Wang, R. Effect of melatonin priming on photosynthetic capacity of tomato leaves under low-temperature stress. Photosynthetica 2018, 56, 884–892. [Google Scholar] [CrossRef]
- Ding, F.; Liu, B.; Zhang, S. Exogenous melatonin ameliorates cold-induced damage in tomato plants. Sci. Hortic. 2017, 219, 264–271. [Google Scholar] [CrossRef]
- Qi, Z.-Y.; Wang, K.-X.; Yan, M.-Y.; Kanwar, M.K.; Li, D.-Y.; Wijaya, L.; Alyemeni, M.N.; Ahmad, P.; Zhou, J. Melatonin Alleviates High Temperature-Induced Pollen Abortion in Solanum lycopersicum. Molecules 2018, 23, 386. [Google Scholar] [CrossRef] [Green Version]
- Shibaeva, T.G.; Markovskaya, E.F.; Mamaev, A.V. Phytomelatonin: A Review. Boil. Bull. Rev. 2018, 8, 375–388. [Google Scholar] [CrossRef]
- Mamatha, H.; Rao, N.K.S.; Laxman, R.H.; Shivashankara, K.S.; Bhatt, R.M.; Pavithra, K.C. Impact of elevated CO2 on growth, physiology, yield, and quality of tomato (Lycopersicon esculentum Mill) cv. Arka Ashish. Photosynthetica 2014, 52, 519–528. [Google Scholar] [CrossRef]
- Chavan, S.; Duursma, R.A.; Tausz, M.; Ghannoum, O. Elevated CO2 alleviates the negative impact of heat stress on wheat physiology but not on grain yield. J. Exp. Bot. 2019, 70, 6447–6459. [Google Scholar] [CrossRef]
- Li, X.; Zhang, G.; Sun, B.; Zhang, S.; Zhang, Y.; Liao, Y.; Zhou, Y.; Xia, X.; Shi, K.; Yu, J. Stimulated Leaf Dark Respiration in Tomato in an Elevated Carbon Dioxide Atmosphere. Sci. Rep. 2013, 3, 3433. [Google Scholar] [CrossRef] [Green Version]
- Zinta, G.; AbdelGawad, H.; Peshev, D.; Weedon, J.T.; Ende, W.V.D.; Nijs, I.; Janssens, I.A.; Beemster, G.T.S.; Asard, H. Dynamics of metabolic responses to periods of combined heat and drought in Arabidopsis thaliana under ambient and elevated atmospheric CO2. J. Exp. Bot. 2018, 69, 2159–2170. [Google Scholar] [CrossRef]
- AbdelGawad, H.; Farfán-Vignolo, E.R.; De Vos, D.; Asard, H. Elevated CO2 mitigates drought and temperature-induced oxidative stress differently in grasses and legumes. Plant Sci. 2015, 231, 1–10. [Google Scholar] [CrossRef]
- Wei, Z.; Du, T.; Li, X.; Fang, L.; Liu, F. Interactive Effects of Elevated CO2 and N Fertilization on Yield and Quality of Tomato Grown Under Reduced Irrigation Regimes. Front. Plant Sci. 2018, 9, 328. [Google Scholar] [CrossRef] [Green Version]
- Ainsworth, E.A.; Long, S.P. What have we learned from 15 years of free-air CO2 enrichment (FACE)? A meta-analytic review of the responses of photosynthesis, canopy properties and plant production to rising CO2. New Phytol. 2004, 165, 351–372. [Google Scholar] [CrossRef]
- Zhang, H.; Pan, C.; Gu, S.; Ma, Q.; Zhang, Y.; Li, X.; Shi, K. Stomatal movements are involved in elevated CO2 -mitigated high temperature stress in tomato. Physiol. Plant. 2018, 165, 569–583. [Google Scholar] [CrossRef]
- Zhang, J.; Li, H.; Xu, B.; Li, J.; Huang, B. Exogenous Melatonin Suppresses Dark-Induced Leaf Senescence by Activating the Superoxide Dismutase-Catalase Antioxidant Pathway and Down-Regulating Chlorophyll Degradation in Excised Leaves of Perennial Ryegrass (Lolium perenne L.). Front. Plant Sci. 2016, 7, 1500. [Google Scholar] [CrossRef] [Green Version]
- Szafrańska, K.; Reiter, R.J.; Posmyk, M.M. Melatonin Improves the Photosynthetic Apparatus in Pea Leaves Stressed by Paraquat via Chlorophyll Breakdown Regulation and Its Accelerated de novo Synthesis. Front. Plant Sci. 2017, 8, 878. [Google Scholar] [CrossRef] [Green Version]
- Kasajima, I. Difference in oxidative stress tolerance between rice cultivars estimated with chlorophyll fluorescence analysis. BMC Res. Notes 2017, 10, 168. [Google Scholar] [CrossRef]
- Shi, H.; Jiang, C.; Ye, T.; Tan, D.-X.; Reiter, R.J.; Zhang, H.; Liu, R.; Chan, Z. Comparative physiological, metabolomic, and transcriptomic analyses reveal mechanisms of improved abiotic stress resistance in bermudagrass [Cynodon dactylon (L). Pers.] by exogenous melatonin. J. Exp. Bot. 2014, 66, 681–694. [Google Scholar] [CrossRef] [Green Version]
- Zhou, R.; Yu, X.; Kjær, K.H.; Rosenqvist, E.; Ottosen, C.-O.; Wu, Z. Screening and validation of tomato genotypes under heat stress using Fv/Fm to reveal the physiological mechanism of heat tolerance. Environ. Exp. Bot. 2015, 118, 1–11. [Google Scholar] [CrossRef]


© 2020 by the authors. Licensee MDPI, Basel, Switzerland. This article is an open access article distributed under the terms and conditions of the Creative Commons Attribution (CC BY) license (http://creativecommons.org/licenses/by/4.0/).
Share and Cite
Zhou, R.; Wan, H.; Jiang, F.; Li, X.; Yu, X.; Rosenqvist, E.; Ottosen, C.-O. The Alleviation of Photosynthetic Damage in Tomato under Drought and Cold Stress by High CO2 and Melatonin. Int. J. Mol. Sci. 2020, 21, 5587. https://0-doi-org.brum.beds.ac.uk/10.3390/ijms21155587
Zhou R, Wan H, Jiang F, Li X, Yu X, Rosenqvist E, Ottosen C-O. The Alleviation of Photosynthetic Damage in Tomato under Drought and Cold Stress by High CO2 and Melatonin. International Journal of Molecular Sciences. 2020; 21(15):5587. https://0-doi-org.brum.beds.ac.uk/10.3390/ijms21155587
Chicago/Turabian StyleZhou, Rong, Hongjian Wan, Fangling Jiang, Xiangnan Li, Xiaqing Yu, Eva Rosenqvist, and Carl-Otto Ottosen. 2020. "The Alleviation of Photosynthetic Damage in Tomato under Drought and Cold Stress by High CO2 and Melatonin" International Journal of Molecular Sciences 21, no. 15: 5587. https://0-doi-org.brum.beds.ac.uk/10.3390/ijms21155587