Analysis of the Codon Usage Pattern of HA and NA Genes of H7N9 Influenza A Virus

Abstract
:1. Introduction
2. Results
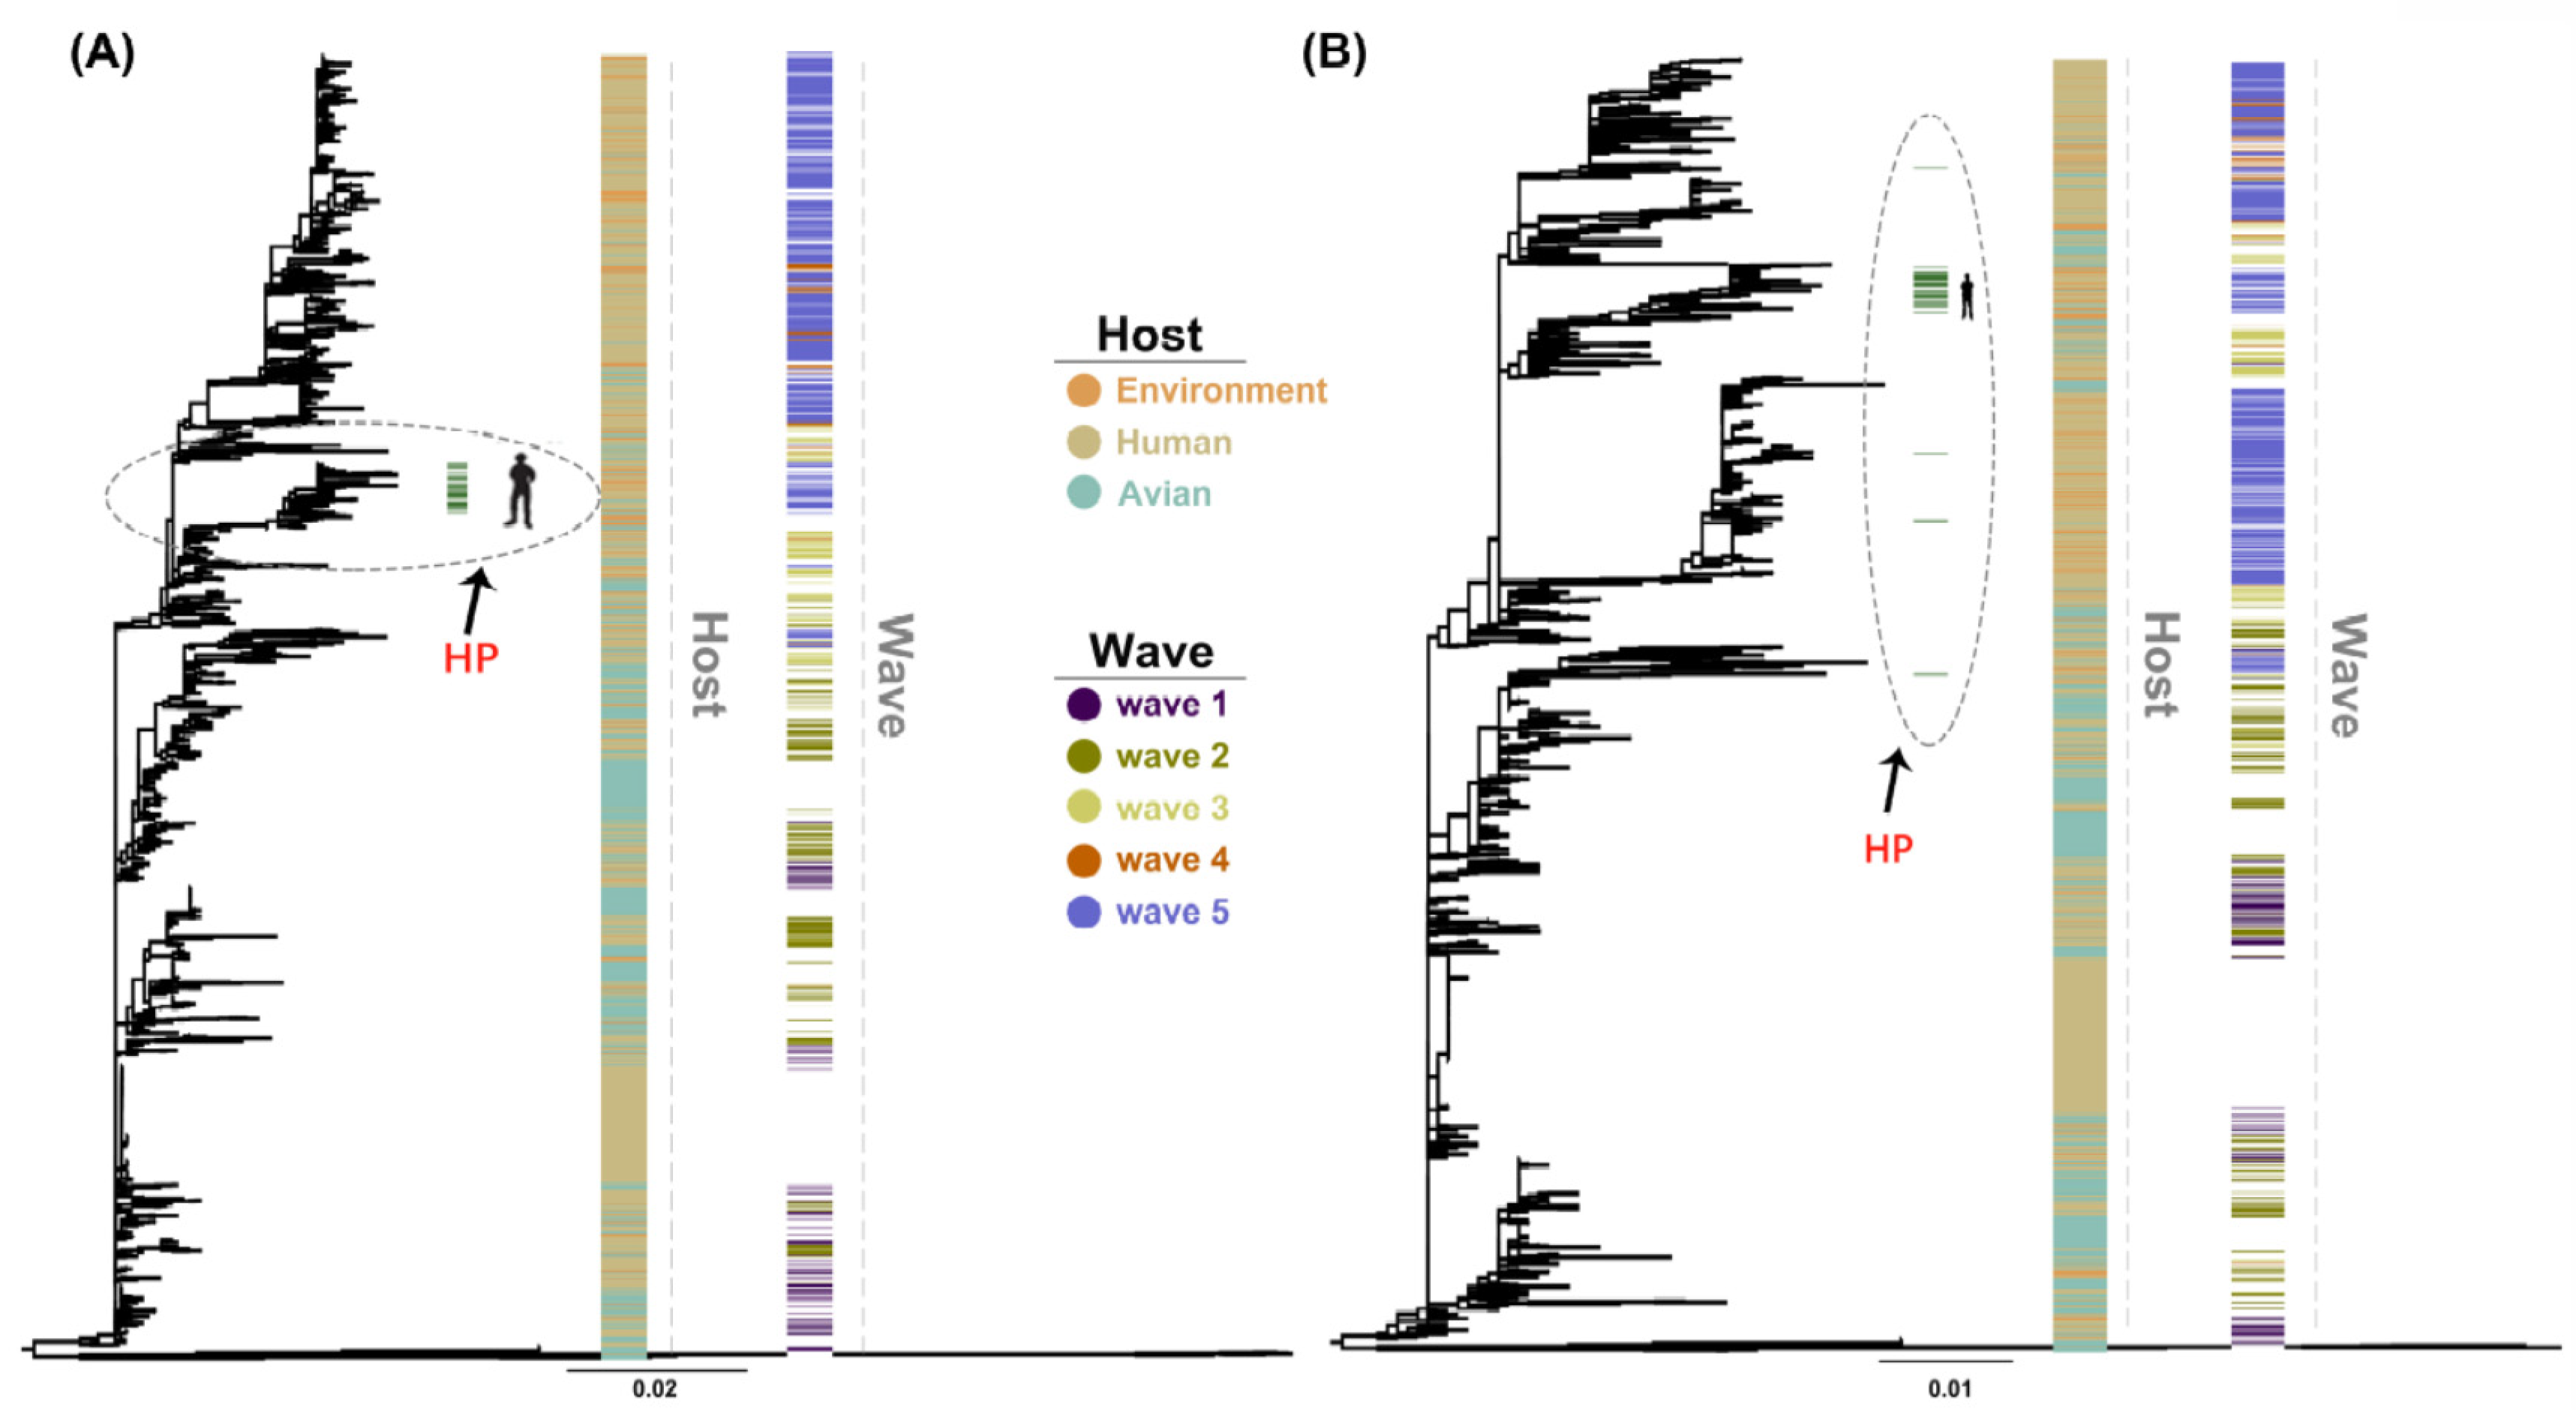
2.1. Phylogenetic Analyses of the HA and NA Genes of H7N9
2.2. Trends of Codon Usage Patterns Based on Different Classifications of HA and NA
2.3. Nucleotide Composition
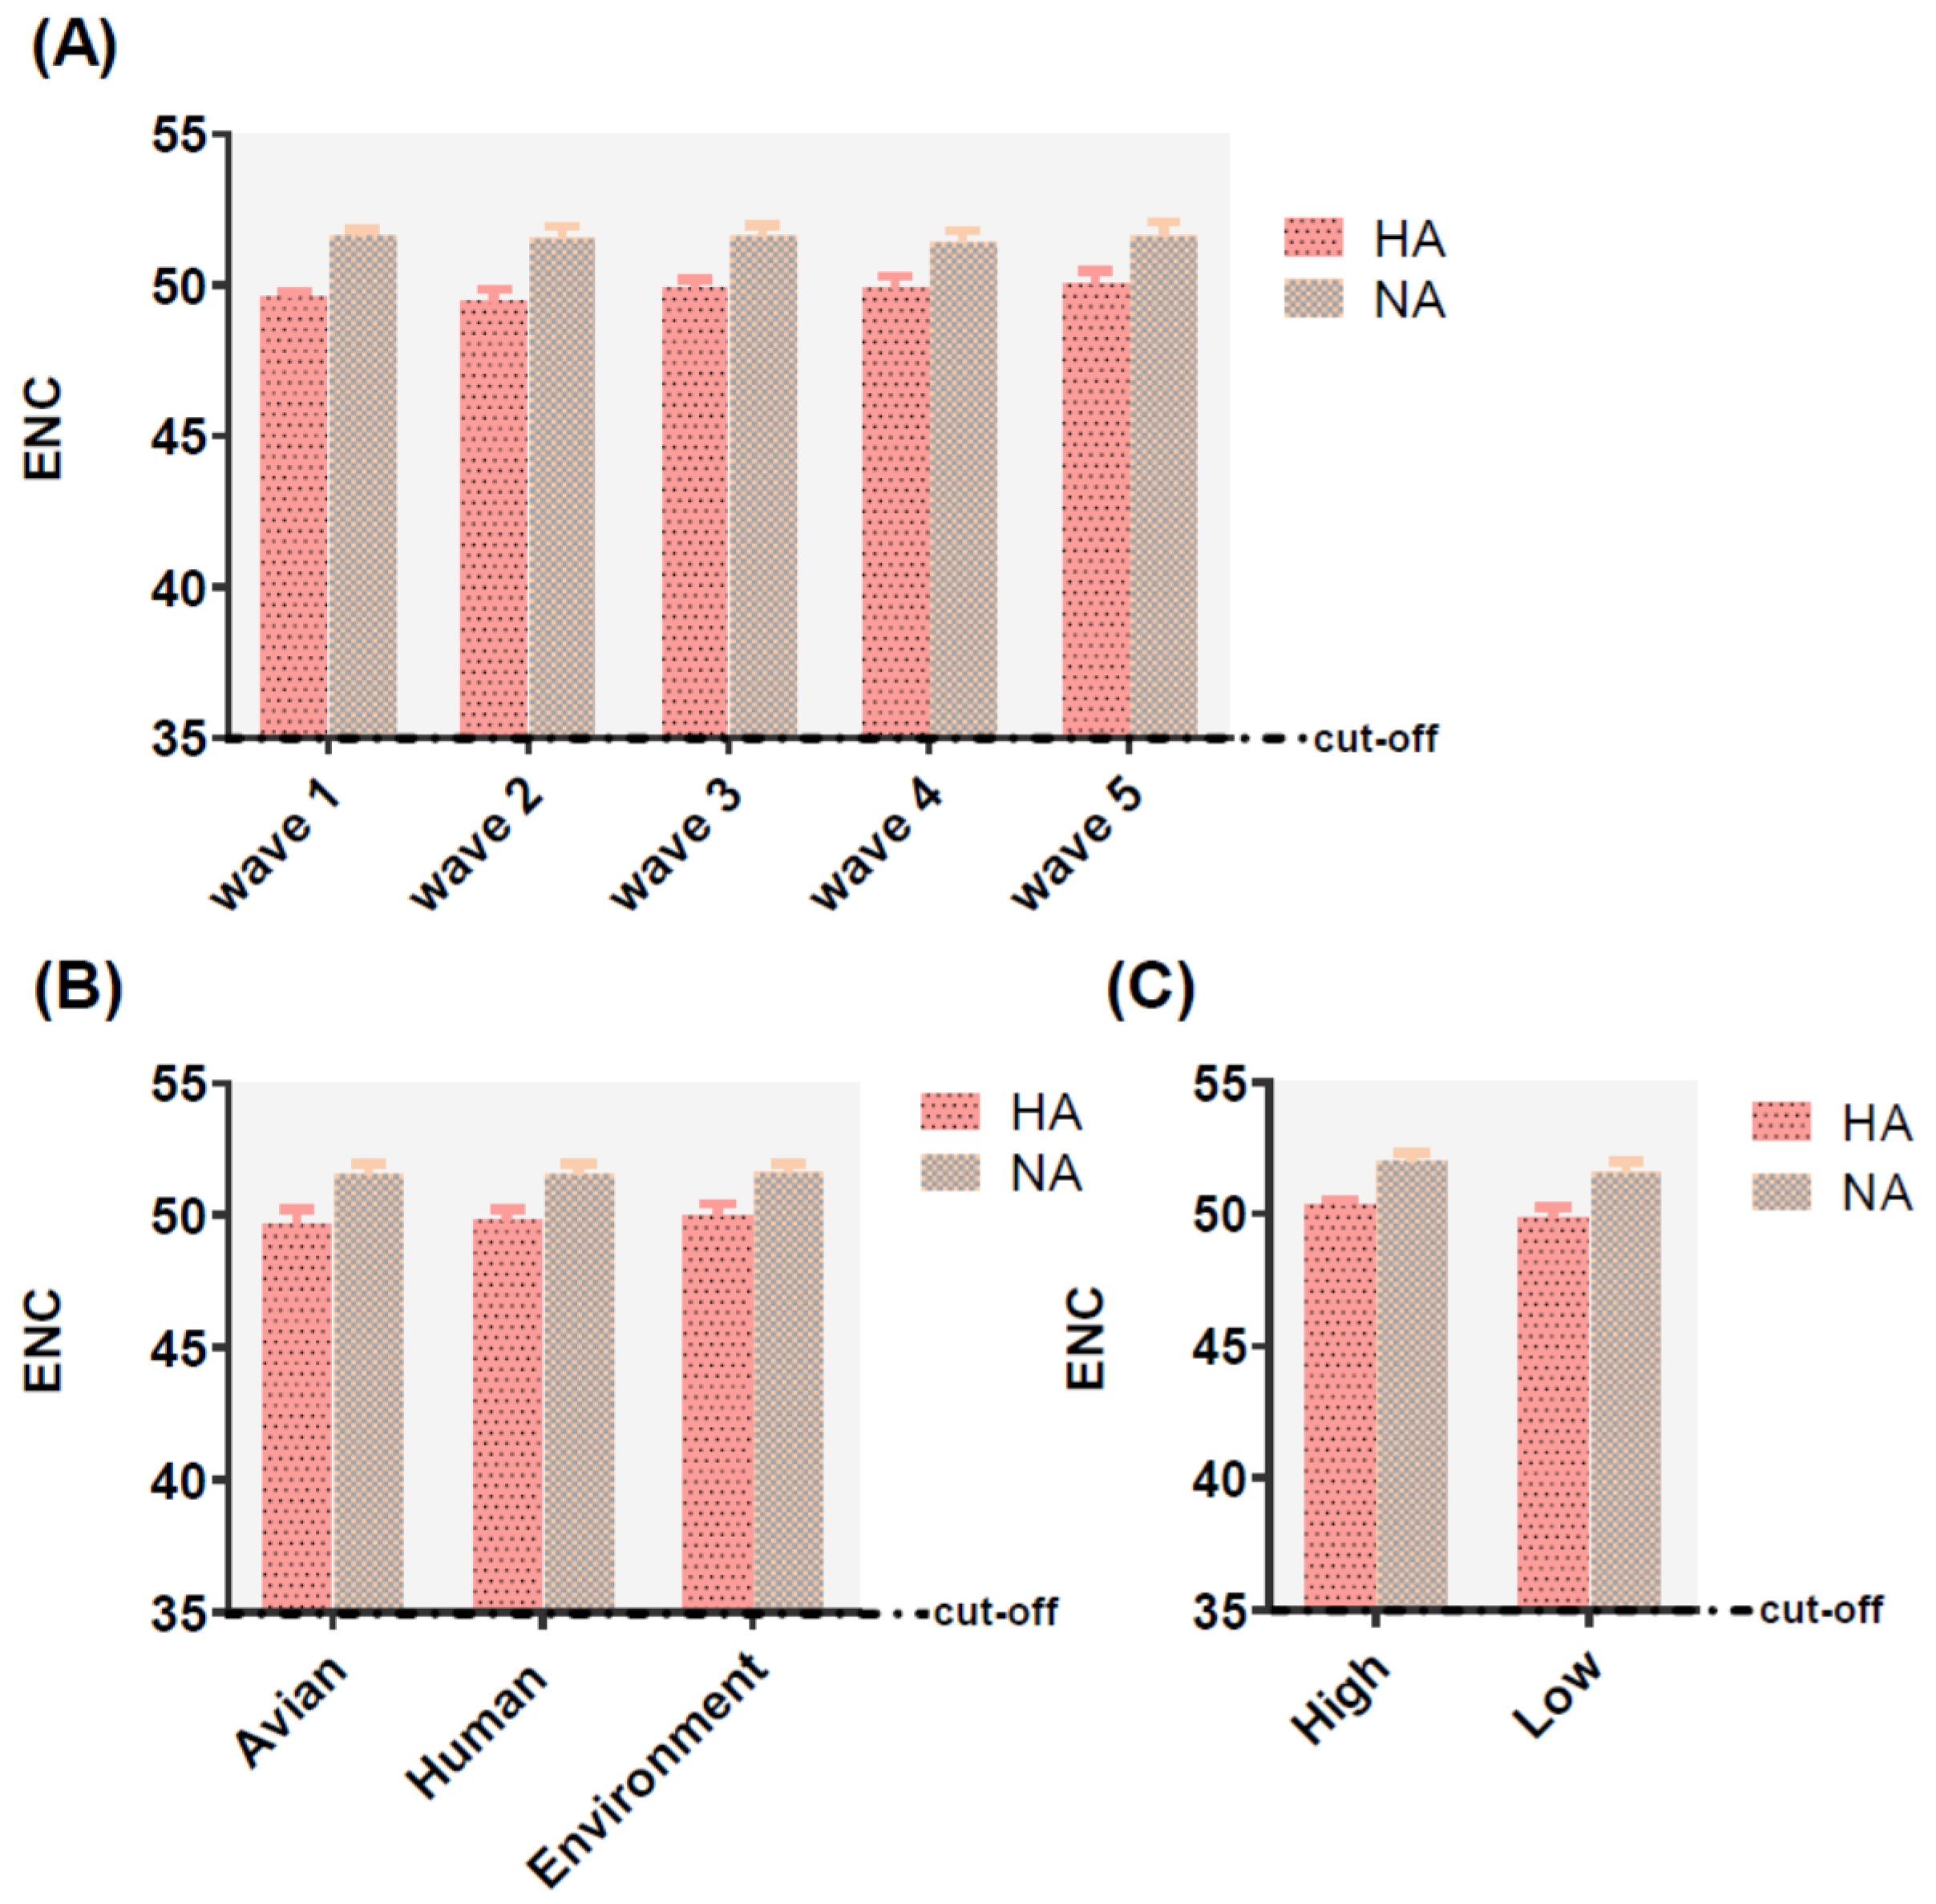
2.4. Lower Codon Usage Bias in HA and NA Gene
2.5. RSCU Value of HA and NA Genes
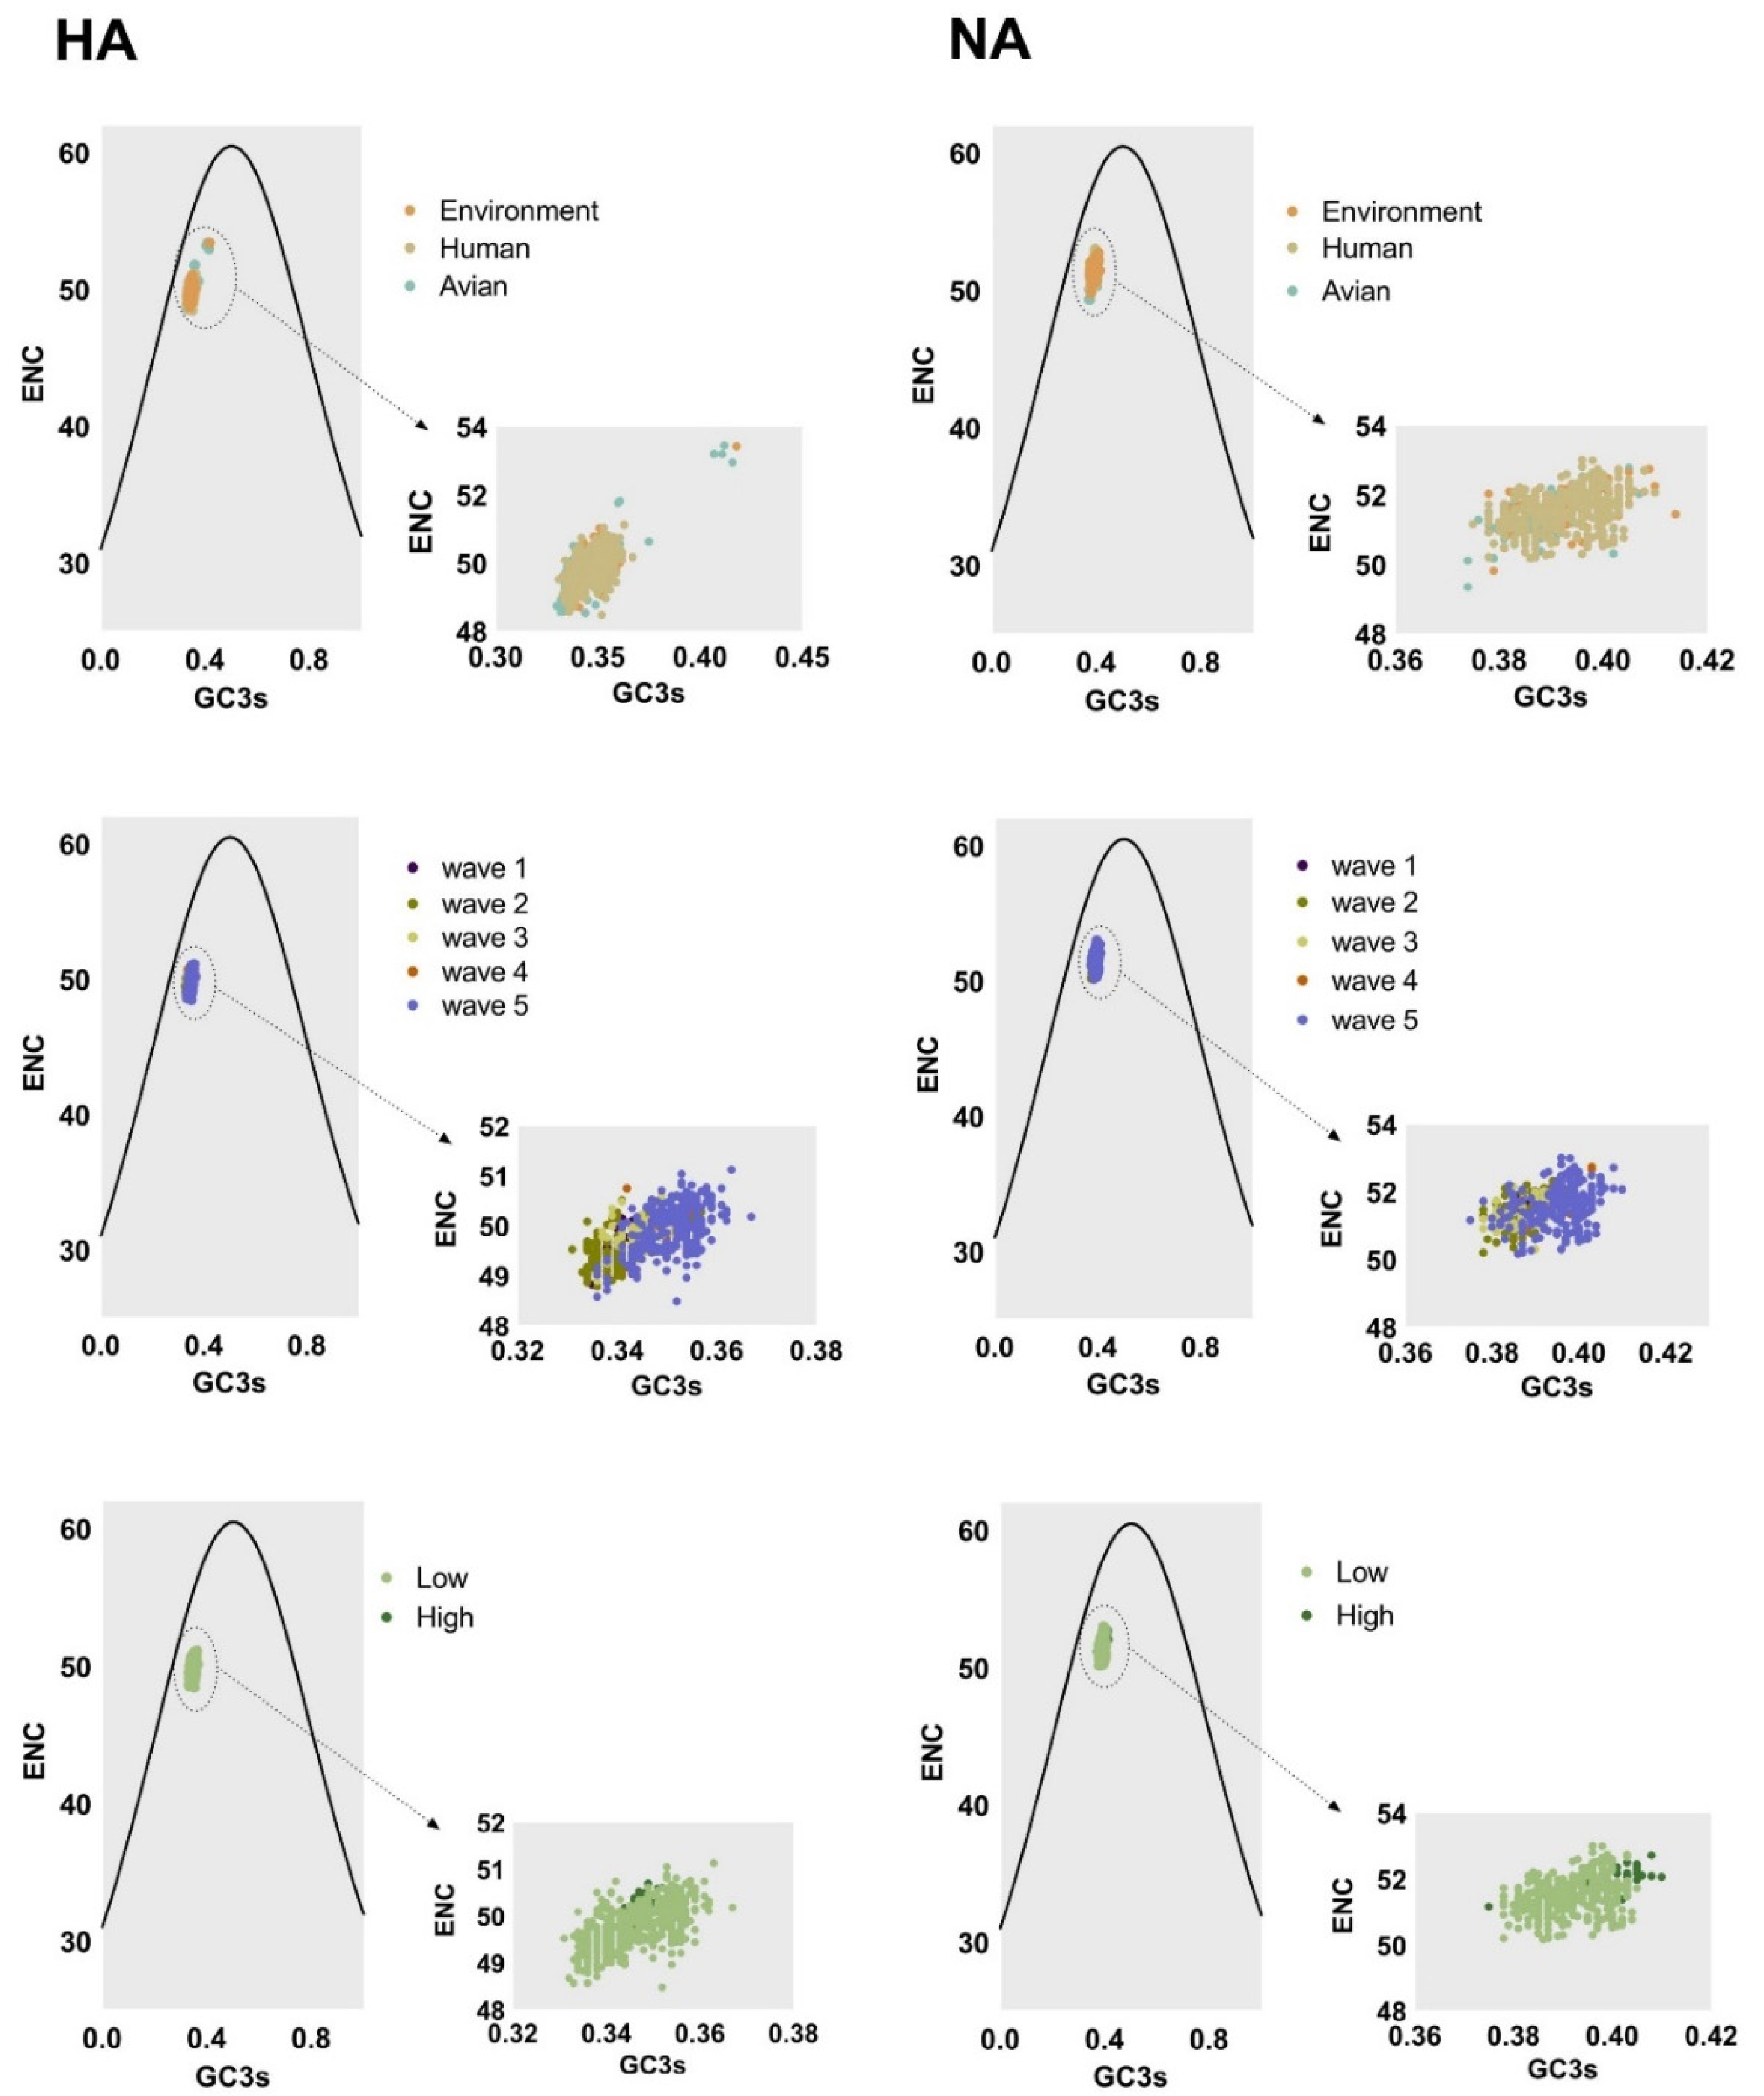
2.6. Factors Driving Codon Usage Bias
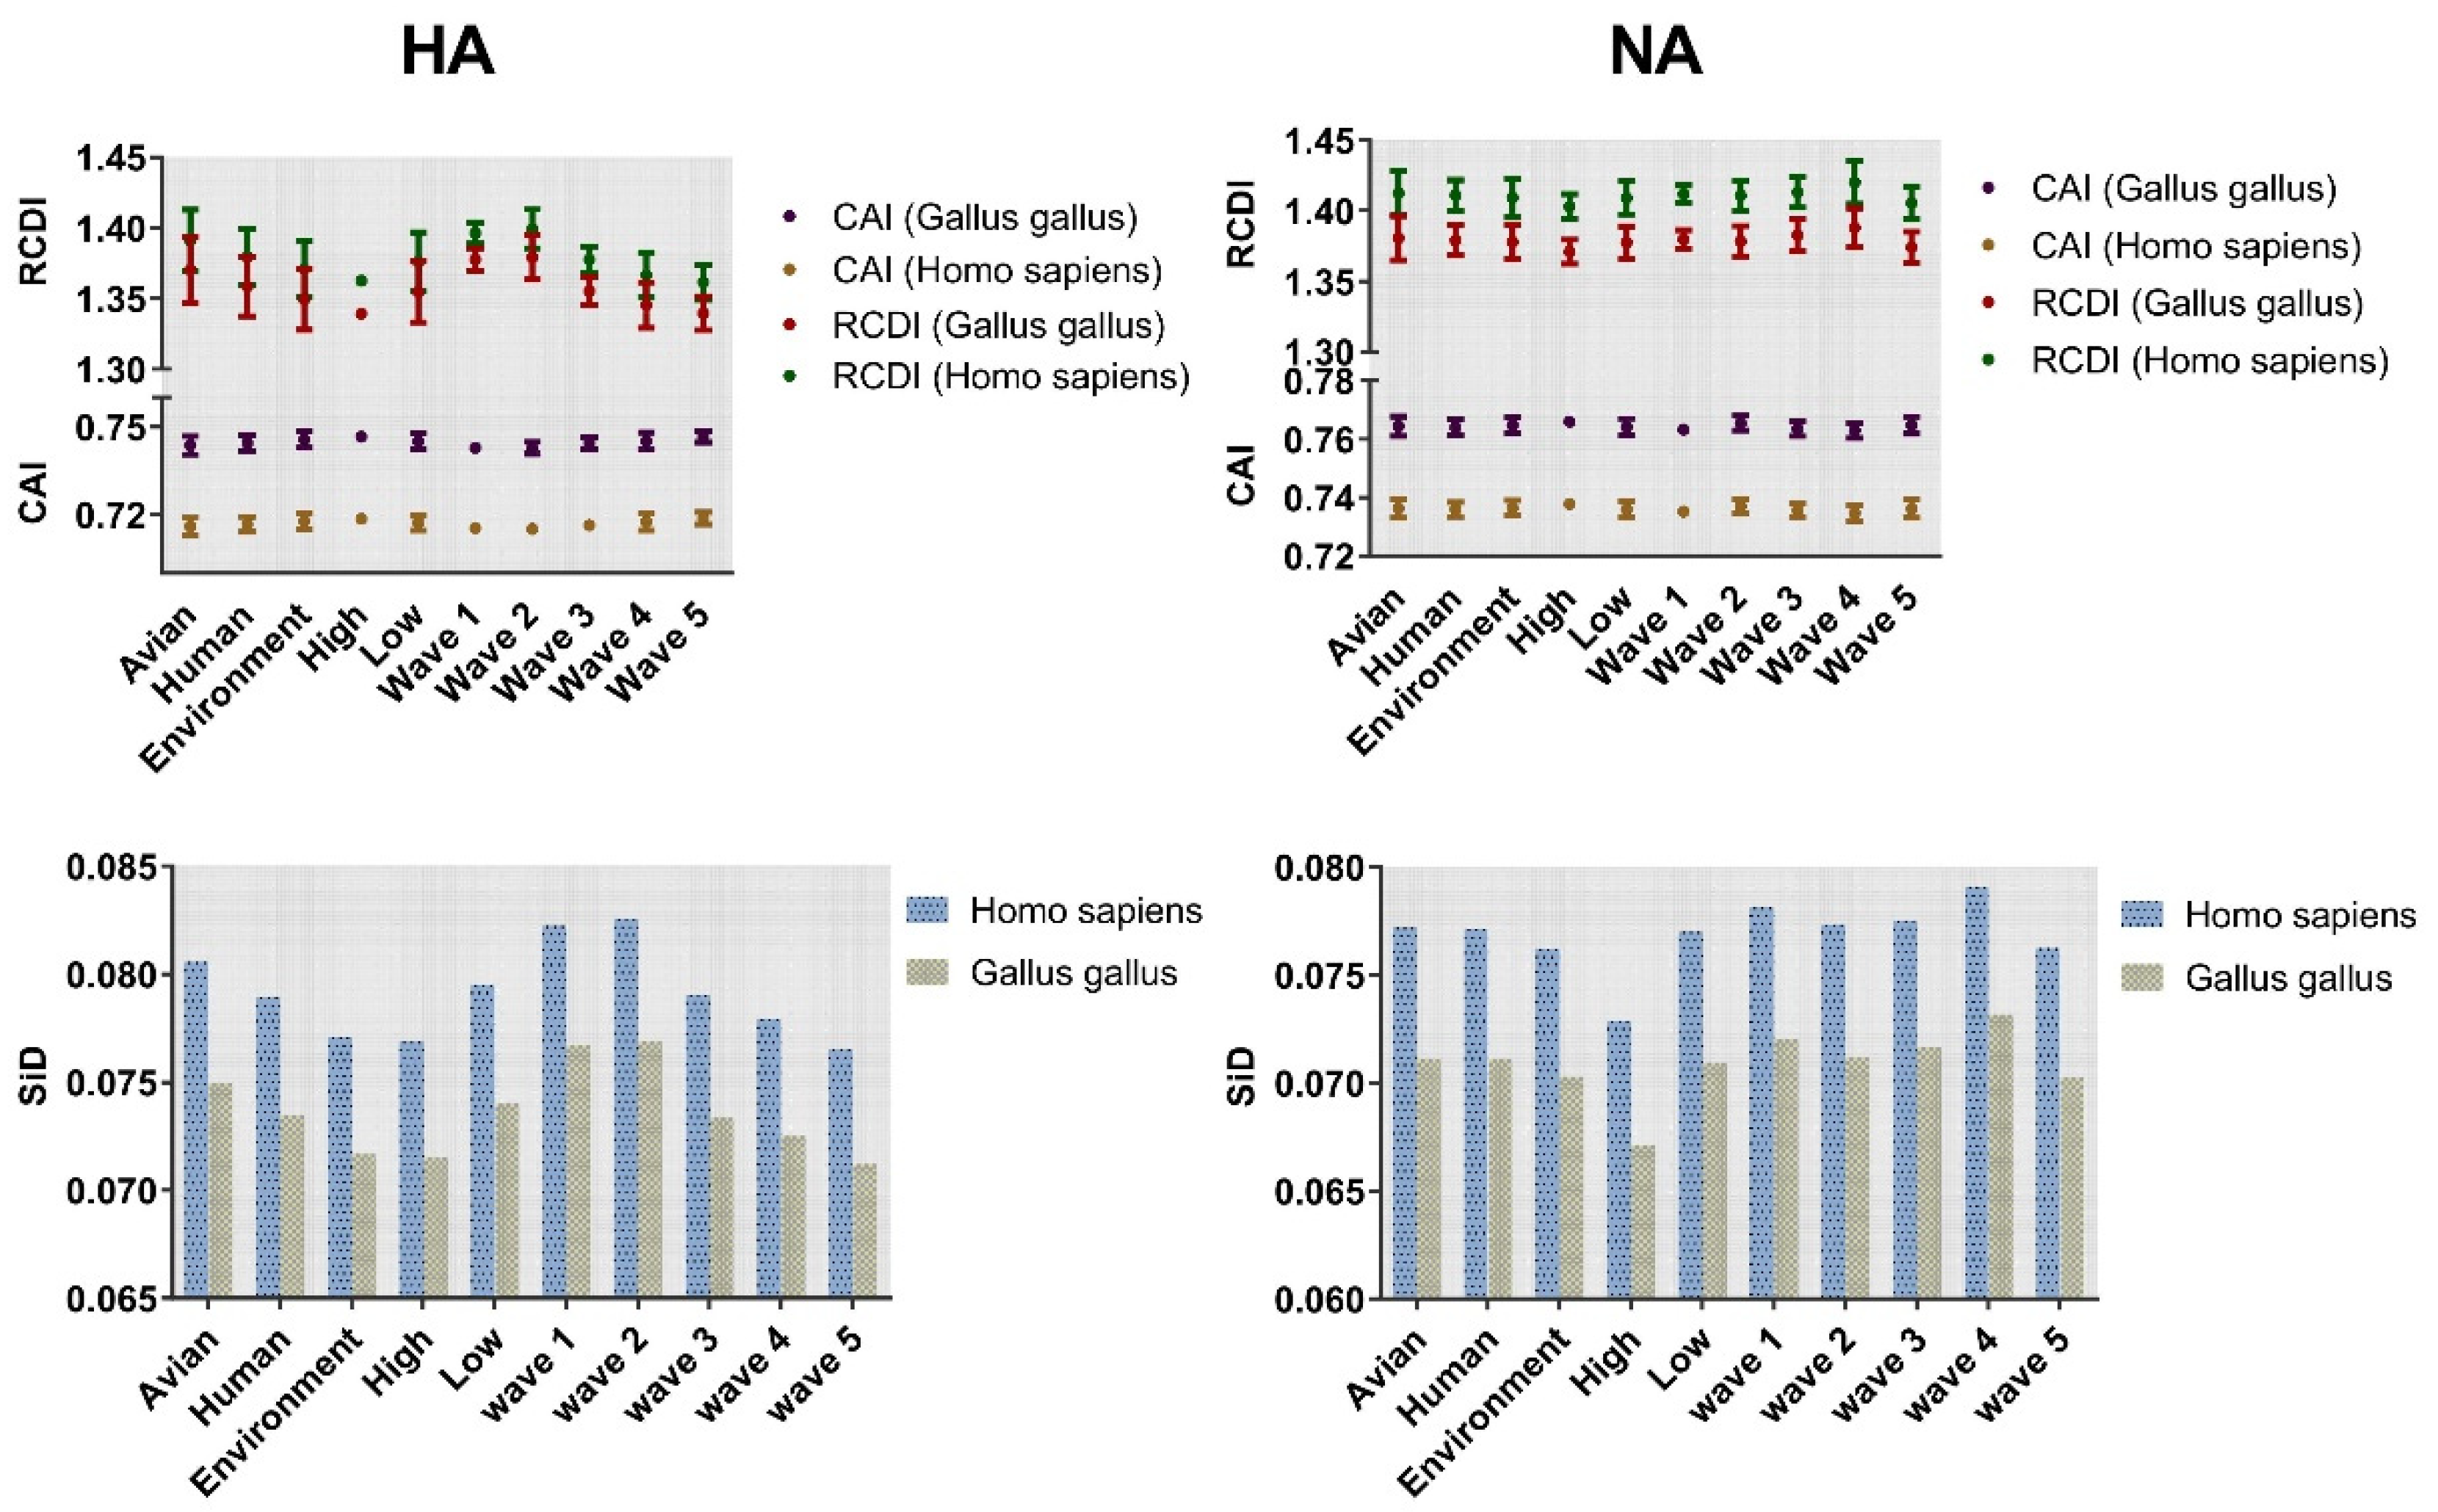
2.7. The HA and NA Genes of H7N9 Virus Are Highly Adapted to Gallus gallus
2.8. Strong Selection Pressure of Homo Sapiens on H7N9
3. Discussion
4. Material and Methods
4.1. Data Sequences
4.2. Phylogenetic Analysis
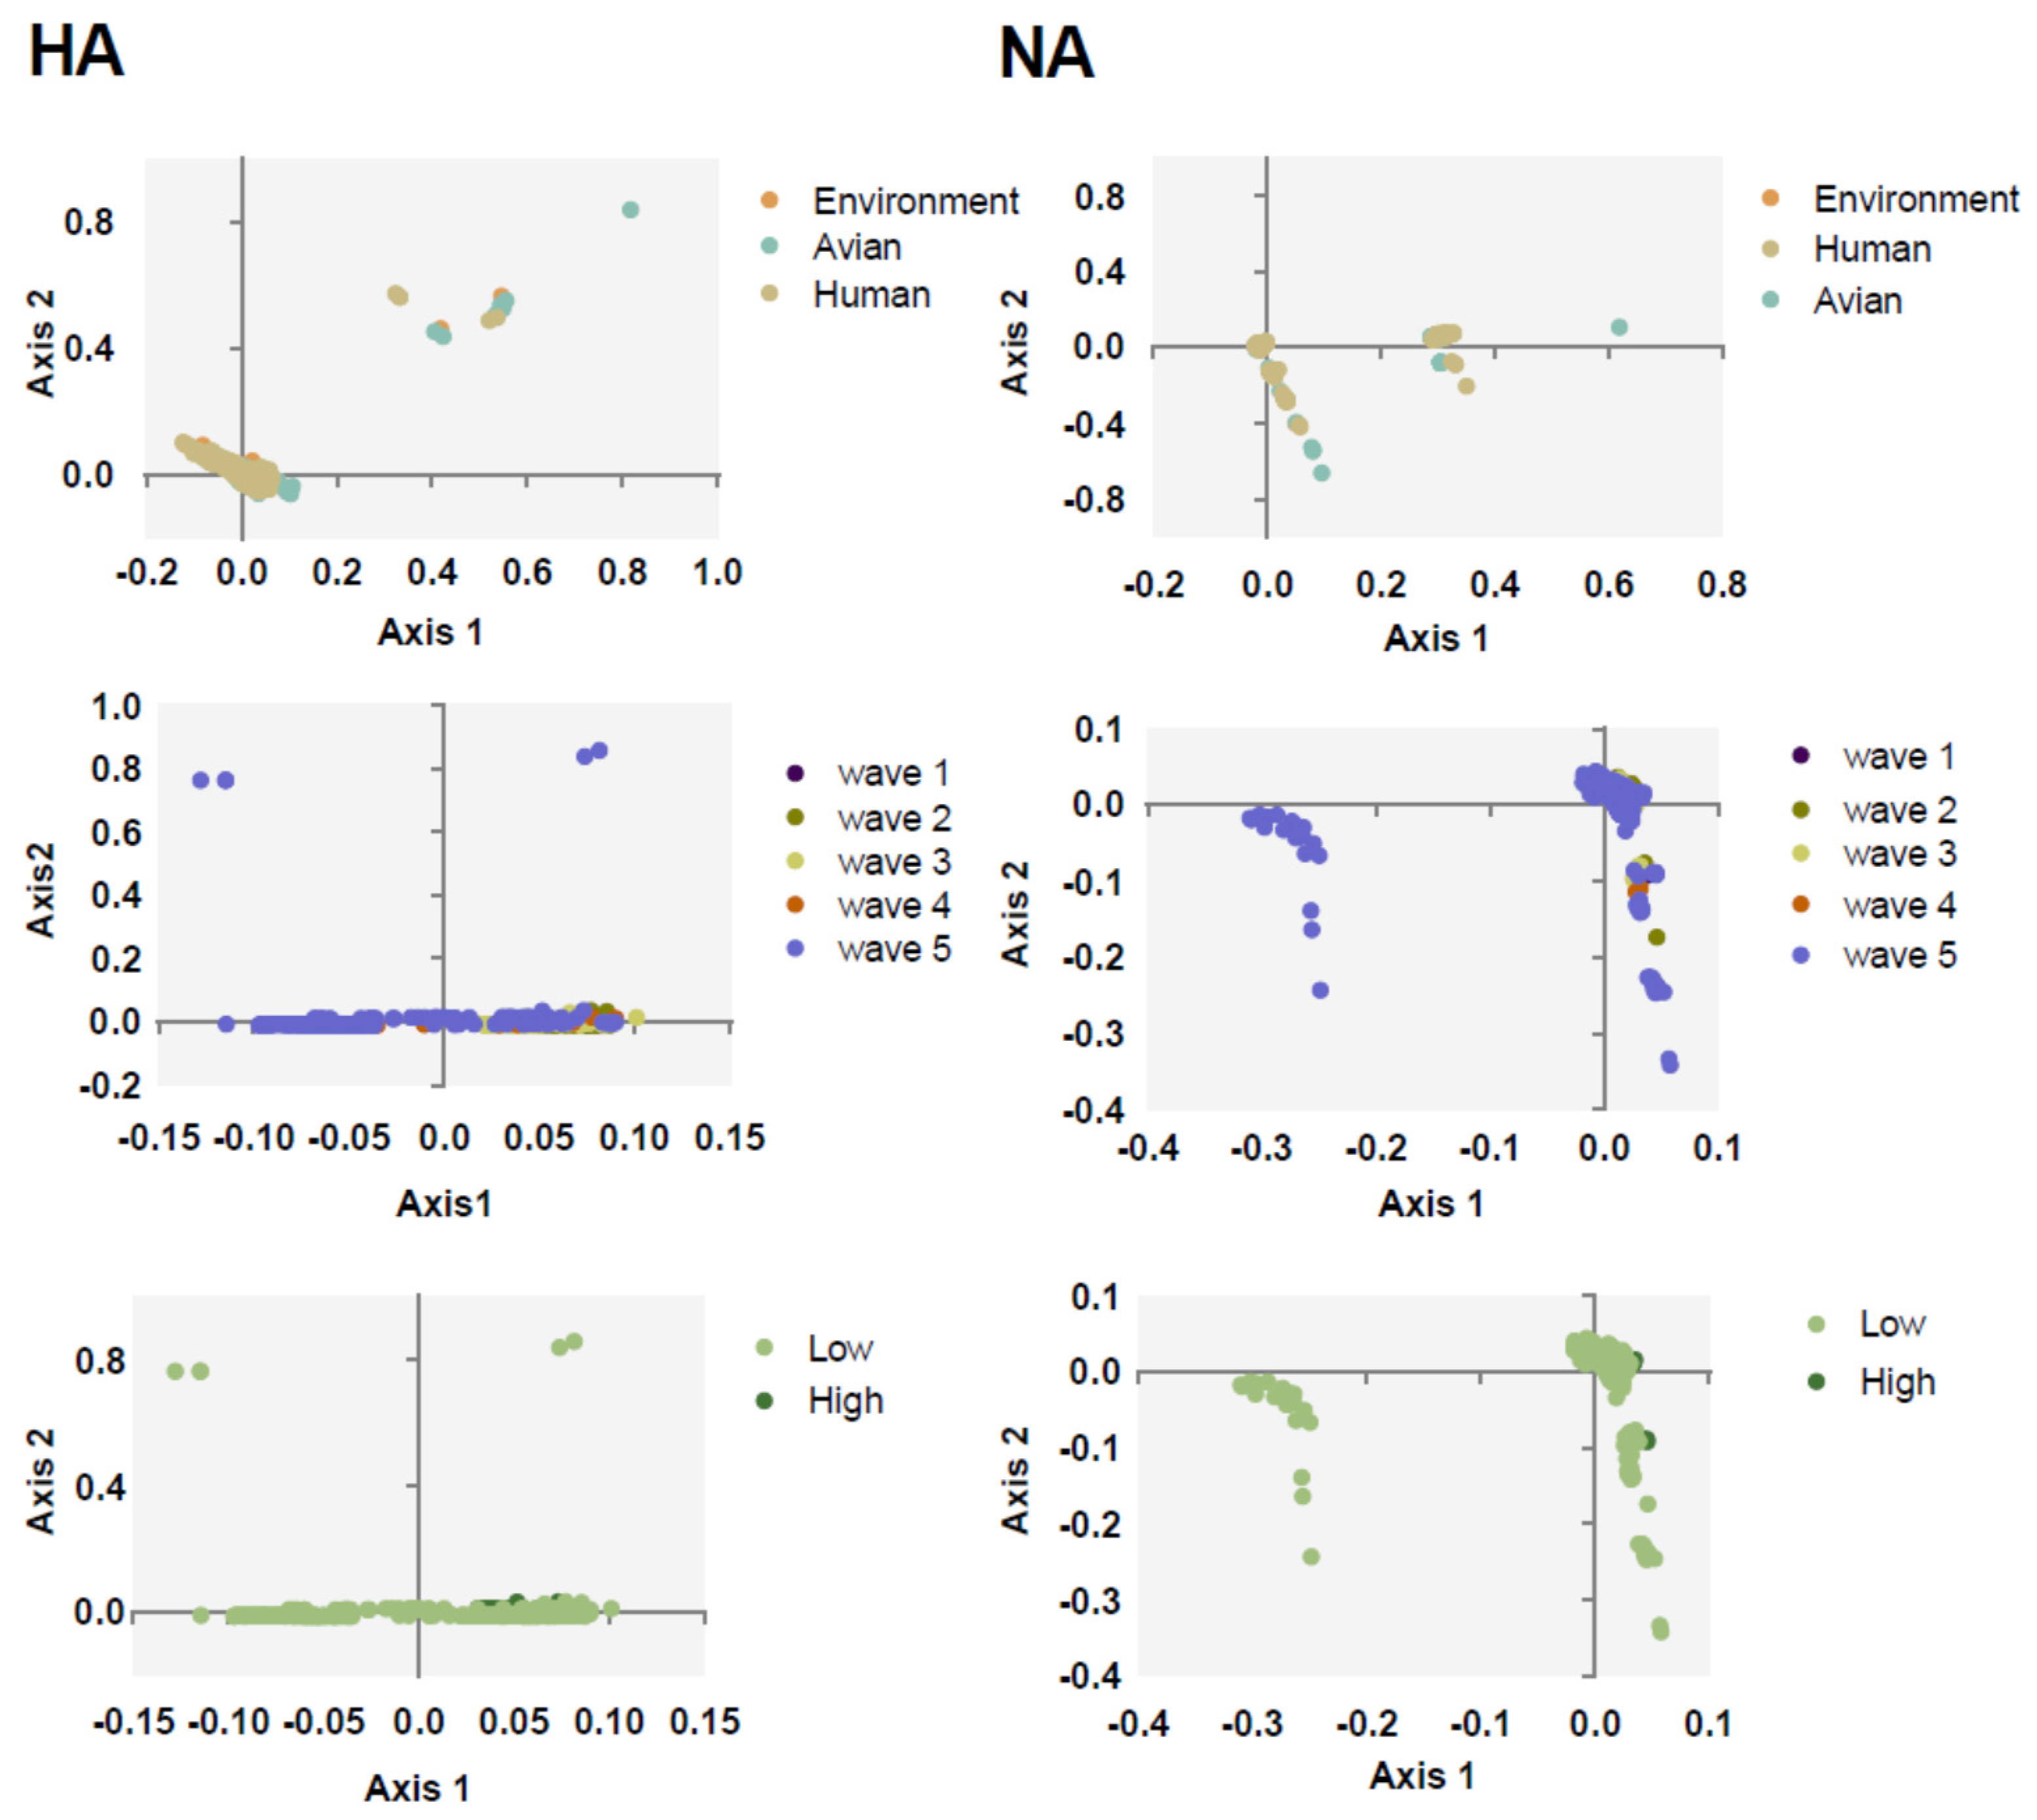
4.3. Correspondence Analysis
4.4. Codon Usage Bias Index
4.4.1. Nucleotide Composition
4.4.2. Relative Synonymous Codon Usage Analysis
4.4.3. Effective Number of Codons Analysis
4.5. Factors Mediating Codon Usage Bias
4.5.1. ENC-Plot Analysis
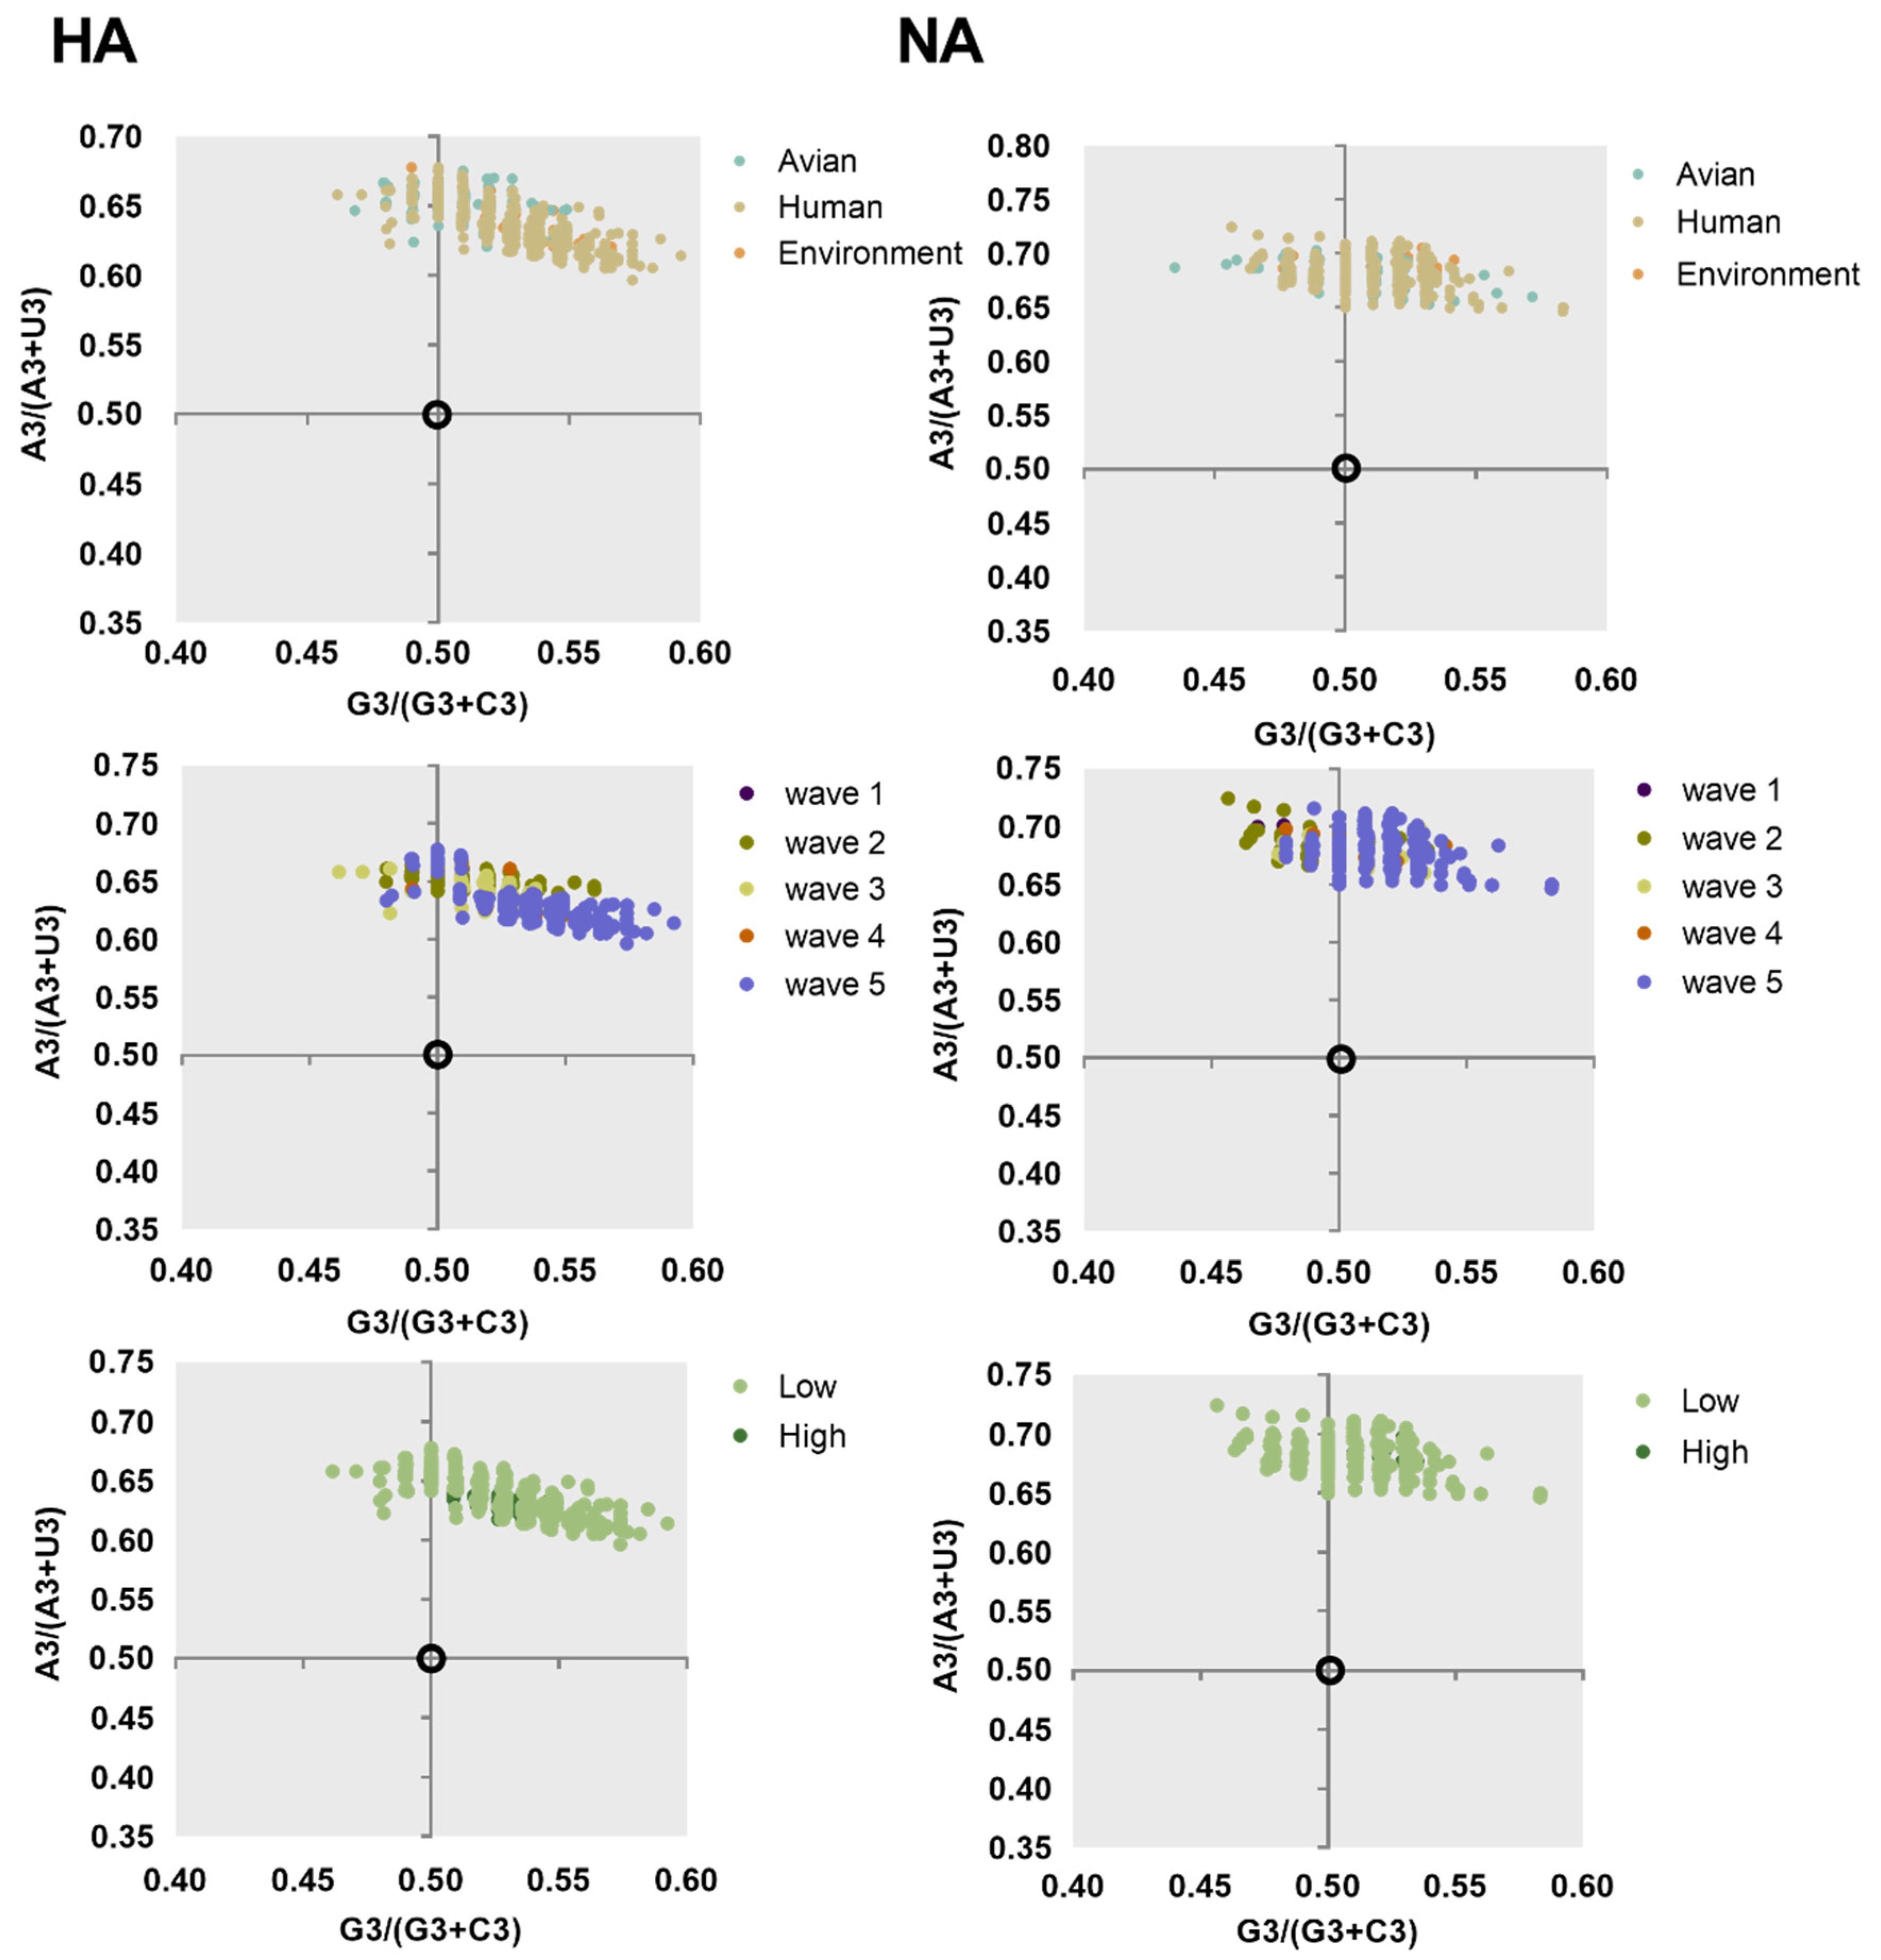
4.5.2. Parity Rule 2 Analysis (PR2)
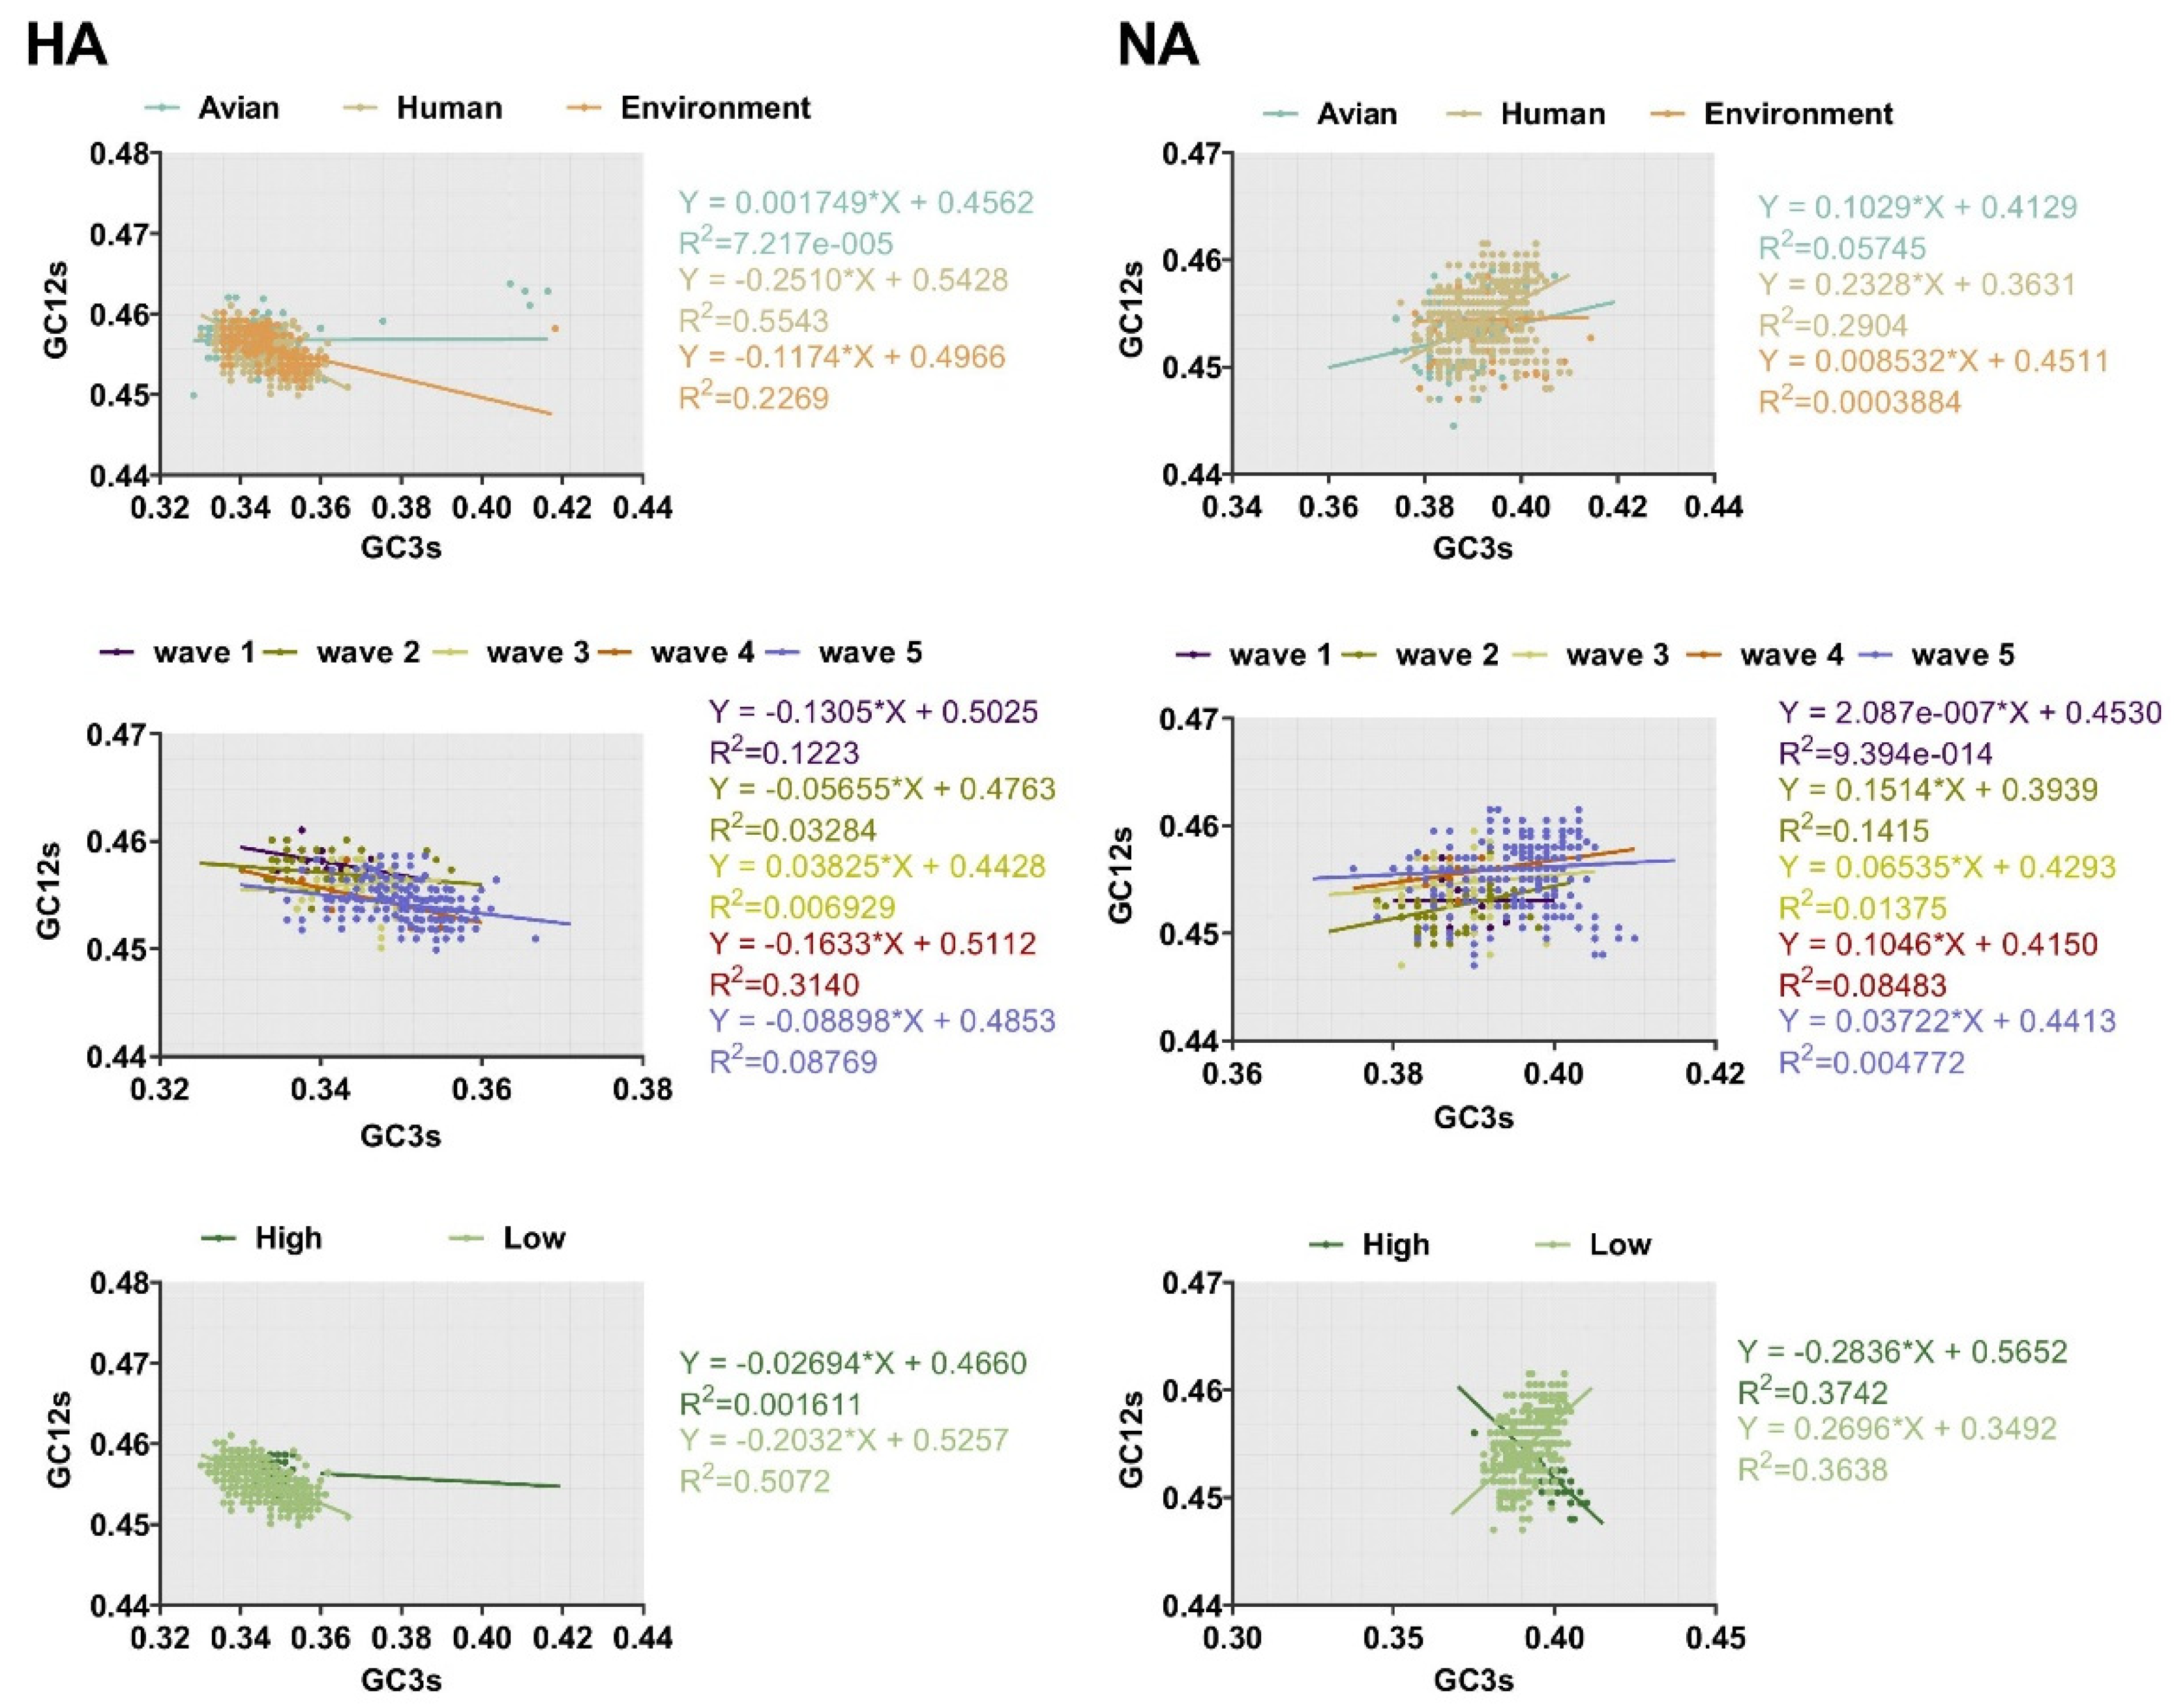
4.5.3. Neutrality Analysis
4.6. Potential Relationship between Host and Virus
4.6.1. Codon Adaptation Index
4.6.2. Relative Codon Deoptimization Index
4.6.3. Similarity Index
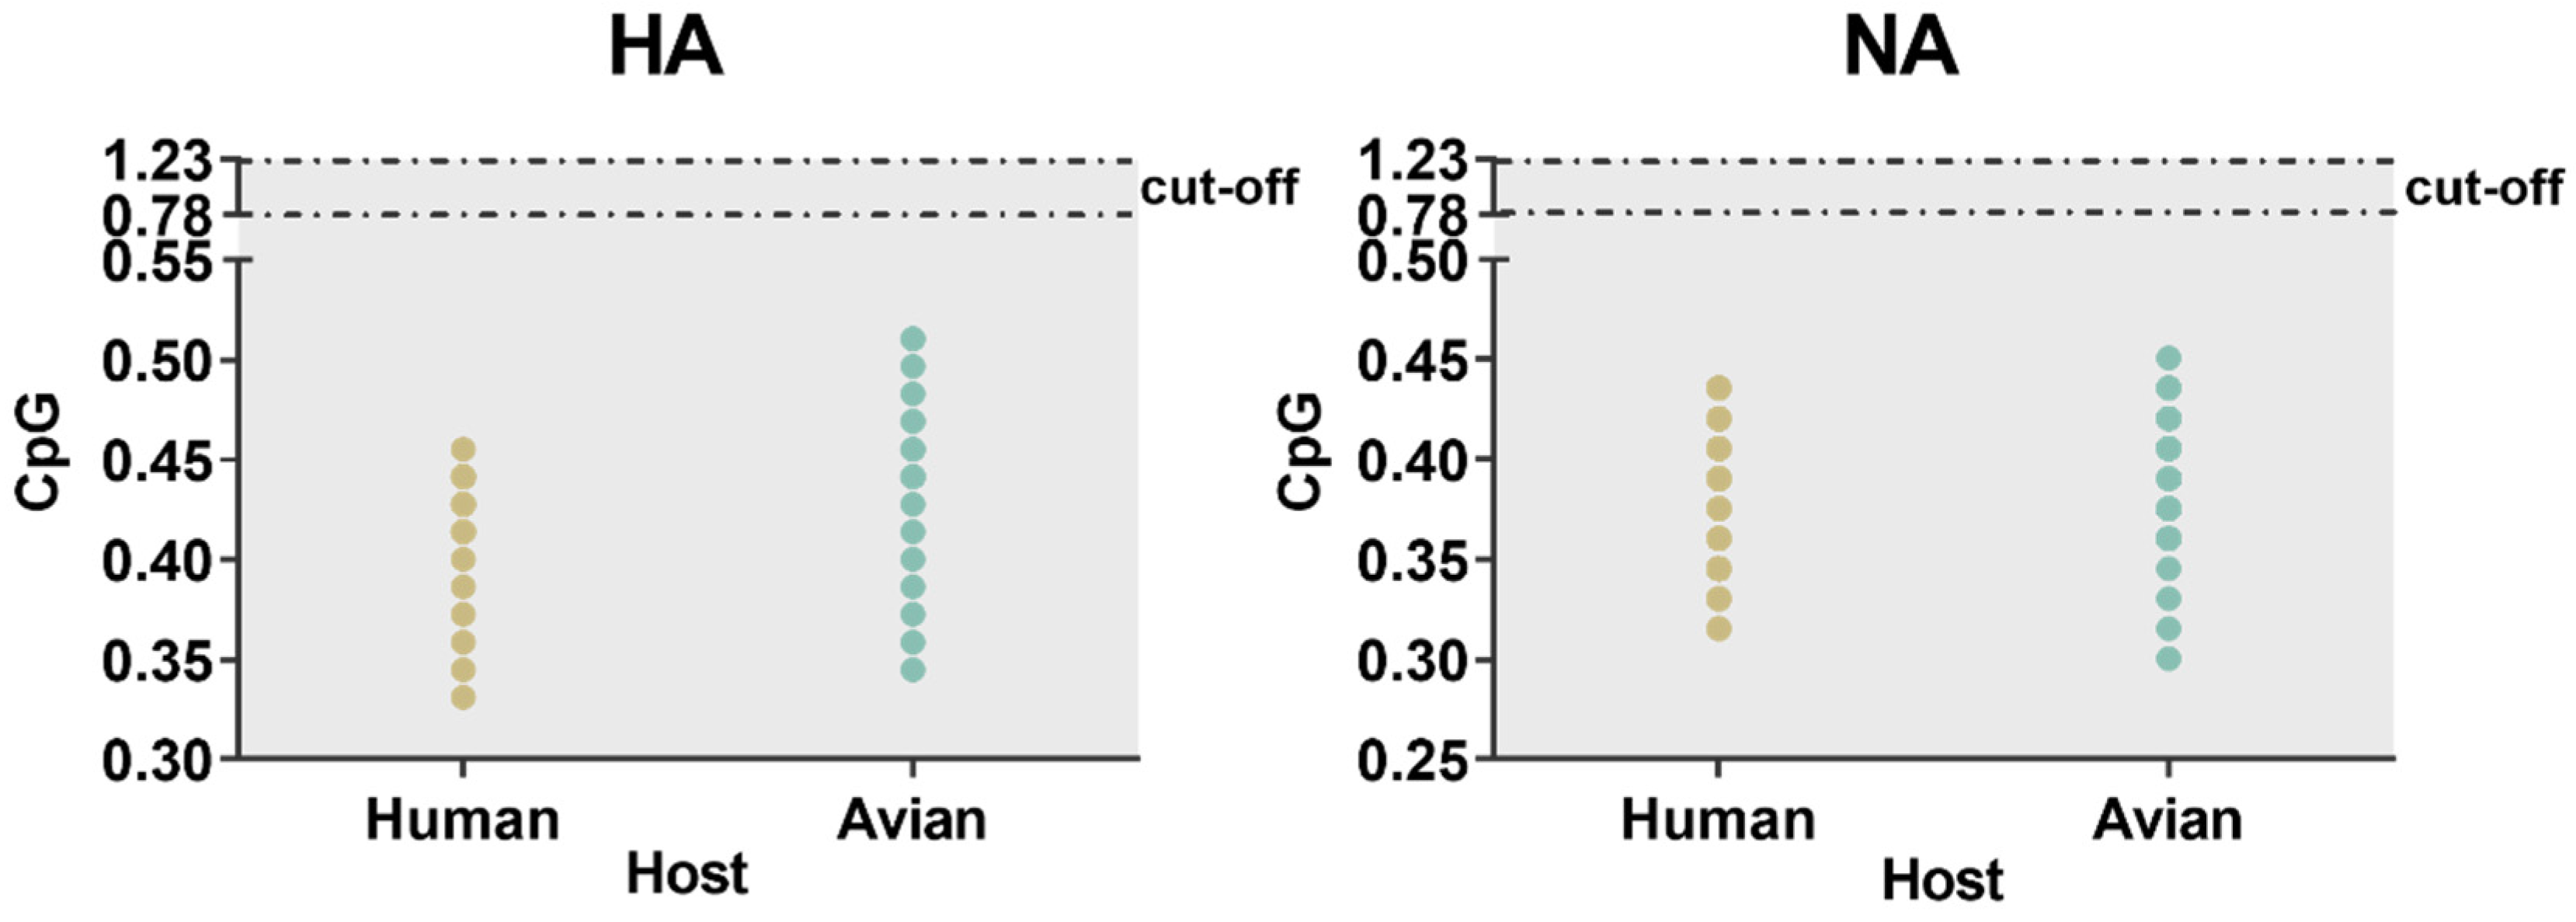
4.6.4. CpG Dinucleotides Frequency
Supplementary Materials
Author Contributions
Funding
Conflicts of Interest
References
- Belser, J.A.; Bridges, C.B.; Katz, J.M.; Tumpey, T.M. Past, Present, and Possible Future Human Infection with Influenza Virus A Subtype H7. Emerg. Infect. Dis. 2009, 15, 859–865. [Google Scholar] [CrossRef] [PubMed]
- Gao, R.; Cao, B.; Hu, Y.; Feng, Z.; Wang, D.; Hu, W.; Chen, J.; Jie, Z.; Qiu, H.; Xu, K.; et al. Human infection with a novel avian-origin influenza A (H7N9) virus. N. Engl. J. Med. 2013, 368, 1888–1897. [Google Scholar] [CrossRef] [PubMed] [Green Version]
- Liu, J.; Xiao, H.; Wu, Y.; Liu, D.; Qi, X.; Shi, Y.; Gao, G.F. H7N9: A low pathogenic avian influenza A virus infecting humans. Curr. Opin. Virol. 2014, 5, 91–97. [Google Scholar] [CrossRef] [PubMed]
- Liu, D.; Shi, W.; Shi, Y.; Wang, D.; Xiao, H.; Li, W.; Bi, Y.; Wu, Y.; Li, X.; Yan, J.; et al. Origin and diversity of novel avian influenza A H7N9 viruses causing human infection: Phylogenetic, structural, and coalescent analyses. Lancet 2013, 381, 1926–1932. [Google Scholar] [CrossRef]
- Su, S.; Gu, M.; Liu, D.; Cui, J.; Gao, G.F.; Zhou, J.Y.; Liu, X.F. Epidemiology, Evolution, and Pathogenesis of H7N9 Influenza Viruses in Five Epidemic Waves since 2013 in China. Trends Microbiol. 2017, 25, 713–728. [Google Scholar] [CrossRef]
- Gao, G.F. Influenza and the Live Poultry Trade. Science 2014, 344, 235. [Google Scholar] [CrossRef] [Green Version]
- Li, J.; Yu, X.F.; Pu, X.Y.; Xie, L.; Sun, Y.X.; Xiao, H.X.; Wang, F.J.; Din, H.; Wu, Y.; Liu, D.; et al. Environmental connections of novel avian-origin H7N9 influenza virus infection and virus adaptation to the human. Sci. China-Life Sci. 2013, 56, 485–492. [Google Scholar] [CrossRef] [Green Version]
- Wang, X.L.; Jiang, H.; Wu, P.; Uyeki, T.M.; Feng, L.Z.; Lai, S.J.; Wang, L.L.; Huo, X.; Xu, K.; Chen, E.F.; et al. Epidemiology of avian influenza A H7N9 virus in human beings across five epidemics in mainland China, 2013–2017: An epidemiological study of laboratory-confirmed case series. Lancet Infect. Dis. 2017, 17, 822–832. [Google Scholar] [CrossRef]
- Van Ranst, M.; Lemey, P. Genesis of avian-origin H7N9 influenza A viruses. Lancet 2013, 381, 1883–1885. [Google Scholar] [CrossRef]
- Wu, Y.; Gao, G.F. Lessons learnt from the human infections of avian-origin influenza A H7N9 virus: Live free markets and human health. Sci. China-Life Sci. 2013, 56, 493–494. [Google Scholar] [CrossRef] [Green Version]
- Su, S.; Wong, G.; Shi, W.; Liu, J.; Lai, A.C.K.; Zhou, J.; Liu, W.; Bi, Y.; Gao, G.F. Epidemiology, Genetic Recombination, and Pathogenesis of Coronaviruses. Trends Microbiol. 2016, 24, 490–502. [Google Scholar] [CrossRef] [PubMed] [Green Version]
- Su, S.; Bi, Y.; Wong, G.; Gray, G.C.; Gao, G.F.; Li, S. Epidemiology, Evolution, and Recent Outbreaks of Avian Influenza Virus in China. J. Virol. 2015, 89, 8671–8676. [Google Scholar] [CrossRef] [PubMed] [Green Version]
- Sun, J.; He, W.T.; Wang, L.; Lai, A.; Ji, X.; Zhai, X.; Li, G.; Suchard, M.A.; Tian, J.; Zhou, J.; et al. COVID-19: Epidemiology, Evolution, and Cross-Disciplinary Perspectives. Trends Mol. Med. 2020, 26, 483–495. [Google Scholar] [CrossRef] [PubMed] [Green Version]
- Zhai, X.; Sun, J.; Yan, Z.; Zhang, J.; Zhao, J.; Zhao, Z.; Gao, Q.; He, W.T.; Veit, M.; Su, S. Comparison of Severe Acute Respiratory Syndrome Coronavirus 2 Spike Protein Binding to ACE2 Receptors from Human, Pets, Farm Animals, and Putative Intermediate Hosts. J. Virol. 2020, 94, e00831-20. [Google Scholar] [CrossRef] [PubMed]
- He, W.T.; Ji, X.; He, W.; Dellicour, S.; Wang, S.; Li, G.; Zhang, L.; Gilbert, M.; Zhu, H.; Xing, G.; et al. Genomic Epidemiology, Evolution, and Transmission Dynamics of Porcine Deltacoronavirus. Mol. Biol. Evol. 2020, 37, 2641–2654. [Google Scholar] [CrossRef]
- He, W.; Auclert, L.Z.; Zhai, X.; Wong, G.; Zhang, C.; Zhu, H.; Xing, G.; Wang, S.; He, W.; Li, K.; et al. Interspecies Transmission, Genetic Diversity, and Evolutionary Dynamics of Pseudorabies Virus. J. Infect. Dis. 2019, 219, 1705–1715. [Google Scholar] [CrossRef]
- Li, G.; He, W.; Zhu, H.; Bi, Y.; Wang, R.; Xing, G.; Zhang, C.; Zhou, J.; Yuen, K.Y.; Gao, G.F.; et al. Origin, Genetic Diversity, and Evolutionary Dynamics of Novel Porcine Circovirus 3. Adv. Sci. (Weinh. Baden-Wurtt. Ger.) 2018, 5, 1800275. [Google Scholar] [CrossRef]
- Quan, C.; Shi, W.; Yang, Y.; Yang, Y.; Liu, X.; Xu, W.; Li, H.; Li, J.; Wang, Q.; Tong, Z.; et al. New Threats from H7N9 Influenza Virus: Spread and Evolution of High- and Low-Pathogenicity Variants with High Genomic Diversity in Wave Five. J. Virol. 2018, 92, e00301-18. [Google Scholar] [CrossRef] [Green Version]
- Yang, H.; Carney, P.J.; Chang, J.C.; Villanueva, J.M.; Stevens, J. Structural Analysis of the Hemagglutinin from the Recent 2013 H7N9 Influenza Virus. J. Virol. 2013, 87, 12433–12446. [Google Scholar] [CrossRef] [Green Version]
- Wagner, R.; Matrosovich, M.; Klenk, H.D. Functional balance between haemagglutinin and neuraminidase in influenza virus infections. Rev. Med. Virol. 2002, 12, 159–166. [Google Scholar] [CrossRef]
- Wu, X.M.; Wu, S.F.; Ren, D.M.; Zhu, Y.P.; He, F.C. The analysis method and progress in the study of codon bias. Yi Chuan 2007, 29, 420–426. [Google Scholar] [CrossRef] [PubMed]
- Hershberg, R.; Petrov, D.A. Selection on codon bias. Annu. Rev. Genet. 2008, 42, 287–299. [Google Scholar] [CrossRef] [PubMed] [Green Version]
- Plotkin, J.B.; Kudla, G. Synonymous but not the same: The causes and consequences of codon bias. Nat. Rev. Genet. 2011, 12, 32–42. [Google Scholar] [CrossRef] [PubMed] [Green Version]
- Li, G.; Wang, H.; Wang, S.; Xing, G.; Zhang, C.; Zhang, W.; Liu, J.; Zhang, J.; Su, S.; Zhou, J. Insights into the genetic and host adaptability of emerging porcine circovirus 3. Virulence 2018, 9, 1301–1313. [Google Scholar] [CrossRef] [Green Version]
- Butt, A.M.; Nasrullah, I.; Qamar, R.; Tong, Y.G. Evolution of codon usage in Zika virus genomes is host and vector specific. Emerg. Microbes Infect. 2016, 5, e107. [Google Scholar] [CrossRef] [PubMed] [Green Version]
- Kumar, N.; Kulkarni, D.D.; Lee, B.; Kaushik, R.; Bhatia, S.; Sood, R.; Pateriya, A.K.; Bhat, S.; Singh, V.P. Evolution of Codon Usage Bias in Henipaviruses Is Governed by Natural Selection and Is Host-Specific. Viruses 2018, 10, 604. [Google Scholar] [CrossRef] [Green Version]
- Bera, B.C.; Virmani, N.; Kumar, N.; Anand, T.; Pavulraj, S.; Rash, A.; Elton, D.; Rash, N.; Bhatia, S.; Sood, R.; et al. Genetic and codon usage bias analyses of polymerase genes of equine influenza virus and its relation to evolution. BMC Genom. 2017, 18, 652. [Google Scholar] [CrossRef]
- Zhou, Y.; Chen, X.; Ushijima, H.; Frey, T.K. Analysis of base and codon usage by rubella virus. Arch. Virol. 2012, 157, 889–899. [Google Scholar] [CrossRef]
- Chen, F.; Wu, P.; Deng, S.; Zhang, H.; Hou, Y.; Hu, Z.; Zhang, J.; Chen, X.; Yang, J.R. Dissimilation of synonymous codon usage bias in virus-host coevolution due to translational selection. Nat. Ecol. Evol. 2020, 4, 589–600. [Google Scholar] [CrossRef]
- Chaney, J.L.; Clark, P.L. Roles for Synonymous Codon Usage in Protein Biogenesis. Annu. Rev. Biophys. 2015, 44, 143–166. [Google Scholar] [CrossRef]
- Gun, L.; Haixian, P.; Yumiao, R.; Han, T.; Jingqi, L.; Liguang, Z. Codon usage characteristics of PB2 gene in influenza A H7N9 virus from different host species. Infect. Genet. Evol. J. Mol. Epidemiol. Evol. Genet. Infect. Dis. 2018, 65, 430–435. [Google Scholar] [CrossRef] [PubMed]
- Zhu, H.N.; Hughes, J.; Murcia, P.R. Origins and Evolutionary Dynamics of H3N2 Canine Influenza Virus. J. Virol. 2015, 89, 5406–5418. [Google Scholar] [CrossRef] [PubMed] [Green Version]
- Lam, T.T.; Wang, J.; Shen, Y.; Zhou, B.; Duan, L.; Cheung, C.L.; Ma, C.; Lycett, S.J.; Leung, C.Y.; Chen, X.; et al. The genesis and source of the H7N9 influenza viruses causing human infections in China. Nature 2013, 502, 241–244. [Google Scholar] [CrossRef] [PubMed] [Green Version]
- Li, G.R.; Wang, R.Y.; Zhang, C.; Wang, S.L.; He, W.T.; Zhang, J.Y.; Liu, J.; Cai, Y.C.; Zhou, J.Y.; Su, S. Genetic and evolutionary analysis of emerging H3N2 canine influenza virus. Emerg. Microbes Infect. 2018, 7, 73. [Google Scholar] [CrossRef] [PubMed] [Green Version]
- Anhlan, D.; Grundmann, N.; Makalowski, W.; Ludwig, S.; Scholtissek, C. Origin of the 1918 pandemic H1N1 influenza A virus as studied by codon usage patterns and phylogenetic analysis. RNA 2011, 17, 64–73. [Google Scholar] [CrossRef] [Green Version]
- Kumar, N.; Bera, B.C.; Greenbaum, B.D.; Bhatia, S.; Sood, R.; Selvaraj, P.; Anand, T.; Tripathi, B.N.; Virmani, N. Revelation of Influencing Factors in Overall Codon Usage Bias of Equine Influenza Viruses. PLoS ONE 2016, 11, e0154376. [Google Scholar] [CrossRef] [Green Version]
- Zhou, T.; Gu, W.J.; Ma, J.M.; Sun, X.; Lu, Z.H. Analysis of synonymous codon usage in H5N1 virus and other influenza A viruses. Biosystems 2005, 81, 77–86. [Google Scholar] [CrossRef]
- Zhang, W.; Zhang, L.; He, W.; Zhang, X.; Wen, B.; Wang, C.; Xu, Q.; Li, G.; Zhou, J.; Veit, M.; et al. Genetic Evolution and Molecular Selection of the HE Gene of Influenza C Virus. Viruses 2019, 11, 167. [Google Scholar] [CrossRef] [Green Version]
- Yan, Z.; Wang, R.; Zhang, L.; Shen, B.; Wang, N.; Xu, Q.; He, W.; He, W.; Li, G.; Su, S. Evolutionary changes of the novel Influenza D virus hemagglutinin-esterase fusion gene revealed by the codon usage pattern. Virulence 2019, 10, 1–9. [Google Scholar] [CrossRef] [Green Version]
- Jenkins, G.M.; Holmes, E.C. The extent of codon usage bias in human RNA viruses and its evolutionary origin. Virus Res. 2003, 92, 1–7. [Google Scholar] [CrossRef]
- Hu, J.S.; Wang, Q.Q.; Zhang, J.; Chen, H.T.; Xu, Z.W.; Zhu, L.; Ding, Y.Z.; Ma, L.N.; Xu, K.; Gu, Y.X.; et al. The characteristic of codon usage pattern and its evolution of hepatitis C virus. Infect. Genet. Evol. 2011, 11, 2098–2102. [Google Scholar] [CrossRef] [PubMed]
- Yang, L.; Zhu, W.; Li, X.; Chen, M.; Wu, J.; Yu, P.; Qi, S.; Huang, Y.; Shi, W.; Dong, J.; et al. Genesis and Spread of Newly Emerged Highly Pathogenic H7N9 Avian Viruses in Mainland China. J. Virol. 2017, 91, e01277-17. [Google Scholar] [CrossRef] [Green Version]
- Franzo, G.; Tucciarone, C.M.; Cecchinato, M.; Drigo, M. Canine parvovirus type 2 (CPV-2) and Feline panleukopenia virus (FPV) codon bias analysis reveals a progressive adaptation to the new niche after the host jump. Mol. Phylogenet. Evol. 2017, 114, 82–92. [Google Scholar] [CrossRef]
- Zheng, Z.; Lu, Y.; Short, K.R.; Lu, J. One health insights to prevent the next HxNy viral outbreak: Learning from the epidemiology of H7N9. BMC Infect. Dis. 2019, 19, 138. [Google Scholar] [CrossRef] [PubMed] [Green Version]
- Greenbaum, B.D.; Levine, A.J.; Bhanot, G.; Rabadan, R. Patterns of evolution and host gene mimicry in influenza and other RNA viruses. PLoS Pathog. 2008, 4, e1000079. [Google Scholar] [CrossRef] [PubMed]
- Katoh, K.; Standley, D.M. MAFFT multiple sequence alignment software version 7: Improvements in performance and usability. Mol. Biol. Evol. 2013, 30, 772–780. [Google Scholar] [CrossRef] [PubMed] [Green Version]
- Stamatakis, A. RAxML Version 8: A Tool for Phylogenetic Analysis and Post-Analysis of Large Phylogenies. Bioinformatics 2014, 30, 1312–1313. [Google Scholar] [CrossRef] [PubMed]
- Keane, T.M.; Creevey, C.J.; Pentony, M.M.; Naughton, T.J.; McLnerney, J.O. Assessment of methods for amino acid matrix selection and their use on empirical data shows that ad hoc assumptions for choice of matrix are not justified. BMC Evol. Biol. 2006, 6, 29. [Google Scholar] [CrossRef] [Green Version]
- Li, G.; Ji, S.; Zhai, X.; Zhang, Y.; Liu, J.; Zhu, M.; Zhou, J.; Su, S. Evolutionary and genetic analysis of the VP2 gene of canine parvovirus. BMC Genom. 2017, 18, 534. [Google Scholar] [CrossRef]
- Dave, U.; Srivathsan, A.; Kumar, S. Analysis of codon usage pattern in the viral proteins of chicken anaemia virus and its possible biological relevance. Infect. Genet. Evol. 2019, 69, 93–106. [Google Scholar] [CrossRef]
- Sharp, P.M.; Li, W.H. Codon Usage in Regulatory Genes in Escherichia-Coli Does Not Reflect Selection for Rare Codons. Nucleic Acids Res. 1986, 14, 7737–7749. [Google Scholar] [CrossRef] [PubMed] [Green Version]
- Sharp, P.M.; Li, W.H. An Evolutionary Perspective on Synonymous Codon Usage in Unicellular Organisms. J. Mol. Evol. 1986, 24, 28–38. [Google Scholar] [CrossRef] [PubMed]
- Wong, E.H.M.; Smith, D.K.; Rabadan, R.; Peiris, M.; Poon, L.L.M. Codon usage bias and the evolution of influenza A viruses. Codon Usage Biases of Influenza Virus. BMC Evol. Biol. 2010, 10, 253. [Google Scholar] [CrossRef] [PubMed] [Green Version]
- Wright, F. The ‘effective number of codons’ used in a gene. Gene 1990, 87, 23–29. [Google Scholar] [CrossRef]
- Comeron, J.M.; Aguade, M. An evaluation of measures of synonymous codon usage bias. J. Mol. Evol. 1998, 47, 268–274. [Google Scholar] [CrossRef]
- Ma, J.J.; Zhao, F.; Zhang, J.; Zhou, J.H.; Ma, L.N.; Ding, Y.Z.; Chen, H.T.; Gu, Y.X.; Liu, Y.S. Analysis of Synonymous Codon Usage in Dengue Viruses. J. Anim. Vet. Adv. 2013, 12, 88–98. [Google Scholar]
- Nasrullah, I.; Butt, A.M.; Tahir, S.; Idrees, M.; Tong, Y.G. Genomic analysis of codon usage shows influence of mutation pressure, natural selection, and host features on Marburg virus evolution. BMC Evol. Biol. 2015, 15, 174. [Google Scholar] [CrossRef] [Green Version]
- Moratorio, G.; Iriarte, A.; Moreno, P.; Musto, H.; Cristina, J. A detailed comparative analysis on the overall codon usage patterns in West Nile virus. Infect. Genet. Evol. 2013, 14, 396–400. [Google Scholar] [CrossRef]
- Sueoka, N. Intrastrand parity rules of DNA base composition and usage biases of synonymous codons. J. Mol. Evol. 1995, 40, 318–325. [Google Scholar] [CrossRef]
- Sueoka, N. Translation-coupled violation of Parity Rule 2 in human genes is not the cause of heterogeneity of the DNA G plus C content of third codon position. Gene 1999, 238, 53–58. [Google Scholar] [CrossRef]
- Sueoka, N. Directional mutation pressure and neutral molecular evolution. Proc. Natl. Acad. Sci. USA 1988, 85, 2653–2657. [Google Scholar] [CrossRef] [PubMed] [Green Version]
- Puigbo, P.; Bravo, I.G.; Garcia-Vallve, S. CAIcal: A combined set of tools to assess codon usage adaptation. Biol. Direct 2008, 3, 38. [Google Scholar] [CrossRef] [PubMed] [Green Version]
- Sharp, P.M.; Li, W.H. The Codon Adaptation Index—A Measure of Directional Synonymous Codon Usage Bias, and Its Potential Applications. Nucleic Acids Res. 1987, 15, 1281–1295. [Google Scholar] [CrossRef] [PubMed] [Green Version]
- Nakamura, Y.; Gojobori, T.; Ikemura, T. Codon usage tabulated from international DNA sequence databases: Status for the year 2000. Nucleic Acids Res. 2000, 28, 292. [Google Scholar] [CrossRef] [PubMed] [Green Version]
- Puigbo, P.; Aragones, L.; Garcia-Vallve, S. RCDI/eRCDI: A web-server to estimate codon usage deoptimization. BMC Res. Notes 2010, 3, 87. [Google Scholar] [CrossRef] [Green Version]
- Mueller, S.; Papamichail, D.; Coleman, J.R.; Skiena, S.; Wimmer, E. Reduction of the rate of poliovirus protein synthesis through large-scale codon deoptimization causes attenuation of viral virulence by lowering specific infectivity. J. Virol. 2006, 80, 9687–9696. [Google Scholar] [CrossRef] [Green Version]
- Zhou, J.H.; Zhang, J.; Sun, D.J.; Ma, Q.; Chen, H.T.; Ma, L.N.; Ding, Y.Z.; Liu, Y.S. The Distribution of Synonymous Codon Choice in the Translation Initiation Region of Dengue Virus. PLoS ONE 2013, 8, e77239. [Google Scholar] [CrossRef]
- Karlin, S.; Burge, C. Dinucleotide relative abundance extremes: A genomic signature. Trends Genet. 1995, 11, 283–290. [Google Scholar]
- Karlin, S.; Doerfler, W.; Cardon, L.R. Why is CpG suppressed in the genomes of virtually all small eukaryotic viruses but not in those of large eukaryotic viruses? J. Virol. 1994, 68, 2889–2897. [Google Scholar] [CrossRef] [Green Version]


| Gene | Composition of A | Composition of A3 | GC1s | GC2s | GC3s |
|---|---|---|---|---|---|
| HA | 34.68% ± 0.21 | 48.14% ± 0.99 | 50.05% ± 0.268 | 41.20% ± 0.277 | 34.43% ± 0.796 |
| NA | 35.2% ± 0.20 | 49.42% ± 0.613 | 43.51% ± 0.398 | 47.26% ± 0.333 | 39.03% ± 0.624 |
| (A)HA | All | Host | Pathogenicity | Wave | Reference Host | ||||||||
| Codon | Avian | Human | Environment | High | Low | Wave 1 | Wave 2 | Wave 3 | Wave 4 | Wave 5 | Gallus gallus | Homo sapiens | |
| UUU(F) | 0.69 | 0.71 | 0.68 | 0.67 | 0.64 | 0.69 | 0.72 | 0.72 | 0.68 | 0.65 | 0.64 | 0.91 | 0.93 |
| UUC(F) | 1.31 | 1.29 | 1.32 | 1.33 | 1.36 | 1.31 | 1.28 | 1.28 | 1.32 | 1.35 | 1.36 | 1.09 | 1.07 |
| UUA(L) | 0.5 | 0.52 | 0.48 | 0.49 | 0.49 | 0.5 | 0.46 | 0.51 | 0.5 | 0.48 | 0.48 | 0.45 | 0.46 |
| UUG(L) | 0.48 | 0.48 | 0.48 | 0.49 | 0.57 | 0.47 | 0.46 | 0.48 | 0.48 | 0.48 | 0.49 | 0.81 | 0.77 |
| CUU(L) | 0.67 | 0.65 | 0.67 | 0.71 | 0.81 | 0.66 | 0.62 | 0.64 | 0.68 | 0.64 | 0.72 | 0.80 | 0.79 |
| CUC(L) | 0.91 | 0.87 | 0.92 | 0.93 | 0.98 | 0.9 | 0.92 | 0.85 | 0.93 | 0.94 | 0.95 | 1.08 | 1.17 |
| CUA(L) | 1.55 | 1.59 | 1.54 | 1.46 | 1.3 | 1.56 | 1.69 | 1.68 | 1.45 | 1.43 | 1.41 | 0.38 | 0.43 |
| CUG(L) | 1.9 | 1.89 | 1.9 | 1.92 | 1.85 | 1.9 | 1.85 | 1.84 | 1.95 | 2.03 | 1.95 | 2.48 | 2.37 |
| AUU(I) | 1.09 | 1.11 | 1.08 | 1.08 | 1.06 | 1.09 | 1.12 | 1.11 | 1.09 | 1.06 | 1.05 | 1.06 | 1.08 |
| AUC(I) | 0.61 | 0.61 | 0.61 | 0.59 | 0.56 | 0.61 | 0.62 | 0.63 | 0.6 | 0.58 | 0.59 | 1.39 | 1.41 |
| AUA(I) | 1.31 | 1.28 | 1.31 | 1.33 | 1.38 | 1.3 | 1.26 | 1.27 | 1.31 | 1.36 | 1.36 | 0.55 | 0.51 |
| GUU(V) | 0.93 | 0.91 | 0.94 | 0.97 | 1.04 | 0.93 | 0.88 | 0.89 | 0.94 | 0.98 | 1 | 0.84 | 0.73 |
| GUC(V) | 0.75 | 0.75 | 0.75 | 0.74 | 0.7 | 0.75 | 0.75 | 0.75 | 0.75 | 0.76 | 0.75 | 0.87 | 0.95 |
| GUA(V) | 1.17 | 1.22 | 1.15 | 1.11 | 0.98 | 1.18 | 1.25 | 1.23 | 1.2 | 1.09 | 1.03 | 0.50 | 0.47 |
| GUG(V) | 1.15 | 1.12 | 1.16 | 1.18 | 1.28 | 1.14 | 1.12 | 1.13 | 1.11 | 1.17 | 1.21 | 1.80 | 1.85 |
| UCU(S) | 0.88 | 0.91 | 0.87 | 0.87 | 0.94 | 0.88 | 0.9 | 0.9 | 0.91 | 0.83 | 0.82 | 1.09 | 1.13 |
| UCC(S) | 0.19 | 0.16 | 0.2 | 0.23 | 0.19 | 0.19 | 0.14 | 0.15 | 0.16 | 0.27 | 0.27 | 1.21 | 1.31 |
| UCA(S) | 1.78 | 1.79 | 1.77 | 1.76 | 1.74 | 1.78 | 1.8 | 1.8 | 1.76 | 1.74 | 1.74 | 0.89 | 0.90 |
| UCG(S) | 0.22 | 0.19 | 0.24 | 0.26 | 0.3 | 0.22 | 0.15 | 0.16 | 0.27 | 0.31 | 0.32 | 0.40 | 0.33 |
| AGU(S) | 1.74 | 1.76 | 1.74 | 1.69 | 1.72 | 1.74 | 1.81 | 1.75 | 1.73 | 1.75 | 1.68 | 0.86 | 0.90 |
| AGC(S) | 1.19 | 1.2 | 1.19 | 1.2 | 1.11 | 1.2 | 1.2 | 1.24 | 1.16 | 1.09 | 1.17 | 1.55 | 1.44 |
| CCU(P) | 0.77 | 0.71 | 0.8 | 0.8 | 0.67 | 0.77 | 0.71 | 0.71 | 0.74 | 0.87 | 0.9 | 1.10 | 1.15 |
| CCC(P) | 0.43 | 0.49 | 0.4 | 0.41 | 0.62 | 0.42 | 0.47 | 0.47 | 0.47 | 0.31 | 0.31 | 1.22 | 1.29 |
| CCA(P) | 2.11 | 2.1 | 2.11 | 2.1 | 2.04 | 2.11 | 2.11 | 2.11 | 2.08 | 2.12 | 2.11 | 1.13 | 1.11 |
| CCG(P) | 0.7 | 0.71 | 0.69 | 0.69 | 0.66 | 0.7 | 0.71 | 0.71 | 0.7 | 0.7 | 0.67 | 0.56 | 0.45 |
| ACU(T) | 1.36 | 1.38 | 1.35 | 1.34 | 1.32 | 1.36 | 1.41 | 1.38 | 1.39 | 1.38 | 1.3 | 0.99 | 0.99 |
| ACC(T) | 0.73 | 0.72 | 0.73 | 0.76 | 0.79 | 0.72 | 0.7 | 0.71 | 0.72 | 0.69 | 0.76 | 1.23 | 1.42 |
| ACA(T) | 1.88 | 1.88 | 1.89 | 1.88 | 1.78 | 1.89 | 1.88 | 1.88 | 1.88 | 1.92 | 1.91 | 1.20 | 1.14 |
| ACG(T) | 0.03 | 0.02 | 0.04 | 0.03 | 0.12 | 0.03 | 0 | 0.03 | 0.01 | 0.01 | 0.03 | 0.57 | 0.46 |
| GCU(A) | 1.24 | 1.24 | 1.24 | 1.22 | 1.24 | 1.24 | 1.23 | 1.24 | 1.24 | 1.25 | 1.25 | 1.16 | 1.06 |
| GCC(A) | 0.56 | 0.56 | 0.56 | 0.57 | 0.55 | 0.56 | 0.55 | 0.55 | 0.55 | 0.56 | 0.57 | 1.27 | 1.60 |
| GCA(A) | 1.88 | 1.89 | 1.87 | 1.87 | 1.89 | 1.88 | 1.89 | 1.9 | 1.88 | 1.85 | 1.85 | 1.06 | 0.91 |
| GCG(A) | 0.33 | 0.32 | 0.33 | 0.34 | 0.33 | 0.33 | 0.33 | 0.32 | 0.33 | 0.34 | 0.33 | 0.51 | 0.42 |
| UAU(Y) | 1.23 | 1.2 | 1.25 | 1.25 | 1.2 | 1.24 | 1.2 | 1.21 | 1.2 | 1.29 | 1.31 | 0.80 | 0.89 |
| UAC(Y) | 0.77 | 0.8 | 0.75 | 0.75 | 0.8 | 0.76 | 0.8 | 0.79 | 0.8 | 0.71 | 0.69 | 1.20 | 1.11 |
| CAU(H) | 1.37 | 1.39 | 1.37 | 1.36 | 1.4 | 1.37 | 1.4 | 1.4 | 1.4 | 1.4 | 1.33 | 0.80 | 0.84 |
| CAC(H) | 0.63 | 0.61 | 0.63 | 0.64 | 0.6 | 0.63 | 0.6 | 0.6 | 0.6 | 0.6 | 0.67 | 1.20 | 1.16 |
| CAA(Q) | 1.3 | 1.31 | 1.29 | 1.29 | 1.31 | 1.3 | 1.28 | 1.31 | 1.29 | 1.29 | 1.29 | 0.54 | 0.53 |
| CAG(Q) | 0.7 | 0.69 | 0.71 | 0.71 | 0.69 | 0.7 | 0.72 | 0.69 | 0.71 | 0.71 | 0.71 | 1.46 | 1.47 |
| AAU(N) | 1.28 | 1.28 | 1.28 | 1.29 | 1.32 | 1.28 | 1.29 | 1.27 | 1.29 | 1.27 | 1.27 | 0.86 | 0.94 |
| AAC(N) | 0.72 | 0.72 | 0.72 | 0.71 | 0.68 | 0.72 | 0.71 | 0.73 | 0.71 | 0.73 | 0.73 | 1.14 | 1.06 |
| AAA(K) | 1.32 | 1.3 | 1.33 | 1.31 | 1.32 | 1.32 | 1.36 | 1.31 | 1.35 | 1.28 | 1.3 | 0.89 | 0.87 |
| AAG(K) | 0.68 | 0.7 | 0.67 | 0.69 | 0.68 | 0.68 | 0.64 | 0.69 | 0.65 | 0.72 | 0.7 | 1.11 | 1.13 |
| GAU(D) | 1.25 | 1.23 | 1.25 | 1.25 | 1.22 | 1.25 | 1.22 | 1.25 | 1.23 | 1.27 | 1.29 | 1.01 | 0.93 |
| GAC(D) | 0.75 | 0.77 | 0.75 | 0.75 | 0.78 | 0.75 | 0.78 | 0.75 | 0.77 | 0.73 | 0.71 | 0.99 | 1.07 |
| GAA(E) | 1.38 | 1.4 | 1.37 | 1.37 | 1.44 | 1.38 | 1.4 | 1.4 | 1.39 | 1.35 | 1.34 | 0.86 | 0.84 |
| GAG(E) | 0.62 | 0.6 | 0.63 | 0.63 | 0.56 | 0.62 | 0.6 | 0.6 | 0.61 | 0.65 | 0.66 | 1.14 | 1.16 |
| UGU(C) | 1.37 | 1.37 | 1.37 | 1.37 | 1.38 | 1.37 | 1.37 | 1.37 | 1.38 | 1.36 | 1.36 | 0.80 | 0.91 |
| UGC(C) | 0.63 | 0.63 | 0.63 | 0.63 | 0.62 | 0.63 | 0.63 | 0.63 | 0.62 | 0.64 | 0.64 | 1.20 | 1.09 |
| CGU(R) | 0.2 | 0.2 | 0.2 | 0.2 | 0.18 | 0.2 | 0.2 | 0.21 | 0.2 | 0.2 | 0.2 | 0.59 | 0.48 |
| CGC(R) | 0 | 0 | 0 | 0 | 0 | 0 | 0 | 0 | 0 | 0 | 0 | 1.14 | 1.10 |
| CGA(R) | 0.56 | 0.6 | 0.55 | 0.52 | 0.55 | 0.56 | 0.6 | 0.62 | 0.59 | 0.58 | 0.47 | 0.58 | 0.65 |
| CGG(R) | 0.51 | 0.44 | 0.54 | 0.57 | 0.56 | 0.51 | 0.4 | 0.41 | 0.39 | 0.58 | 0.71 | 1.07 | 1.21 |
| AGA(R) | 3.31 | 3.28 | 3.32 | 3.33 | 3.4 | 3.3 | 3.23 | 3.33 | 3.25 | 3.35 | 3.4 | 1.34 | 1.29 |
| AGG(R) | 1.42 | 1.47 | 1.4 | 1.38 | 1.31 | 1.42 | 1.57 | 1.43 | 1.57 | 1.3 | 1.22 | 1.29 | 1.27 |
| GGU(G) | 0.67 | 0.65 | 0.67 | 0.68 | 0.65 | 0.67 | 0.64 | 0.64 | 0.66 | 0.71 | 0.71 | 0.70 | 0.65 |
| GGC(G) | 0.48 | 0.48 | 0.47 | 0.48 | 0.49 | 0.48 | 0.48 | 0.48 | 0.48 | 0.48 | 0.47 | 1.22 | 1.35 |
| GGA(G) | 1.89 | 1.97 | 1.87 | 1.83 | 1.88 | 1.9 | 2 | 2 | 1.87 | 1.71 | 1.73 | 1.09 | 1.00 |
| GGG(G) | 0.96 | 0.91 | 0.98 | 1.01 | 0.98 | 0.96 | 0.88 | 0.88 | 0.99 | 1.09 | 1.09 | 0.99 | 1.00 |
| (B)NA | All | Host | Pathogenicity | Wave | Reference host | ||||||||
| Codon | Avian | Human | Environment | High | Low | Wave 1 | Wave 2 | Wave 3 | Wave 4 | Wave 5 | Gallus gallus | Homo sapiens | |
| UUU(F) | 0.49 | 0.5 | 0.47 | 0.51 | 0.46 | 0.51 | 0.44 | 0.48 | 0.46 | 0.46 | 0.55 | 0.91 | 0.93 |
| UUC(F) | 1.51 | 1.5 | 1.53 | 1.49 | 1.54 | 1.49 | 1.56 | 1.52 | 1.54 | 1.54 | 1.45 | 1.09 | 1.07 |
| UUA(L) | 1.02 | 1.03 | 1.01 | 1.06 | 1.03 | 1.03 | 0.98 | 1 | 1 | 1.14 | 1.06 | 0.45 | 0.46 |
| UUG(L) | 0.95 | 0.95 | 0.98 | 0.91 | 0.79 | 0.94 | 1 | 1.01 | 1 | 1.02 | 0.86 | 0.81 | 0.77 |
| CUU(L) | 0.26 | 0.26 | 0.24 | 0.25 | 0.26 | 0.27 | 0.25 | 0.25 | 0.25 | 0.25 | 0.28 | 0.80 | 0.79 |
| CUC(L) | 0.99 | 0.99 | 1.01 | 0.99 | 1.03 | 0.98 | 1 | 1 | 1 | 1 | 0.97 | 1.08 | 1.17 |
| CUA(L) | 1.51 | 1.51 | 1.51 | 1.51 | 1.4 | 1.52 | 1.52 | 1.5 | 1.49 | 1.35 | 1.54 | 0.38 | 0.43 |
| CUG(L) | 1.26 | 1.26 | 1.25 | 1.29 | 1.49 | 1.26 | 1.25 | 1.25 | 1.26 | 1.23 | 1.28 | 2.48 | 2.37 |
| AUU(I) | 0.82 | 0.83 | 0.8 | 0.84 | 0.74 | 0.84 | 0.81 | 0.79 | 0.83 | 0.79 | 0.86 | 1.06 | 1.08 |
| AUC(I) | 0.42 | 0.42 | 0.41 | 0.42 | 0.48 | 0.42 | 0.41 | 0.42 | 0.42 | 0.42 | 0.43 | 1.39 | 1.41 |
| AUA(I) | 1.76 | 1.75 | 1.79 | 1.74 | 1.78 | 1.74 | 1.78 | 1.79 | 1.76 | 1.79 | 1.7 | 0.55 | 0.51 |
| GUU(V) | 0.7 | 0.71 | 0.71 | 0.69 | 0.58 | 0.71 | 0.72 | 0.71 | 0.71 | 0.78 | 0.7 | 0.84 | 0.73 |
| GUC(V) | 0.33 | 0.32 | 0.34 | 0.34 | 0.48 | 0.3 | 0.34 | 0.31 | 0.33 | 0.33 | 0.3 | 0.87 | 0.95 |
| GUA(V) | 1.66 | 1.68 | 1.64 | 1.65 | 1.66 | 1.66 | 1.73 | 1.64 | 1.71 | 1.67 | 1.64 | 0.50 | 0.47 |
| GUG(V) | 1.3 | 1.3 | 1.32 | 1.31 | 1.28 | 1.32 | 1.21 | 1.33 | 1.26 | 1.21 | 1.36 | 1.80 | 1.85 |
| UCU(S) | 0.73 | 0.71 | 0.79 | 0.69 | 0.69 | 0.68 | 0.83 | 0.84 | 0.7 | 0.59 | 0.59 | 1.09 | 1.13 |
| UCC(S) | 0.46 | 0.48 | 0.44 | 0.48 | 0.43 | 0.49 | 0.42 | 0.42 | 0.45 | 0.53 | 0.54 | 1.21 | 1.31 |
| UCA(S) | 2.07 | 2.07 | 2.09 | 2.06 | 2.03 | 2.06 | 2.07 | 2.1 | 2.1 | 2.06 | 2.03 | 0.89 | 0.90 |
| UCG(S) | 0.43 | 0.43 | 0.42 | 0.43 | 0.52 | 0.43 | 0.43 | 0.4 | 0.41 | 0.44 | 0.45 | 0.40 | 0.33 |
| AGU(S) | 1.19 | 1.21 | 1.13 | 1.23 | 1.23 | 1.24 | 1.11 | 1.09 | 1.24 | 1.37 | 1.32 | 0.86 | 0.90 |
| AGC(S) | 1.12 | 1.1 | 1.14 | 1.11 | 1.1 | 1.1 | 1.14 | 1.16 | 1.1 | 1.01 | 1.07 | 1.55 | 1.44 |
| CCU(P) | 1.03 | 1.03 | 1.02 | 1.04 | 1.13 | 1.03 | 1 | 0.99 | 1.1 | 1.08 | 1.04 | 1.10 | 1.15 |
| CCC(P) | 0.84 | 0.85 | 0.83 | 0.85 | 0.84 | 0.86 | 0.83 | 0.84 | 0.81 | 0.81 | 0.88 | 1.22 | 1.29 |
| CCA(P) | 1.61 | 1.6 | 1.65 | 1.59 | 1.66 | 1.58 | 1.67 | 1.68 | 1.61 | 1.62 | 1.51 | 1.13 | 1.11 |
| CCG(P) | 0.52 | 0.53 | 0.5 | 0.51 | 0.37 | 0.54 | 0.5 | 0.49 | 0.49 | 0.49 | 0.57 | 0.56 | 0.45 |
| ACU(T) | 1.05 | 1.02 | 1.12 | 1.02 | 1.01 | 1.02 | 1.07 | 1.12 | 1.06 | 1.05 | 0.96 | 0.99 | 0.99 |
| ACC(T) | 0.54 | 0.55 | 0.51 | 0.54 | 0.51 | 0.55 | 0.55 | 0.51 | 0.53 | 0.54 | 0.57 | 1.23 | 1.42 |
| ACA(T) | 2.4 | 2.42 | 2.36 | 2.43 | 2.47 | 2.42 | 2.38 | 2.37 | 2.4 | 2.4 | 2.45 | 1.20 | 1.14 |
| ACG(T) | 0.01 | 0.01 | 0.01 | 0.01 | 0.01 | 0.01 | 0 | 0 | 0.01 | 0.01 | 0.02 | 0.57 | 0.46 |
| GCU(A) | 1.2 | 1.2 | 1.21 | 1.18 | 1.17 | 1.19 | 1.21 | 1.22 | 1.18 | 1.18 | 1.18 | 1.16 | 1.06 |
| GCC(A) | 0.87 | 0.87 | 0.87 | 0.89 | 0.93 | 0.86 | 0.87 | 0.86 | 0.89 | 0.88 | 0.86 | 1.27 | 1.60 |
| GCA(A) | 1.76 | 1.76 | 1.75 | 1.76 | 1.71 | 1.77 | 1.74 | 1.74 | 1.75 | 1.76 | 1.8 | 1.06 | 0.91 |
| GCG(A) | 0.17 | 0.17 | 0.17 | 0.17 | 0.2 | 0.17 | 0.18 | 0.17 | 0.18 | 0.17 | 0.16 | 0.51 | 0.42 |
| UAU(Y) | 1.21 | 1.21 | 1.2 | 1.22 | 1.2 | 1.22 | 1.2 | 1.2 | 1.21 | 1.23 | 1.22 | 0.80 | 0.89 |
| UAC(Y) | 0.79 | 0.79 | 0.8 | 0.78 | 0.8 | 0.78 | 0.8 | 0.8 | 0.79 | 0.77 | 0.78 | 1.20 | 1.11 |
| CAU(H) | 0.65 | 0.64 | 0.67 | 0.66 | 0.73 | 0.63 | 0.67 | 0.67 | 0.7 | 0.62 | 0.6 | 0.80 | 0.84 |
| CAC(H) | 1.35 | 1.36 | 1.33 | 1.34 | 1.27 | 1.37 | 1.33 | 1.33 | 1.3 | 1.38 | 1.4 | 1.20 | 1.16 |
| CAA(Q) | 1.08 | 1.08 | 1.08 | 1.08 | 1.08 | 1.08 | 1.05 | 1.08 | 1.09 | 1.07 | 1.08 | 0.54 | 0.53 |
| CAG(Q) | 0.92 | 0.92 | 0.92 | 0.92 | 0.92 | 0.92 | 0.95 | 0.92 | 0.91 | 0.93 | 0.92 | 1.46 | 1.47 |
| AAU(N) | 0.96 | 0.96 | 0.97 | 0.94 | 0.86 | 0.95 | 0.99 | 0.98 | 0.96 | 0.94 | 0.92 | 0.86 | 0.94 |
| AAC(N) | 1.04 | 1.04 | 1.03 | 1.06 | 1.14 | 1.05 | 1.01 | 1.02 | 1.04 | 1.06 | 1.08 | 1.14 | 1.06 |
| AAA(K) | 1.26 | 1.26 | 1.26 | 1.26 | 1.31 | 1.25 | 1.29 | 1.26 | 1.28 | 1.28 | 1.23 | 0.89 | 0.87 |
| AAG(K) | 0.74 | 0.74 | 0.74 | 0.74 | 0.69 | 0.75 | 0.71 | 0.74 | 0.72 | 0.72 | 0.77 | 1.11 | 1.13 |
| GAU(D) | 0.97 | 0.98 | 0.96 | 0.98 | 0.93 | 0.98 | 0.97 | 0.95 | 0.92 | 0.95 | 1.01 | 1.01 | 0.93 |
| GAC(D) | 1.03 | 1.02 | 1.04 | 1.02 | 1.07 | 1.02 | 1.03 | 1.05 | 1.08 | 1.05 | 0.99 | 0.99 | 1.07 |
| GAA(E) | 1.33 | 1.35 | 1.3 | 1.35 | 1.35 | 1.35 | 1.27 | 1.26 | 1.4 | 1.43 | 1.37 | 0.86 | 0.84 |
| GAG(E) | 0.67 | 0.65 | 0.7 | 0.65 | 0.65 | 0.65 | 0.73 | 0.74 | 0.6 | 0.57 | 0.63 | 1.14 | 1.16 |
| UGU(C) | 0.65 | 0.65 | 0.67 | 0.64 | 0.67 | 0.64 | 0.66 | 0.66 | 0.67 | 0.67 | 0.62 | 0.80 | 0.91 |
| UGC(C) | 1.35 | 1.35 | 1.33 | 1.36 | 1.33 | 1.36 | 1.34 | 1.34 | 1.33 | 1.33 | 1.38 | 1.20 | 1.09 |
| CGU(R) | 0.24 | 0.24 | 0.24 | 0.24 | 0.26 | 0.24 | 0.24 | 0.24 | 0.24 | 0.24 | 0.25 | 0.59 | 0.48 |
| CGC(R) | 0.25 | 0.24 | 0.25 | 0.27 | 0.45 | 0.24 | 0.24 | 0.24 | 0.32 | 0.24 | 0.23 | 1.14 | 1.10 |
| CGA(R) | 0.96 | 0.96 | 0.95 | 0.96 | 0.98 | 0.96 | 0.97 | 0.96 | 0.94 | 0.98 | 0.97 | 0.58 | 0.65 |
| CGG(R) | 0.01 | 0.01 | 0.01 | 0.02 | 0.01 | 0.01 | 0 | 0 | 0 | 0 | 0.02 | 1.07 | 1.21 |
| AGA(R) | 2.43 | 2.41 | 2.49 | 2.42 | 2.46 | 2.4 | 2.4 | 2.49 | 2.38 | 2.4 | 2.38 | 1.34 | 1.29 |
| AGG(R) | 2.11 | 2.13 | 2.06 | 2.09 | 1.85 | 2.14 | 2.16 | 2.06 | 2.12 | 2.13 | 2.15 | 1.29 | 1.27 |
| GGU(G) | 0.46 | 0.46 | 0.45 | 0.45 | 0.44 | 0.46 | 0.45 | 0.47 | 0.46 | 0.47 | 0.46 | 0.70 | 0.65 |
| GGC(G) | 0.55 | 0.55 | 0.54 | 0.54 | 0.54 | 0.54 | 0.54 | 0.54 | 0.55 | 0.54 | 0.55 | 1.22 | 1.35 |
| GGA(G) | 1.7 | 1.67 | 1.76 | 1.63 | 1.47 | 1.65 | 1.78 | 1.82 | 1.61 | 1.56 | 1.56 | 1.09 | 1.00 |
| GGG(G) | 1.3 | 1.32 | 1.24 | 1.38 | 1.55 | 1.34 | 1.23 | 1.17 | 1.38 | 1.43 | 1.43 | 0.99 | 1.00 |
© 2020 by the authors. Licensee MDPI, Basel, Switzerland. This article is an open access article distributed under the terms and conditions of the Creative Commons Attribution (CC BY) license (http://creativecommons.org/licenses/by/4.0/).
Share and Cite
Sun, J.; Zhao, W.; Wang, R.; Zhang, W.; Li, G.; Lu, M.; Shao, Y.; Yang, Y.; Wang, N.; Gao, Q.; et al. Analysis of the Codon Usage Pattern of HA and NA Genes of H7N9 Influenza A Virus. Int. J. Mol. Sci. 2020, 21, 7129. https://0-doi-org.brum.beds.ac.uk/10.3390/ijms21197129
Sun J, Zhao W, Wang R, Zhang W, Li G, Lu M, Shao Y, Yang Y, Wang N, Gao Q, et al. Analysis of the Codon Usage Pattern of HA and NA Genes of H7N9 Influenza A Virus. International Journal of Molecular Sciences. 2020; 21(19):7129. https://0-doi-org.brum.beds.ac.uk/10.3390/ijms21197129
Chicago/Turabian StyleSun, Jiumeng, Wen Zhao, Ruyi Wang, Wenyan Zhang, Gairu Li, Meng Lu, Yuekun Shao, Yichen Yang, Ningning Wang, Qi Gao, and et al. 2020. "Analysis of the Codon Usage Pattern of HA and NA Genes of H7N9 Influenza A Virus" International Journal of Molecular Sciences 21, no. 19: 7129. https://0-doi-org.brum.beds.ac.uk/10.3390/ijms21197129