Macrophage-Derived Iron-Bound Lipocalin-2 Correlates with Renal Recovery Markers Following Sepsis-Induced Kidney Damage

 , and
, and 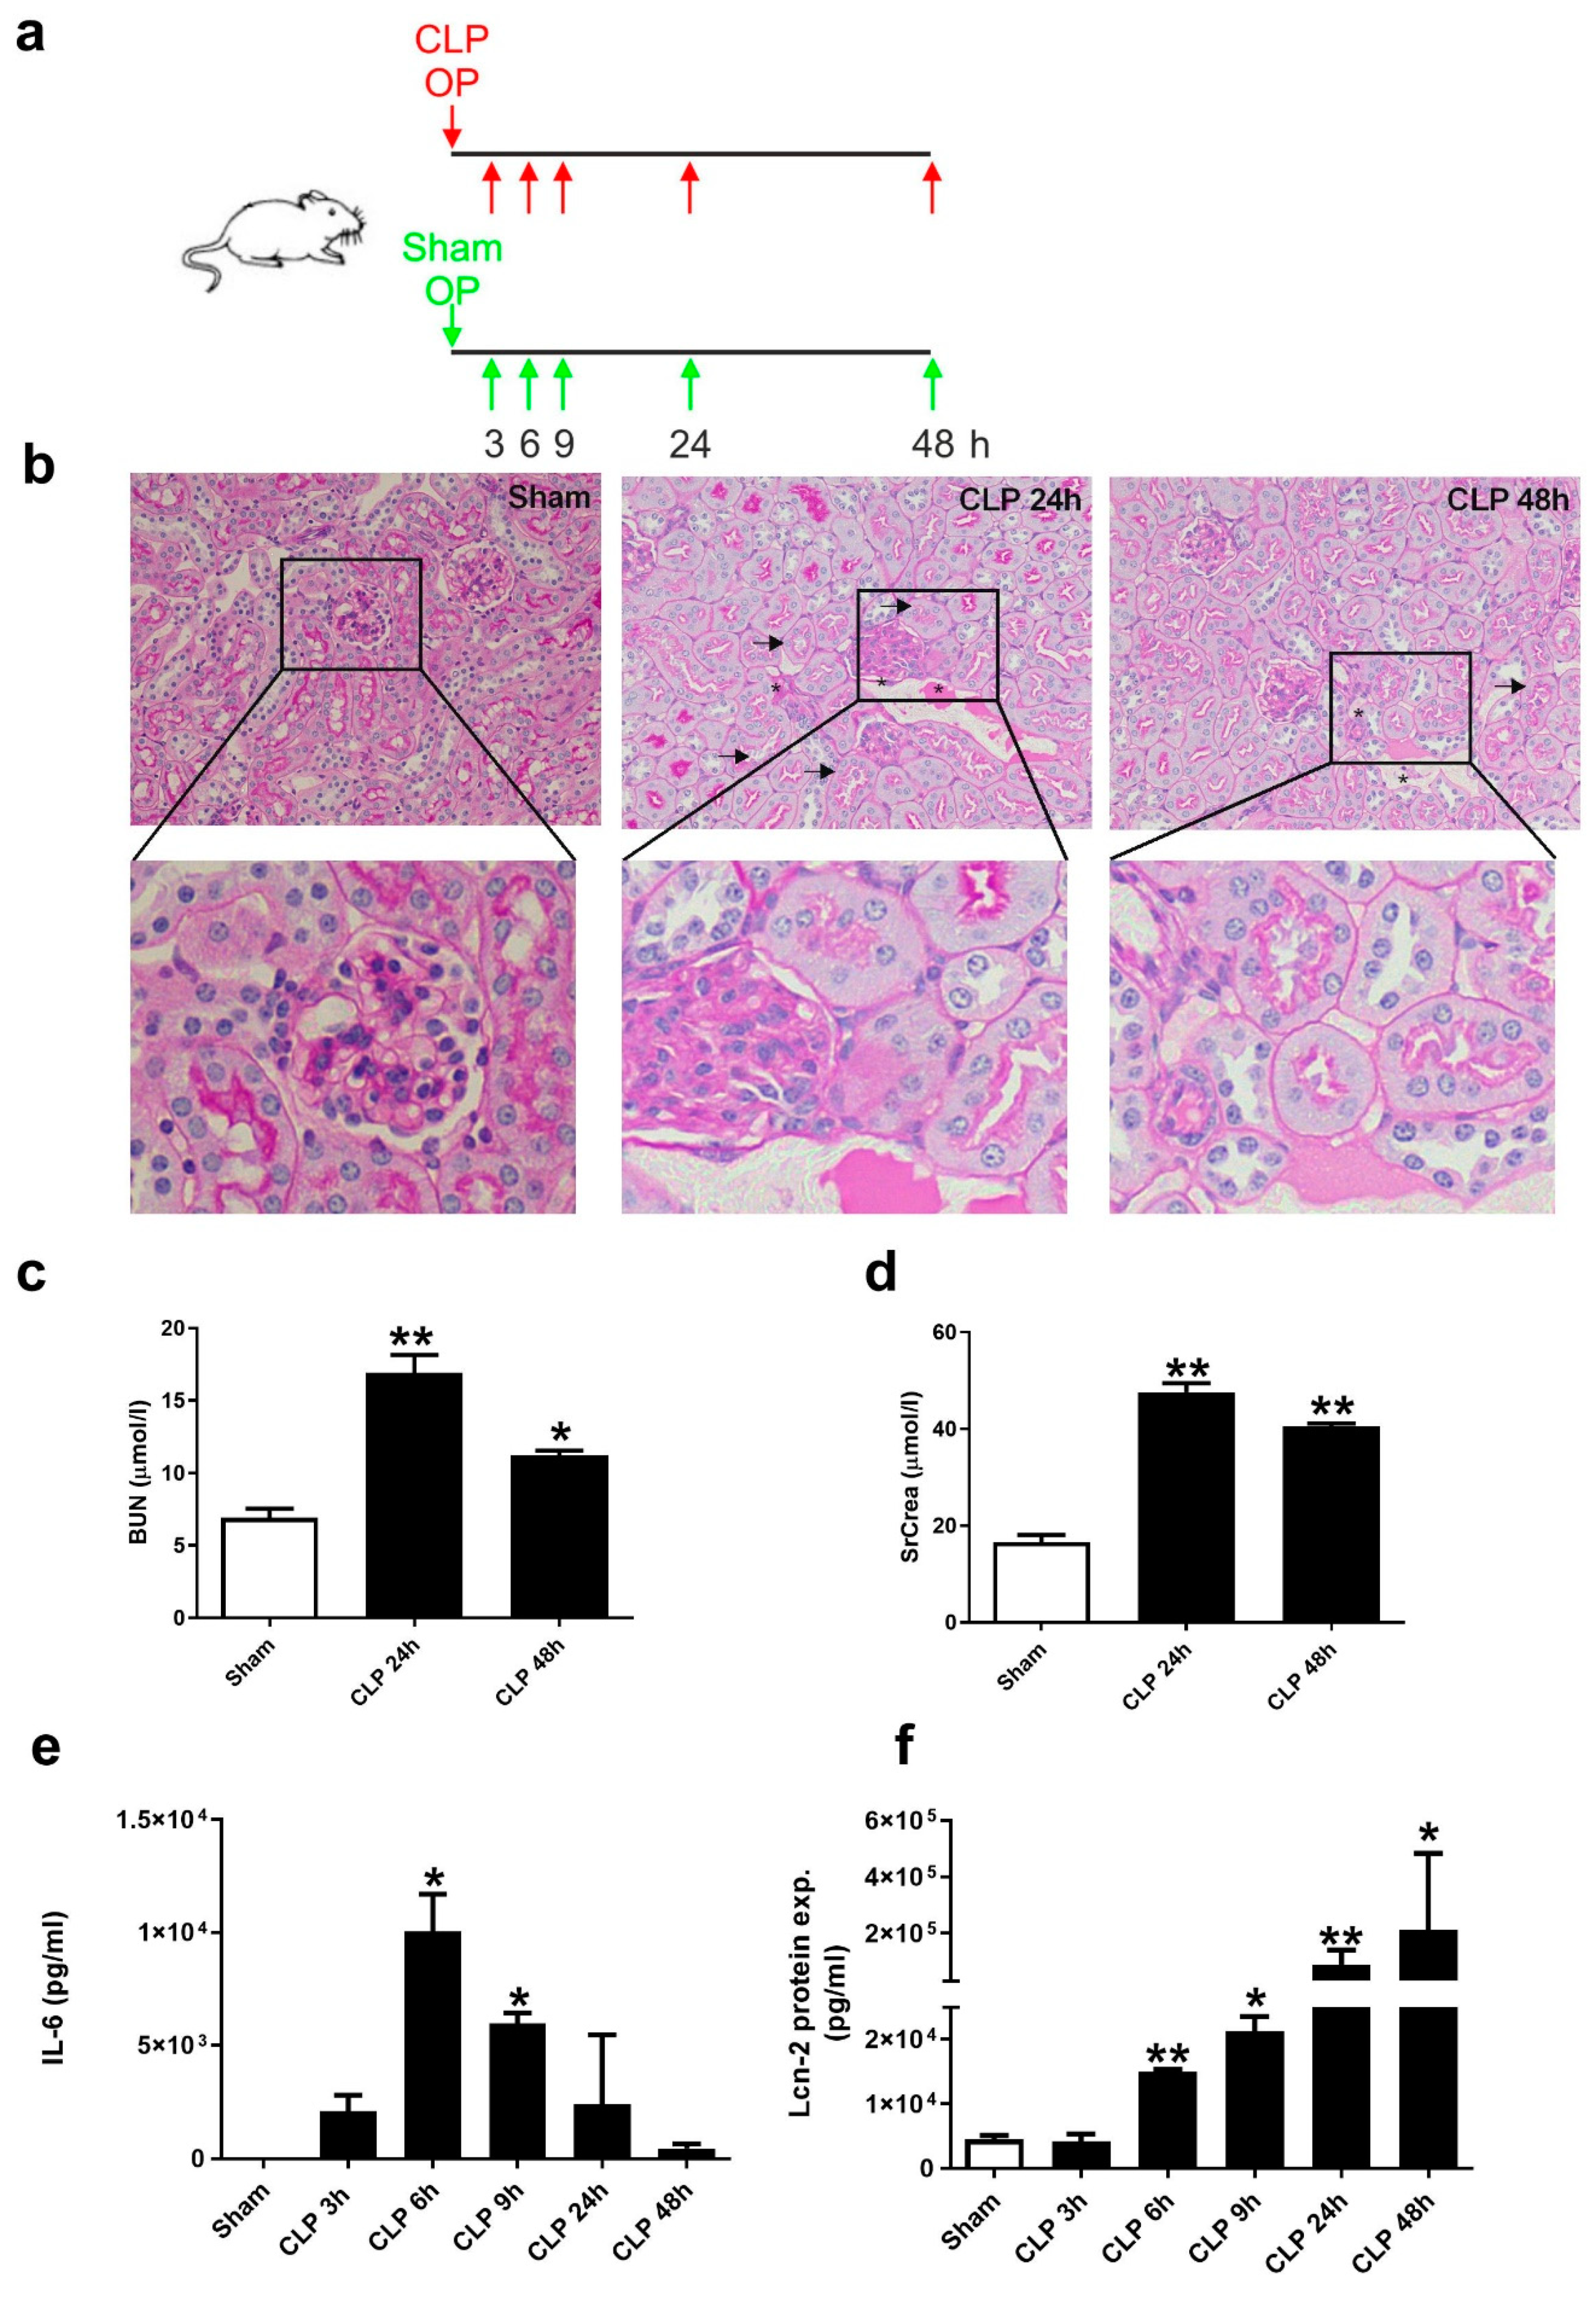
Abstract
:1. Introduction
2. Results
2.1. CLP-Induced Sepsis Fosters Kidney Damage at 24 h after CLP and Lcn-2 Protein Appearance in Serum as Early as 6 h after CLP
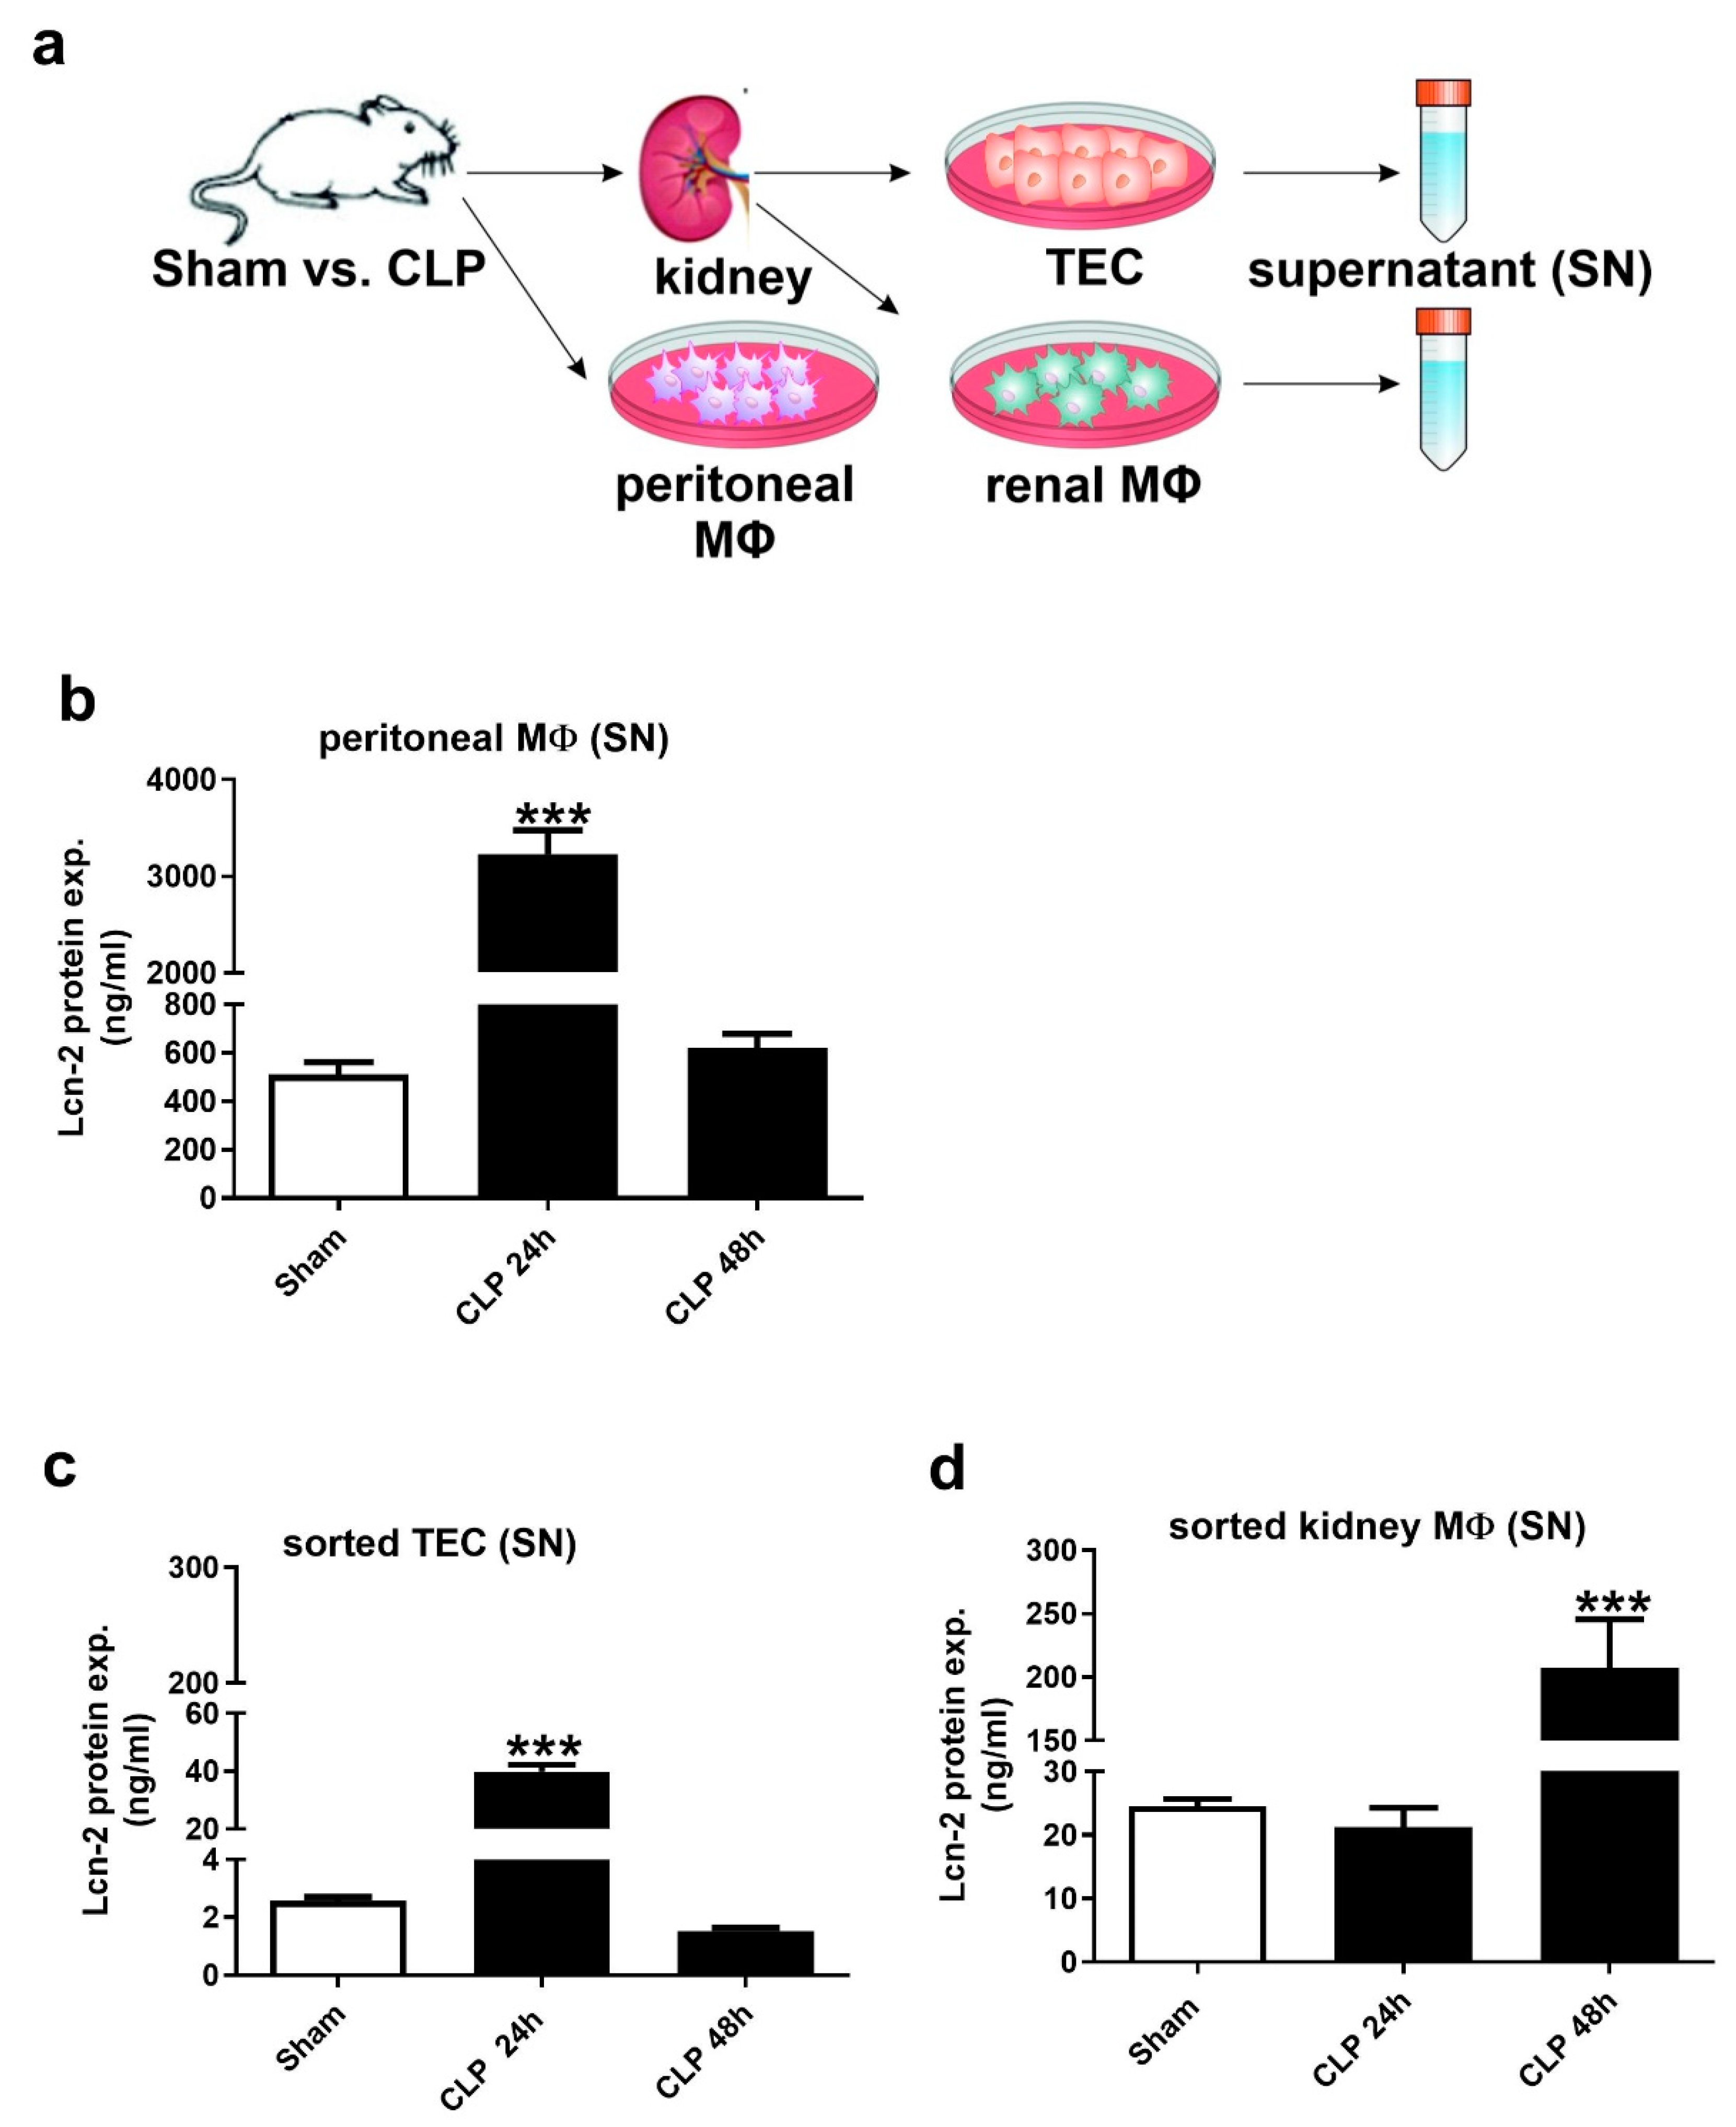
2.2. Lcn-2 Is Expressed from Different Sources during the Course of Sepsis
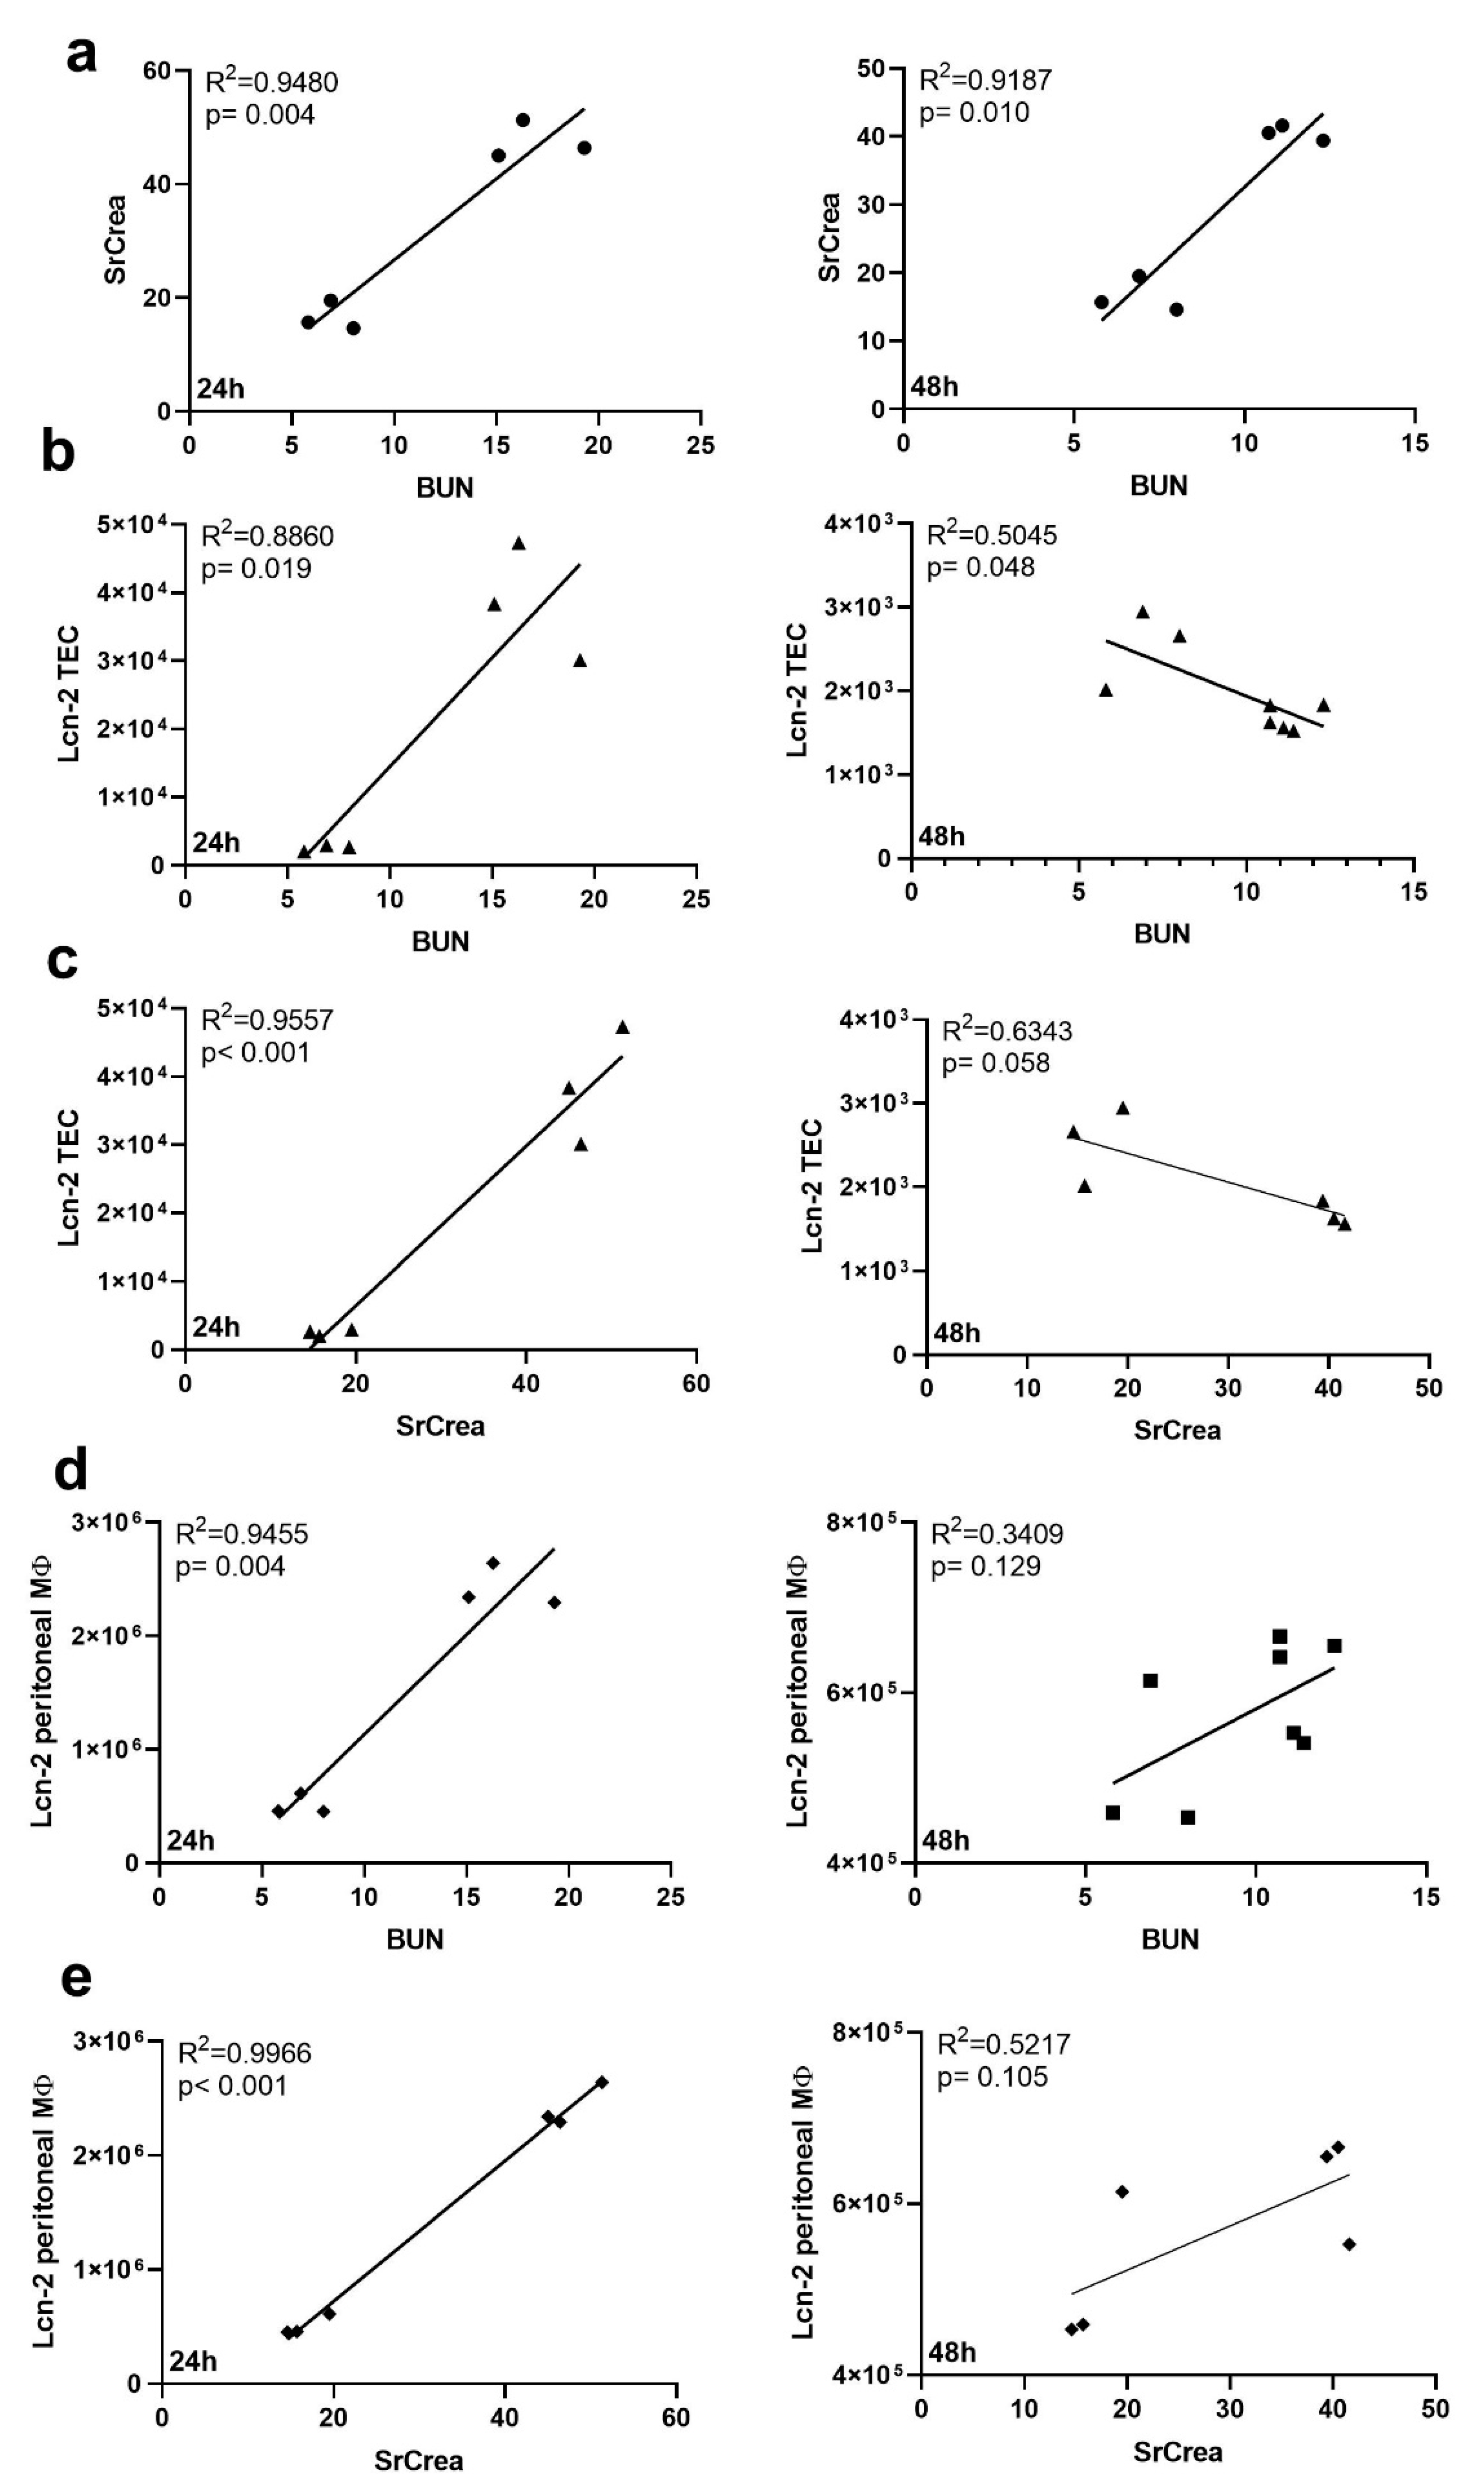
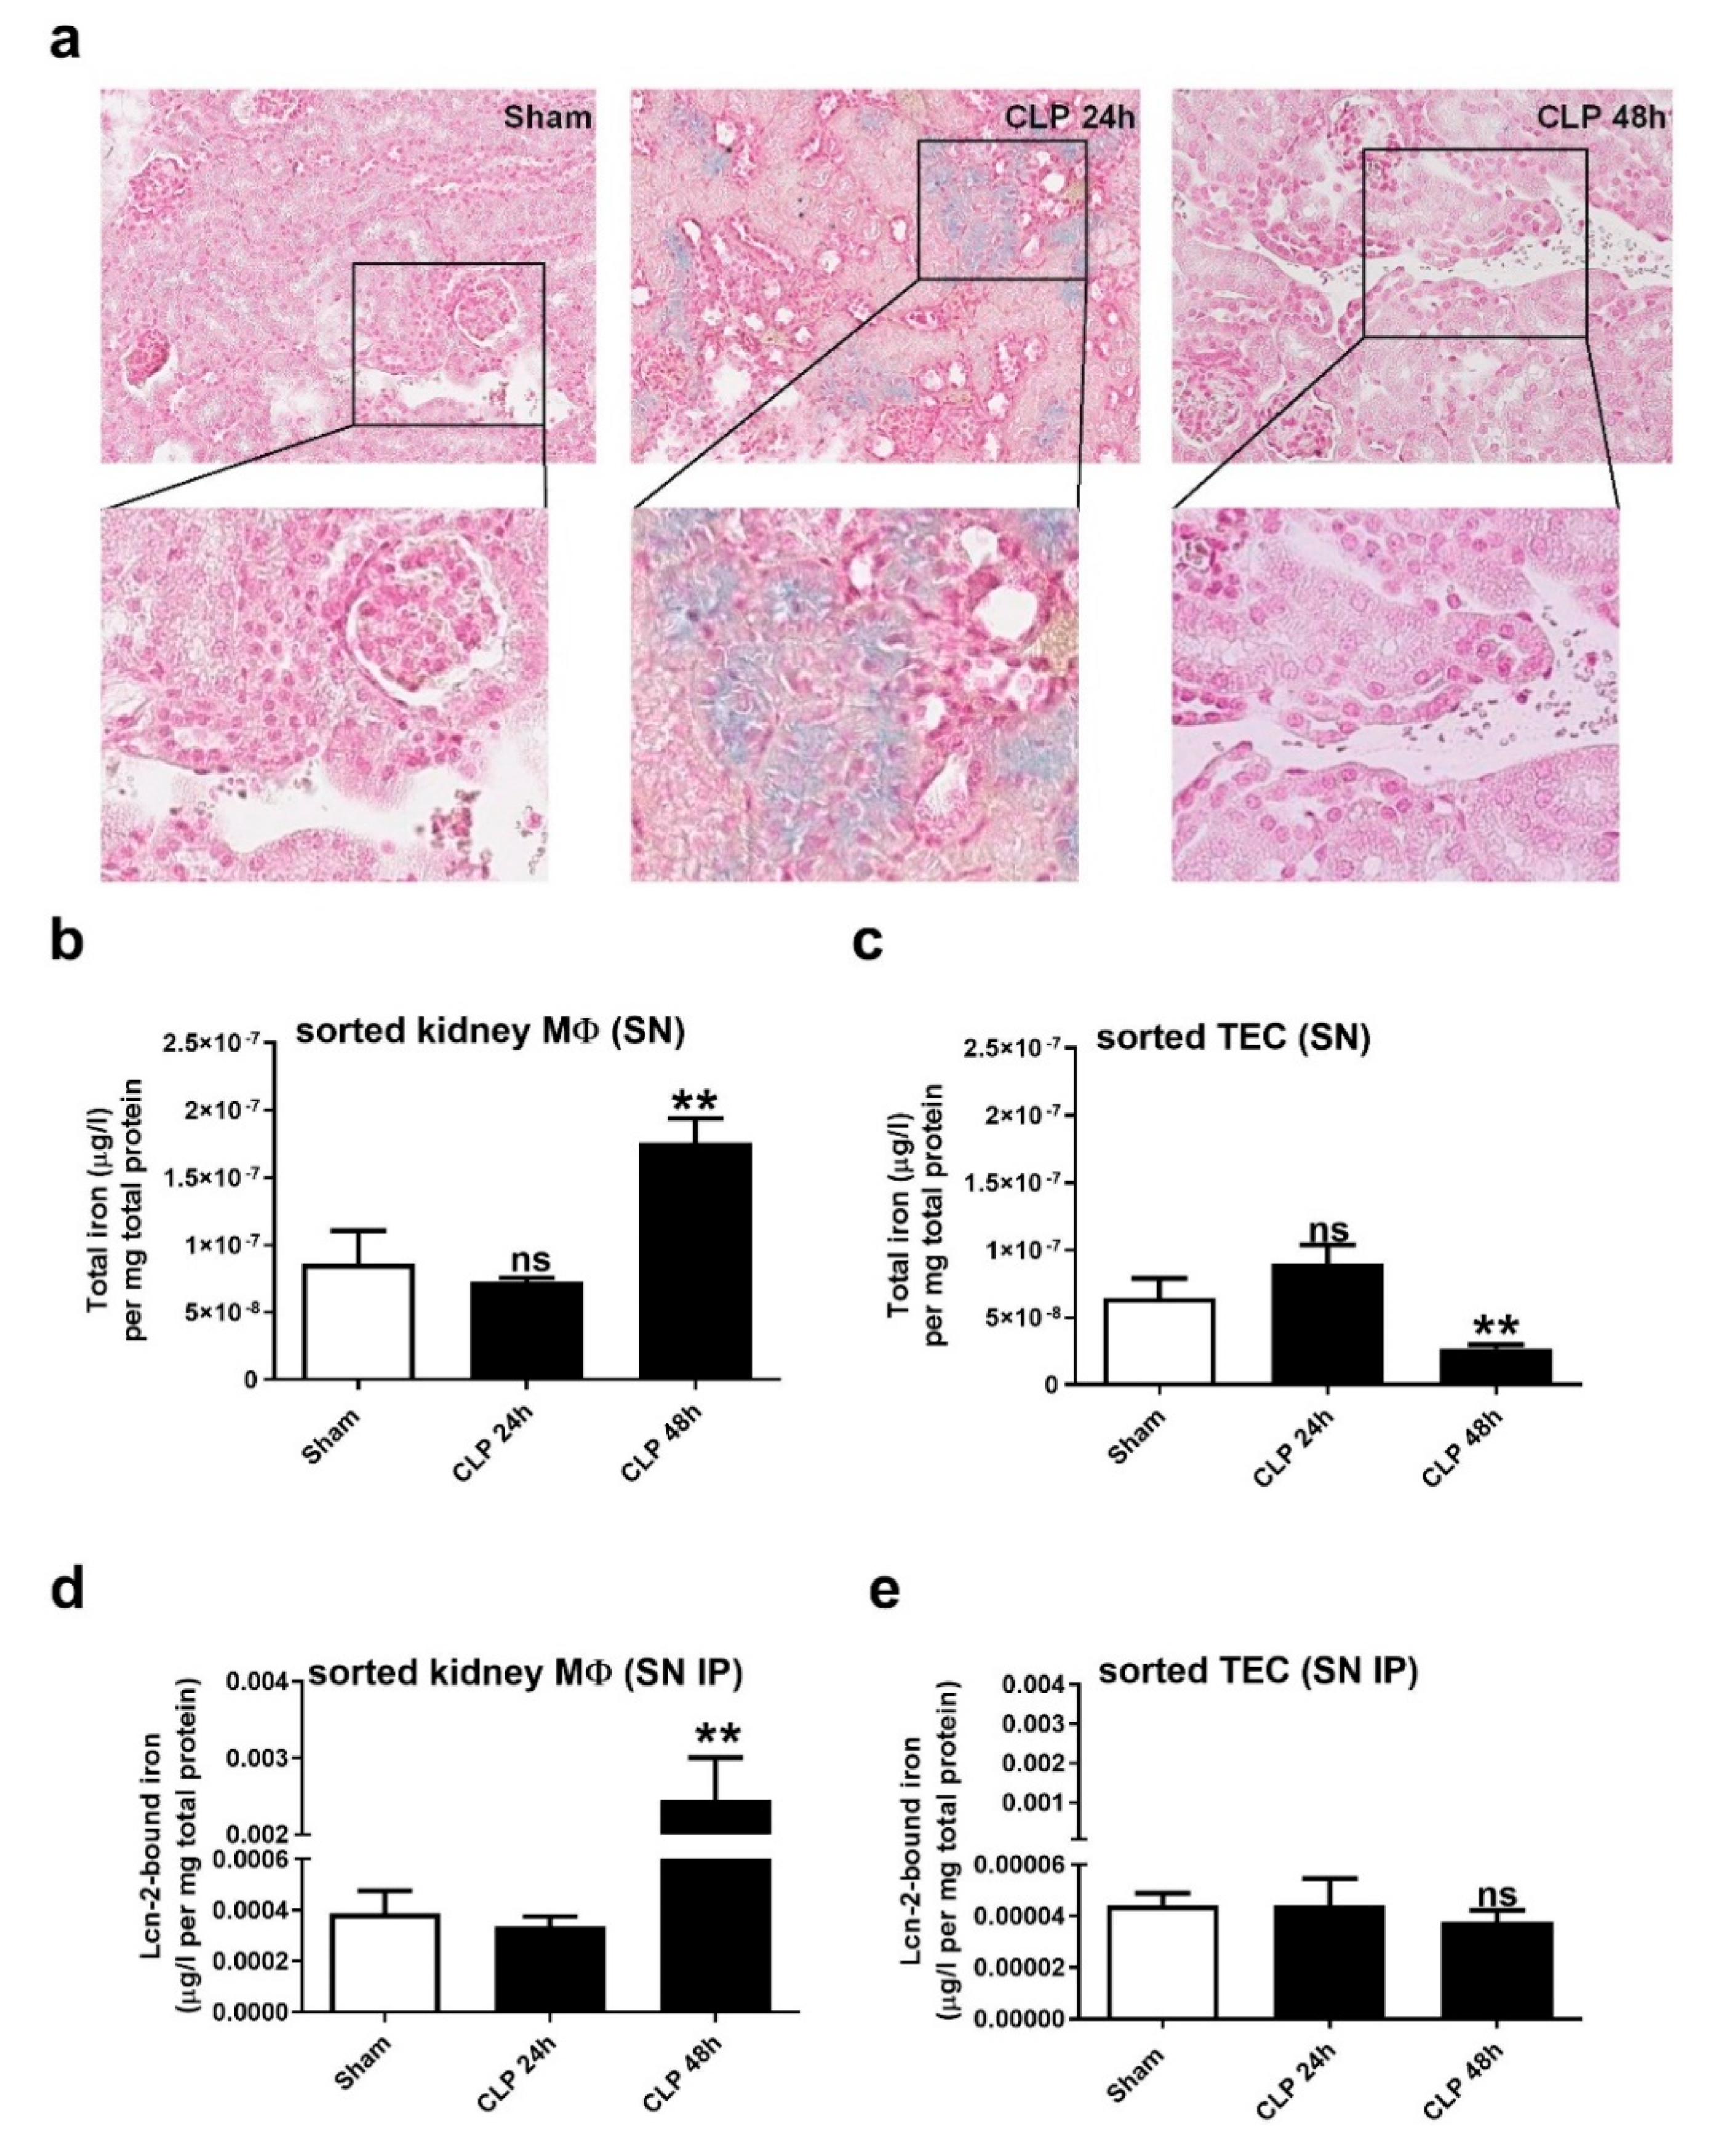
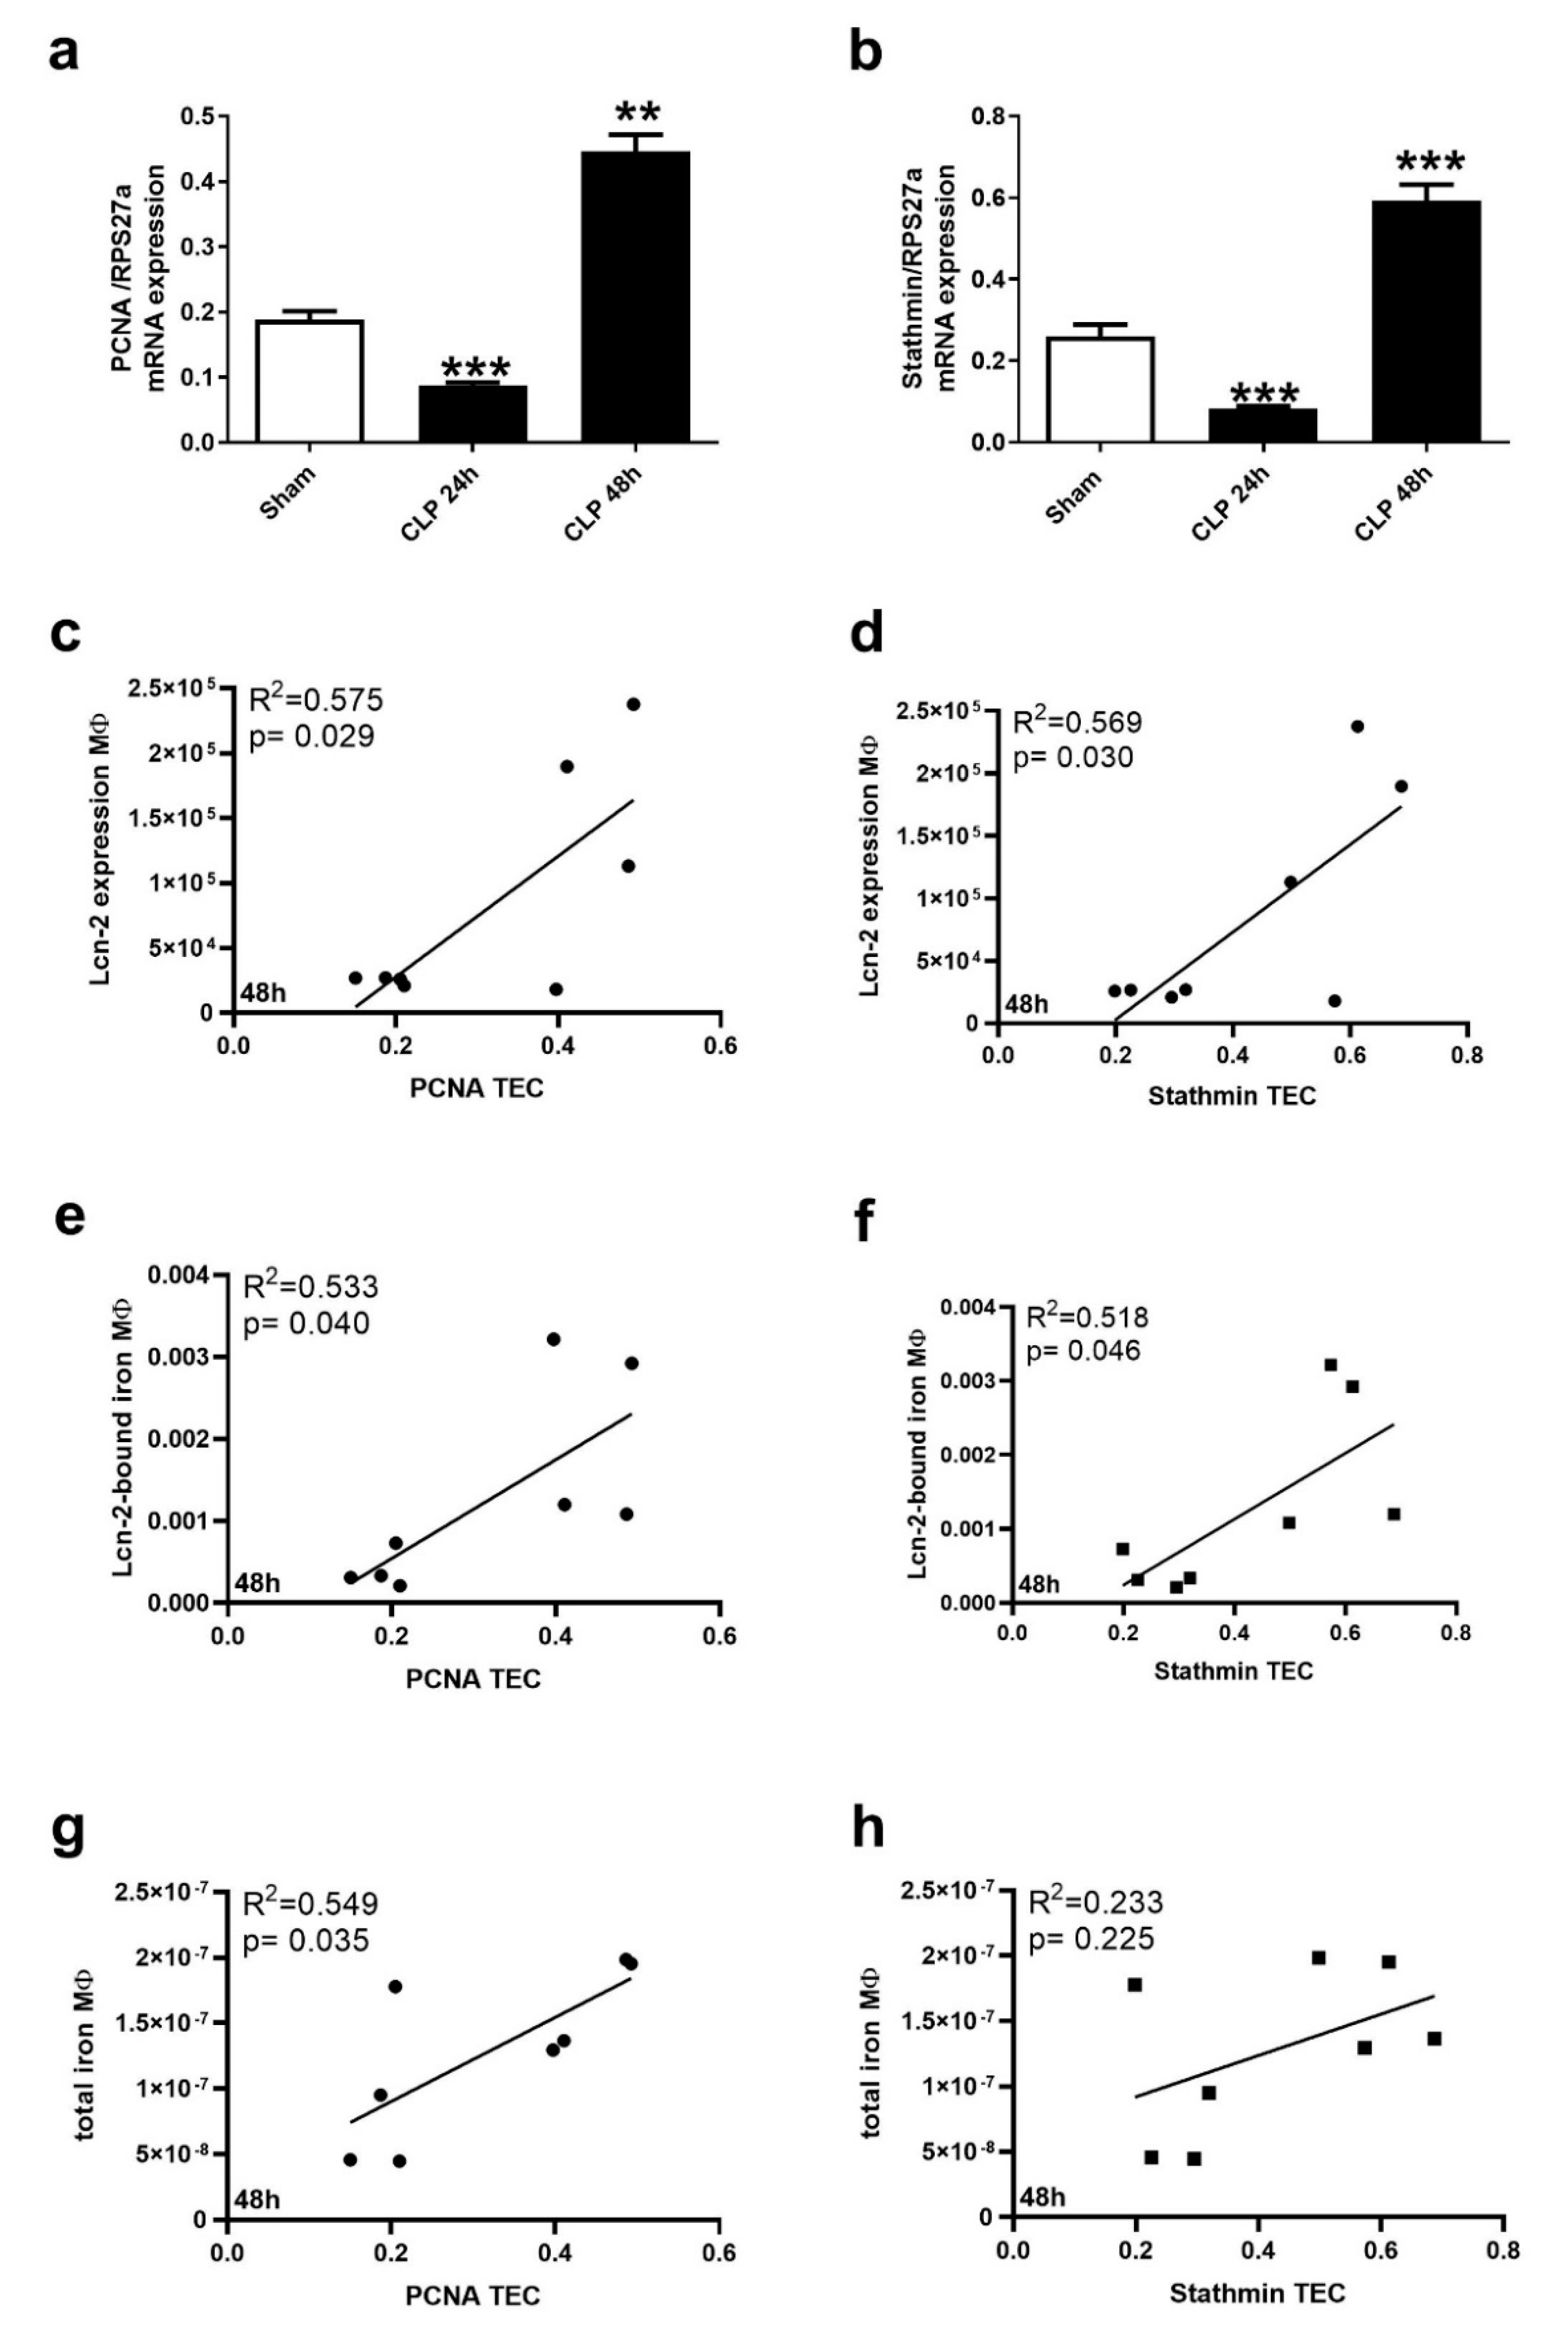
2.3. Kidney MΦ Secret Lcn-2-Bound Iron That Correlates with Renal Recovery Markers at 48 h after CLP
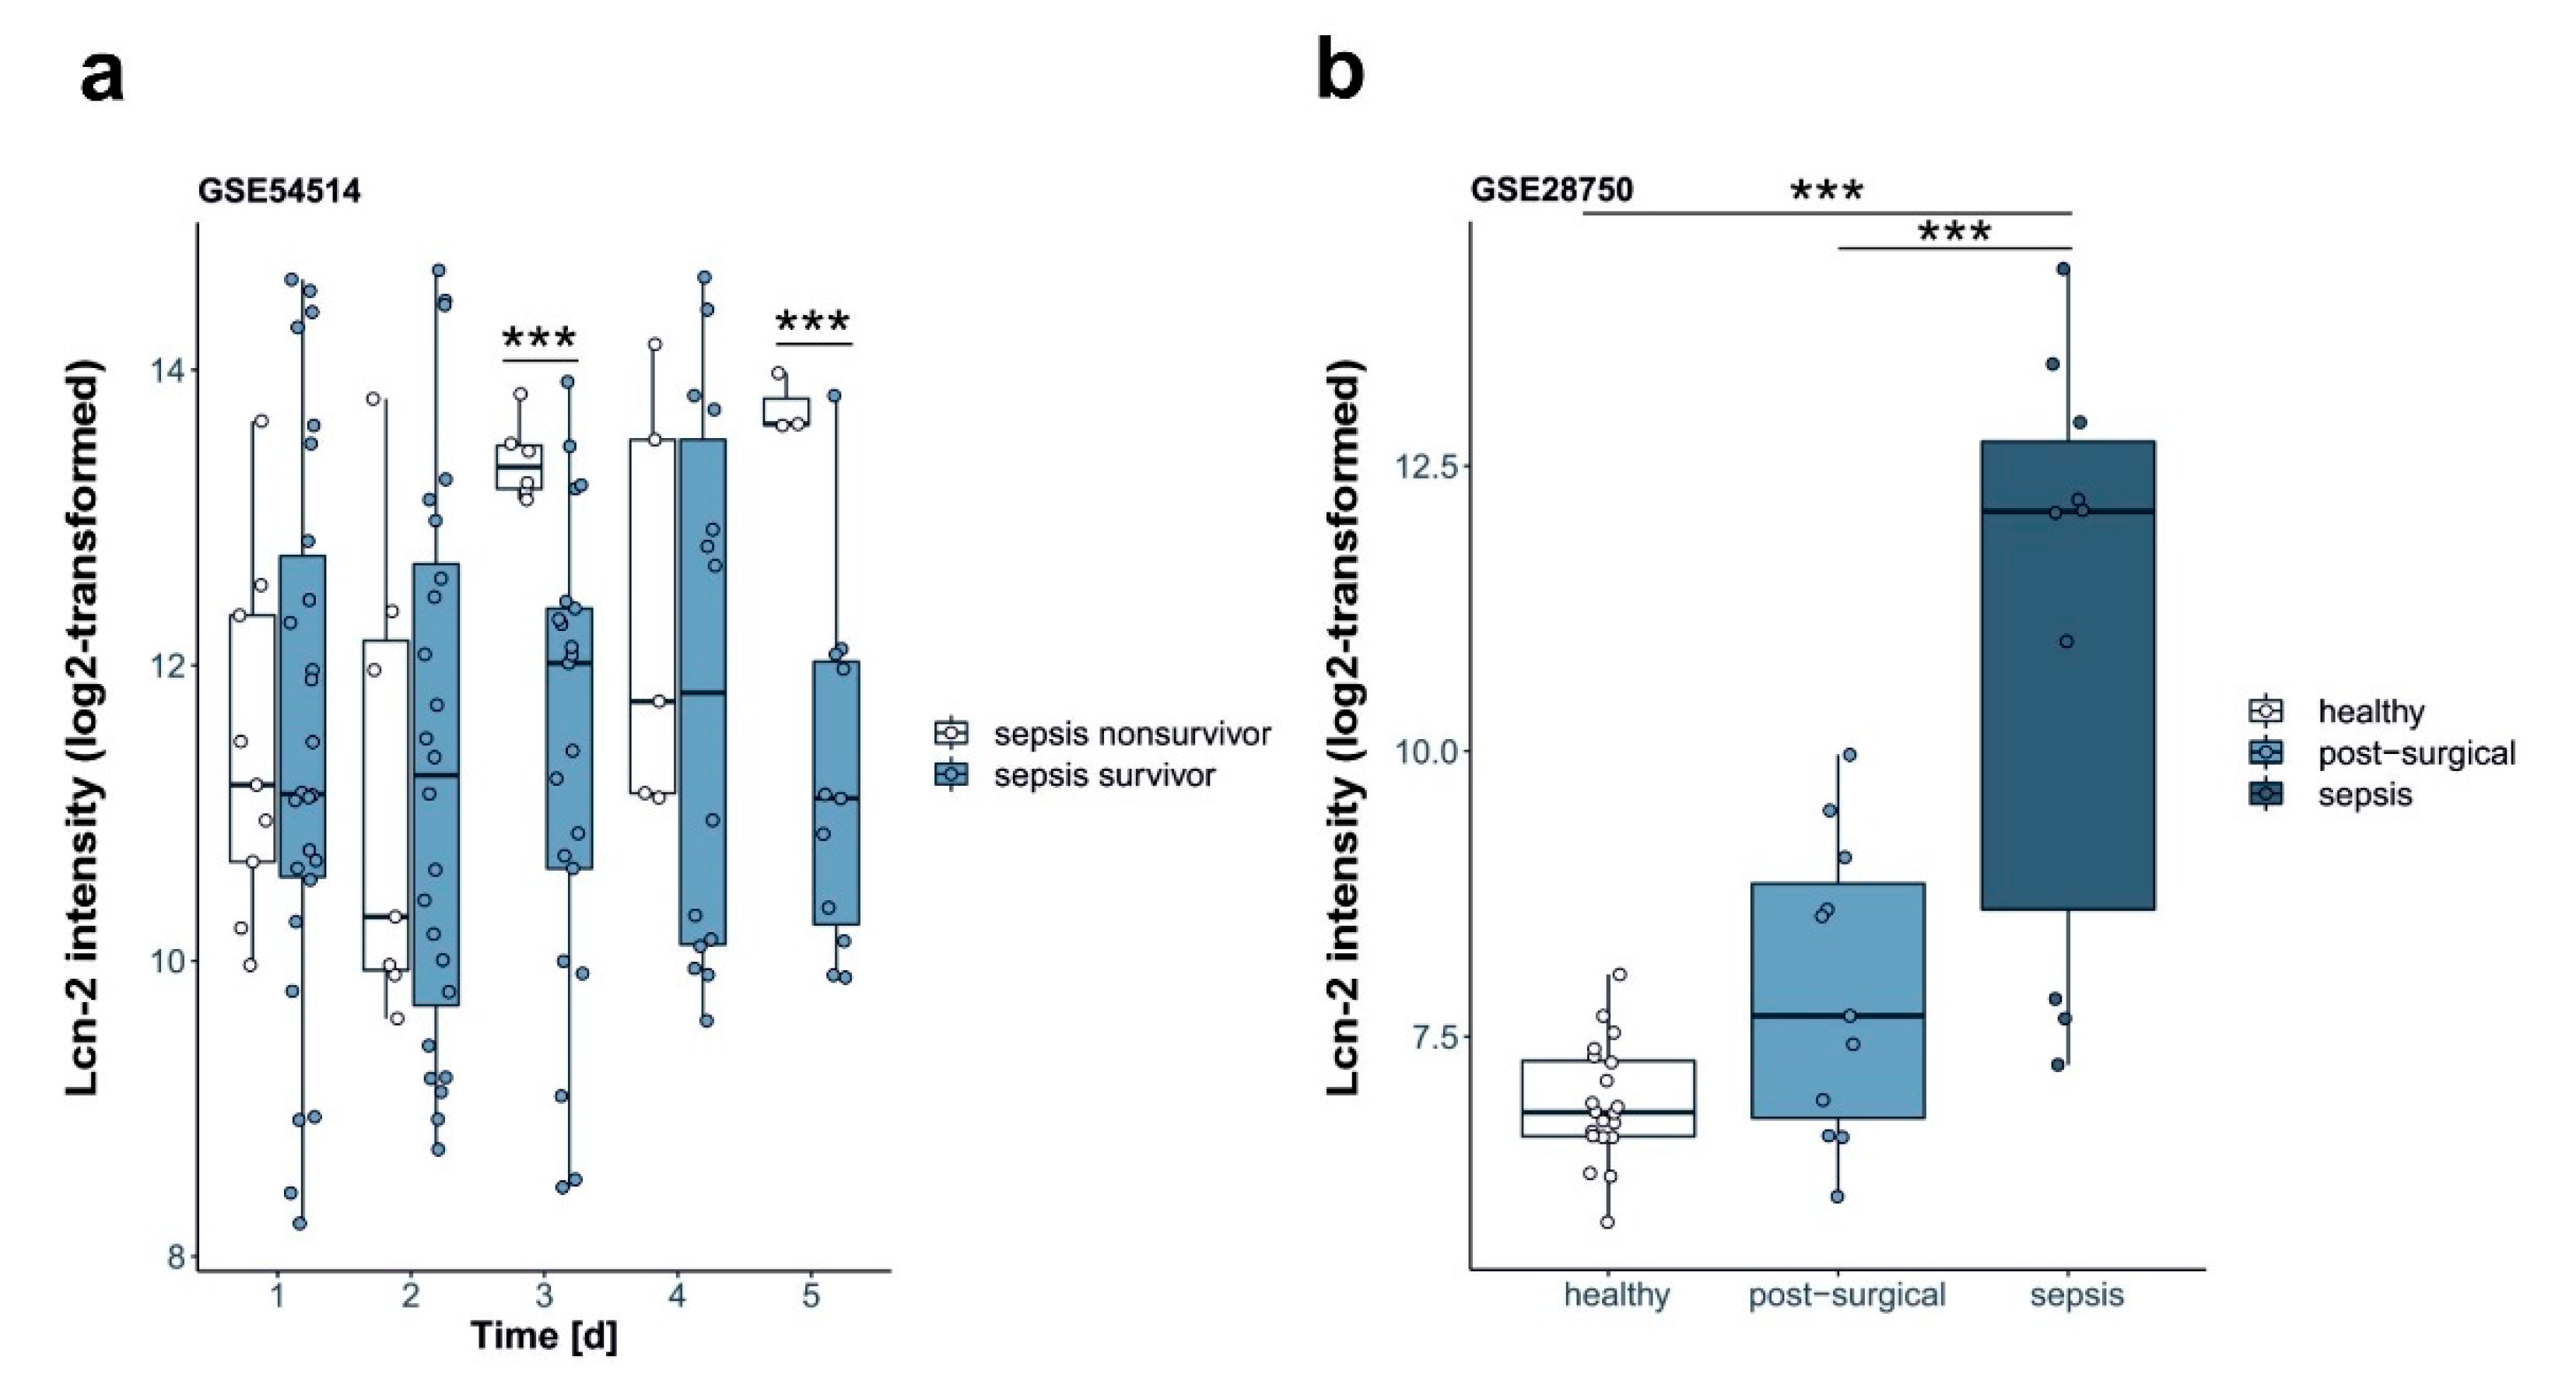
2.4. Lcn-2 Expression in Patients
3. Discussion
4. Materials and Methods
4.1. Animals
4.2. Sepsis Model—Cecal Ligation and Puncture Model
4.3. PAS Stain
4.4. Cytometric Bead Array (CBA)
4.5. FACS Sorting
4.6. Perls’ Staining
4.7. Lcn-2 Immunoprecipitation
4.8. Atomic Absorption Spectrometry
4.9. Quantitative Real-Time PCR (qRT-PCR)
4.10. Lcn-2 ELISA
4.11. GSE Files
4.12. Statistical Analyses
Supplementary Materials
Author Contributions
Funding
Acknowledgments
Conflicts of Interest
Abbreviations
| AAS | atomic absorption spectrometry |
| AKI | acute kidney injury |
| BUN | blood urea nitrogen |
| CLP | cecal ligation and puncture |
| ICU | intensive care unit |
| Lcn-2 | lipocalin-2 |
| TEC | tubular epithelial cells |
| MΦ | macrophages |
| PCNA | proliferating nuclear cell antigen |
| SrCrea | serum creatinine |
| TEC | tubular epithelial cells |
| wt | wildtype |
References
- Palevsky, P.M.; Zhang, J.H.; O’Connor, T.Z.; Chertow, G.M.; Crowley, S.T.; Choudhury, D.; Finkel, K.; Kellum, J.A.; Paganini, E.; Schein, R.M.; et al. Intensity of renal support in critically ill patients with acute kidney injury. N. Engl. J. Med. 2008, 359, 7–20. [Google Scholar] [PubMed]
- Uchino, S.; Kellum, J.A.; Bellomo, R.; Doig, G.S.; Morimatsu, H.; Morgera, S.; Schetz, M.; Tan, I.; Bouman, C.; Macedo, E.; et al. Acute renal failure in critically ill patients: A multinational, multicenter study. JAMA 2005, 294, 813–818. [Google Scholar] [CrossRef] [PubMed] [Green Version]
- Kellum, J.A.; Chawla, L.S.; Keener, C.; Singbartl, K.; Palevsky, P.M.; Pike, F.L.; Yealy, D.M.; Huang, D.T.; Angus, D.C. The effects of alternative resuscitation strategies on acute kidney injury in patients with septic shock. Am. J. Respir. Crit. Care Med. 2016, 193, 281–287. [Google Scholar] [CrossRef] [PubMed] [Green Version]
- Shapiro, N.I.; Trzeciak, S.; Hollander, J.E.; Birkhahn, R.; Otero, R.; Osborn, T.M.; Moretti, E.; Nguyen, H.B.; Gunnerson, K.J.; Milzman, D.; et al. A prospective, multicenter derivation of a biomarker panel to assess risk of organ dysfunction, shock, and death in emergency department patients with suspected sepsis. Crit. Care Med. 2009, 37, 96–104. [Google Scholar] [CrossRef] [PubMed]
- Flower, D.R. The lipocalin protein family: A role in cell regulation. FEBS Lett. 1994, 354, 7–11. [Google Scholar] [CrossRef] [Green Version]
- Mishra, J.; Ma, Q.; Prada, A.; Mitsnefes, M.; Zahedi, K.; Yang, J.; Barasch, J.; Devarajan, P. Identification of neutrophil gelatinase-associated lipocalin as a novel early urinary biomarker for ischemic renal injury. J. Am. Soc. Nephrol. 2003, 14, 2534–2543. [Google Scholar] [CrossRef] [Green Version]
- Mishra, J.; Mori, K.; Ma, Q.; Kelly, C.; Barasch, J.; Devarajan, P. Neutrophil gelatinase-associated lipocalin: A novel early urinary biomarker for cisplatin nephrotoxicity. Am. J. Nephrol. 2004, 24, 307–315. [Google Scholar] [CrossRef]
- Jung, M.; Brüne, B.; Hotter, G.; Sola, A. Macrophage-derived Lipocalin-2 contributes to ischemic resistance mechanisms by protecting from renal injury. Sci. Rep. 2016, 6, 21950. [Google Scholar] [CrossRef]
- Jung, M.; Sola, A.; Hughes, J.; Kluth, D.C.; Vinuesa, E.; Viñas, J.L.; Pérez-Ladaga, A.; Hotter, G. Infusion of IL-10-expressing cells protects against renal ischemia through induction of lipocalin-2. Kidney Int. 2012, 81, 969–982. [Google Scholar] [CrossRef]
- Vinuesa, E.; Sola, A.; Jung, M.; Alfaro, V.; Hotter, G. Lipocalin-2-induced renal regeneration depends on cytokines. Am. J. Physiol. Ren. Physiol. 2008, 295, F1554–F1562. [Google Scholar] [CrossRef] [Green Version]
- Urbschat, A.; Thiemens, A.-K.; Mertens, C.; Rehwald, C.; Meier, J.K.; Baer, P.C.; Jung, M. Macrophage-secreted Lipocalin-2 Promotes Regeneration of Injured Primary Murine Renal Tubular Epithelial Cells. Int. J. Mol. Sci. 2020, 21, 2038. [Google Scholar] [CrossRef] [Green Version]
- Mishra, J.; Mori, K.; Ma, Q.; Kelly, C.; Yang, J.; Mitsnefes, M.; Barasch, J.; Devarajan, P. Amelioration of ischemic acute renal injury by neutrophil gelatinase-associated lipocalin. J. Am. Soc. Nephrol. 2004, 15, 3073–3082. [Google Scholar] [CrossRef] [PubMed]
- Mori, K.; Lee, H.T.; Rapoport, D.; Drexler, I.R.; Foster, K.; Yang, J.; Schmidt-Ott, K.M.; Chen, X.; Li, J.Y.; Weiss, S.; et al. Endocytic delivery of lipocalin-siderophore-iron complex rescues the kidney from ischemia-reperfusion injury. J. Clin. Investig. 2005, 115, 610–621. [Google Scholar] [CrossRef]
- Paller, M.S.; Hedlund, B.E. Role of iron in postischemic renal injury in the rat. Kidney Int. 1988, 34, 474–480. [Google Scholar] [CrossRef] [PubMed] [Green Version]
- Paller, M.S.; Hedlund, B.E. Extracellular iron chelators protect kidney cells from hypoxia/reoxygenation. Free Radic. Biol. Med. 1994, 17, 597–603. [Google Scholar] [CrossRef]
- Bosmann, M.; Ward, P.A. The inflammatory response in sepsis. Trends Immunol. 2013, 34, 129–136. [Google Scholar] [CrossRef] [PubMed]
- Vinuesa, E.; Hotter, G.; Jung, M.; Herrero-Fresneda, I.; Torras, J.; Sola, A. Macrophage involvement in the kidney repair phase after ischaemia/reperfusion injury. J. Pathol. 2008, 214, 104–113. [Google Scholar] [CrossRef] [PubMed]
- Meng, X.M.; Tang, P.M.; Li, J.; Lan, H.Y. Macrophage Phenotype in Kidney Injury and Repair. Kidney Dis. 2015, 1, 138–146. [Google Scholar] [CrossRef]
- Jung, M.; Ören, B.; Mora, J.; Mertens, C.; Dziumbla, S.; Popp, R.; Weigert, A.; Grossmann, N.; Fleming, I.; Brüne, B. Lipocalin 2 from macrophages stimulated by tumor cell-derived sphingosine 1-phosphate promotes lymphangiogenesis and tumor metastasis. Sci. Signal. 2016, 9, ra64. [Google Scholar] [CrossRef]
- Ören, B.; Urosevic, J.; Mertens, C.; Mora, J.; Guiu, M.; Gomis, R.R.; Weigert, A.; Schmid, T.; Grein, S.; Brüne, B.; et al. Tumour stroma-derived lipocalin-2 promotes breast cancer metastasis. J. Pathol. 2016, 239, 274–285. [Google Scholar] [CrossRef] [Green Version]
- Sola, A.; Weigert, A.; Jung, M.; Vinuesa, E.; Brecht, K.; Weis, N.; Brüne, B.; Borregaard, N.; Hotter, G. Sphingosine-1-phosphate signalling induces the production of Lcn-2 by macrophages to promote kidney regeneration. J. Pathol. 2011, 225, 597–608. [Google Scholar] [CrossRef] [PubMed]
- Parnell, G.P.; Tang, B.M.; Nalos, M.; Armstrong, N.J.; Huang, S.J.; Booth, D.R.; McLean, A.S. Identifying key regulatory genes in the whole blood of septic patients to monitor underlying immune dysfunctions. Shock 2013, 40, 166–174. [Google Scholar] [CrossRef] [PubMed]
- Sutherland, A.; Thomas, M.; Brandon, R.A.; Brandon, R.B.; Lipman, J.; Tang, B.; McLean, A.; Pascoe, R.; Price, G.; Nguyen, T.; et al. Development and validation of a novel molecular biomarker diagnostic test for the early detection of sepsis. Crit. Care 2011, 15, R149. [Google Scholar] [CrossRef] [Green Version]
- Viau, A.; El Karoui, K.; Laouari, D.; Burtin, M.; Nguyen, C.; Mori, K.; Pillebout, E.; Berger, T.; Mak, T.W.; Knebelmann, B.; et al. Lipocalin 2 is essential for chronic kidney disease progression in mice and humans. J. Clin. Investig. 2010, 120, 4065–4076. [Google Scholar] [CrossRef] [PubMed] [Green Version]
- Schmidt-Ott, K.M.; Mori, K.; Li, J.Y.; Kalandadze, A.; Cohen, D.J.; Devarajan, P.; Barasch, J. Dual action of neutrophil gelatinase-associated lipocalin. J. Am. Soc. Nephrol. 2007, 18, 407–413. [Google Scholar] [CrossRef] [PubMed]
- Barasch, J.; Hollmen, M.; Deng, R.; Hod, E.A.; Rupert, P.B.; Abergel, R.J.; Allred, B.E.; Xu, K.; Darrah, S.F.; Tekabe, Y.; et al. Disposal of iron by a mutant form of lipocalin 2. Nat. Commun. 2016, 7, 12973. [Google Scholar] [CrossRef] [PubMed]
- Haase, M.; Devarajan, P.; Haase-Fielitz, A.; Bellomo, R.; Cruz, D.N.; Wagener, G.; Krawczeski, C.D.; Koyner, J.L.; Murray, P.; Zappitelli, M.; et al. The outcome of neutrophil gelatinase-associated lipocalin-positive subclinical acute kidney injury: A multicenter pooled analysis of prospective studies. J. Am. Coll. Cardiol. 2011, 57, 1752–1761. [Google Scholar] [CrossRef] [Green Version]
- Hjortrup, P.B.; Haase, N.; Wetterslev, M.; Perner, A. Clinical review: Predictive value of neutrophil gelatinase-associated lipocalin for acute kidney injury in intensive care patients. Crit. Care 2013, 17, 211. [Google Scholar] [CrossRef]
- Kümpers, P.; Hafer, C.; Lukasz, A.; Lichtinghagen, R.; Brand, K.; Fliser, D.; Faulhaber-Walter, R.; Kielstein, J.T. Serum neutrophil gelatinase-associated lipocalin at inception of renal replacement therapy predicts survival in critically ill patients with acute kidney injury. Crit. Care 2010, 14, R9. [Google Scholar] [CrossRef] [Green Version]
- Siew, E.D.; Ware, L.B.; Gebretsadik, T.; Shintani, A.; Moons, K.G.M.; Wickersham, N.; Bossert, F.; Ikizler, T.A. Urine neutrophil gelatinase-associated lipocalin moderately predicts acute kidney injury in critically ill adults. J. Am. Soc. Nephrol. 2009, 20, 1823–1832. [Google Scholar] [CrossRef]
- Lu, F.; Inoue, K.; Kato, J.; Minamishima, S.; Morisaki, H. Functions and regulation of lipocalin-2 in gut-origin sepsis: A narrative review. Crit. Care 2019, 23, 269. [Google Scholar] [CrossRef] [PubMed] [Green Version]
- Asimakopoulou, A.; Weiskirchen, S.; Weiskirchen, R. Lipocalin 2 (LCN2) Expression in Hepatic Malfunction and Therapy. Front. Physiol. 2016, 7, 430. [Google Scholar] [CrossRef] [PubMed] [Green Version]
- Eller, K.; Schroll, A.; Banas, M.; Kirsch, A.H.; Huber, J.M.; Nairz, M.; Skvortsov, S.; Weiss, G.; Rosenkranz, A.R.; Theurl, I. Lipocalin-2 expressed in innate immune cells is an endogenous inhibitor of inflammation in murine nephrotoxic serum nephritis. PLoS ONE 2013, 8, e67693. [Google Scholar] [CrossRef] [PubMed] [Green Version]
- Saha, P.; Chassaing, B.; Yeoh, B.S.; Viennois, E.; Xiao, X.; Kennett, M.J.; Singh, V.; Vijay-Kumar, M. Ectopic expression of innate immune protein, Lipocalin-2, in lactococcus lactis protects against gut and environmental stressors. Inflamm. Bowel Dis. 2017, 23, 1120–1132. [Google Scholar] [CrossRef] [Green Version]
- Berger, T.; Togawa, A.; Duncan, G.S.; Elia, A.J.; You-Ten, A.; Wakeham, A.; Fong, H.E.H.; Cheung, C.C.; Mak, T.W. Lipocalin 2-deficient mice exhibit increased sensitivity to Escherichia coli infection but not to ischemia-reperfusion injury. Proc. Natl. Acad. Sci. USA 2006, 103, 1834–1839. [Google Scholar] [CrossRef] [Green Version]
- Liu, Z.; Petersen, R.; Devireddy, L. Impaired neutrophil function in 24p3 null mice contributes to enhanced susceptibility to bacterial infections. J. Immunol. 2013, 190, 4692–4706. [Google Scholar] [CrossRef] [Green Version]
- Golonka, R.; Yeoh, B.S.; Vijay-Kumar, M. The iron tug-of-war between bacterial siderophores and innate immunity. J. Innate Immun. 2019, 11, 249–262. [Google Scholar] [CrossRef]
- Yang, J.; Goetz, D.; Li, J.Y.; Wang, W.; Mori, K.; Setlik, D.; Du, T.; Erdjument-Bromage, H.; Tempst, P.; Strong, R.; et al. An iron delivery pathway mediated by a lipocalin. Mol. Cell 2002, 10, 1045–1056. [Google Scholar] [CrossRef]
- Miethke, M.; Marahiel, M.A. Siderophore-based iron acquisition and pathogen control. Microbiol. Mol. Biol. Rev. 2007, 71, 413–451. [Google Scholar] [CrossRef] [Green Version]
- Bao, G.; Clifton, M.; Hoette, T.M.; Mori, K.; Deng, S.-X.; Qiu, A.; Viltard, M.; Williams, D.; Paragas, N.; Leete, T.; et al. Iron traffics in circulation bound to a siderocalin (Ngal)-catechol complex. Nat. Chem. Biol. 2010, 6, 602–609. [Google Scholar] [CrossRef]
- Kanda, J.; Mori, K.; Kawabata, H.; Kuwabara, T.; Mori, K.P.; Imamaki, H.; Kasahara, M.; Yokoi, H.; Mizumoto, C.; Thoennissen, N.H.; et al. An AKI biomarker lipocalin 2 in the blood derives from the kidney in renal injury but from neutrophils in normal and infected conditions. Clin. Exp. Nephrol. 2015, 19, 99–106. [Google Scholar] [CrossRef] [Green Version]
- Smith, E.R.; Lee, D.; Cai, M.M.; Tomlinson, L.A.; Ford, M.L.; McMahon, L.P.; Holt, S.G. Urinary neutrophil gelatinase-associated lipocalin may aid prediction of renal decline in patients with non-proteinuric Stages 3 and 4 chronic kidney disease (CKD). Nephrol. Dial. Transpl. 2013, 28, 1569–1579. [Google Scholar] [CrossRef] [PubMed] [Green Version]
- Bonventre, J.V. Dedifferentiation and proliferation of surviving epithelial cells in acute renal failure. J. Am. Soc. Nephrol. 2003, 14 (Suppl. 1), S55–S61. [Google Scholar] [CrossRef] [Green Version]
- Cairo, G.; Recalcati, S.; Mantovani, A.; Locati, M. Iron trafficking and metabolism in macrophages: Contribution to the polarized phenotype. Trends Immunol. 2011, 32, 241–247. [Google Scholar] [CrossRef]
- Mertens, C.; Akam, E.A.; Rehwald, C.; Brüne, B.; Tomat, E.; Jung, M. Intracellular iron chelation modulates the macrophage iron phenotype with consequences on tumor progression. PLoS ONE 2016, 11, e0166164. [Google Scholar] [CrossRef] [Green Version]
- Recalcati, S.; Locati, M.; Marini, A.; Santambrogio, P.; Zaninotto, F.; Pizzol, M.d.; Zammataro, L.; Girelli, D.; Cairo, G. Differential regulation of iron homeostasis during human macrophage polarized activation. Eur. J. Immunol. 2010, 40, 824–835. [Google Scholar] [CrossRef] [PubMed]
- Mertens, C.; Mora, J.; Ören, B.; Grein, S.; Winslow, S.; Scholich, K.; Weigert, A.; Malmström, P.; Forsare, C.; Fernö, M.; et al. Macrophage-derived lipocalin-2 transports iron in the tumor microenvironment. Oncoimmunology 2018, 7, e1408751. [Google Scholar] [CrossRef] [PubMed] [Green Version]
- Paragas, N.; Qiu, A.; Hollmen, M.; Nickolas, T.L.; Devarajan, P.; Barasch, J. NGAL-Siderocalin in kidney disease. Biochim. Biophys. Acta 2012, 1823, 1451–1458. [Google Scholar] [CrossRef] [PubMed] [Green Version]
- Rittirsch, D.; Huber-Lang, M.S.; Flierl, M.A.; Ward, P.A. Immunodesign of experimental sepsis by cecal ligation and puncture. Nat. Protoc. 2009, 4, 31–36. [Google Scholar] [CrossRef] [Green Version]


© 2020 by the authors. Licensee MDPI, Basel, Switzerland. This article is an open access article distributed under the terms and conditions of the Creative Commons Attribution (CC BY) license (http://creativecommons.org/licenses/by/4.0/).
Share and Cite
Mertens, C.; Kuchler, L.; Sola, A.; Guiteras, R.; Grein, S.; Brüne, B.; von Knethen, A.; Jung, M. Macrophage-Derived Iron-Bound Lipocalin-2 Correlates with Renal Recovery Markers Following Sepsis-Induced Kidney Damage. Int. J. Mol. Sci. 2020, 21, 7527. https://0-doi-org.brum.beds.ac.uk/10.3390/ijms21207527
Mertens C, Kuchler L, Sola A, Guiteras R, Grein S, Brüne B, von Knethen A, Jung M. Macrophage-Derived Iron-Bound Lipocalin-2 Correlates with Renal Recovery Markers Following Sepsis-Induced Kidney Damage. International Journal of Molecular Sciences. 2020; 21(20):7527. https://0-doi-org.brum.beds.ac.uk/10.3390/ijms21207527
Chicago/Turabian StyleMertens, Christina, Laura Kuchler, Anna Sola, Roser Guiteras, Stephan Grein, Bernhard Brüne, Andreas von Knethen, and Michaela Jung. 2020. "Macrophage-Derived Iron-Bound Lipocalin-2 Correlates with Renal Recovery Markers Following Sepsis-Induced Kidney Damage" International Journal of Molecular Sciences 21, no. 20: 7527. https://0-doi-org.brum.beds.ac.uk/10.3390/ijms21207527