Fluorescence-Based Nanoparticle Tracking Analysis and Flow Cytometry for Characterization of Endothelial Extracellular Vesicle Release

 and
and 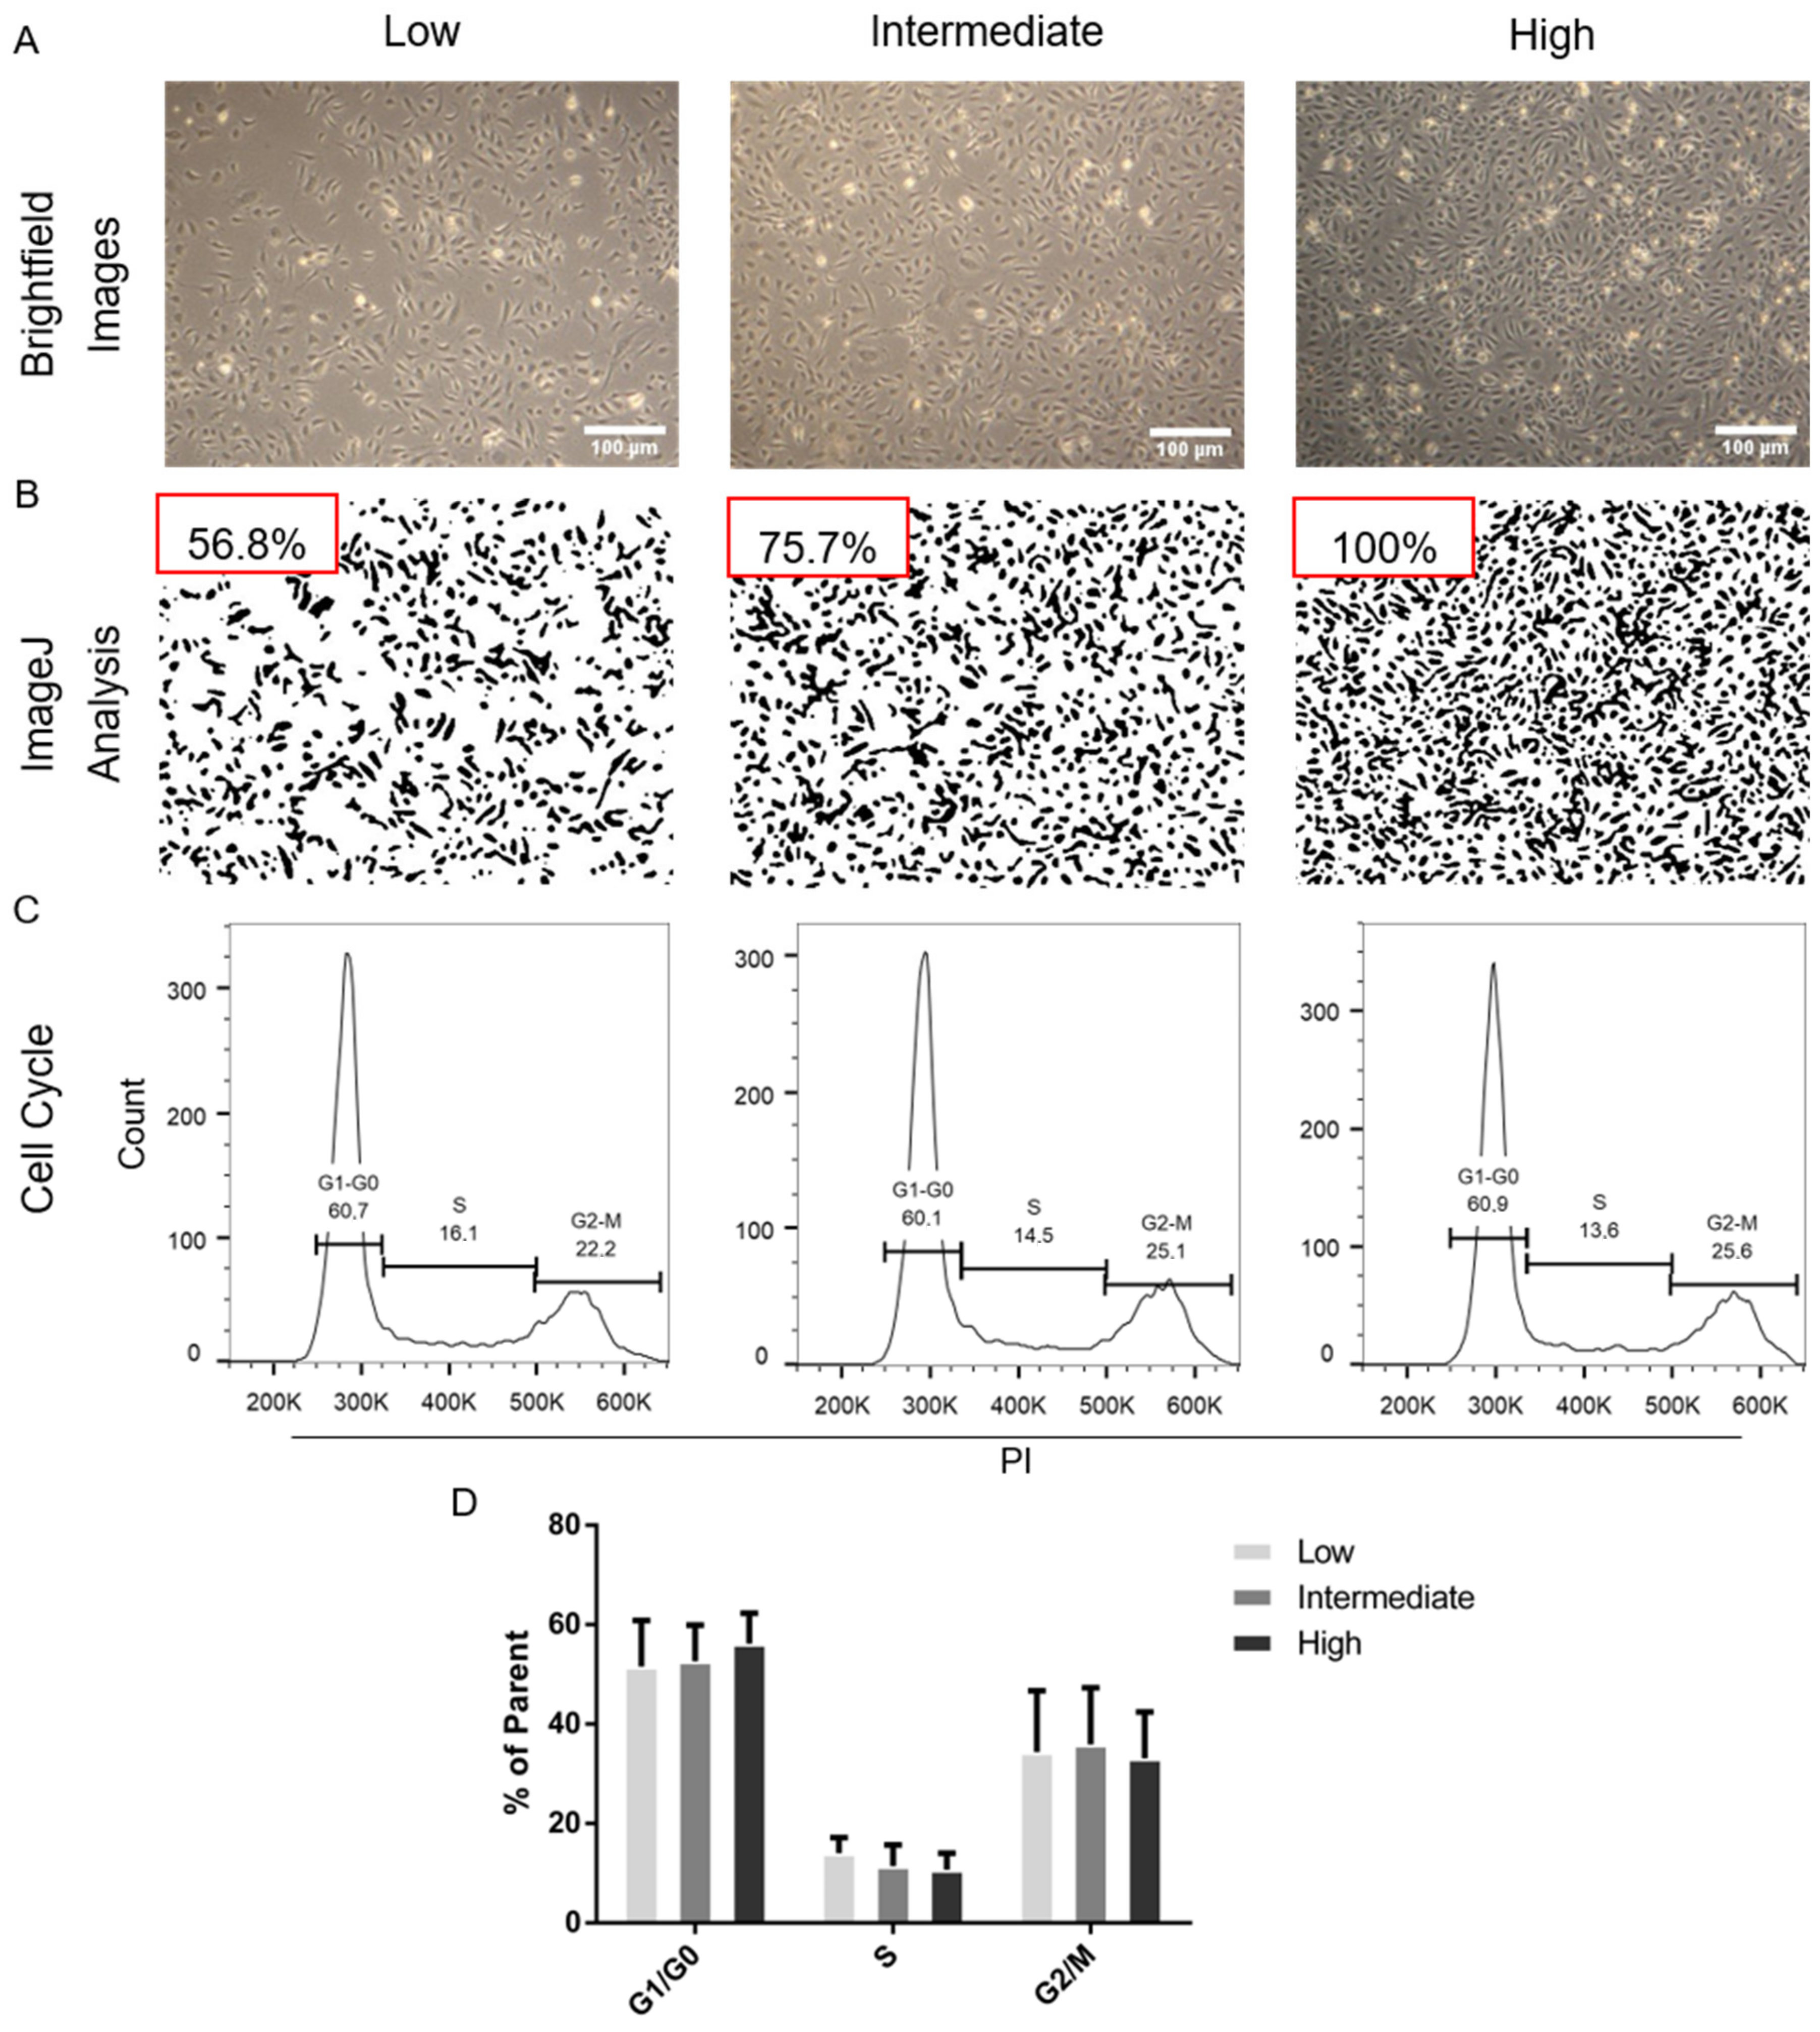
Abstract
:1. Introduction
2. Results
2.1. Estimation and Analysis of Endothelial Cell Density and Cell Cycle Distributions
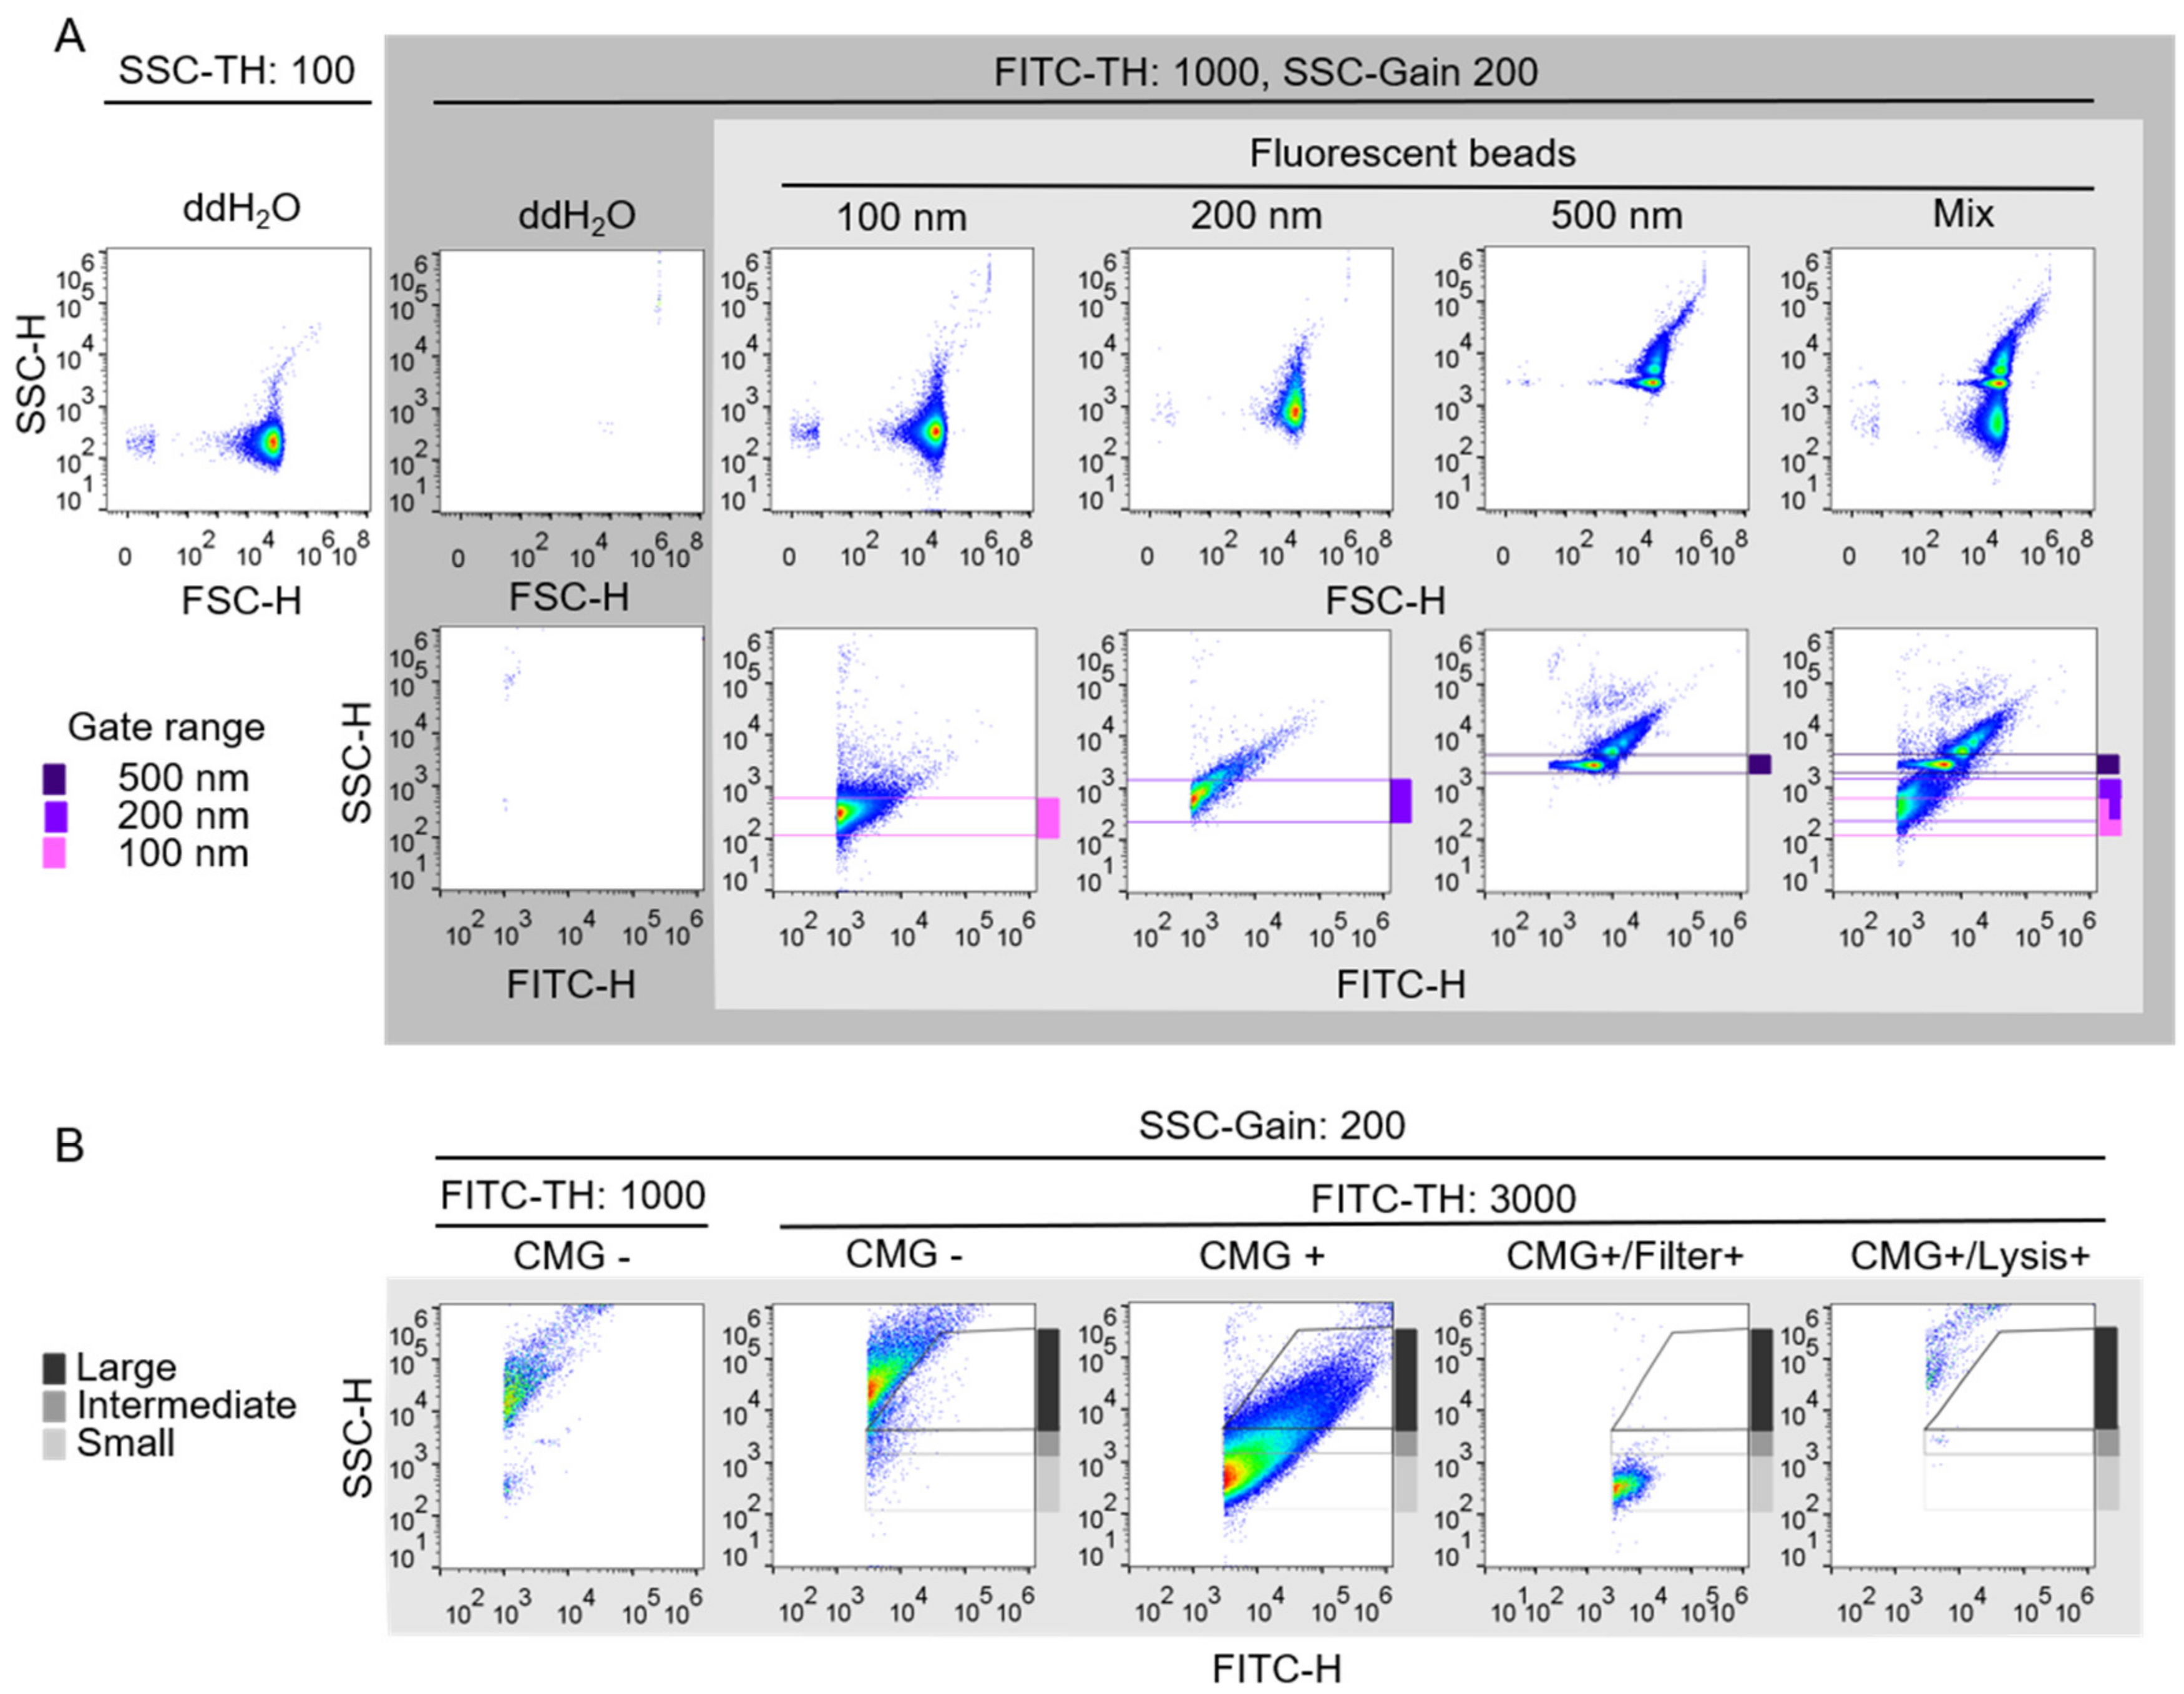
2.2. Establishment of Fluorescence-Triggered Flow Cytometry
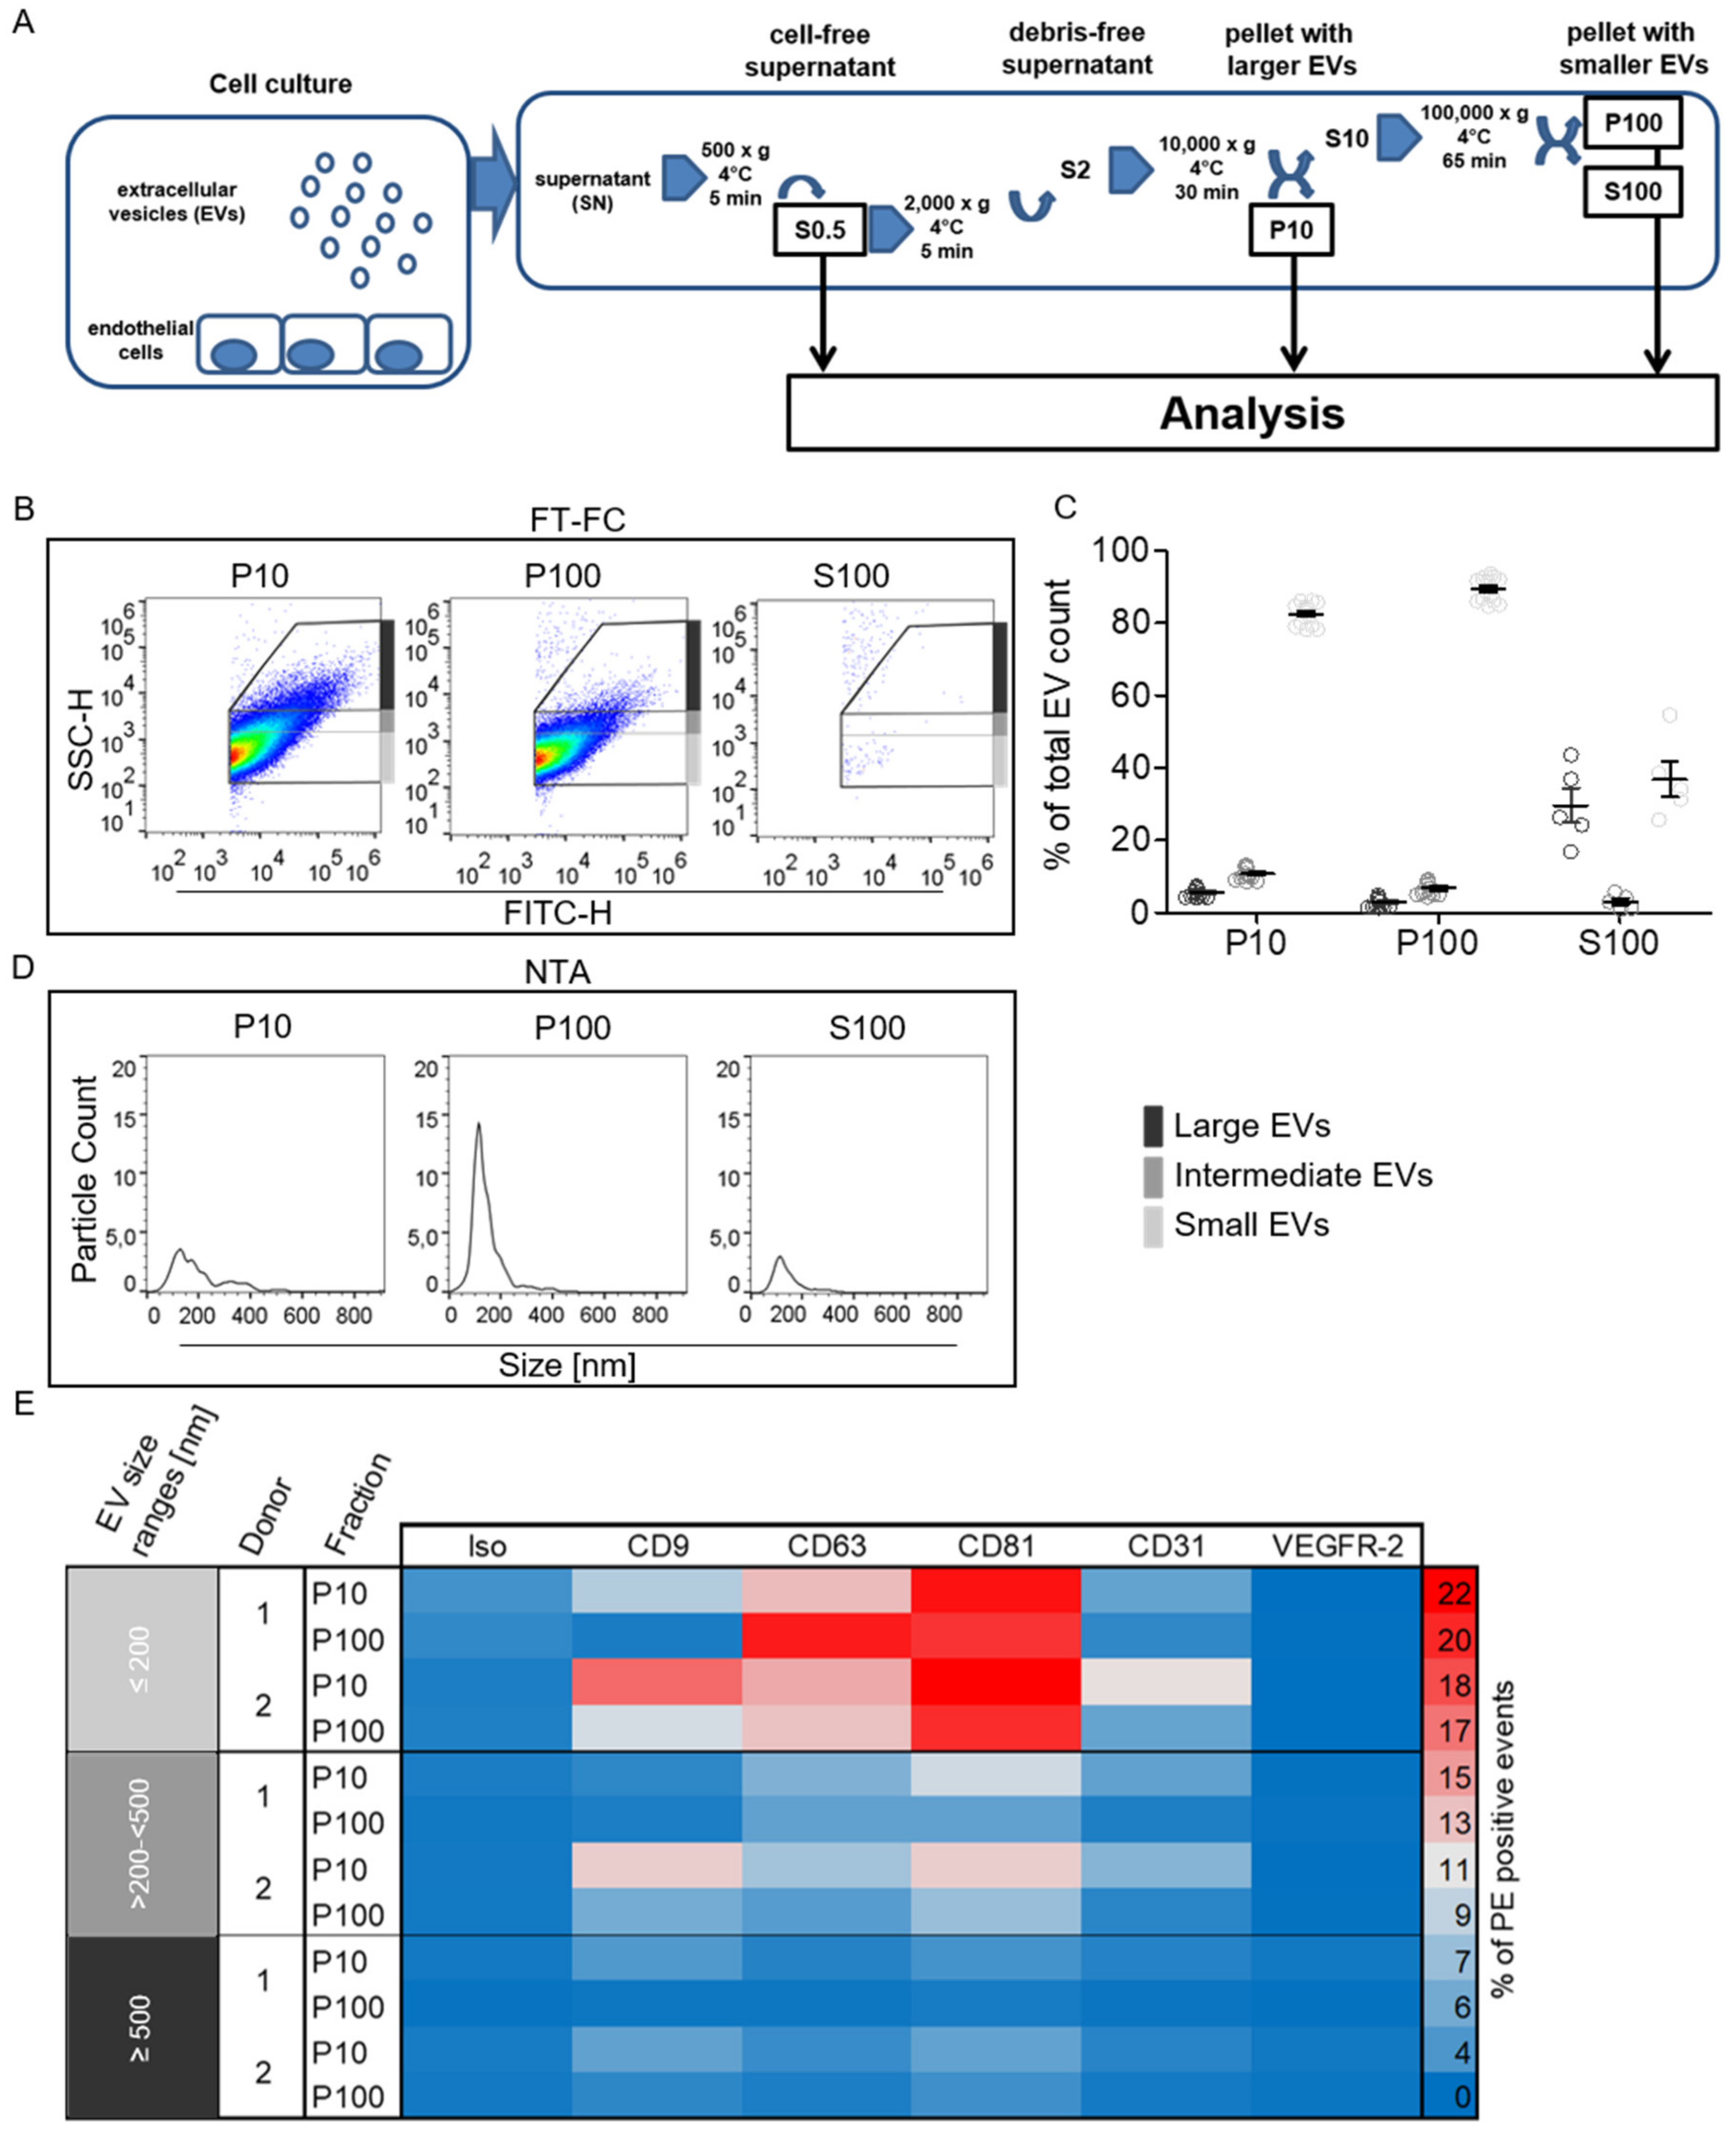
2.3. Characterization of Enriched EndoEV Fractions
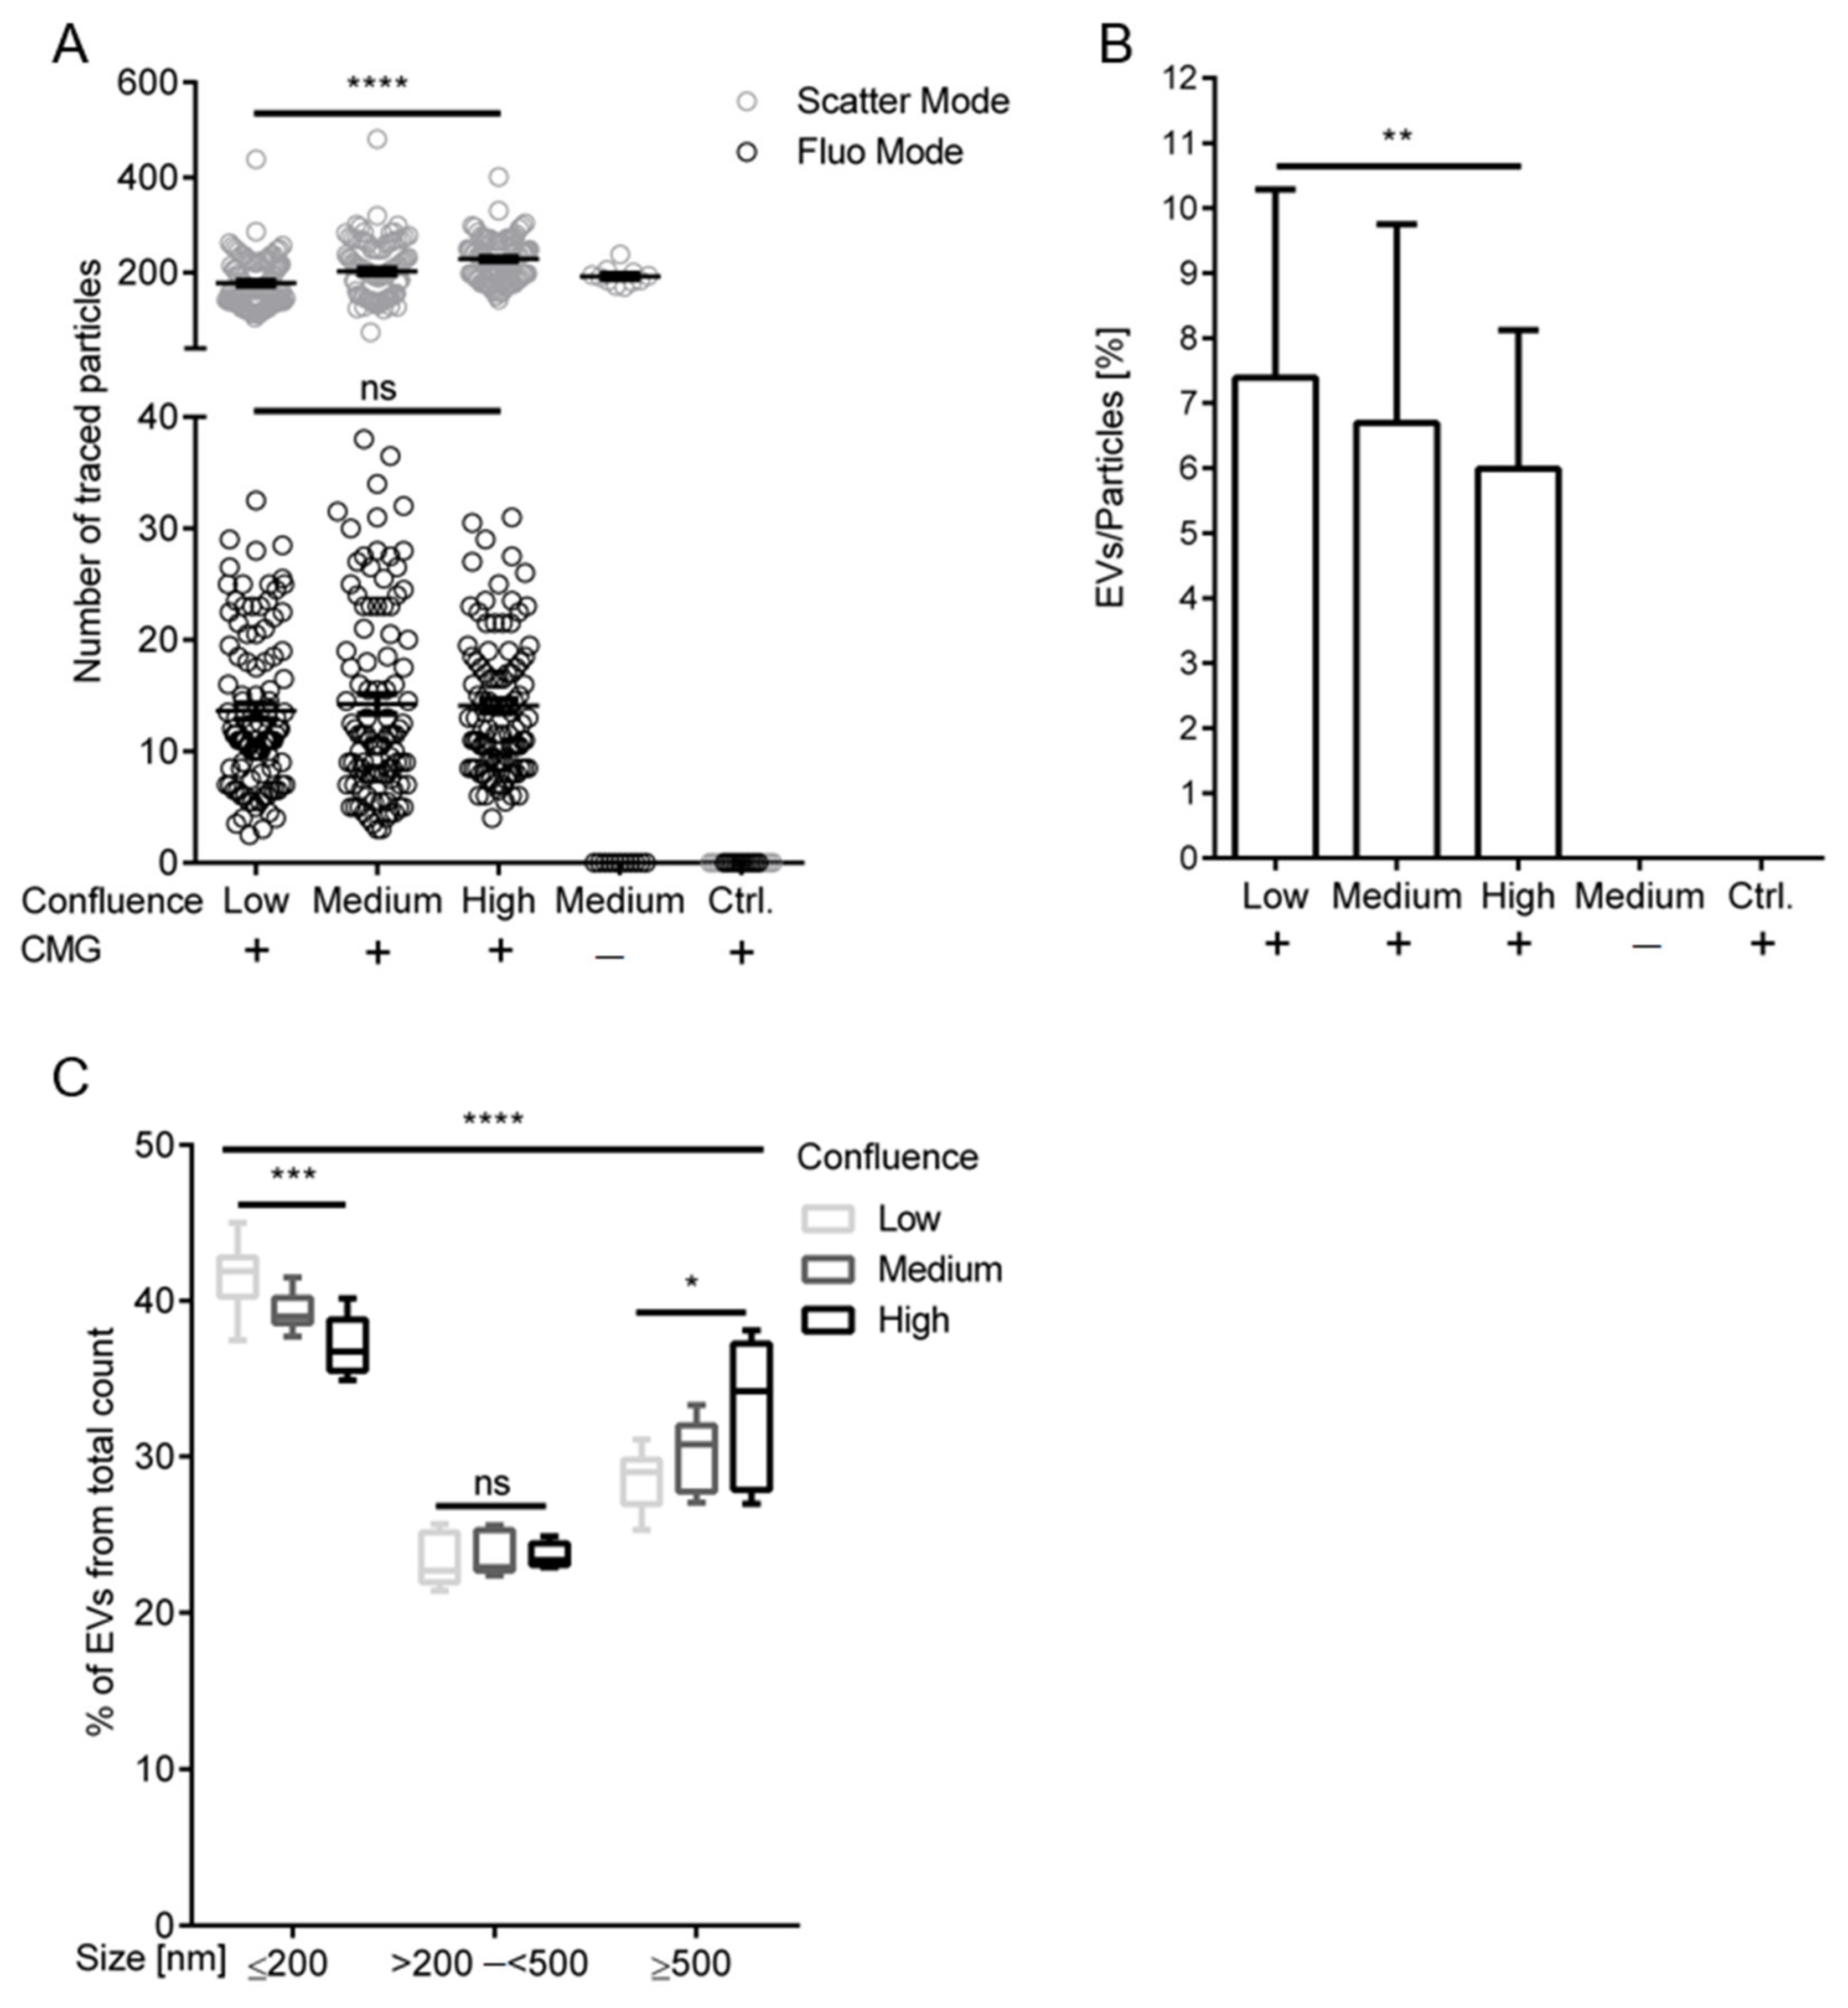
2.4. Increasing Cell Confluence Influences Release and Size Distribution of EndoEVs
2.5. Increasing Conditioning Time Influences Release and Size Distribution of EndoEVs
3. Discussion
4. Materials and Methods
4.1. Culturing and Conditioning of Cells
4.2. Assessment of Cell Confluences and Cell Cycle Profiles
4.3. Enrichment of EVs by Differential Ultracentrifugation
4.4. Nanoparticle Tracking Analysis of EndoEV Abundance in Cell Culture Supernatant
4.5. Fluorescence-Triggered Flow Cytometry Analysis of EVs
4.6. Statistical Analysis
Author Contributions
Funding
Acknowledgments
Conflicts of Interest
Abbreviations
| EV | Extracellular Vesicle |
| EndoEV | Endothelial EV |
| HUVEC | Human Umbilical Vein Endothelial Cell |
| NTA | Nano Particle Tracking Analysis |
| FT-FC | Fluorescence Trigger Flow Cytometry |
| EGM-2 | Endothelial Growth Medium |
| VEGFR-2 | Vascular Endothelial Growth Factor Receptor 2 |
| FCS | Fetal Calf Serum |
| EBM-2 | Endothelial Basal Medium |
| CMG | Cell Mask Green |
| MV | Microvesicles |
| MISEV | Minimal Information for Studies of Extracellular Vesicles 2018 |
| ISEV | International Society for Extracellular Vesicles |
| VEGFR-2 | Vascular Endothelial Growth Factor Receptor 2 |
| PI | Propidium Iodide |
| SDS | Sodium Dodecyl Sulfate |
References
- De Jong, O.G.; van Balkom, B.W.M.; Schiffelers, R.M.; Bouten, C.V.C.; Verhaar, M.C. Extracellular vesicles: Potential roles in regenerative medicine. Front. Immunol. 2014, 5, 1–13. [Google Scholar] [CrossRef] [PubMed] [Green Version]
- Tsiapalis, D.; O’Driscoll, L. Mesenchymal Stem Cell Derived Extracellular Vesicles for Tissue Engineering and Regenerative Medicine Applications. Cells 2020, 9, 991. [Google Scholar] [CrossRef] [PubMed] [Green Version]
- Zhou, Y.; Xiao, Y. The Development of Extracellular Vesicle-Integrated Biomaterials for Bone Regeneration. Adv. Exp. Med. Biol. 2020, 1250, 97–108. [Google Scholar] [CrossRef] [PubMed]
- Hromada, C.; Mühleder, S.; Grillari, J.; Redl, H.; Holnthoner, W. Endothelial Extracellular Vesicles-Promises and Challenges. Front. Physiol. 2017, 8, 275. [Google Scholar] [CrossRef]
- Li, Q.; Huang, Q.-P.; Wang, Y.-L.; Huang, Q.-S. Extracellular vesicle-mediated bone metabolism in the bone microenvironment. J. Bone Miner. Metab. 2018, 36, 1–11. [Google Scholar] [CrossRef]
- Hutcheson, J.D.; Aikawa, E. Extracellular vesicles in cardiovascular homeostasis and disease. Curr. Opin. Cardiol. 2018, 33, 290–297. [Google Scholar] [CrossRef]
- Chistiakov, D.A.; Orekhov, A.N.; Bobryshev, Y.V. Cardiac Extracellular Vesicles in Normal and Infarcted Heart. Int. J. Mol. Sci. 2016, 17, 63. [Google Scholar] [CrossRef]
- Holnthoner, W.; Bonstingl, C.; Hromada, C.; Muehleder, S.; Zipperle, J.; Stojkovic, S.; Redl, H.; Wojta, J.; Schöchl, H.; Grillari, J.; et al. Endothelial Cell-derived Extracellular Vesicles Size-dependently Exert Procoagulant Activity Detected by Thromboelastometry. Sci. Rep. 2017, 7, 3707. [Google Scholar] [CrossRef]
- Hosseinkhani, B.; Kuypers, S.; van den Akker, N.M.S.; Molin, D.G.M.; Michiels, L. Extracellular vesicles work as a functional inflammatory mediator between vascular endothelial cells and immune cells. Front. Immunol. 2018, 9, 1789. [Google Scholar] [CrossRef] [Green Version]
- Raeven, P.; Zipperle, J.; Drechsler, S. Extracellular Vesicles as Markers and Mediators in Sepsis. Theranostics 2018, 8, 3348–3365. [Google Scholar] [CrossRef]
- Sheldon, H.; Heikamp, E.; Turley, H.; Dragovic, R.; Thomas, P.; Oon, C.E.; Leek, R.; Edelmann, M.; Kessler, B.; Sainson, R.C.A.; et al. New mechanism for Notch signaling to endothelium at a distance by Delta-like 4 incorporation into exosomes. Blood 2010, 116, 2385–2394. [Google Scholar] [CrossRef] [PubMed] [Green Version]
- Lamichhane, T.N.; Leung, C.A.; Douti, L.Y.; Jay, S.M. Ethanol Induces Enhanced Vascularization Bioactivity of Endothelial Cell-Derived Extracellular Vesicles via Regulation of MicroRNAs and Long Non-Coding RNAs. Sci. Rep. 2017, 7, 13794. [Google Scholar] [CrossRef] [PubMed]
- Gai, C.; Carpanetto, A.; Deregibus, M.C.; Camussi, G. Extracellular vesicle-mediated modulation of angiogenesis. Histol. Histopathol. 2016, 31, 379–391. [Google Scholar] [CrossRef] [PubMed]
- Agrahari, V.; Agrahari, V.; Burnouf, P.-A.; Chew, C.H.; Burnouf, T. Extracellular Microvesicles as New Industrial Therapeutic Frontiers. Trends Biotechnol. 2019, 37, 707–729. [Google Scholar] [CrossRef]
- Lener, T.; Gimona, M.; Aigner, L.; Borger, V.; Buzas, E.; Camussi, G.; Chaput, N.; Chatterjee, D.; Court, F.A.; Del Portillo, H.A.; et al. Applying extracellular vesicles based therapeutics in clinical trials-an ISEV position paper. J. Extracell. Vesicles 2015, 4, 30087. [Google Scholar] [CrossRef]
- Muralidharan-Chari, V.; Clancy, J.W.; Sedgwick, A.; D’Souza-Schorey, C. Microvesicles: Mediators of extracellular communication during cancer progression. J. Cell Sci. 2010, 123, 1603–1611. [Google Scholar] [CrossRef] [Green Version]
- Vlassov, A.V.; Magdaleno, S.; Setterquist, R.; Conrad, R. Exosomes: Current knowledge of their composition, biological functions, and diagnostic and therapeutic potentials. Biochim. Biophys. Acta-Gen. Subj. 2012, 1820, 940–948. [Google Scholar] [CrossRef]
- Barile, L.; Vassalli, G. Exosomes: Therapy delivery tools and biomarkers of diseases. Pharmacol. Ther. 2017, 174, 63–78. [Google Scholar] [CrossRef] [Green Version]
- Paone, S.; Baxter, A.A.; Hulett, M.D.; Poon, I.K.H. Endothelial cell apoptosis and the role of endothelial cell-derived extracellular vesicles in the progression of atherosclerosis. Cell. Mol. Life Sci. CMLS 2019, 76, 1093–1106. [Google Scholar] [CrossRef]
- Carracedo, J.; Alique, M.; Ramírez-Carracedo, R.; Bodega, G.; Ramírez, R. Endothelial Extracellular Vesicles Produced by Senescent Cells: Pathophysiological Role in the Cardiovascular Disease Associated with all Types of Diabetes Mellitus. Curr. Vasc. Pharmacol. 2019, 17, 447–454. [Google Scholar] [CrossRef]
- Vítková, V.; Živný, J.; Janota, J. Endothelial cell-derived microvesicles: Potential mediators and biomarkers of pathologic processes. Biomark. Med. 2018, 12, 161–175. [Google Scholar] [CrossRef] [PubMed]
- Crewe, C.; Joffin, N.; Rutkowski, J.M.; Kim, M.; Zhang, F.; Towler, D.A.; Gordillo, R.; Scherer, P.E. An Endothelial-to-Adipocyte Extracellular Vesicle Axis Governed by Metabolic State. Cell 2018, 175, 695–708.e13. [Google Scholar] [CrossRef] [PubMed] [Green Version]
- Chen, C.W.; Wang, L.L.; Zaman, S.; Gordon, J.; Arisi, M.F.; Venkataraman, C.M.; Chung, J.J.; Hung, G.; Gaffey, A.C.; Spruce, L.A.; et al. Sustained release of endothelial progenitor cell-derived extracellular vesicles from shear-thinning hydrogels improves angiogenesis and promotes function after myocardial infarction. Cardiovasc. Res. 2018, 114, 1029–1040. [Google Scholar] [CrossRef] [PubMed] [Green Version]
- Patel, D.B.; Gray, K.M.; Santharam, Y.; Lamichhane, T.N.; Stroka, K.M.; Jay, S.M. Impact of cell culture parameters on production and vascularization bioactivity of mesenchymal stem cell-derived extracellular vesicles. Bioeng. Transl. Med. 2017, 2, 170–179. [Google Scholar] [CrossRef] [Green Version]
- Théry, C.; Witwer, K.W.; Aikawa, E.; Alcaraz, M.J.; Anderson, J.D.; Andriantsitohaina, R.; Antoniou, A.; Arab, T.; Archer, F.; Atkin-Smith, G.K.; et al. Minimal information for studies of extracellular vesicles 2018 (MISEV2018): A position statement of the International Society for Extracellular Vesicles and update of the MISEV2014 guidelines. J. Extracell. Vesicles 2018, 7, 1535750. [Google Scholar] [CrossRef] [Green Version]
- Pu, Y.; Chen, J.; Wang, W.; Alfano, R.R. 11-Basic Optical Scattering Parameter of the Brain and Prostate Tissues in the Spectral Range of 400–2400 nm. In Nanophotonics; Alfano, R.R., Shi, L.B.T.-N.B.S., Eds.; Elsevier: Amsterdam, The Netherlands, 2019; pp. 229–252. ISBN 978-0-323-48067-3. [Google Scholar]
- Malitson, I.H. Interspecimen Comparison of the Refractive Index of Fused Silica. J. Opt. Soc. Am. 1965, 55, 1205–1209. [Google Scholar] [CrossRef]
- Welsh, J.A.; Van Der Pol, E.; Arkesteijn, G.J.A.; Bremer, M.; Brisson, A.; Coumans, F.; Dignat-George, F.; Duggan, E.; Ghiran, I.; Giebel, B.; et al. MIFlowCyt-EV: A framework for standardized reporting of extracellular vesicle flow cytometry experiments. J. Extracell. Vesicles 2020, 9, 1713526. [Google Scholar] [CrossRef]
- Lamichhane, T.N.; Sokic, S.; Schardt, J.S.; Raiker, R.S.; Lin, J.W.; Jay, S.M. Emerging roles for extracellular vesicles in tissue engineering and regenerative medicine. Tissue Eng. Part B Rev. 2015, 21, 45–54. [Google Scholar] [CrossRef] [Green Version]
- Revenfeld, A.L.S.; Bæk, R.; Nielsen, M.H.; Stensballe, A.; Varming, K.; Jørgensen, M. Diagnostic and Prognostic Potential of Extracellular Vesicles in Peripheral Blood. Clin. Ther. 2014, 36, 830–846. [Google Scholar] [CrossRef] [Green Version]
- Gudbergsson, J.M.; Johnsen, K.B.; Skov, M.N.; Duroux, M. Systematic review of factors influencing extracellular vesicle yield from cell cultures. Cytotechnology 2016, 68, 579–592. [Google Scholar] [CrossRef] [Green Version]
- Krüger-Genge, A.; Blocki, A.; Franke, R.-P.; Jung, F. Vascular Endothelial Cell Biology: An Update. Int. J. Mol. Sci. 2019, 20, 4411. [Google Scholar] [CrossRef] [PubMed] [Green Version]
- Cines, D.B.; Pollak, E.S.; Buck, C.A.; Loscalzo, J.; Zimmerman, G.A.; McEver, R.P.; Pober, J.S.; Wick, T.M.; Konkle, B.A.; Schwartz, B.S.; et al. Endothelial cells in physiology and in the pathophysiology of vascular disorders. Blood 1998, 91, 3527–3561. [Google Scholar] [PubMed]
- Letsiou, E.; Bauer, N. Endothelial Extracellular Vesicles in Pulmonary Function and Disease. Curr. Top. Membr. 2018, 82, 197–256. [Google Scholar] [CrossRef] [PubMed]
- Milasan, A.; Farhat, M.; Martel, C. Extracellular Vesicles as Potential Prognostic Markers of Lymphatic Dysfunction. Front. Physiol. 2020, 11, 476. [Google Scholar] [CrossRef] [PubMed]
- Berezin, A.E.; Berezin, A.A. Extracellular Endothelial Cell-Derived Vesicles: Emerging Role in Cardiac and Vascular Remodeling in Heart Failure. Front. Cardiovasc. Med. 2020, 7, 47. [Google Scholar] [CrossRef]
- Erdbrügger, U.; Rudy, C.K.; Etter, M.E.; Dryden, K.A.; Yeager, M.; Klibanov, A.L.; Lannigan, J. Imaging flow cytometry elucidates limitations of microparticle analysis by conventional flow cytometry. Cytom. Part A J. Int. Soc. Anal. Cytol. 2014, 85, 756–770. [Google Scholar] [CrossRef] [PubMed]
- Hoen, E.N.M.N.T.; van der Vlist, E.J.; Aalberts, M.; Mertens, H.C.H.; Bosch, B.J.; Bartelink, W.; Mastrobattista, E.; van Gaal, E.V.B.; Stoorvogel, W.; Arkesteijn, G.J.A.; et al. Quantitative and qualitative flow cytometric analysis of nanosized cell-derived membrane vesicles. Nanomed. Nanotechnol. Biol. Med. 2012, 8, 712–720. [Google Scholar] [CrossRef] [Green Version]
- Arraud, N.; Gounou, C.; Turpin, D.; Brisson, A.R. Fluorescence triggering: A general strategy for enumerating and phenotyping extracellular vesicles by flow cytometry. Cytom. Part A J. Int. Soc. Anal. Cytol. 2016, 89, 184–195. [Google Scholar] [CrossRef]
- Gardiner, C.; Ferreira, Y.J.; Dragovic, R.A.; Redman, C.W.G.; Sargent, I.L. Extracellular vesicle sizing and enumeration by nanoparticle tracking analysis. J. Extracell. Vesicles 2013, 2, 19671. [Google Scholar] [CrossRef]
- Sultanova, N.; Kasarova, S.; Nikolov, I. Dispersion Properties of Optical Polymers. Acta Phys. Pol. A 2009, 116, 585–587. [Google Scholar] [CrossRef]
- Brennan, K.; Martin, K.; FitzGerald, S.P.; O’Sullivan, J.; Wu, Y.; Blanco, A.; Richardson, C.; Mc Gee, M.M. A comparison of methods for the isolation and separation of extracellular vesicles from protein and lipid particles in human serum. Sci. Rep. 2020, 10, 1039. [Google Scholar] [CrossRef] [PubMed] [Green Version]
- Viñals, F.; Pouysségur, J. Confluence of vascular endothelial cells induces cell cycle exit by inhibiting p42/p44 mitogen-activated protein kinase activity. Mol. Cell. Biol. 1999, 19, 2763–2772. [Google Scholar] [CrossRef] [PubMed] [Green Version]
- Takasugi, M.; Okada, R.; Takahashi, A.; Chen, D.V.; Watanabe, S.; Hara, E. Small extracellular vesicles secreted from senescent cells promote cancer cell proliferation through EphA2. Nat. Commun. 2017, 8, 15729. [Google Scholar] [CrossRef] [PubMed]
- Kusakabe, A.; Okumura, N.; Hirano, H.; Kinoshita, S.; Koizumi, N. The effect of cell density on the adhesion and proliferation properties of cultivated corneal endothelial cells. Investig. Ophthalmol. Vis. Sci. 2014, 55, 2058. [Google Scholar]
- Heng, B.C.; Bezerra, P.P.; Preiser, P.R.; Law, S.K.A.; Xia, Y.; Boey, F.; Venkatraman, S.S. Effect of cell-seeding density on the proliferation and gene expression profile of human umbilical vein endothelial cells within ex vivo culture. Cytotherapy 2011, 13, 606–617. [Google Scholar] [CrossRef]
- Hamada, K.; Osaka, M.; Yoshida, M. Cell Density Impacts Epigenetic Regulation of Cytokine-Induced E-Selectin Gene Expression in Vascular Endothelium. PLoS ONE 2014, 9, e90502. [Google Scholar] [CrossRef]
- Roederer, M.; Mays, R.W.; Murphy, R.F. Effect of confluence on endocytosis by 3T3 fibroblasts: Increased rate of pinocytosis and accumulation of residual bodies. Eur. J. Cell Biol. 1989, 48, 37–44. [Google Scholar]
- Hogg, N.; Browning, J.; Howard, T.; Winterford, C.; Fitzpatrick, D.; Gobé, G. Apoptosis in vascular endothelial cells caused by serum deprivation, oxidative stress and transforming growth factor-beta. Endothel. J. Endothel. Cell Res. 1999, 7, 35–49. [Google Scholar] [CrossRef]
- Andreu, Z.; Yáñez-Mó, M. Tetraspanins in extracellular vesicle formation and function. Front. Immunol. 2014, 5, 442. [Google Scholar] [CrossRef] [Green Version]
- Boyer, M.J.; Kimura, Y.; Akiyama, T.; Baggett, A.Y.; Preston, K.J.; Scalia, R.; Eguchi, S.; Rizzo, V. Endothelial cell-derived extracellular vesicles alter vascular smooth muscle cell phenotype through high-mobility group box proteins. J. Extracell. Vesicles 2020, 9, 1781427. [Google Scholar] [CrossRef]
- Vagida, M.S.; Arakelyan, A.; Lebedeva, A.M.; Grivel, J.-C.; Shpektor, A.V.; Vasilieva, E.Y.; Margolis, L.B. Analysis of Extracellular Vesicles Using Magnetic Nanoparticles in Blood of Patients with Acute Coronary Syndrome. Biochem. Biokhimiia 2016, 81, 382–391. [Google Scholar] [CrossRef] [PubMed]
- Prattichizzo, F.; De Nigris, V.; Sabbatinelli, J.; Giuliani, A.; Castaño, C.; Párrizas, M.; Crespo, I.; Grimaldi, A.; Baranzini, N.; Spiga, R.; et al. CD31 Positive-Extracellular Vesicles from Patients with Type 2 Diabetes Shuttle a miRNA Signature Associated with Cardiovascular Complications. Diabetes 2020, 11, 1031–1045. [Google Scholar] [CrossRef] [PubMed]
- Lertkiatmongkol, P.; Liao, D.; Mei, H.; Hu, Y.; Newman, P.J. Endothelial functions of platelet/endothelial cell adhesion molecule-1 (CD31). Curr. Opin. Hematol. 2016, 23, 253–259. [Google Scholar] [CrossRef] [PubMed] [Green Version]
- Petzelbauer, P.; Bender, J.R.; Wilson, J.; Pober, J.S. Heterogeneity of dermal microvascular endothelial cell antigen expression and cytokine responsiveness in situ and in cell culture. J. Immunol. 1993, 151, 5062–5072. [Google Scholar] [PubMed]
- Livshits, M.A.; Khomyakova, E.; Evtushenko, E.G.; Lazarev, V.N.; Kulemin, N.A.; Semina, S.E.; Generozov, E.V.; Govorun, V.M. Isolation of exosomes by differential centrifugation: Theoretical analysis of a commonly used protocol. Sci. Rep. 2015, 5, 17319. [Google Scholar] [CrossRef]


Publisher’s Note: MDPI stays neutral with regard to jurisdictional claims in published maps and institutional affiliations. |
© 2020 by the authors. Licensee MDPI, Basel, Switzerland. This article is an open access article distributed under the terms and conditions of the Creative Commons Attribution (CC BY) license (http://creativecommons.org/licenses/by/4.0/).
Share and Cite
Oesterreicher, J.; Pultar, M.; Schneider, J.; Mühleder, S.; Zipperle, J.; Grillari, J.; Holnthoner, W. Fluorescence-Based Nanoparticle Tracking Analysis and Flow Cytometry for Characterization of Endothelial Extracellular Vesicle Release. Int. J. Mol. Sci. 2020, 21, 9278. https://0-doi-org.brum.beds.ac.uk/10.3390/ijms21239278
Oesterreicher J, Pultar M, Schneider J, Mühleder S, Zipperle J, Grillari J, Holnthoner W. Fluorescence-Based Nanoparticle Tracking Analysis and Flow Cytometry for Characterization of Endothelial Extracellular Vesicle Release. International Journal of Molecular Sciences. 2020; 21(23):9278. https://0-doi-org.brum.beds.ac.uk/10.3390/ijms21239278
Chicago/Turabian StyleOesterreicher, Johannes, Marianne Pultar, Jaana Schneider, Severin Mühleder, Johannes Zipperle, Johannes Grillari, and Wolfgang Holnthoner. 2020. "Fluorescence-Based Nanoparticle Tracking Analysis and Flow Cytometry for Characterization of Endothelial Extracellular Vesicle Release" International Journal of Molecular Sciences 21, no. 23: 9278. https://0-doi-org.brum.beds.ac.uk/10.3390/ijms21239278