Article

Beyond Microcystins: Cyanobacterial Extracts Induce Cytoskeletal Alterations in Rice Root Cells

by
Dimitris Pappas
1,*,
Manthos Panou
1,
Ioannis-Dimosthenis S. Adamakis
2,
Spyros Gkelis
1 and
Emmanuel Panteris
1,*
1
Department of Botany, School of Biology, Aristotle University of Thessaloniki, 54124 Thessaloniki, Greece
2
Department of Botany, Faculty of Biology, National and Kapodistrian University of Athens, 15784 Athens, Greece
*
Authors to whom correspondence should be addressed.
Int. J. Mol. Sci. 2020, 21(24), 9649; https://0-doi-org.brum.beds.ac.uk/10.3390/ijms21249649
Submission received: 24 November 2020 / Revised: 9 December 2020 / Accepted: 15 December 2020 / Published: 17 December 2020

Abstract

:
Microcystins (MCs) are cyanobacterial toxins and potent inhibitors of protein phosphatases 1 (PP1) and 2A (PP2A), which are involved in plant cytoskeleton (microtubules and F-actin) organization. Therefore, studies on the toxicity of cyanobacterial products on plant cells have so far been focused on MCs. In this study, we investigated the effects of extracts from 16 (4 MC-producing and 12 non-MC-producing) cyanobacterial strains from several habitats, on various enzymes (PP1, trypsin, elastase), on the plant cytoskeleton and H2O2 levels in Oryza sativa (rice) root cells. Seedling roots were treated for various time periods (1, 12, and 24 h) with aqueous cyanobacterial extracts and underwent either immunostaining for α-tubulin or staining of F-actin with fluorescent phalloidin. 2,7-dichlorofluorescein diacetate (DCF-DA) staining was performed for H2O2 imaging. The enzyme assays confirmed the bioactivity of the extracts of not only MC-rich (MC+), but also MC-devoid (MC−) extracts, which induced major time-dependent alterations on both components of the plant cytoskeleton. These findings suggest that a broad spectrum of bioactive cyanobacterial compounds, apart from MCs or other known cyanotoxins (such as cylindrospermopsin), can affect plants by disrupting the cytoskeleton.

1. Introduction

Cyanobacteria are an ancient group of oxygenic photosynthetic prokaryotes, thriving in both aquatic and terrestrial habitats, even under the harshest conditions [1]. Their ability to inhabit numerous diverse environments is also reflected by the plethora of bioactive compounds, which they are able to produce [2]. Among these compounds, a multitude are known to be toxic to other organisms, especially eukaryotes [2], and their potential drug-attributes are an emerging research field (for a review, see [3]).
Τhe most notoriously harmful and well-studied cyanobacterial toxins (also referred to as cyanotoxins), are the microcystins (MCs), harmful to animal cell systems [4], by affecting the cytoskeleton [5]. MCs are monocyclic heptapeptides with two variable amino acids and more than 250 different MC variants exist [2], the most common of which are MC-LR, MC-RR, and MC-YR. MCs are produced by several cyanobacteria, not only of freshwater, but also of marine or terrestrial environments [2], and seem to have functional roles within cyanobacterial cells, such as modulation of specific proteins and protection against oxidative stress [6]. MCs also inhibit serine/threonine protein phosphatases 1 (PP1) and 2A (PP2A) [7,8], which are involved in protein complexes that orchestrate mitotic events [9] and seem to be of great importance for cytoskeleton dynamics, interacting with a wide range of cytoskeleton-associated proteins [10].
Apart from animals, MCs seem to be also toxic for plants [11]. The plant cytoskeleton, i.e., microtubules and F-actin, are among the subcellular components affected by MCs. While microtubules are an established target of MC toxicity in plant cells [12], with MC-derived defects ranging from slight disorientation to total disruption, plant F-actin organization was only recently shown to be negatively affected by MCs [13]. Previous research data on the involvement of PP2A in both microtubule [14] and F-actin [15] organization in Arabidopsis thaliana strongly support an association of MC-induced protein phosphatase inhibition with plant cytoskeleton abnormalities. Protein phosphatase (including PP1 and PP2A) homologues related to microtubule regulation have been identified in several model plant species, such as Arabidopsis thaliana and Oryza sativa [16]. These findings indicate that both cytoskeletal elements are vulnerable to MCs and, thus, deem the plant cytoskeleton a “hot-spot” for studies regarding cyanotoxins and plant cell biology [15].
Oxidative stress is also commonly induced by MCs [17,18,19]. More specifically, hydrogen peroxide (H2O2) is a reactive oxygen species (ROS) produced during oxidative stress in plants [20], also associated with MC toxicity in plant cells, as increased H2O2 levels were detected in various plant species, including Ceratophyllum demersum [21], Oryza sativa [22], and Nicotiana tabacum BY-2 cells [23], after exposure to MCs. MC-induced oxidative stress has been held responsible for alterations in cell ultrastructure and chromatin alterations [24,25].
MCs are not the only peptide metabolites produced by cyanobacteria; in fact, cyanopeptides comprise many other—more diverse and far less studied, in comparison to MCs—bioactive molecules, such as cyanopeptolins, aeruginosins, and anabaenopeptins [2,26] and new findings are constantly reported [27]. Interestingly, anabaenopeptins have been experimentally shown to inhibit PP1 activity in vitro [28], raising questions over their ability to induce disruption of the cytoskeleton. In her recent review, Janssen [26] underlines the significance of using extracts from cyanobacterial strains as reference, in order to simulate field exposure to cyanopeptides. Indeed, crude strain extracts are naturally occurring mixtures of bioactive compounds [27,29], closely matching real-life exposure. Accordingly, extracts have been extensively used to study the adverse effects of cyanobacterial compounds on plant cell physiology [30,31,32]. Among plant species, rice (Oryza sativa) is an ideal experimental material for such research, due to its importance for food production [33] and the fact that it is usually cultivated in fields flooded with water, potentially containing cyanobacteria and their metabolic products.
In this context, we carried out an extensive screening of the toxic effects of a variety of MC-rich (MC+) and MC-devoid (MC−) cyanobacterial extracts on rice roots, in order to broaden the data concerning the potential adverse toxic effects of cyanobacteria on plant cells. Cyanotoxins, such as MCs and cylindrospermopsin, are known to be uptaken by the roots of various crop species [34,35], so root cells are expected to exhibit possible cytoskeletal alterations due to treatment with the extracts. Interestingly enough, extracts from strains not yet reported to produce any cyanotoxins, appear to exert severe effects on rice cytoskeleton. These observations reveal that cyanobacteria could negatively affect plants through a broad “arsenal” of bioactive compounds.

2. Results

2.1. Enzyme Inhibition

In order to preliminarily assess the inhibitory potential of the cyanobacterial extracts used in this study, we examined the inhibition of three enzymes, PP1, trypsin, and elastase, typically included in tests for cyanobacterial toxicity [28,36] (Table 1). Only MC+ extracts (1410, 2410, and 1614) inhibited PP1 activity. Trypsin was inhibited only by the 1614 extract. All of the extracts tested, except for 0717, were found to inhibit elastase activity. Accordingly, toxicity due to cyanotoxins is expected to occur under treatment with these extracts.

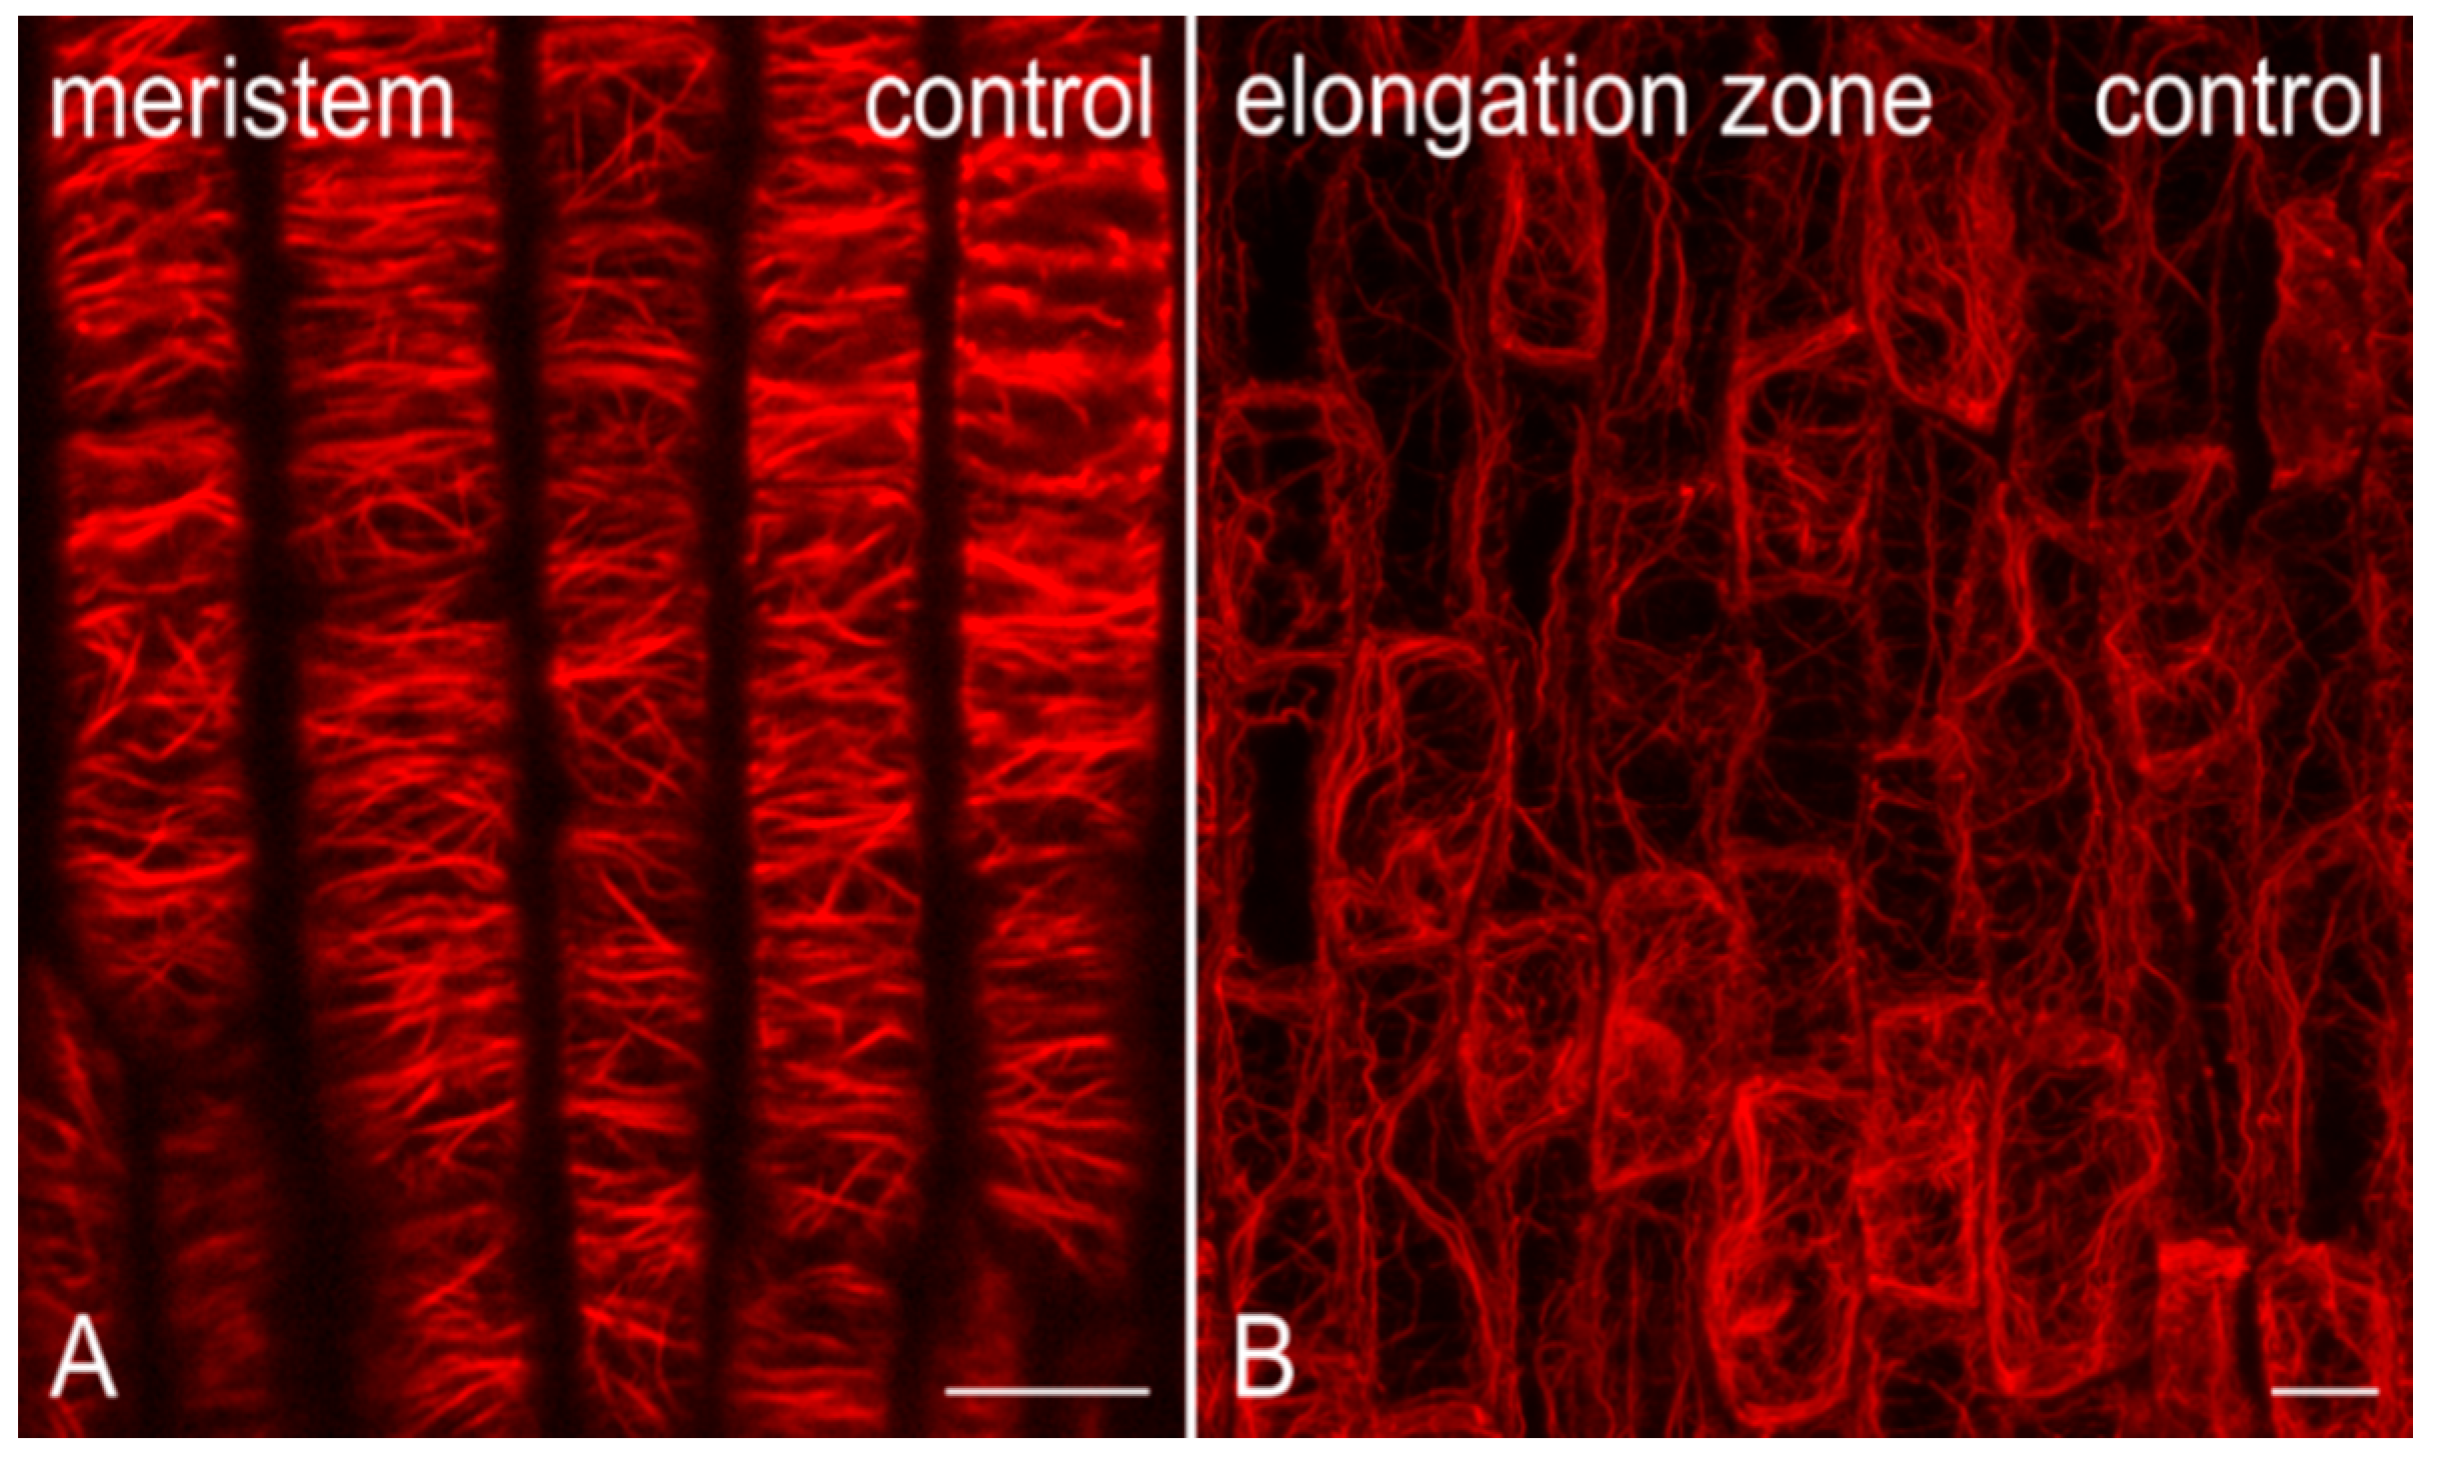
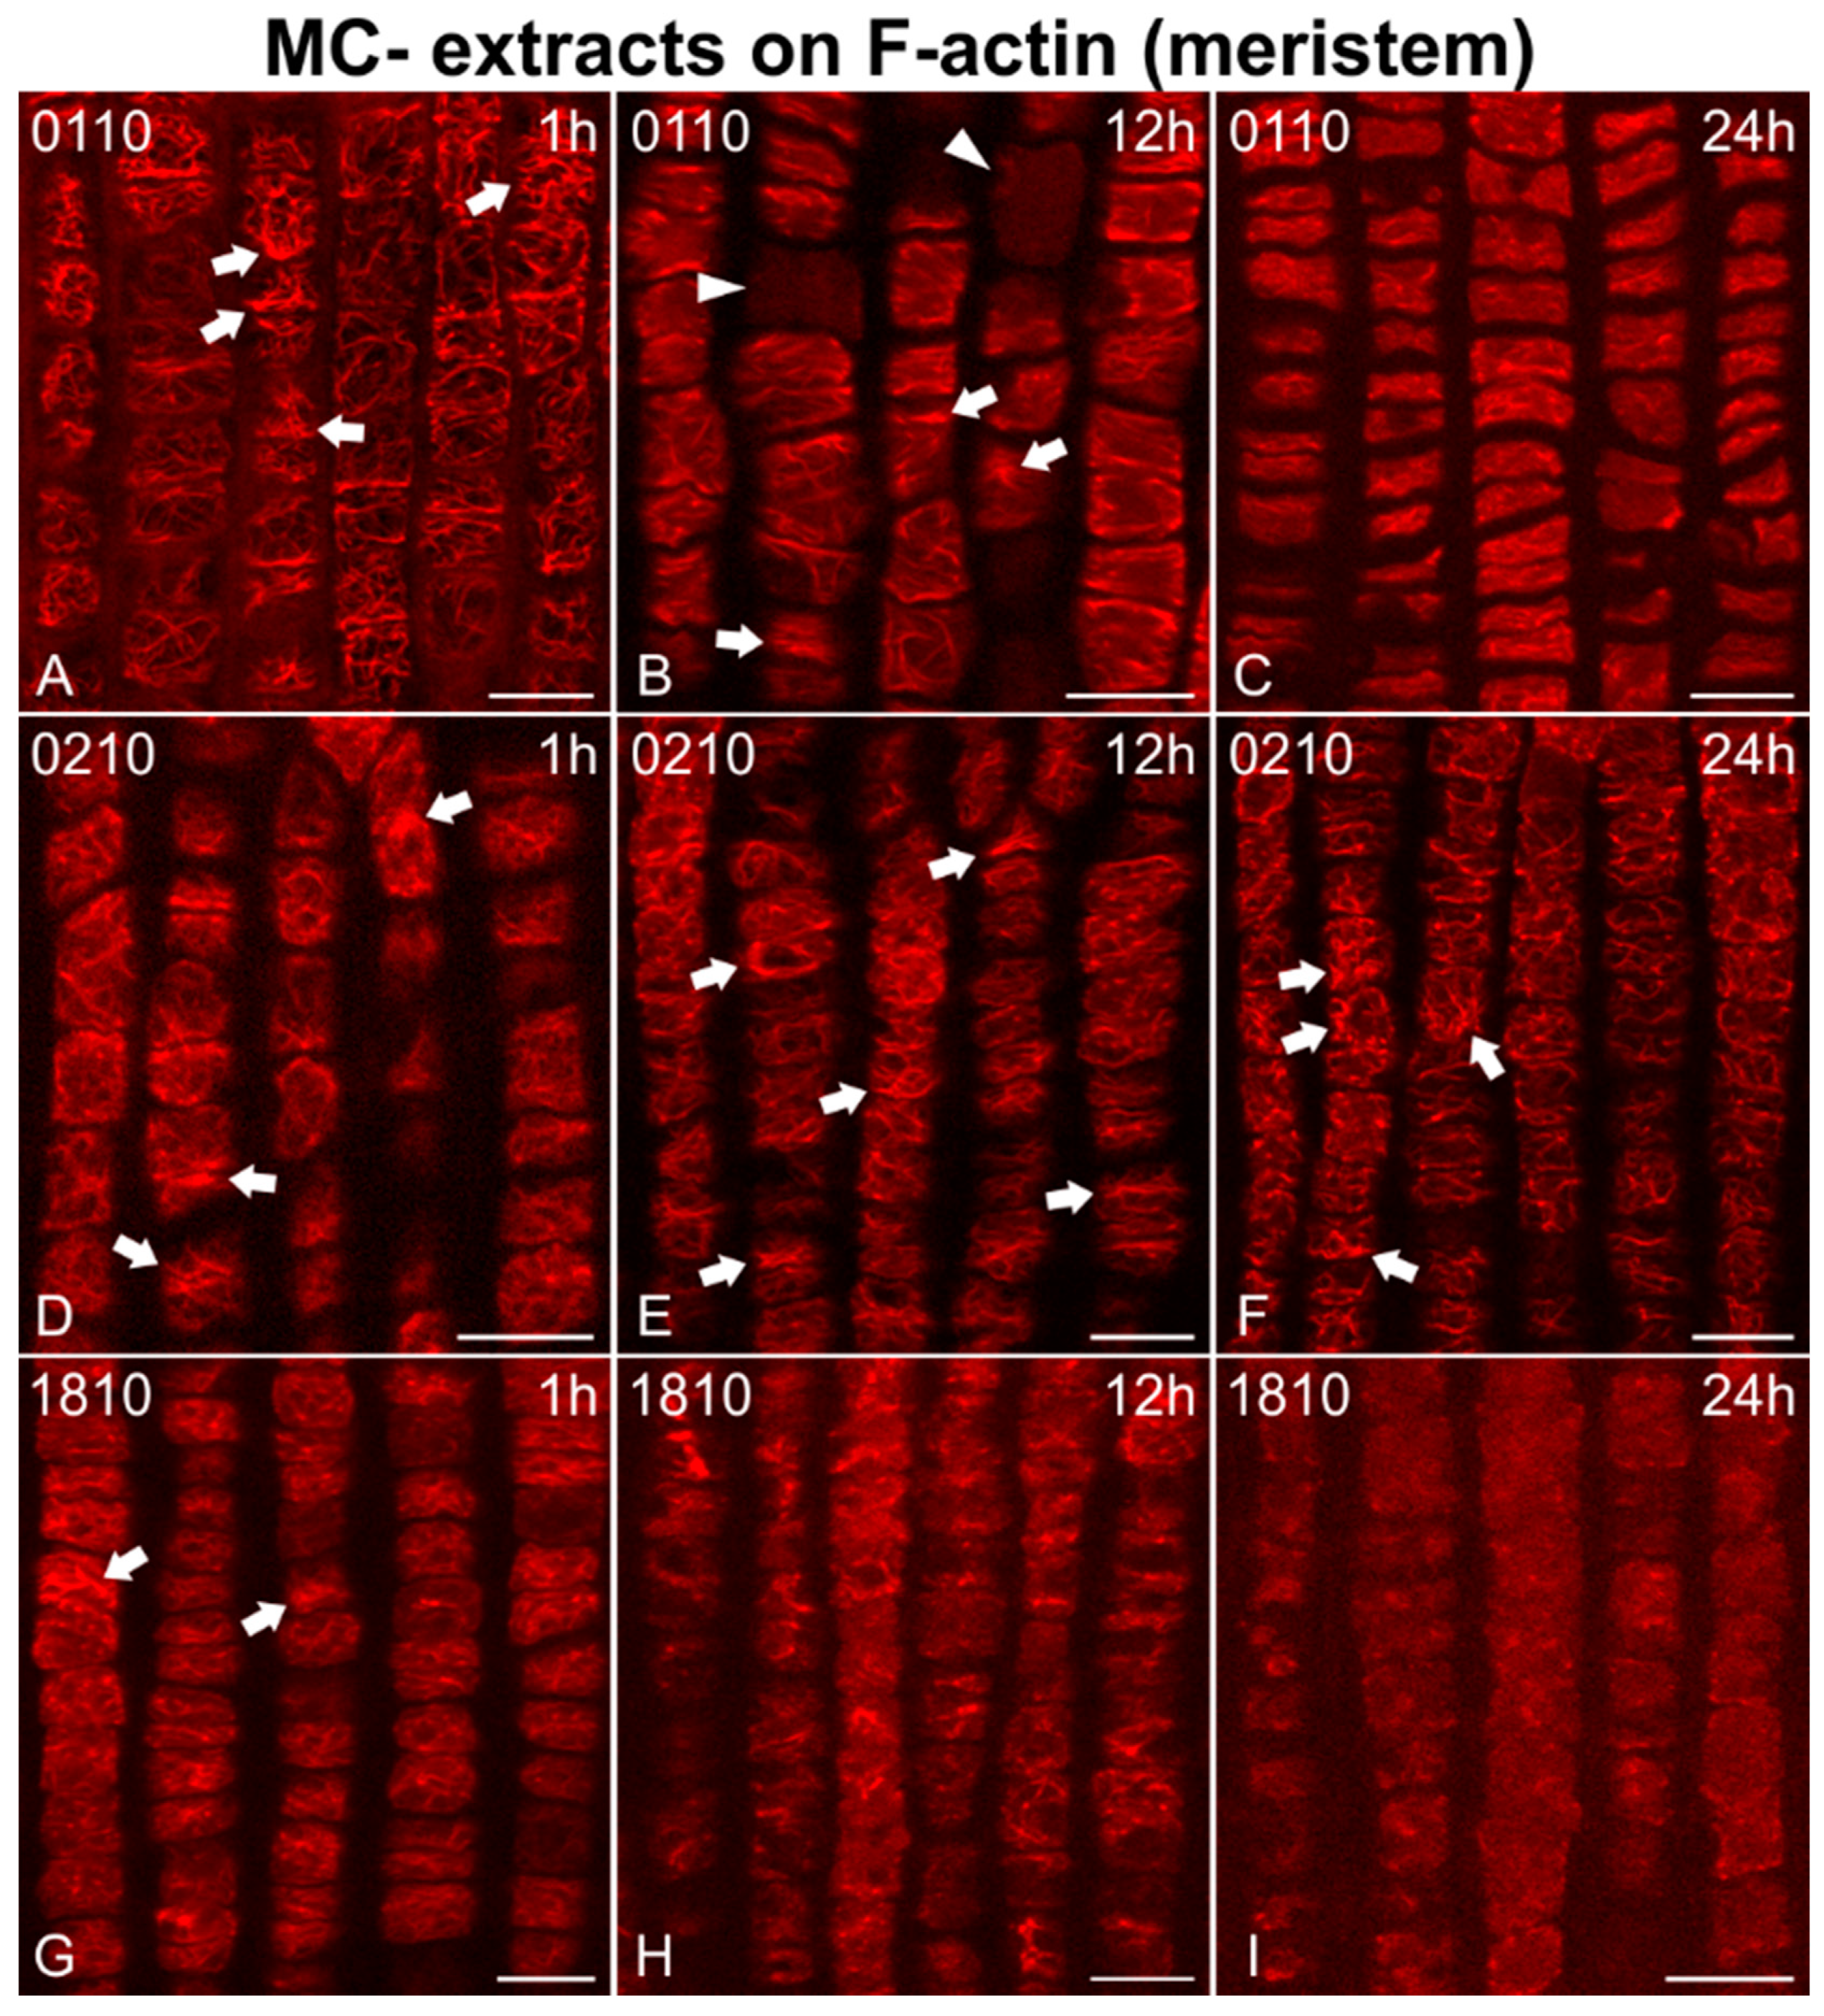
2.2. Effects on F-actin

2.2.1. Morphological Alterations

Microfilaments were abundant in control root cells (Figure 1), of the apical meristem (Figure 1A) and the elongation zone (Figure 1B), while cells treated with MC+ extracts (from MC-producing strains; 1410, 2410, 1414, 1614) exhibited time-dependent alterations of the F-actin cytoskeleton (Figure 2 and Figure 3). After just 1 h of treatment, cortical actin filaments in meristematic root cells appeared to be disoriented and branched (Figure 2A,J) or even bundled (arrows in Figure 2D,G), sometimes exhibiting ring-shaped F-actin conformations (arrowheads in Figure 2G). After 12 h, cortical microfilaments, were heavily disoriented (Figure 2E,H,K) and bundled (arrows in Figure 2B,E,H). In 1410-treated root cells, except for bundles, no discernable actin filaments could be observed after 12 h (Figure 2B), while F-actin was almost absent after 24 h (Figure 2C). Treatment with the other MC+ extracts for 24 h led to various F-actin defects, ranging from disorientation (Figure 2I) and the appearance of actin circular conformations/rings (arrowheads in Figure 2F,I), to severe deterioration of the F-actin network integrity (Figure 2L).
Cells in the root elongation zone were also affected (Figure 3). Longitudinal F-actin cables, a common feature of untreated cells in the elongation zone (Figure 1B), could still be observed after 1 h of treatment (Figure 3A,D,G,J). However, after 12 h, these cables appeared significantly altered in various ways, being either disoriented (Figure 3E,H), scarce (Figure 3Κ), or even absent, in which case F-actin was severely damaged and fragmented (Figure 3B). Eventually, after 24 h, actin filaments either disappeared completely (Figure 3C,L), or were scarce and disoriented, wherever present (Figure 3F,I). Actin aggregates were also detected (arrows in Figure 3I).
In addition, F-actin was adversely affected in root meristematic cells after treatment with MC− extracts (from strains not producing MCs; Figure 4, Figure 5 and Figure 6). Disorientation/branching of cortical actin filaments (Figure 4A, Figure 5G and Figure 6D,J), bundling (Figure 4D,G and Figure 5A), or a combination of these effects (Figure 5D,J and Figure 6A,G) were commonly observed in affected cells after only 1 h of treatment. Actin rings were also detected in some cases (arrowheads in Figure 5J). These effects persisted or were intensified after 12 h (Figure 4B,E, Figure 5B,E,H,K and Figure 6E,H,K), while loss of actin network integrity (Figure 4H and Figure 6B), ring-shaped conformations (arrowhead in Figure 6B), and even cells devoid of F-actin (arrowheads in Figure 4B and Figure 5E,K) could be observed. After 24 h, actin filaments were either weak and scarce (Figure 4C, Figure 5F,I and Figure 6L) occasionally forming rings (arrowheads in Figure 5C), heavily bundled (Figure 4F, Figure 5L and Figure 6F,I,L), or eventually disappearing (Figure 4I, arrowheads in Figure 5F,I).
As for the elongation zone (Figure 7, Figure 8 and Figure 9), short treatments (1 h) with MC− extracts (from non-MC-producing strains) did not greatly affect F-actin in elongating cells (Figure 7A,D and Figure 9D,J), except for some bundling/aggregates (arrows in Figure 7G, Figure 8D,G,J and Figure 9A,G,J) or disorientation effects (transverse actin cables instead of longitudinal) noticed (arrows in Figure 8A, arrowheads in Figure 9J). After 12 h, disorientation of actin cables (Figure 7B,E and Figure 9E,H) and F-actin bundling/aggregates (arrows in Figure 8H,K and Figure 9B,K) were common effects, along with F-actin diminishing (Figure 8B,E) and, in some cases, actin rings (arrowheads in Figure 7E) and cells devoid of F-actin (arrowheads in Figure 7B,H). After 24 h, the F-actin network was heavily disoriented, bundled, or degraded (Figure 7C,F,I, Figure 8C,F,I,L and Figure 9C,F,I,L). Actin rings were also detected (arrowheads in Figure 7I).

2.2.2. F-actin Fluorescence Intensity Measurements

The detrimental effects of the cyanobacterial extracts on F-actin in rice root cells were further confirmed by measurements of the corrected total cell fluorescence (CTCF; Figure 10). In both meristematic (Figure 10A) and elongation zone root cells (Figure 10B), CTCF dropped upon treatment with each cyanobacterial extract, readily from 1 h of the extract application. The exposed elongating root cells exhibited a pronounced fluorescence intensity drop, compared to the meristematic cells (Figure 10B; cf. Figure 10A). CTCF measurements drop observed in all extract treatments, showed a statistical significance, set at p < 0.05.

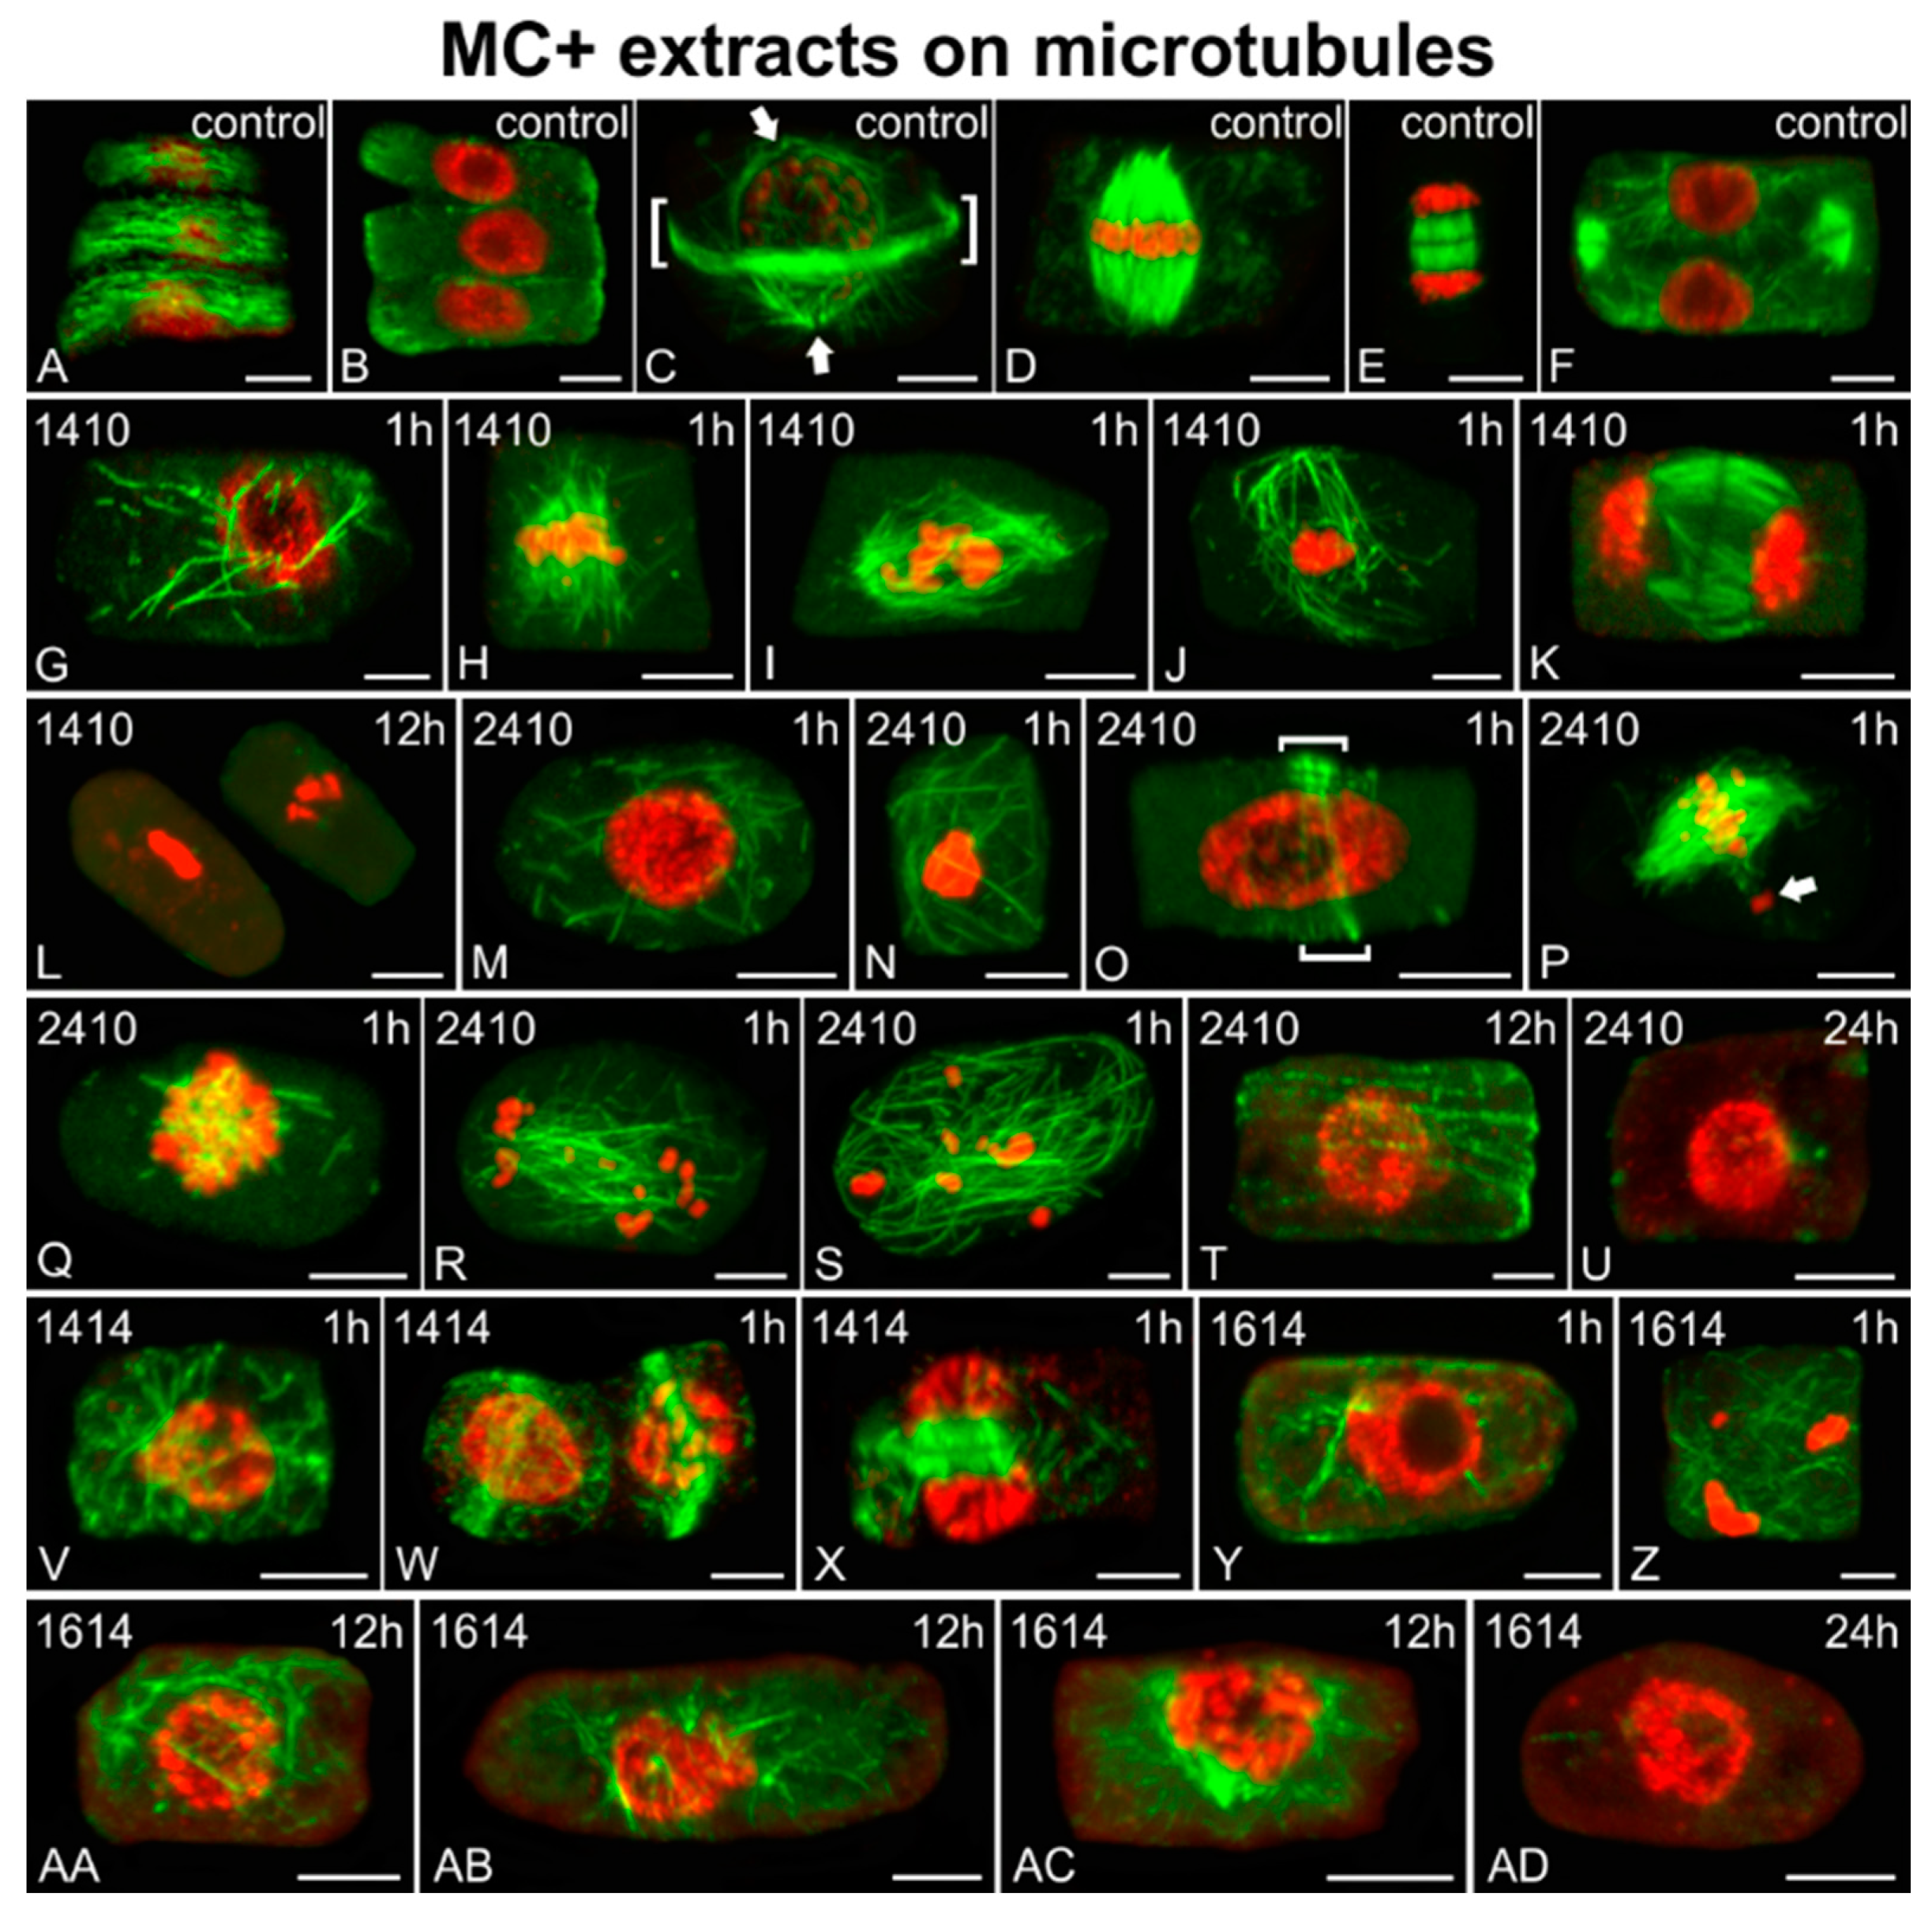
2.3. Effects on Microtubules and Chromatin

Microtubules were severely affected by MC+ extracts (Figure 11), compared to the control (Figure 11A–F). Microcystis (1410 and 2410) extracts exhibited their effects on root meristematic cells starting from 1 h of exposure. Misoriented (Figure 11G,N,S) or even fractured (Figure 11M,Q) microtubules, deformed mitotic spindles (Figure 11H–J,P,R; cf. Figure 11D) and phragmoplasts (Figure 11K; cf. Figure 11F), absence of perinuclear microtubules in preprophase cells (Figure 11O; cf. Figure 11C), and abnormal condensation (Figure 11J,N) or dispersal (Figure 11R,S) of chromatin were observed in affected cells after only 1 h of treatment. After 12 h, root cells affected by the 1410 extract exhibited no microtubules, as well as abnormally condensed chromatin (Figure 11L), while cells treated with the 2410 extract exhibited scarce cortical microtubules (Figure 11T; cf. Figure 11A), which eventually disappeared after 24 h (Figure 11U). Extracts from other MC+ strains (1414 and 1614) exhibited slighter effects on rice root cells than the Microcystis extracts. After short-term treatments (1 h), 1414-treated root cells exhibited mainly microtubule disorientation in various cell cycle stages, such as cortical microtubules in interphase cells (Figure 11V; cf. Figure 11A), perinuclear microtubules in preprophase cells (Figure 11W; cf. Figure 11C) and phragmoplast microtubules (Figure 11X; cf. Figure 11E), without further disturbance after longer treatments. Short-term (1 h) treatment with the 1614 extract also disturbed the microtubule network, leading to the prevalence of endoplasmic microtubules in affected cells (Figure 11Y; cf. Figure 11B) and, in some cases, chromatin dispersal (Figure 11Z). After 12 h, disoriented cortical (Figure 11AA; cf. Figure 11A) and endoplasmic microtubules (Figure 11AB; cf. Figure 11B), along with preprophase cells lacking preprophase band (PPB) (Figure 11AC; cf. Figure 11C), were observed. Eventually, after 24 h treatment with the 1614 extract, microtubules disappeared almost totally (Figure 11AD).
Microtubules appeared to be also affected by MC− extracts from certain non-MC-producing strains (Figure 12). Disorientation of cortical microtubules (Figure 12A,C,H,Q; cf. Figure 11A) and the formation of excess endoplasmic microtubules (Figure 12B,D,I,M,R, left cell in V; cf. Figure 11B) were common effects observed after treatment. Defects of the mitotic spindles (Figure 12E,K, right cell in V,W; cf. Figure 11D), lack of perinuclear microtubules in preprophase cells (Figure 12J,N,S; cf. Figure 11C, preprophase bands of microtubules are defined by brackets), and anomalies in phragmoplasts during cytokinesis (Figure 12F,G,L,O,T; cf. Figure 11F) were reported as well. For root cells treated with the 0499 and 0599 extracts, these effects were rather minor, compared to the control, detectable at all time points of exposure (1–24 h). However, the Jaaginema (0110 and 0210) extracts and the Microcystis 1810 extract induced such alterations after only 1 h of treatment, along with even harsher effects, including abnormal chromatin condensation (Figure 12V median cell, Figure 12X,Y). After longer exposure, affected cells appeared devoid of tubulin polymers, with abnormal chromatin condensation (Figure 12P,U,Z).

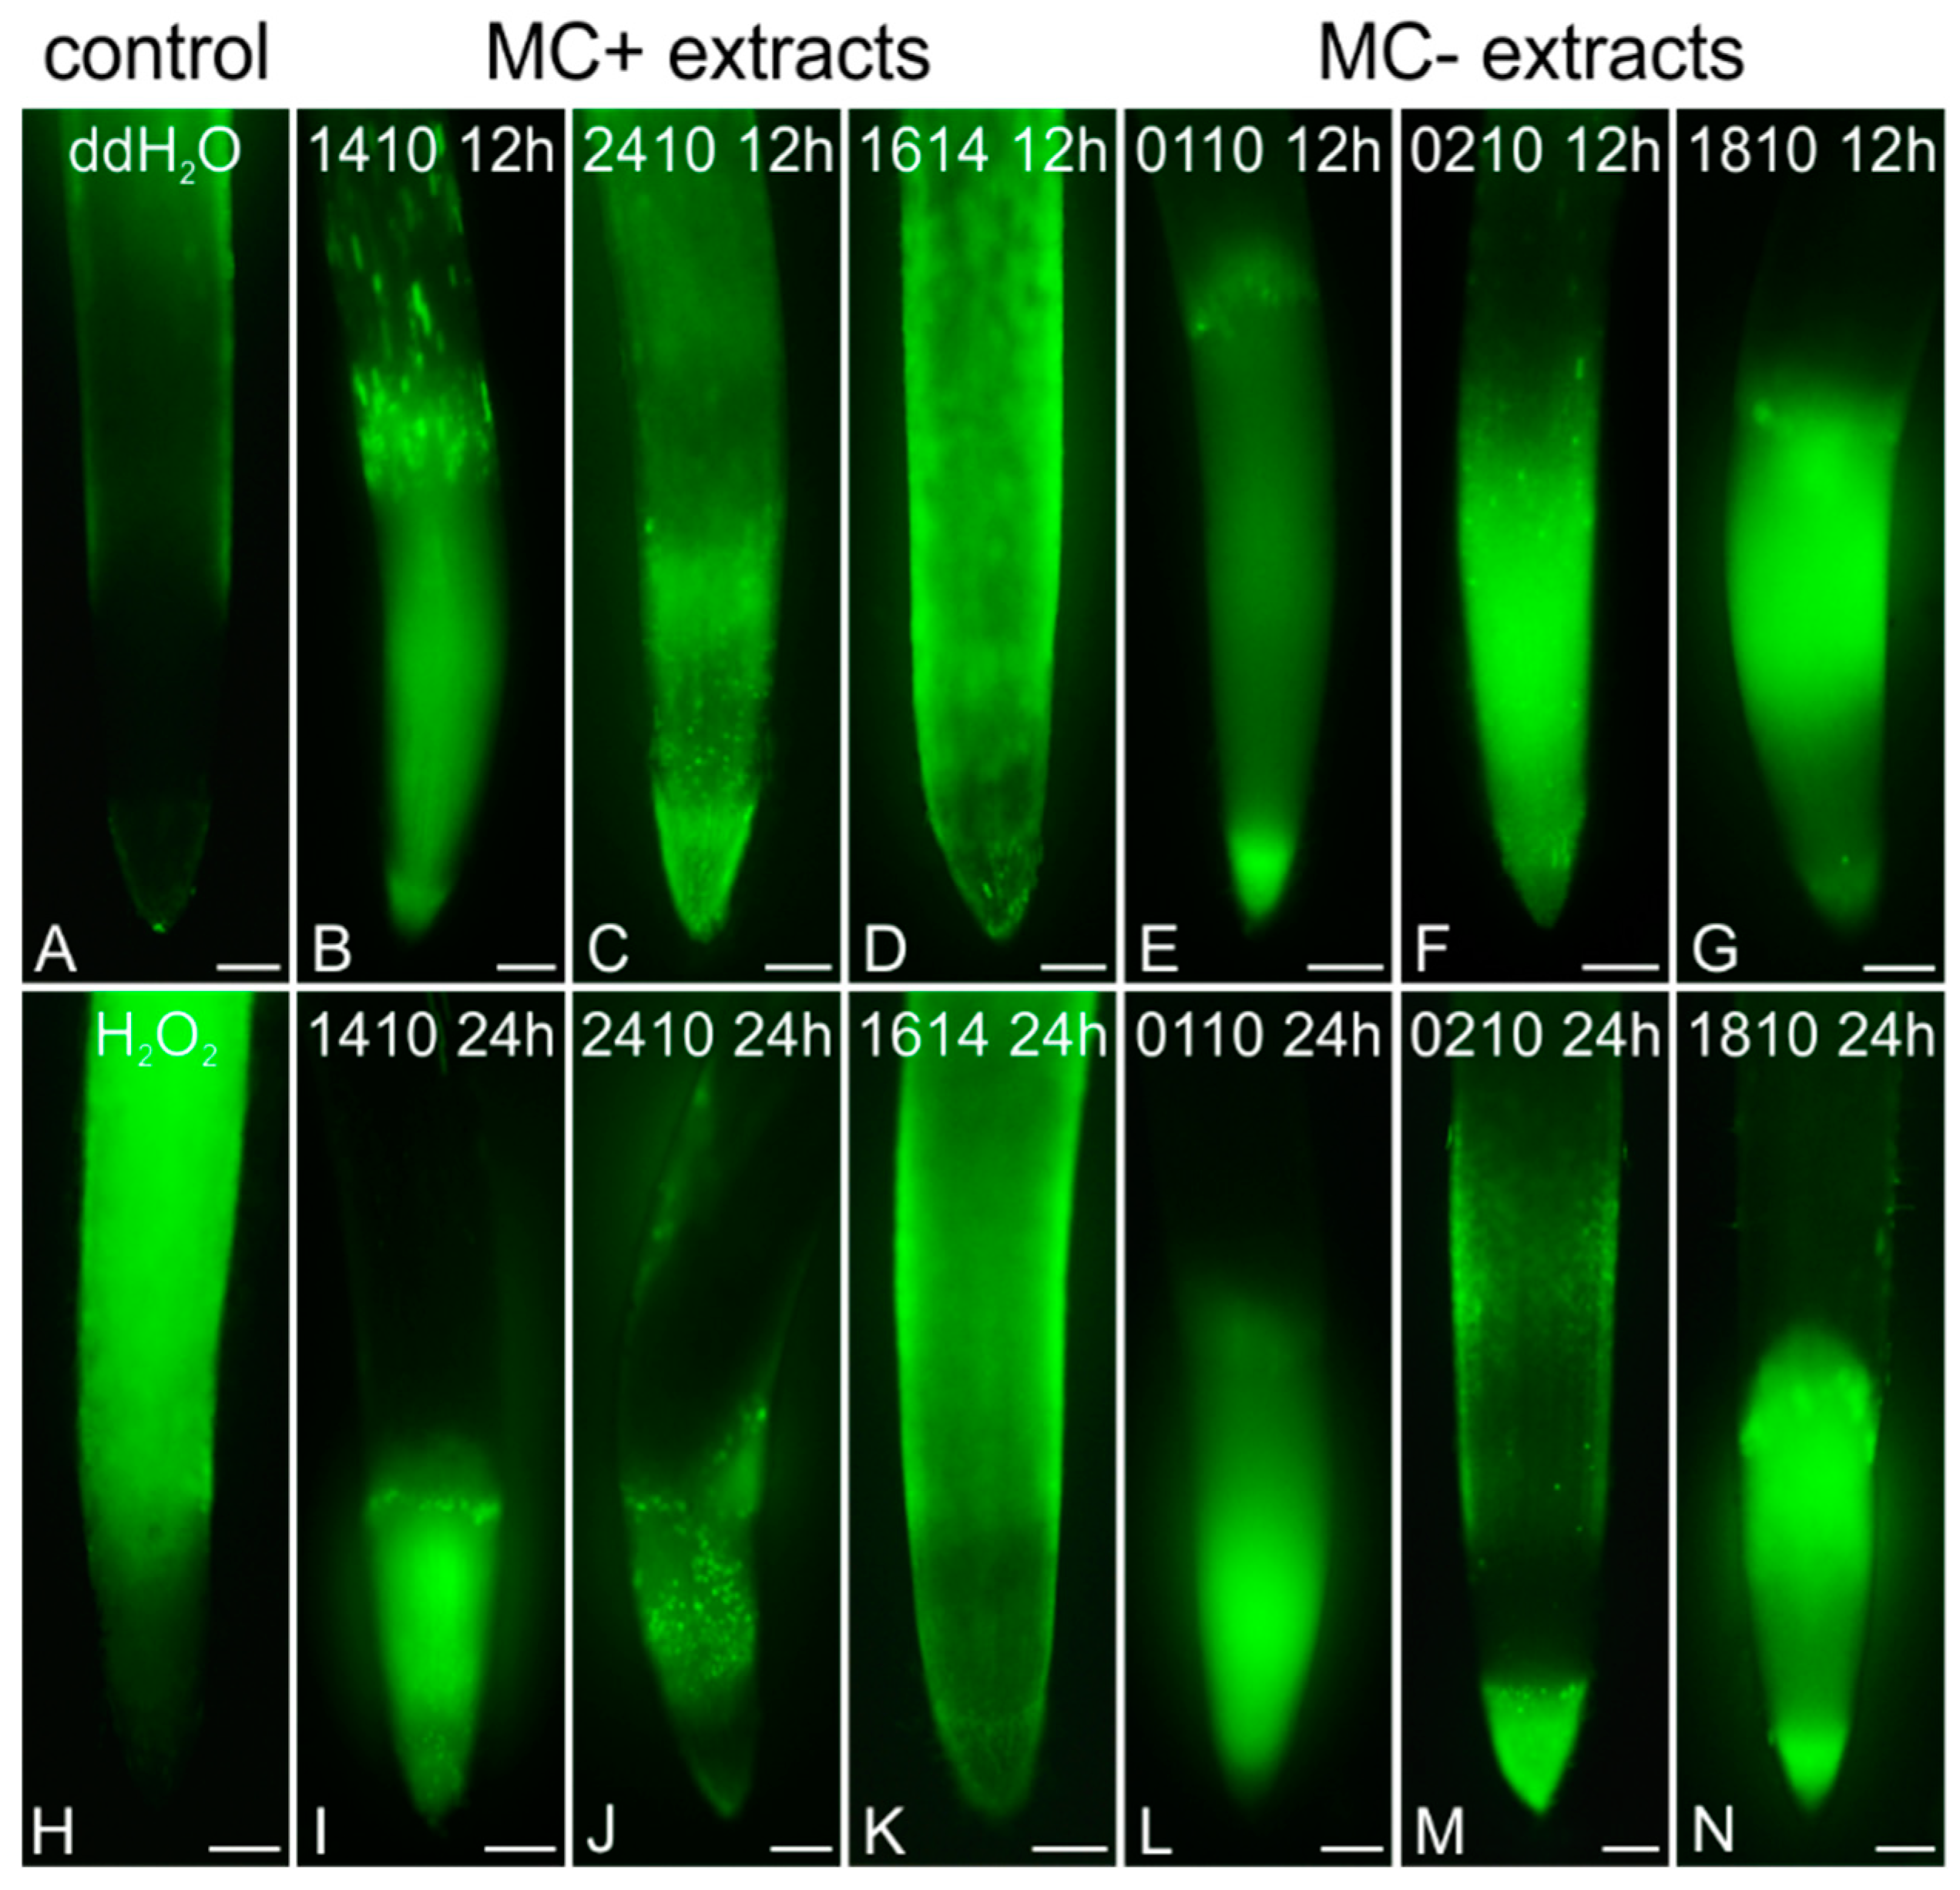
2.4. Induction of Oxidative Stress

Six of the extracts induced oxidative stress in rice roots, compared to control (Figure 13A,H), initiating at 12 h of exposure. All Microcystis extracts, from both MC-producing (1410, 2410) and non-MC-producing (1810) strains, produced increased levels of H2O2 after 12 h (Figure 13B,C,G). After 24 h, fluorescence was only visible in cells of the root apical meristem (Figure 13I,J,N). MC− extracts from both Jaaginema strains (0110, 0210) also produced elevated H2O2 levels in treated roots after 12 h (Figure 13E,F) and 24 h (Figure 13L,M), while similar effects were observed after treatment with the MC+ extract of Trichormus variabilis TAU-MAC 1614 (Figure 13D,K).

3. Discussion

Almost all of the cyanobacterial extracts applied for treatments affected rice root cells. More specifically, all the MC+ extracts affected both F-actin (Figure 2, Figure 3 and Figure 10) and microtubules (Figure 11), and increased the levels of H2O2 (Figure 13), except Raphidiopsis raciborskii TAU-MAC 1414 extract, which did not induce an H2O2 increase. MC− extracts (from non-MC-producing strains), except Nodularia sp. TAU-MAC 0717 extract, caused F-actin disorders (Figure 4, Figure 5, Figure 6, Figure 7, Figure 8, Figure 9 and Figure 10). Jaaginema sp. TAU-MAC 0110 and 0210 and Microcystis viridis TAU-MAC 1810 extracts also affected microtubules and induced an increased H2O2 production (Figure 12 and Figure 13), while Synechococcus sp. TAU-MAC 0499 and Chlorogloeopsis fritschii TAU-MAC 0599 affected microtubules but did not increase H2O2 (Figure 12; for an overview, see Table 2). Therefore, it is further consolidated that extracts from various cyanobacterial strains (deriving from a multitude of environments; Table 3) target both plant microtubules and F-actin and are capable of inducing H2O2 production.
Many strains used in the current study have also been shown to have inhibitory effects on the growth of heterotrophic bacteria (namely: 0399, 0499, 0110, 0210, 1410, 1510, 1810, 2410) [29]. Additionally, extracts from the Jaaginema sp. TAU-MAC 0110 and 0210 strains have exhibited cytotoxic activity against human cancer cell lines, reportedly inducing F-actin alterations [29]. Their established bioactivity was further investigated by enzyme inhibition assays (Table 1).
The inhibitory effects of several cyanopeptides—beyond MCs—on various proteases [26] provide a useful tool for correlating the microscopically observed cytoskeletal changes with the activity of such compounds. Therefore, we demonstrated the effects of the extracts on hydrolytic enzymes. The inhibition of the activity of proteolytic enzymes, such as chymotrypsin, trypsin, elastase, and thrombin, by cyanobacterial extracts has been frequently reported [36,37]. Inhibition of both elastase and trypsin was also assigned to peptides such as micropeptins, cyanopeptolins, microviridins, and banyasides [37,38,39,40,41,42]. The production of potent inhibitors has also been found in several cyanobacteria, like Microcystis, Planktothrix, Anabaena, Nostoc, Lyngbya, and Symploca [43,44,45]. Inhibition of hydrolytic enzymes might not be a threat for extracellular enzymes, diluted in bulk water. However, the probable accumulation of cyanopeptides by aquatic organisms, including plants, may result in reaching an intracellular concentration high enough to inhibit intracellular enzymes, as plants cannot regulate their endogenous peptidase activity in combination with serine peptidases of cyanobacterial origin [46,47].
Cyanotoxins, such as MCs and cylindrospermopsin, are known to affect plant growth [48,49], cause chromatin defects [12], and induce disorganization of microtubules in plant cells [50,51]. MC-LR was recently found to induce F-actin alterations in Oryza sativa root cells [13]. However, even MC− extracts which did not affect microtubules, appeared to disrupt the F-actin network, implying that each cytoskeletal component is affected by independent mechanism of toxicity and suggesting that F-actin is a primary target of cyanobacterial toxicity, beyond MCs, in plant cells. To our best knowledge, this is the first report of cytoskeletal alterations in plant cells induced by extracts from cyanobacterial strains not producing MCs or cylindrospermopsin, underlining that several more cyanobacterial bioactive compounds are able to disrupt the plant cytoskeleton. The exact identity and mode of action of these compounds (which may also exert their effects synergistically) remain to be further studied.
Oxidative stress, detected in roots treated with extracts from certain strains (Figure 13), could also play a role in the induction of cytoskeletal defects. Elevated ROS levels have been associated with reorganization of microtubules in plant cells [52]. ROS-induced F-actin remodeling has also been reported in innate immunity responses of Arabidopsis thaliana pavement cells [53], suggesting that the increase in ROS levels due to extract treatment could affect F-actin as well. Nevertheless, cytoskeletal alterations were also observed after treatment with extracts that did not induce oxidative stress. In addition, increased ROS production was detected at 12 h, while disorders of the cytoskeleton appeared even after 1 h of treatment. This is possibly a hint that cyanobacterial toxicity against the plant cytoskeleton may not always involve ROS.
Cyanobacterial extracts induced a multitude of alterations in rice root cells and these findings could also be of ecological significance. Indeed, cyanobacteria produce a wide range of bioactive compounds [54,55] and cyanobacterial blooms often consist of several species [56,57,58]. An emerging challenge is to identify the above compounds and analyze their specific effects on plant cells. This would be the target of further research.

4. Materials and Methods

4.1. Culture of Cyanobacteria, Biomass Collection, and Preparation of Extracts

Sixteen cyanobacterial strains of the TAU-MAC culture collection [59], representatives of various taxonomic orders and habitats, were used for experimental purposes (Table 3).
Table 3. The cyanobacterial strains used here and relevant information. “+”: microcystins (MCs) detected. “−“: no MCs detected.
Taxonomic OrderStrainHabitatLifestyleDetection of MCsReferences
ChroococcalesMicrocystis flos-aquae TAU-MAC 1410FreshwaterPlanktic+[29,59]
Microcystis viridis TAU-MAC 1810FreshwaterPlanktic[29,59]
Microcystis sp. TAU-MAC 2410FreshwaterPlanktic+[29,59]
SynechococcalesSynechococcus sp. TAU-MAC 0499FreshwaterPlanktic[29,59]
Jaaginema sp. TAU-MAC 0110FreshwaterPlanktic[29,59]
Jaaginema sp. TAU-MAC 0210FreshwaterPlanktic[29,59]
NostocalesCalothrix epiphytica TAU-MAC 0399FreshwaterEpiphytic[29,59]
Chlorogloeopsis fritschii TAU-MAC 0599FreshwaterEpiphytic[29,59]
Raphidiopsis raciborskii TAU-MAC 1414FreshwaterPlanktic+ 1[59,60]
Trichormus variabilis TAU-MAC 1614FreshwaterPlanktic+Unpublished data
Nostoc oryzae TAU-MAC 0315FreshwaterEpiphyticUnpublished data
Nodularia sp. TAU-MAC 0717BrackishPlankticUnpublished data
Scytonema sp. TAU-MAC 1218Terrestrial caveEpilithicUnpublished data
OscillatorialesPlanktothrix agardhii TAU-MAC 0514FreshwaterPlanktic[29,59]
Phormidium sp. TAU-MAC 0517Terrestrial caveEpilithicUnpublished data
Lyngbya sp. TAU-MAC 4418Intertidal zoneEpilithicUnpublished data
1 Presence of MCs could not be unambiguously confirmed by LC–MS/MS analysis.
All strains were cultured in Erlenmeyer flasks using either BG-11 or MN (for marine or brackish strains) medium, with or without (for Nostocales strains) the addition of inorganic nitrogen [61] at 20 ± 1 °C in a 12:12 h light:dark cycle under white fluorescent lamps with a photon flux density of 10 μmol m−2 s−1 (for details on the media used, see Table A1).
Extracts from the cyanobacterial strains were prepared according to [13]. Wet biomass from each culture was harvested by centrifugation at the exponential growth phase (about 30 days) and freeze-dried. Lyophilized biomass (150 mg dry weight) from each strain was dissolved thrice in a total of 21 mL of 75% (v/v) methanol. All samples were sonicated during the first extraction step for 10 min. Methanol was finally evaporated and each pellet was resuspended in 5 mL of double-distilled water. Aqueous extracts were filtered through Whatman Polydisc TF filters (Whatman plc, Little Chalfont, UK) with a pore size of 0.2 μm.

4.2. Enzyme Inhibition Assays

Dilutions of crude cyanobacterial extracts (1:25 and 1:50) in double-distilled water (ddH2O) were used. All enzyme inhibitors were also diluted in ddH2O, at various concentrations. All assays were performed in 96-well microplates.

4.2.1. Protein Phosphatase Inhibition Assay

Potential bioactivity of the cyanobacterial extracts against PP1 activity was tested using the colorimetric method assay protocol described in [62], modified according to [28,36]. PP1 (Santa Cruz Biotechnology, Dallas, TX, USA, 1.7 U mL−1) was diluted in buffer containing 50 mM Tris-HCl (pH 7.4), 1 mg mL−1 bovine serum albumin (BSA), 1 mM MnCl2, and 2 mM dithiothreitol (DTT). The substrate, p-nitrophenyl phosphate (p-NPP, 5.5 mg mL−1), was diluted in buffer containing 50 mM Tris-HCl (pH 8.1), 0.5 mg mL−1 BSA, 20 mM MgCl2 × 6H2O, and 0.2 mM MnCl2 × 4H2O. Microcystin-LR (Enzo Life Sciences, Farmingdale, NY, USA) was used as standard PP1 inhibitor. Then, 10 μL of either sample or inhibitor solution + 10 μL of enzyme solution were added in each well and the reaction started by adding 200 μL of p-NPP. Loaded microplates were incubated for 2 h at 37 °C and absorbance was measured with a microplate reader at 405 nm.

4.2.2. Trypsin Inhibition Assay

Extracts were tested for trypsin inhibition using the assay described by [42], with modifications. Porcine trypsin (1 mg mL−1) and its substrate, Nα-benzoyl-DL-arginine 4-nitroanilide hydrochloride (BAPNA, Santa Cruz Biotechnology, 2 mM), were diluted in buffer containing 50 mM Tris-HCl (pH 7.5), 100 mM NaCl, and 1 mM CaCl2. Aprotinin was used as enzyme inhibitor. A total of 10 μL of sample/inhibitor solution/ddH2O + 10 μL of enzyme + 100 μL of buffer were added in each well and preincubated for 5 min at 36 °C. Afterwards, 100 μL of substrate were loaded and the mixture was incubated for 20 min at the same temperature. Absorbance was measured at 405 nm.

4.2.3. Elastase Inhibition Assay

Elastase inhibition was tested using the protocol by [63], modified according to [36]. Porcine elastase (75 μg mL−1) and its substrate, N-succinyl-Ala-Ala-Ala-p-nitroanilide (2 mM) were diluted in 0.2 M Tris-HCl (pH 8) buffer. Elastatinal was used as enzyme inhibitor. Then, 10 μL of sample/inhibitor solution/ddH2O + 10 μL of enzyme + 150 μL of buffer were added in each well and preincubated for 15 min. The reaction was started by adding 30 μL of substrate and the mixture was incubated for another 10 min. Absorbance was measured at 405 nm.

4.3. Plant Material and Treatments

Rice (Oryza sativa cv. Axios), generously provided by the National Cereal Institute (Thessaloniki, Greece), was germinated on moistened filter paper at 24 ± 1 °C in the dark. Four- to five-day-old seedlings were transferred in Eppendorf tubes containing either aqueous cyanobacterial extracts or double-distilled water (control) and placed with their roots submerged for various time periods (1, 12, or 24 h) under the same conditions as during germination. After treatment, root tips were prepared for fluorescence microscopy. All chemicals and reagents were purchased from Applichem (Darmstadt, Germany), Sigma-Aldrich (Taufkirchen, Germany), and Merck (Darmstadt, Germany) and all the following experimental procedures were performed at room temperature, unless otherwise stated.

4.4. Cytoskeletal Studies

4.4.1. Tubulin Immunolabeling

For microtubule observations, control and extract-treated root rips were excised and fixed in 4% (w/v) paraformaldehyde (PFA) solution in PEM buffer (50 mM PIPES, 5 mM EGTA, 5 mM MgSO4, pH 6.8) + 5% (v/v) dimethyl sulfoxide (DMSO) for 1 h. Fixed specimens underwent cell wall digestion with a 3% (w/v) Macerozyme R-10 + 3% (w/v) cellulase Onozuka R-10 (Duchefa Biochemie, Haarlem, The Netherlands) solution in PEM, for 90 min. After digestion, root tips were squashed gently on coverslips coated with poly-l-lysine and the released cells were left to dry and adhere. Afterwards, they were extracted with a 5% (v/v) DMSO + 1% (v/v) Triton X-100 solution in phosphate-buffered saline (PBS, pH 7.2), for 1 h. Rat anti-α-tubulin (YOL 1/34, Bio-Rad Laboratories, Hercules, CA, USA or Santa Cruz Biotechnology, Dallas, TX, USA) was used as primary antibody (diluted 1:50 in PBS, incubated overnight) and anti-rat IgG Alexa Fluor 488 (Cell Signaling Technology, Danvers, MA, USA) as secondary antibody (diluted 1:300 in PBS, incubated at 37 °C for 2 h). DNA counterstaining was performed using 4′,6-diamidino-2-phenylindole (DAPI) for 5 min. Finally, specimens were mounted with anti-fade medium (PBS 1:2 glycerol (v/v) + 0.5% (w/v) p-phenylenediamine).

4.4.2. F-actin Labeling

F-actin was labeled with fluorescent phalloidin, according to [64], with slight modifications. F-actin in rice root tips was prestabilized with 300 μM m-maleimidobenzoyl-N-hydroxysuccinimide ester in PEM + 0.1% (v/v) Triton X-100 for 30 min in the dark and fixed with 4% (w/v) PFA in PEM + 5% (v/v) DMSO + 0.1% (v/v) Triton X-100 + DyLight 554-phalloidin (Cell Signaling Technology, Danvers, MA, USA) 1:400 for better F-actin preservation. Fixed specimens were washed with PEM, extracted in 5% (v/v) DMSO + 1% (v/v) Triton X-100 in PBS for 1 h and incubated with DyLight 554-phalloidin (diluted 1:40 in PBS) at 37 °C for 2 h. DNA was counterstained with DAPI and all specimens were mounted with antifade medium.

4.4.3. Confocal Fluorescence Microscopy

Cytoskeletal elements in fluorescent specimens were observed under a Zeiss Observer.Z1 (Carl Zeiss AG, Munich, Germany) microscope, equipped with the LSM780 confocal laser scanning (CLSM) module and the appropriate filters for each fluorophore. Imaging was achieved with ZEN2011 software, according to the manufacturer’s instructions.

4.4.4. Fluorescence Intensity Measurements

Fluorescence intensity measurements of F-actin in control and extract-treated root tip cells (from the meristematic and differentiation zone) were performed in maximum intensity projections of serial CLSM sections with ImageJ (https://imagej.net/Fiji), according to [65]. The corrected total cell fluorescence (CTCF; [66]), was calculated with the formula: CTCF = integrated density − (area of selected cell × mean fluorescence of background readings). Thirty individual cells from three different roots per treatment were measured for fluorescence intensity and results were statistically analyzed (ANOVA with Dunnett’s test) with GraphPad Prism, at a significance of p < 0.05.

4.5. Detection of Hydrogen Peroxide Production

H2O2 was detected using 2,7-dichlorofluorescein diacetate (DCF-DA), according to [67,68]. Extract-treated rice seedlings were incubated with their roots submerged in 25 μM DCF-DA aqueous solution for 30 min, washed with double-distilled water, and examined under a Zeiss AxioImager.Z2 light microscope (Carl Zeiss AG, Munich, Germany), equipped with an AxioCam MRc5 camera (Carl Zeiss AG). Seedlings treated with double-distilled water +5% DMSO for 24 h or 10 mM H2O2 for 1 h, were used as positive and negative control, respectively. Images were captured using AxioVision Rel. 4.8.2 software (Carl Zeiss AG).

5. Conclusions

According to our observations, not only MC+ extracts, but also MC− extracts from various non-MC-producing cyanobacterial strains (isolated from a multitude of environments) were able to induce alterations in both plant cytoskeletal components, i.e., F-actin and microtubules, in Oryza sativa (rice) root cells (Table 2). This is the first report of cyanobacterial extracts, not containing any known cyanotoxins, affecting the plant cytoskeleton. Therefore, it is supported that MCs or cylindrospermopsin are not the only cyanobacterial compounds able to induce cytoskeletal alterations in plant cells. Certain, but not all, MC− extracts also raised H2O2 levels in treated roots, which is an implication that oxidative stress is not necessarily involved in the cytoskeletal alterations observed. Obviously, several bioactive compounds may be present in the extracts of non-MC-producing cyanobacterial strains, the identity and mode of action of which remains to be revealed by future studies.

Author Contributions

Conceptualization, D.P., S.G. and E.P.; methodology, D.P., M.P., S.G., E.P.; investigation, D.P., M.P.; resources, S.G., E.P.; data curation, I.-D.S.A., D.P.; writing—original draft preparation, D.P., M.P., I.-D.S.A.; writing—review and editing, S.G., E.P.; supervision, E.P.; All authors have read and agreed to the published version of the manuscript.

Funding

This research was co-financed by Greece and the European Union (European Social Fund—ESF) through the Operational Programme “Human Resources Development, Education and Lifelong Learning” in the context of the project “Strengthening Human Resources Research Potential via Doctorate Research” (MIS-5000432), implemented by the State Scholarships Foundation (ΙΚΥ). D.P. is a State Scholarships Foundation scholar. I.-D.S.A. was funded by the National and Kapodistrian University of Athens. E.P. was funded by the AUTh Research Committee, grant number 91913.

Acknowledgments

The authors would like to sincerely thank Hanna Mazur-Marzec, Agata Błaszczyk and Anna Toruńska-Sitarz (Institute of Oceanography, University of Gdańsk, Poland) for generously providing a stock of PP1, as well as technical advice on the enzyme inhibition assays.

Conflicts of Interest

The authors declare no conflict of interest. The funders had no role in the design of the study; in the collection, analyses, or interpretation of data; in the writing of the manuscript, or in the decision to publish the results.

Abbreviations

CLSMConfocal laser scanning microscope
CTCFCorrected total cell fluorescence
DAPI4′,6-diamidino-2-phenylindole
DCF-DA2,7-dichlorofluorescein diacetate
DMSODimethyl sulfoxide
LC–MS/MSLiquid chromatography with tandem mass spectrometry
MCMicrocystin
MC+Microcystin-rich
MC−Microcystin-devoid
PBSPhosphate buffer saline
PEMPIPES EGTA MgSO4
PFAParaformaldehyde
PPBPreprophase band
PP1Protein phosphatase 1
PP2AProtein phosphatase 2A
ROSReactive oxygen species

Appendix A

Table A1. The studied cyanobacterial strains: relevant information and media used for culture. “BG-11” and “MN”: contains NaNO3. “BG-110” and “MN0”: no NaNO3 added. For MN medium, 75% (v/v) seawater was used, according to references.
Taxonomic OrderStrainCulture MediumReferences
ChroococcalesMicrocystis flos-aquae TAU-MAC 1410BG-11[61,69]
Microcystis viridis TAU-MAC 1810BG-11
Microcystis sp. TAU-MAC 2410BG-11
SynechococcalesSynechococcus sp. TAU-MAC 0499BG-11
Jaaginema sp. TAU-MAC 0110BG-11
Jaaginema sp. TAU-MAC 0210BG-11
NostocalesCalothrix epiphytica TAU-MAC 0399BG-110
Chlorogloeopsis fritschii TAU-MAC 0599BG-110
Raphidiopsis raciborskii TAU-MAC 1414BG-110
Trichormus variabilis TAU-MAC 1614BG-110
Nostoc oryzae TAU-MAC 0315BG-110
Nodularia sp. TAU-MAC 0717MN0
Scytonema sp. TAU-MAC 1218BG-110
OscillatorialesPlanktothrix agardhii TAU-MAC 0514BG-11
Phormidium sp. TAU-MAC 0517BG-11
Lyngbya sp. TAU-MAC 4418MN

References

  1. Codd, G.A.; Meriluoto, J.; Metcalf, J.S. Introduction: Cyanobacteria, Cyanotoxins, Their Human Impact, and Risk Management. In Handbook of Cyanobacterial Monitoring and Cyanotoxin Analysis; Meriluoto, J., Spoof, L., Codd, G.A., Eds.; John Wiley & Sons: Chichester, West Sussex, UK, 2017; pp. 3–8. [Google Scholar]
  2. Huang, I.S.; Zimba, P.V. Cyanobacterial bioactive metabolites—A review of their chemistry and biology. Harmful Algae 2019, 83, 42–94. [Google Scholar] [CrossRef]
  3. Demay, J.; Bernard, C.; Reinhardt, A.; Marie, B. Natural products from cyanobacteria: Focus on Beneficial Activities. Mar. Drugs 2019, 17, 320. [Google Scholar] [CrossRef] [Green Version]
  4. Campos, A.; Vasconcelos, V. Molecular mechanisms of microcystin toxicity in animal cells. Int. J. Mol. Sci. 2010, 11, 268–287. [Google Scholar] [CrossRef] [PubMed] [Green Version]
  5. Zhou, M.; Tu, W.; Xu, J. Mechanisms of microcystin-LR-induced cytoskeletal disruption in animal cells. Toxicon 2015, 101, 92–100. [Google Scholar] [CrossRef] [PubMed]
  6. Zilliges, Y.; Kehr, J.-C.; Meissner, S.; Ishida, K.; Mikkat, S.; Hagemann, M.; Kaplan, A.; Börner, T.; Dittmann, E. The cyanobacterial hepatotoxin microcystin binds to proteins and increases the fitness of Microcystis under oxidative stress conditions. PLoS ONE 2011, 6, e17615. [Google Scholar] [CrossRef] [PubMed] [Green Version]
  7. MacKintosh, C.; Beattie, K.A.; Klumpp, S.; Cohen, P.; Codd, G.A. Cyanobacterial microcystin-LR is a potent and specific inhibitor of protein phosphatases 1 and 2A from both mammals and higher plants. FEBS Lett. 1990, 264, 187–192. [Google Scholar] [CrossRef] [Green Version]
  8. Honkanen, R.E.; Zwiller, J.; Mooren, R.E.; Daily, S.L.; Khatra, B.S.; Dukelow, M.; Boynton, A.L. Characterization of microcystin- LR, a potent inhibitor of type 1 and type 2A protein phosphatases. J. Biol. Chem. 1990, 265, 19401–19404. [Google Scholar]
  9. Moura, M.; Conde, C. Phosphatases in mitosis: Roles and regulation. Biomolecules 2019, 9, 55. [Google Scholar] [CrossRef] [Green Version]
  10. Hoffman, A.; Taleski, G.; Sontag, E. The protein serine/threonine phosphatases PP2A, PP1 and calcineurin: A triple threat in the regulation of the neuronal cytoskeleton. Mol. Cell. Neurosci. 2017, 84, 119–131. [Google Scholar] [CrossRef]
  11. Machado, J.; Campos, A.; Vasconcelos, V.; Freitas, M. Effects of microcystin-LR and cylindrospermopsin on plant-soil systems: A review of their relevance for agricultural plant quality and public health. Environ. Res. 2017, 153, 191–204. [Google Scholar] [CrossRef] [Green Version]
  12. Máthé, C.; M-Hamvas, M.; Vasas, G. Microcystin-LR and cylindrospermopsin induced alterations in chromatin organization of plant cells. Mar. Drugs 2013, 11, 3689–3717. [Google Scholar] [CrossRef] [Green Version]
  13. Pappas, D.; Gkelis, S.; Panteris, E. The effects of microcystin-LR in Oryza sativa root cells: F-actin as a new target of cyanobacterial toxicity. Plant Biol. 2020, 22, 839–849. [Google Scholar] [CrossRef] [PubMed]
  14. Camilleri, C.; Azimzadeh, J.; Pastuglia, M.; Bellini, C.; Grandjean, O.; Bouchez, D. The Arabidopsis TONNEAU 2 gene encodes a putative novel protein phosphatase 2A regulatory subunit essential for the control of the cortical cytoskeleton. Plant Cell 2002, 14, 833–845. [Google Scholar] [CrossRef] [PubMed] [Green Version]
  15. Wen, F.; Wang, J.; Xing, D. A protein phosphatase 2A catalytic subunit modulates blue light-induced chloroplast avoidance movements through regulating actin cytoskeleton in Arabidopsis. Plant Cell Physiol. 2012, 53, 1366–1379. [Google Scholar] [CrossRef]
  16. Samofalova, D.O.; Karpov, P.A.; Raevsky, A.V.; Blume, Y.B. Protein phosphatases potentially associated with regulation of microtubules, their spatial structure reconstruction and analysis. Cell Biol. Int. 2019, 43, 1081–1090. [Google Scholar] [CrossRef] [PubMed]
  17. Pflugmacher, S.; Jung, K.; Lundvall, L.; Neumann, S.; Peuthert, A. Effects of cyanobacterial toxins and cyanobacterial cell-free crude extract on germination of alfalfa (Medicago sativa) and induction of oxidative stress. Environ. Toxicol. Chem. 2006, 25, 2381–2387. [Google Scholar] [CrossRef] [PubMed]
  18. Saqrane, S.; El Ghazali, I.; Ouahid, Y.; El Hassni, M.; El Hadrami, I.; Bouarab, L.; del Campo, F.F.; Oudra, B.; Vasconcelos, V. Phytotoxic effects of cyanobacteria extract on the aquatic plant Lemna gibba: Microcystin accumulation, detoxication and oxidative stress induction. Aquat. Toxicol. 2007, 83, 284–294. [Google Scholar] [CrossRef]
  19. Prieto, A.; Campos, A.; Cameán, A.; Vasconcelos, V. Effects on growth and oxidative stress status of rice plants (Oryza sativa) exposed to two extracts of toxin-producing cyanobacteria (Aphanizomenon ovalisporum and Microcystis aeruginosa). Ecotoxicol. Environ. Saf. 2011, 74, 1973–1980. [Google Scholar] [CrossRef]
  20. Quan, L.J.; Zhang, B.; Shi, W.W.; Li, H.Y. Hydrogen peroxide in plants: A versatile molecule of the reactive oxygen species network. J. Integr. Plant Biol. 2008, 50, 2–18. [Google Scholar] [CrossRef]
  21. Pflugmacher, S. Promotion of oxidative stress in the aquatic macrophyte Ceratophyllum demersum during biotransformation of the cyanobacterial toxin microcystin-LR. Aquat. Toxicol. 2004, 70, 169–178. [Google Scholar] [CrossRef]
  22. Chen, J.; Han, F.X.; Wang, F.; Zhang, H.; Shi, Z. Accumulation and phytotoxicity of microcystin-LR in rice (Oryza sativa). Ecotoxicol. Environ. Saf. 2012, 76, 193–199. [Google Scholar] [CrossRef] [PubMed]
  23. Yin, L.; Huang, J.; Huang, W.; Li, D.; Wang, G.; Liu, Y. Microcystin-RR-induced accumulation of reactive oxygen species and alteration of antioxidant systems in tobacco BY-2 cells. Toxicon 2005, 46, 507–512. [Google Scholar] [CrossRef] [PubMed]
  24. Jiang, J.; Gu, X.; Song, R.; Wang, X.; Yang, L. Microcystin-LR induced oxidative stress and ultrastructural alterations in mesophyll cells of submerged macrophyte Vallisneria natans (Lour.) Hara. J. Hazard. Mater. 2011, 190, 188–196. [Google Scholar] [CrossRef] [PubMed]
  25. Huang, W.; Xing, W.; Li, D.; Liu, Y. Microcystin-RR induced apoptosis in tobacco BY-2 suspension cells is mediated by reactive oxygen species and mitochondrial permeability transition pore status. Toxicol. Vitr. 2008, 22, 328–337. [Google Scholar] [CrossRef]
  26. Janssen, E.M.L. Cyanobacterial peptides beyond microcystins—A review on co-occurrence, toxicity, and challenges for risk assessment. Water Res. 2019, 151, 488–499. [Google Scholar] [CrossRef]
  27. Zervou, S.K.; Gkelis, S.; Kaloudis, T.; Hiskia, A.; Mazur-Marzec, H. New microginins from cyanobacteria of Greek freshwaters. Chemosphere 2020, 248, 125961. [Google Scholar] [CrossRef]
  28. Gkelis, S.; Lanaras, T.; Sivonen, K. The presence of microcystins and other cyanobacterial bioactive peptides in aquatic fauna collected from Greek freshwaters. Aquat. Toxicol. 2006, 78, 32–41. [Google Scholar] [CrossRef]
  29. Gkelis, S.; Panou, M.; Konstantinou, D.; Apostolidis, P.; Kasampali, A.; Papadimitriou, S.; Kati, D.; Di Lorenzo, G.M.; Ioakeim, S.; Zervou, S.-K.; et al. Diversity, cyanotoxin production, and bioactivities of cyanobacteria isolated from freshwaters of Greece. Toxins 2019, 11, 436. [Google Scholar] [CrossRef] [Green Version]
  30. Chen, J.; Song, L.; Dai, J.; Gan, N.; Liu, Z. Effects of microcystins on the growth and the activity of superoxide dismutase and peroxidase of rape (Brassica napus L.) and rice (Oryza sativa L.). Toxicon 2004, 43, 393–400. [Google Scholar] [CrossRef]
  31. Pflugmacher, S.; Aulhorn, M.; Grimm, B. Influence of a cyanobacterial crude extract containing microcystin-LR on the physiology and antioxidative defence systems of different spinach variants. New Phytol. 2007, 175, 482–489. [Google Scholar] [CrossRef]
  32. Liang, C.; Liu, H. Response of hormone in rice seedlings to irrigation contaminated with cyanobacterial extract containing microcystins. Chemosphere 2020, 256, 127157. [Google Scholar] [CrossRef]
  33. Fairhurst, T.H.; Dobermann, A. Rice in the Global Food Supply. Better Crops Int. 2002, 16, 3–6. [Google Scholar]
  34. Peuthert, A.; Chakrabarti, S.; Pflugmacher, S. Uptake of microcystins-LR and -LF (cyanobacterial toxins) in seedlings of several important agricultural plant species and the correlation with cellular damage (lipid peroxidation). Environ. Toxicol. 2007, 22, 436–442. [Google Scholar] [CrossRef] [PubMed]
  35. Kittler, K.; Schreiner, M.; Krumbein, A.; Manzei, S.; Koch, M.; Rohn, S.; Maul, R. Uptake of the cyanobacterial toxin cylindrospermopsin in Brassica vegetables. Food Chem. 2012, 133, 875–879. [Google Scholar] [CrossRef]
  36. Mazur-Marzec, H.; Błaszczyk, A.; Felczykowska, A.; Hohlfeld, N.; Kobos, J.; Toruńska-Sitarz, A.; Devi, P.; Montalvão, S.; D’souza, L.; Tammela, P.; et al. Baltic cyanobacteria—A source of biologically active compounds. Eur. J. Phycol. 2015, 50, 343–360. [Google Scholar] [CrossRef] [Green Version]
  37. Lifshits, M.; Zafrir-Ilan, E.; Raveh, A.; Carmeli, S. Protease inhibitors from three fishpond water blooms of Microcystis spp. Tetrahedron 2011, 67, 4017–4024. [Google Scholar] [CrossRef]
  38. Namikoshi, M.; Rinehart, K.L. Bioactive compounds produced by cyanobacteria. J. Ind. Microbiol. Biotechnol. 1996, 17, 373–384. [Google Scholar] [CrossRef]
  39. Jaspars, M.; Lawton, L.A. Cyanobacteria—A novel source of pharmaceuticals. Curr. Opin. Drug Discov. Dev. 1998, 1, 77–84. [Google Scholar]
  40. Kodani, S.; Ishida, K.; Murakami, M. Dehydroradiosumin, a trypsin inhibitor from the cyanobacterium Anabaena cylindrica. J. Nat. Prod. 1998, 61, 854–856. [Google Scholar] [CrossRef] [PubMed]
  41. Ploutno, A.; Shoshan, M.; Carmeli, S. Three novel protease inhibitors from a natural bloom of the cyanobacterium Microcystis aeruginosa. J. Nat. Prod. 2002, 65, 973–978. [Google Scholar] [CrossRef]
  42. Pluotno, A.; Carmeli, S. Banyasin A and banyasides A and B, three novel modified peptides from a water bloom of the cyanobacterium Nostoc sp. Tetrahedron 2005, 61, 575–583. [Google Scholar] [CrossRef]
  43. Grach-Pogrebinsky, O.; Sedmak, B.; Carmeli, S. Protease inhibitors from a Slovenian Lake Bled toxic waterbloom of the cyanobacterium Planktothrix rubescens. Tetrahedron 2003, 59, 8329–8336. [Google Scholar] [CrossRef]
  44. Bubik, A.; Sedmak, B.; Novinec, M.; Lenarčič, B.; Lah, T.T. Cytotoxic and peptidase inhibitory activities of selected non-hepatotoxic cyclic peptides from cyanobacteria. Biol. Chem. 2008, 389, 1339–1346. [Google Scholar] [CrossRef] [PubMed]
  45. Nagarajan, M.; Maruthanayagam, V.; Sundararaman, M. A review of pharmacological and toxicological potentials of marine cyanobacterial metabolites. J. Appl. Toxicol. 2012, 32, 153–185. [Google Scholar] [CrossRef]
  46. Reeck, G.R.; Kramer, K.J.; Baker, J.E.; Kanost, M.R.; Fabrick, J.A.; Behnke, C.A. Proteinase inhibitors and resistance of transgenic plants to insects. In Advances in Insect Control: The Role of Transgenic Plants; Carozzi, N., Koziel, M., Eds.; Taylor & Francis: London, UK, 1997; pp. 157–183. [Google Scholar]
  47. Lawrence, P.; Koundal, K. Plant protease inhibitors in control of phytophagous insects. Electron. J. Biotechnol. 2002, 5, 5–6. [Google Scholar] [CrossRef]
  48. McElhiney, J.; Lawton, L.A.; Leifert, C. Investigations into the inhibitory effects of microcystins on plant growth, and the toxicity of plant tissues following exposure. Toxicon 2001, 39, 1411–1420. [Google Scholar] [CrossRef]
  49. Llana-Ruiz-Cabello, M.; Jos, A.; Cameán, A.; Oliveira, F.; Barreiro, A.; MacHado, J.; Azevedo, J.; Pinto, E.; Almeida, A.; Campos, A.; et al. Analysis of the use of cylindrospermopsin and/or microcystin-contaminated water in the growth, mineral content, and contamination of Spinacia oleracea and Lactuca sativa. Toxins 2019, 11, 624. [Google Scholar] [CrossRef] [Green Version]
  50. Beyer, D.; Surányi, G.; Vasas, G.; Roszik, J.; Erdodi, F.; M-Hamvas, M.; Bácsi, I.; Bátori, R.; Serfozo, Z.; Szigeti, Z.M.; et al. Cylindrospermopsin induces alterations of root histology and microtubule organization in common reed (Phragmites australis) plantlets cultured in vitro. Toxicon 2009, 54, 440–449. [Google Scholar] [CrossRef]
  51. Beyer, D.; Tándor, I.; Kónya, Z.; Bátori, R.; Roszik, J.; Vereb, G.; Erddi, F.; Vasas, G.; M-Hamvas, M.; Jambrovics, K.; et al. Microcystin-LR, a protein phosphatase inhibitor, induces alterations in mitotic chromatin and microtubule organization leading to the formation of micronuclei in Vicia faba. Ann. Bot. 2012, 110, 797–808. [Google Scholar] [CrossRef] [Green Version]
  52. Livanos, P.; Galatis, B.; Apostolakos, P. The interplay between ROS and tubulin cytoskeleton in plants. Plant Signal. Behav. 2014, 9, e28069. [Google Scholar] [CrossRef]
  53. Li, J.; Cao, L.; Staiger, C.J. Capping protein modulates actin remodeling in response to reactive oxygen species during plant innate immunity. Plant Physiol. 2017, 173, 1125–1136. [Google Scholar] [CrossRef] [PubMed]
  54. Calteau, A.; Fewer, D.P.; Latifi, A.; Coursin, T.; Laurent, T.; Jokela, J.; Kerfeld, C.A.; Sivonen, K.; Piel, J.; Gugger, M. Phylum-wide comparative genomics unravel the diversity of secondary metabolism in Cyanobacteria. BMC Genom. 2014, 15, 977. [Google Scholar] [CrossRef] [PubMed] [Green Version]
  55. Mazard, S.; Penesyan, A.; Ostrowski, M.; Paulsen, I.; Egan, S. Tiny microbes with a big impact: The role of cyanobacteria and their Metabolites in shaping our future. Mar. Drugs 2016, 14, 97. [Google Scholar] [CrossRef] [PubMed]
  56. Codd, G.A.; Lindsay, J.; Young, F.M.; Morrison, L.F.; Metcalf, J.S. Harmful Cyanobacteria. In Harmful Cyanobacteria; Huisman, J., Matthijs, H.C.P., Visser, P.M., Eds.; Springer: Dordrecht, The Netherlands, 2005; pp. 1–23. [Google Scholar]
  57. Gkelis, S.; Panou, M.; Chronis, I.; Zervou, S.K.; Christophoridis, C.; Manolidi, K.; Ntislidou, C.; Triantis, T.M.; Kaloudis, T.; Hiskia, A.; et al. Monitoring a newly re-born patient: Water quality and cyanotoxin occurrence in a reconstructed shallow mediterranean lake. Adv. Oceanogr. Limnol. 2017, 8. [Google Scholar] [CrossRef] [Green Version]
  58. Huisman, J.; Codd, G.A.; Paerl, H.W.; Ibelings, B.W.; Verspagen, J.M.H.; Visser, P.M. Cyanobacterial blooms. Nat. Rev. Microbiol. 2018, 16, 471–483. [Google Scholar] [CrossRef]
  59. Gkelis, S.; Panou, M. Capturing biodiversity: Linking a cyanobacteria culture collection to the “scratchpads” virtual research environment enhances biodiversity knowledge. Biodivers. Data J. 2016, 4, e7965-1. [Google Scholar] [CrossRef] [Green Version]
  60. Panou, M.; Zervou, S.K.; Kaloudis, T.; Hiskia, A.; Gkelis, S. A Greek Cylindrospermopsis raciborskii strain: Missing link in tropic invader’s phylogeography tale. Harmful Algae 2018, 80, 96–106. [Google Scholar] [CrossRef]
  61. Rippka, R. Isolation and purification of cyanobacteria. Methods Enzymol. 1988, 167, 3–27. [Google Scholar]
  62. An, J.S.; Carmichael, W.W. Use of a colorimetric protein phosphatase inhibition assay and enzyme linked immunosorbent assay for the study of microcystins and nodularins. Toxicon 1994, 32, 1495–1507. [Google Scholar] [CrossRef]
  63. Kwan, J.C.; Taori, K.; Paul, V.J.; Luesch, H. Lyngbyastatins 8–10, elastase inhibitors with cyclic depsipeptide scaffolds isolated from the marine cyanobacterium Lyngbya semiplena. Mar. Drugs 2009, 7, 528–538. [Google Scholar] [CrossRef] [Green Version]
  64. Panteris, E.; Achlati, T.; Daras, G.; Rigas, S. Stomatal complex development and F-actin organization in maize leaf epidermis depend on cellulose synthesis. Molecules 2018, 23, 1365. [Google Scholar] [CrossRef] [PubMed] [Green Version]
  65. Adamakis, I.-D.S.; Panteris, E.; Eleftheriou, E.P. The nitrate reductase inhibitor, tungsten, disrupts actin microfilaments in Zea mays L. Protoplasma 2014, 251, 567–574. [Google Scholar] [CrossRef] [PubMed]
  66. Gavet, O.; Pines, J. Activation of cyclin B1-Cdk1 synchronizes events in the nucleus and the cytoplasm at mitosis. J. Cell Biol. 2010, 189, 247–259. [Google Scholar] [CrossRef] [PubMed]
  67. Livanos, P.; Galatis, B.; Quader, H.; Apostolakos, P. Disturbance of reactive oxygen species homeostasis induces atypical tubulin polymer formation and affects mitosis in root-tip cells of Triticum turgidum and Arabidopsis thaliana. Cytoskeleton 2012, 69, 1–21. [Google Scholar] [CrossRef] [PubMed]
  68. Eleftheriou, E.P.; Adamakis, I.-D.S.; Panteris, E.; Fatsiou, M. Chromium-induced ultrastructural changes and oxidative stress in roots of Arabidopsis thaliana. Int. J. Mol. Sci. 2015, 16, 15852–15871. [Google Scholar] [CrossRef] [PubMed] [Green Version]
  69. Waterbury, J.B.; Stanier, R.Y. Patterns of growth and development in pleurocapsalean cyanobacteria. Microbiol. Rev. 1978, 42, 2–44. [Google Scholar] [CrossRef] [PubMed]
Figure 1. Single cortical confocal laser scanning microscope (CLSM) section (A) and maximum intensity projection of serial CLSM sections (B) of control Oryza sativa root, depicting protodermal cells in the apical meristem (A) and epidermal cells in the elongation zone (B), after F-actin staining. Root tips in both images point towards the bottom of the page. Control meristematic cells exhibit abundant fine cortical actin filaments, with a dominant transverse orientation (A), while elongating cells typically exhibit large, longitudinal subcortical F-actin cables (B). Scale bars: 10 μm.
Ijms 21 09649 g001
Figure 2. Single cortical CLSM sections of Oryza sativa root protodermal cells stained for F-actin, after treatment with MC+ extracts from various MC-producing strains: Microcystis flos-aquae TAU-MAC 1410 (AC), Microcystis sp. TAU-MAC 2410 (DF), Raphidiopsis raciborskii TAU-MAC 1414 (GI), and Trichormus variabilis TAU-MAC 1614 (JL). Root tips in all images point towards the bottom of the page. After 1 h of treatment, actin filaments were disoriented and branched (A; cf. Figure 1A) and tended to form bundles (arrows in D,G) or even rings (arrowheads in G). After 12 h, bundling (arrows in B,E,H) and disorientation (E,H,K) appeared intensified. After 24 h, the F-actin network deteriorated significantly (F,L) and appeared disoriented (I), or even collapsed (C). Circular actin aggregates (arrowhead in F) and ring-shaped conformations (arrowhead in I) could also be detected. Scale bars: 10 μm.
Ijms 21 09649 g002
Figure 3. Maximum intensity projections of serial CLSM sections of Oryza sativa epidermal cells in the root elongation zone, stained for F-actin, after treatment with MC+ extracts from various MC-producing strains: Microcystis flos-aquae TAU-MAC 1410 (AC), Microcystis sp. TAU-MAC 2410 (DF), Raphidiopsis raciborskii TAU-MAC 1414 (GI), and Trichormus variabilis TAU-MAC 1614 (JL). Root tips in all images point towards the bottom of the page. After 1 h of treatment (A,D,G,J) F-actin network appeared almost unaffected, compared to the control (Figure 1B). After 12 h, actin cables appeared highly affected, being either fragmented (B), disoriented (arrows in E,H), or scarce (K, note also the actin ring indicated by arrowhead). After 24 h, F-actin either disappeared (C,L) or was fragmented (F). Actin aggregates could also be detected (arrows in I). Scale bars: 10 μm.
Ijms 21 09649 g003
Figure 4. Single cortical CLSM sections of Oryza sativa root protodermal cells stained for F-actin, after treatment with MC− extracts, from various non-MC-producing strains: Jaaginema sp. TAU-MAC 0110 (AC), Jaaginema sp. TAU-MAC 0210 (DF), and Microcystis viridis TAU-MAC 1810 (GI). Root tips in all images point towards the bottom of the page. The 1 h of treatment led to disorientation (A) and bundling (arrows in A,D,G) of F-actin. After 12 h, disorientation and bundling effects were more intense (arrows in B,E) or F-actin was fragmented (H). In some cases, cells devoid of F-actin could be observed (arrowheads in B). After 24 h, F-actin was degraded (C) and disoriented/bundled (arrows in F), or even disappeared (I). Scale bars: 10 μm.
Ijms 21 09649 g004
Figure 5. Single cortical CLSM sections of Oryza sativa root protodermal cells stained for F-actin, after treatment with MC− extracts from various non-MC-producing strains: Calothrix epiphytica TAU-MAC 0399 (AC), Synechococcus sp. TAU-MAC 0499 (DF), Chlorogloeopsis fritschii TAU-MAC 0599 (GI), and Planktothrix agardhii TAU-MAC 1614 (JL). Root tips in all images point towards the bottom of the page. Cells treated for 1 h exhibited disoriented/branched and bundled (arrows in A,D,G,J) cortical actin filaments, along with actin aggregates (arrowhead in A) and actin rings (arrowheads in J) in some cases. Scarce disoriented (B,H) and bundled (arrows in E,H,K) were also reported after 12 h, while, occasionally, cells devoid of F-actin (arrowheads in E,K) could be observed. After 24 h, actin filaments were weak and scarce (C,F,I) or heavily disoriented (L) with actin aggregates (arrows in F,L) and bundles (arrows in I), while actin rings (arrowheads in C) or cells almost without detectable F-actin (arrowheads in F,I) could be noticed. Scale bars: 10 μm.
Ijms 21 09649 g005
Figure 6. Single cortical CLSM sections of Oryza sativa root protodermal cells stained for F-actin, after treatment with MC− extracts from various non-MC-producing strains: Phormidium sp. TAU-MAC 0517 (AC), Scytonema sp. TAU-MAC 1218 (DF), Nostoc oryzae TAU-MAC 0315 (GI), and Lyngbya sp. TAU-MAC 4418 (JL). Root tips in all images point towards the bottom of the page. After 1 h of exposure to the extracts, affected cells exhibited bundled (arrows in A,G) and branched cortical actin filaments (D,J). After 12 h, the F-actin network deteriorated (B,E,H) and bundles could be observed (arrows in E,H,K), with occasional actin rings (arrowhead in B). After 24 h, actin filaments were scarce and bundled (arrows in F,I,L) or weak, with actin aggregates being detected (arrows in C). Scale bars: 10 μm.
Ijms 21 09649 g006
Figure 7. Maximum intensity projections of serial CLSM sections of Oryza sativa epidermal cells in the root elongation zone, stained for F-actin, after treatment with MC− extracts from various non-MC-producing strains: Jaaginema sp. TAU-MAC 0110 (AC), Jaaginema sp. TAU-MAC 0210 (DF), and Microcystis viridis TAU-MAC 1810 (GI). Root tips in all images point towards the bottom of the page. Actin cables were not significantly affected after 1 h of treatment (A,D), except for some actin aggregates (arrows in G). After 12 h, F-actin disorientation was visible (arrows in B,E), along with actin rings (arrowheads in E) and cells devoid of F-actin (arrowheads in B,H). After 24 h, actin rings were still detectable (arrowheads in I), as well as disorientation (C) and actin aggregates (arrows in F,I). Scale bars: 10 μm.
Ijms 21 09649 g007
Figure 8. Maximum intensity projections of serial CLSM sections of Oryza sativa epidermal cells in the root elongation zone, stained for F-actin, after treatment with MC− extracts from various non-MC-producing strains: Calothrix epiphytica TAU-MAC 0399 (AC), Synechococcus sp. TAU-MAC 0499 (DF), Chlorogloeopsis fritschii TAU-MAC 0599 (GI), and Planktothrix agardhii TAU-MAC 1614 (JL). Root tips in all images point towards the bottom of the page. After 1 h of treatment, F-actin was disoriented (arrows in A) or exhibited actin aggregates (arrowheads in D) and minor bundling effects (arrows in G,J). Diminishing of the F-actin network (B,E) and bundling of actin cables (arrows in H,K) were visible after 12 h. F-actin was further degraded after 24 h (C,F,I,L), with some bundling effects observed (arrows in I). Scale bars: 10 μm.
Ijms 21 09649 g008
Figure 9. Maximum intensity projections of serial CLSM sections of Oryza sativa epidermal cells in the root elongation zone, stained for F-actin, after treatment with MC− extracts from various non-MC-producing strains: Phormidium sp. TAU-MAC 0517 (AC), Scytonema sp. TAU-MAC 1218 (DF), Nostoc oryzae TAU-MAC 0315 (GI), and Lyngbya sp. TAU-MAC 4418 (JL). Root tips in all images point towards the bottom of the page. Cells treated for 1 h either exhibited minor bundling of F-actin (arrows in A,G) or retained a control-like state (D,J; cf. Figure 1B), with occasional minor disorientation effects (arrowheads in J). After 12 h, bundling effects remained (arrows in B) or progressed to the formation of actin aggregates (arrows in K), while disorientation of actin cables was also visible (E,H). Actin aggregates (arrows in C) and F-actin deterioration (F,I,L) were common alterations observed after 24 h of treatment. Scale bars: 10 μm.
Ijms 21 09649 g009
Figure 10. Graphs illustrating the corrected total cell fluorescence (CTCF) intensity measurements of untreated (control) and extract-treated root meristem (A) and elongation zone cells (B). Note that fluorescence intensity drops significantly even upon 1 h of treatment, especially in the elongating root cells.
Ijms 21 09649 g010
Figure 11. Single cortical (A), single central (B,K,X,Y), and maximum intensity projections of serial CLSM sections (CJ,LW,ZAD) of Oryza sativa root meristematic cells, after α-tubulin immunostaining (green) and DNA staining with DAPI (pseudo-coloration in red). Cells depicted are either control (AF) or treated for various time periods (indicated on each image) with MC+ extracts from MC-producing cyanobacterial strains: Microcystis flos-aquae TAU-MAC 1410 (GL), Microcystis sp. TAU-MAC 2410 (MU), Raphidiopsis raciborskii TAU-MAC 1414 (VX), and Trichormus variabilis TAU-MAC 1614 (YAD). Images (A) and (B) depict the same cells at cortical and central sections. (AF). Control cells at interphase exhibit dense, transverse cortical microtubules (A) and no endoplasmic microtubules (B). Preprophase/prophase cells exhibit the typical preprophase band (PPB) of microtubules (brackets in C), as well as perinuclear microtubules converging on two distinctive poles (arrows in C). Mitotic spindles with aligned chromosomes at the equator can be observed in metaphase cells (D) and control cytokinetic cells exhibit typical phragmoplasts (early stage in E and later stage in F). 1410: After 1 h of treatment, scarce and disoriented interphase microtubules were observed (G). Abnormal mitotic spindles were detected (H,I), along with cells exhibiting misoriented microtubules and abnormal chromatin condensation (J). Abnormally elongated phragmoplast microtubules were observed in cytokinetic cells (K). The 12 h of treatment led to the complete disappearance of microtubules, with chromatin also appearing highly condensed (L). 2410: After 1 h, short and disorganized microtubules were observed not only in interphase cells (M), but also in cells with uncommon chromatin condensation (N). Preprophase cells lacking perinuclear microtubules (O) were spotted, along with distorted mitotic spindles (note the misaligned chromosome outside the spindle, pointed with arrow in P). Affected cells of undefined chromatin state exhibited extremely short (Q) or misplaced and disoriented microtubules (R,S). After 12 h, only interphase cells with a sparse microtubule network were encountered (T), which eventually collapsed after 24 h (U). 1414: After 1 h of treatment, disorientation was common for both interphase (V) and perinuclear microtubules in preprophase cells (W), as well as phragmoplast microtubules in affected cytokinetic cells (X). Harsher effects were not recorded after longer treatments. 1614: After 1 h of treatment, affected cells exhibited scarce and misoriented microtubules (Y) and, in some cases, abnormally condensed and scattered chromatin (Z). After 12 h, disorientation of the microtubule network could still be observed in interphase (AA), also with abundant short perinuclear microtubules (AB). Preprophase cells without a PPB were recorded (AC). After 24 h, almost no tubulin polymers could be detected (AD). Scale bars: 5 μm.
Ijms 21 09649 g011
Figure 12. Single cortical (A,C,H,Q), single central (B,D,F,G,I,J,MO,S,T,V), and maximum intensity projections of serial (E,K,L,P,U,WZ) CLSM sections of Oryza sativa root meristematic cells, after α-tubulin immunostaining (green) and DNA staining with DAPI (pseudo-coloration in red). The cells depicted are from roots treated for various time periods (indicated on each image) with MC− extracts from non-MC-producing cyanobacterial strains: Synechococcus sp. TAU-MAC 0499 (AG), Chlorogloeopsis fritschii TAU-MAC 0599 (HL), Jaaginema sp. TAU-MAC 0110 (MP), Jaaginema sp. TAU-MAC 0210 (QU), and Microcystis sp. TAU-MAC 1810 (VZ). Images (AD) and (Q,R) depict the same cells at cortical and central sections. 0499: Affected interphase cells (AD) exhibited diminished cortical (A,C) and prevalent perinuclear (B,D) microtubules. In affected mitotic cells, short dispersed spindle microtubules (E), almost normal early phragmoplasts (F), as well as disorganized advanced phragmoplasts (G, though some long microtubules persist) with thick floating cell plates, were observed. 0599: Affected cells exhibited disoriented cortical (H) and many perinuclear and endoplasmic microtubules (I) at interphase, faint PPB and scarce perinuclear microtubules at preprophase (J, brackets indicate PPB), short spindle microtubules at metaphase (K) and long phragmoplast microtubules at cytokinesis (L). 0110: After 1 h of treatment, endoplasmic tubulin aggregations at interphase (M), absence of perinuclear microtubules at preprophase (N, brackets indicate PPB) and unilateral, long phragmoplast microtubules at cytokinesis (O) were observed in affected cells. After 12 h, disappearance of microtubules and abnormally condensed chromatin were common effects (P). 0210: After 1 h of treatment, disoriented cortical microtubules (Q), along with many endoplasmic microtubules (R) could be observed in affected interphase cells. Other defects observed were the absence of perinuclear microtubules at preprophase (S, brackets indicate PPB) and altered phragmoplasts with abnormally thick cell plates (T). After 12 h, no microtubules could be detected, and chromatin state was also abnormal (U). 1810: After 1 h of treatment, affected cells exhibited numerous endoplasmic microtubules (left cell in V), abnormally short microtubules attached to chromosomes (middle cell in V) and malformed mitotic spindles (right cell in V). Misaligned chromosomes, outside the equator plate (arrows in W) could also be observed, as well as masses of chromosomes attached to aberrant spindle-like microtubules (X,Y). After 12 h, no tubulin polymers could be detected, while chromatin was abnormally condensed (Z). Scale bars: 5 μm.
Ijms 21 09649 g012
Figure 13. Imaging of H2O2 levels in root tips of Oryza sativa, after staining with 2,7-dichlorofluorescein diacetate (DCF-DA) of control (A,H) and extract-treated roots (BG,IN). Negative control roots were treated with double-distilled water (ddH2O2, A) for 24 h, while positive control roots were exposed to an aqueous solution of 10 mM H2O2 for 1 h (H). For extract-treated roots, strain codes and treatment durations are indicated on each image. Treatment with MC+ extracts (from MC-producing strains) for 12 h (BD) and 24 h (IK) led to increased concentrations of H2O2 in the root meristematic zone. Similar effects were also observed after 12 h (EG) and 24 h (LN) of treatment with MC− extracts from certain non-MC-producing strains (0110, 0210, 1810). Scale bars: 200 μm.
Ijms 21 09649 g013
Table 1. Inhibitory effects of the cyanobacterial extracts on PP1, trypsin, and elastase, with reference to each strain. “+”: inhibition; “−“: no effect.
MCs Production StatusTAU-MAC StrainPP1 1Trypsin 1Elastase 2
MC-producingMicrocystis flos-aquae 1410++
Microcystis sp. 2410++
Trichormus variabilis 1614+++
Raphidiopsis raciborskii 1414 3+
Non-MC-producingJaaginema sp. 0110+
Jaaginema sp. 0210+
Microcystis viridis 1810+
Synechococcus sp. 0499+
Chlorogloeopsis fritschii 0599+
Calothrix epiphytica 0399+
Planktothrix agardhii 0514+
Phormidium sp. 0517+
Scytonema sp. 1218+
Nostoc oryzae 0315+
Lyngbya sp. 4418+
Nodularia sp. 0717
1 Inhibition reported at 1:25 and 1:50 dilutions. 2 Inhibition reported at 1:25 dilution. 3 Presence of MCs could not be unambiguously confirmed by LC–MS/MS analysis.
Table 2. Effects observed in rice root cells after exposure to cyanobacterial extracts, with reference to each strain. “✓”: affected; “✘”: no effect.
MCs Production StatusTAU-MAC StrainF-actinMicrotubulesH2O2 Levels
MC-producingMicrocystis flos-aquae 1410
Microcystis sp. 2410
Trichormus variabilis 1614
Raphidiopsis raciborskii 1414 13
Non-MC-producingJaaginema sp. 0110
Jaaginema sp. 0210
Microcystis viridis 1810
Synechococcus sp. 04993
Chlorogloeopsis fritschii 05993
Planktothrix agardhii 05143,4
Calothrix epiphytica 0399
Phormidium sp. 0517
Scytonema sp. 1218
Nostoc oryzae 03152
Lyngbya sp. 44182
Nodularia sp. 0717
1 Presence of MCs could not be unambiguously confirmed by LC–MS/MS analysis. 2 F-actin exhibited minor abnormalities. 3 Microtubules exhibited minor abnormalities. 4 Images not shown.
Publisher’s Note: MDPI stays neutral with regard to jurisdictional claims in published maps and institutional affiliations.

