Article

High-Resolution Mapping in Two RIL Populations Refines Major “QTL Hotspot” Regions for Seed Size and Shape in Soybean (Glycine max L.)

1
Ministry of Agriculture (MOA) Key Laboratory of Biology and Genetic Improvement of Soybean (General), State Key Laboratory for Crop Genetics and Germplasm Enhancement, Soybean Research Institute, National Center for Soybean Improvement, Nanjing Agricultural University, Nanjing 210095, China
2
Shaanxi Key Laboratory of Chinese Jujube; College of Life Science, Yan’an University, Yan’an 716000, China
*
Authors to whom correspondence should be addressed.
Int. J. Mol. Sci. 2020, 21(3), 1040; https://0-doi-org.brum.beds.ac.uk/10.3390/ijms21031040
Submission received: 27 December 2019 / Revised: 30 January 2020 / Accepted: 1 February 2020 / Published: 4 February 2020
(This article belongs to the Special Issue Legume Genetics and Biology: From Mendel's Pea to Legume Genomics)

Abstract

:
Seed size and shape are important traits determining yield and quality in soybean. However, the genetic mechanism and genes underlying these traits remain largely unexplored. In this regard, this study used two related recombinant inbred line (RIL) populations (ZY and K3N) evaluated in multiple environments to identify main and epistatic-effect quantitative trait loci (QTLs) for six seed size and shape traits in soybean. A total of 88 and 48 QTLs were detected through composite interval mapping (CIM) and mixed-model-based composite interval mapping (MCIM), respectively, and 15 QTLs were common among both methods; two of them were major (R2 > 10%) and novel QTLs (viz., qSW-1-1ZN and qSLT-20-1K3N). Additionally, 51 and 27 QTLs were identified for the first time through CIM and MCIM methods, respectively. Colocalization of QTLs occurred in four major QTL hotspots/clusters, viz., “QTL Hotspot A”, “QTL Hotspot B”, “QTL Hotspot C”, and “QTL Hotspot D” located on Chr06, Chr10, Chr13, and Chr20, respectively. Based on gene annotation, gene ontology (GO) enrichment, and RNA-Seq analysis, 23 genes within four “QTL Hotspots” were predicted as possible candidates, regulating soybean seed size and shape. Network analyses demonstrated that 15 QTLs showed significant additive x environment (AE) effects, and 16 pairs of QTLs showing epistatic effects were also detected. However, except three epistatic QTLs, viz., qSL-13-3ZY, qSL-13-4ZY, and qSW-13-4ZY, all the remaining QTLs depicted no main effects. Hence, the present study is a detailed and comprehensive investigation uncovering the genetic basis of seed size and shape in soybeans. The use of a high-density map identified new genomic regions providing valuable information and could be the primary target for further fine mapping, candidate gene identification, and marker-assisted breeding (MAB).

1. Introduction

Soybean (Glycine max L.) is one of the most economically important crops, being a rich source of both edible oil and protein, and can fix atmospheric nitrogen through a symbiotic association with microorganisms in the soil, and are used as a model plant for legume research [1]. However, over the past five decades, a continuous decline in soybean production in China has been recorded [2]. Besides, annually, China imports more than 80% of soybeans and its products to meet its domestic demands; hence, there is an immediate need to increase the domestic production of soybean to make the country self-sufficient [2]. Yield-related traits are the key target of plant breeders to improve soybean yield/production. In this regard, traits related to seed size and shape are the crucial parameters determining seed-weight and yield in soybean [3,4]. In soybean, seed size traits such as length (SL); width (SW) and thickness (ST); and seed shape traits, viz., length-to-width (SLW), length-to-thickness (SLT), and width-to-thickness (SWT) ratios determine seed appearance, quality, and yield in soybeans [5]. Seed size is also a vital fitness trait in flowering plants and plays a crucial role in adaptation to a particular environment [6]. However, seed size and shape are complex quantitative traits governed by polygenes and highly influenced by the environment (E) and genotype × environment (G × E) interactions [7,8]. Specific soy-based food products made from soybean are also determined mainly by seed size and shape [9,10]. For example, for the production of fermented soybeans (natto) and sprouts, small-seeded cultivars are suitable, while for soymilk, green soybeans (edamame), boiled soybeans (nimame), and soybean curd (tofu), large-seeded varieties are used [11,12,13]. Additionally, these traits influence the germination ability and seedling vigor, and that, in turn, plays an essential role in determining the competitive strength of the seedlings for light, nutrient resources, and stress tolerance [14,15,16].
Quantitative trait loci (QTL) analysis has proved as a powerful technique to elucidate complex trait architecture. Over the past two decades, recent advances in marker technology and statistical methods have allowed the identification of many QTLs related to seed size and shape traits. The USDA Soybean Genome Database (SoyBase, http://www.soybase.org) presently document more than 400 QTLs for seed size and shape, and the majority of them are not confirmed (http://www.soybase.org). The previous studies used mostly low-resolution and low-density molecular markers such as simple sequence repeats (SSRs) that often result in larger confidence intervals and make the use of these QTLs less effective in crop improvement [3,5,17,18]. For example, Mian et al. [19] reported 16 QTLs for seed size and shape on 12 different chromosomes of soybean. Hoeck et al. [20] identified 27 QTLs associated with seed size distributed on 16 soybean chromosomes, and Li et al. [21] detected three QTLs for SL on Chr07, Chr13, and Chr16. Lü et al. [18] identified 19 main-effect QTLs (M-QTLs) and three epistatic-effect QTLs (E-QTLs) for SL on eight chromosomes. Xie et al. [22] finely mapped QTLs for soybean seed size traits on Chr06 in the recombinant inbred line (RIL) population derived from a cross between Lishuizhongzihuang and Nannong493-1. Likewise, Che et al. [17] identified 16 QTLs for seed shape, distributed on seven linkage groups in soybeans by using the RIL population. Hu et al. [7] mapped 10 QTLs for seed shape on six chromosomes in soybeans. However, only a few yield-related stable QTLs have been identified in different genetic backgrounds and environments [23]. Hence, it is vital to identify and validate QTLs in multiple backgrounds and environments for their potential use in marker-assisted breeding (MAB). Lastly, the earlier studies mostly focused on the identification of main-effect QTLs for seed size/shape in soybean; however, minimal efforts have been made to understand complex genetic interaction effects, such as epistasis and environment effects [24,25,26].
The inheritance of quantitative traits varies from simple to complex; however, the phenotypic variation of most quantitative traits is complex, governed by many factors [27]. In addition to main-effect QTLs, phenotypic variation (PV) of complex traits is also governed by QTL by QTL (epistatic) and QTL by environment (QTL × E) interactions, which contribute significantly to complex trait variations [28]. By considering these QTL interactions in the QTL mapping model of complex traits will lead to increased precision of QTL mapping [29]. Therefore, these factors cannot be considered only as the main obstacles to dissect the genetic architecture of complex traits, but they also affect the accuracy of breeding value estimation, and thus, hinder the efficiency of breeding programs. Hence, it is imperative to consider these factors while dissecting the genetic basis of complex traits and their uses in improving plant performance. In recent years, epistatic and QTL × E interaction effects are under consideration in several crop species, including soybeans, for QTL mapping [30]. Therefore, extensive efforts are required to study such QTL interaction effects for their effective exploitation in soybean breeding.
Development of high-density genetic maps, and their use in the detection of QTLs/genes, have allowed a detailed and broader understanding of the genetic basis underlying complex quantitative traits. Furthermore, the analysis of genes has partitioned the related traits into individual Mendelian factors [31]. Nevertheless, limited reports are targeting the mapping of QTLs related to seed size and shape based on the high-density map in different genetic backgrounds. Besides, to mine candidate genes for seed size and shape in soybeans, negligible efforts were made. By keeping the above in view, the present study has used a high-density linkage map of two RIL populations, viz., ZY and K3N, evaluated in multiple environments to identify main and epistatic-effect QTLs, as well as their interactions with the environment, to mine candidate genes for seed size and shape in soybeans. These results will be helpful in MAB for developing soybean varieties with improved yield and quality, as well as to clone underlying genes for seed size and shape in soybean.

2. Results

2.1. Evaluation of Phenotypic Variation for RIL Populations

Mean, range (minimum and maximum value), standard deviation, skewness, kurtosis, heritability (h2), and coefficient of variation (CV%) associated with six soybean seed shape and size traits of two RIL populations (ZY and K3N), along with their parents, evaluated across three different environments, viz., 2012FY, 2012JP, and 2017JP, are presented in Table S1.
The difference in average phenotypic values between the contrasting parents of both RIL populations for all six traits was evident and consistent across all three individual environments (Table S1). The trait value of several RILs exceeded their parents for all studied traits in both directions, suggesting transgressive segregation in both RIL populations (Figure 1). All six traits related to seed size and shape showed different levels of distribution in both RIL populations (ZY and K3N), with mostly skewness and kurtosis <1, and the majority have CV >3%, which is typical for quantitative traits, indicating the suitability of these populations for QTL mapping (Figure 1 and Table S1a,b).
Combined ANOVA results revealed that variations among the RILs of both populations were highly significant (p < 0.0001 or p < 0.05) for all six traits (Table S2a,b). The environmental differences and G × E interaction effects were also highly significant for all the studied traits, except SLW, SLT, and SWT in the case of the K3N population (Table S2a,b). Heritability in a broad sense (h2) for both RIL populations in individual, as well as combined, environments was above 60%, indicating high heritability for all studied traits (Table S2a,b). The correlation coefficient (r2) among the six traits related to seed size and shape for both RIL populations are presented in Table S3. Correlation analysis has shown a significant positive correlation between any two seed shape size traits, and a significant negative correlation exists between seed shape and seed size traits (Table S3).

2.2. QTL Mapping of Seed Size by CIM

The high-density genetic maps of ZY and K3N populations were used to perform a linkage analysis for the identification of QTLs associated with SL, SW, and ST in soybeans. In total, we identified 50 main-effect QTLs associated with three seed size traits, viz., SL, SW, and ST, explaining the phenotypic variation (PV/R2) of 4.46–22.64%, mapped on 18 soybean chromosomes in both ZY and K3N populations across three environments, viz., 2012FY, 2012JP, and 2017JP (Table 1 and Figure 2). For seed length (SL), 14 main-effect QTLs were detected on ten different chromosomes (Table 1). Among them, qSL-9-1ZY, K3N was stable and had significant QTL with an average R2 = 10.01% and are consistently found in two individual environments (2012FY and 2017JP), as well as in both RIL populations (ZY and K3N) (Table 1). Additionally, qSL-13-1ZY, expressing a PV of 8.26%, was detected in two different environments (2017JP and 2012JP) in the ZY population (Table 1). Moreover, one minor stable QTL, qSL-4-1ZY, expressing an average PV of 6%, was consistently identified in all three studied environments, viz., 2012FY, 2012JP, and 2017JP (Table 1). Four major QTLs, viz., qSL-11-1K3N, qSL-17-1K3N, qSL-18-1K3N, and qSL-20-1K3N, with R2 > 10%, were environmental-sensitive and identified in only one environment in the K3N population (Table 1). The remaining seven minor QTLs (R2 < 10%), viz., qSL-6-1ZY, qSL-6-2ZY, qSL-6-3ZY, qSL-9-2ZY, qSL-13-2ZY, qSL-14-1ZY, and qSL-15-1ZY, were also identified in a single environment in the ZY population (Table 1).
In both ZY and K3N populations, a total of 14 main-effect QTLs associated with SW were identified, distributed on ten different chromosomes/LG (Table 1). Among them, qSW-13-1ZY was detected in two individual environments, viz., 2012JP and 2017JP, in ZY population and expressed an average of 7.45% of PV (Table 1). However, nine major QTLs, viz., qSW-2-1K3N, qSW-5-1K3N, qSW-6-1ZY, qSW-6-2ZY, qSW-8-1K3N, qSW-9-1K3N, qSW-10-1K3N, qSW-17-1ZY, and qSW-17-2ZY, with R2 > 10%, were identified only in one environment and expressed PV that varies from 10.33–17.32% in both RIL populations (Table 1). Four minor QTLs, viz., qSW-1-1ZY, qSW-4-1ZY, qSW-9-2ZY, and qSW-13-2ZY, were also detected as environment-sensitive and expressing a PV of 5.19–8.63% (Table 1).
For ST, we identified 22 main-effect QTLs in both RIL populations across three environments, distributed on 13 LG (Table 1). One stable major (qST-6-2ZY) and minor (qST-13-3ZY) QTLs were consistently detected in two individual environments in the ZY population with an average R2 of 11.32% and 6.36%, respectively (Table 1). Moreover, ten major QTLs: qST-2-1K3N, qST-3-1K3N, qST-5-1K3N, qST-6-3K3N, qST-8-1K3N, qST-12-1K3N, qST-12-3K3N, qST-13-2ZY, qST-16-1K3N, and qST-18-1K3N were identified in only one individual environment in the K3N population, with PV ranging from 10.00–16.67% (Table 1). Besides, ten minor QTLs, viz., qST-1-1ZY, qST-1-2ZY, qST-4-1ZY, qST-6-1ZY, qST-11-1ZY, qST-12-2K3N, qST-13-1ZY, qST-17-1ZY, qST-17-2ZY, and qST-18-2ZY, expressing PV in the range of 4.46–9.68%, were environment-sensitive (Table 1).
Among 50 QTLs identified for all three seed size traits, 31 QTLs were novel identified for the first time, and the remaining 19 QTLs are reported earlier in the same physical genomic interval (Table 1). Moreover, 25 out of 50 QTLs were major, with R2 > 10%, and the remaining 25 were minor QTLs, with R2 < 10%. However, we detected several major QTLs in the K3N population (18), compared to the ZY. Notably, the most prominent QTL with the highest logarithm of odds (LOD) score (10.76) in a 23.31cM region was located on Chr06, named qSW-6-2ZY, expressing 14.45% of PV (Table 1). The majority of QTLs showed a positive additive effect with favorable alleles from parent Zhengxiaodou, except ten QTLs (qSL-9-2ZY, qSL-14-1ZY, qSL-18-1K3N, qSL-20-1K3N, qSW-2-1K3N, qSW-8-1K3N, qSW-10-1K3N, qST-2-1K3N, qST-6-3K3N, and qST-8-1K3N) that displayed negative additive effects with beneficial alleles from Nannong1138-2 (Table 1).

2.3. QTL Mapping of Seed Shape by CIM

In total, we identified 38 QTLs associated with three seed shape traits, viz., SLW, SLT, and SWT on 15 different chromosomes in both RIL populations (ZY and K3N) across all three individual environments (Table 2 and Figure 2). A single QTL expressed a PV that varies from 3.44% (qSLT-16-1K3N) to 26.84% (qSLW-20-1K3N) (Table 2). For SLW, we identified 11 QTLs located on nine different chromosomes (Table 2). A major and stable QTL, qSLW-6-1ZY, was detected consistently on Chr06 in all three individual environments (2012FY, 2012JP, and 2017JP) in the ZY population and expressed a PV of 16.03% (Table 2). Besides, another major stable QTL, qSLW-20-1K3N, was identified on Chr20 in two individual environments (2012 JP and 2017JP), expressing an average PV of 19.24% in the K3N population (Table 2). The qSLW-19-1K3N,ZY was identified in both RIL populations, as well as two individual environments (2012FY and 2017JP), with an average PV of 9.17% (Table 2). The remaining eight QTLs were environment-sensitive (identified in only one individual environment); out of them, three QTLs, viz., qSLW-7-1K3N, qSLW-9-1K3N, and qSLW-16-1K3N, were major, with R2 > 10% (Table 2).
In the case of SLT, we identified a total of 16 QTLs distributed on 11 different chromosomes in both RIL populations across three individual environments (Table 2). Among them, qSLT-10-1ZY and qSLT-20-1K3N were significant and stable QTLs having R2 > 10%, as well as detected in three and two individual environments, respectively (Table 2). Additionally, four significant QTLs, viz., qSLT-9-1K3N, qSLT-9-2K3N, qSLT-11-1K3N, and qSLT-13-1ZY, expressing a PV of 10.29–12.62%, were detected only in one individual environment (Table 2). The remaining ten QTLs were minor, having R2 < 10% detected in only one individual environment (Table 2).
For SWT, a total of 11 QTLs on nine different chromosomes were mapped in both RIL populations (Table 2). Among these QTLs, qSWT-2-1K3N,ZY and qSWT-8-1ZY were the stable QTLs identified in three and two individual environments, respectively; additionally, qSWT-2-1K3N,ZY was identified in both RIL populations. Besides, four out of 11 QTLs, viz., qSWT-9-1K3N, qSWT-10-1K3N, qSWT-11-1K3N, and qSWT-16-1K3N, were major (R2 > 10%) but were environment-sensitive, detected only in K3N-RIL populations (Table 2). The remaining five minor QTLs, viz., qSWT-8-2ZY, qSWT-12-1K3N, qSWT-13-1ZY, qSWT-13-2ZY, and qSWT-18-1ZY, were detected in one individual environment with R2 > 10% (Table 2).
Overall, 38 QTLs were associated with three different seed shape traits in both the K3N and ZY populations; out of them, 20 QTLs have been reported for the first time, while earlier studies have already reported the remaining 18 QTLs (Table 2). Moreover, 17 out of 38 QTLs were major, with R2 > 10%, and four of them, viz., qSLW-6-1ZY, qSLW-20-1K3N, qSLT-10-1ZY, and qSLT-20-1K3N, were detected stably in more than one individual environment. The most prominent major and stable QTL was qSLW-20-1K3N (novel QTL), with the highest LOD value of 9.01 in an individual environment, identified at 53.61 cM position on Chr20 and expressing a PV of 26.84% (Table 2). The 16 QTLs have positive additive effects with beneficial alleles inherited from KeFeng35, whereas the remaining 22 QTLs possess negative additive effects with favorable alleles derived from Nannong1138-2 (Table 2).

2.4. MCIM Mapping and Comparison of CIM and MCIM Methods

To further validate the QTLs detected by CIM, we performed another method of mixed-model-based composite interval mapping (MCIM) to dissect the additive effect QTLs and QTL x E interactions. By using the MCIM method, we identified a total of 48 additive effect QTLs distributed on 15 chromosomes for all six traits related to seed size and shape in both the RIL populations and all three environments, which expressed 1.69 to 29.35% of the PV (Table 3). Moreover, the additive effect of different QTLs was either negative or positive; for example, 30 and 18 QTLs have positive and negative additive effects, respectively. Hence, indicating that both parents contribute beneficial alleles for seed size and shape traits in ZY and K3N populations (Table 3). Out of 48 QTLs, 10 QTLs were significant, with R2 > 10%, whereas the remaining 38 QTLs were minor, with R2 < 10% (Table 3).
Among these 48 QTLs, 15 QTLs showed significant additive by environment interaction (AE) effects (Table 3). However, four QTLs viz., qSL-13-4ZY, qSW-13-3ZY, qST-13-4ZY, and qST-10-1K3N revealed AE effect at all environments, while seven and four QTLs showed AE effect in two and one specific environments, respectively (Table 3). The AE effect of these 15 QTLs associated with seed size and shape traits could express the PV that varies from 0.01 to 4.15%. The remaining 33 QTLs identified through the MCIM approach do not possess any AE effect; hence, they are environmentally stable QTLs (Table 3).
Lastly, we performed a comparative analysis of QTLs detected by CIM and MCIM approaches. A total of 88 and 48 QTLs were identified by CIM and MCIM, respectively. Among these QTLs, 15 QTLs were common and are detected by both methods in the same physical genomic interval, indicating the reliability and stability of these QTLs. Besides, by comparing the physical genomic regions of QTLs identified in both populations (ZY and K3N) and mapping methods (CIM and MCIM), two QTLs, viz., qSW-1-1ZY and qSLT-20-1K3N, were detected in common, with R2 > 10%, identified for the first time. Hence, these QTLs were considered as the most stable and novel QTLs that could be utilized potentially for gene cloning and MAB of soybean seed size and shape traits.

2.5. Epistatic Interaction Effects

A total of 16 pairs of epistatic QTLs were detected for seed size and shape in both RIL populations (Table 4). Out of these 16 pairs, four epistatic QTL pairs, viz., qSL-2-1K3N and qSL-2-2K3N, qST-9-1K3N and qST-12-4K3N, qSLT-2-3K3N and qSLT-7-1K3N, and qSWT-6-1K3N and qSWT-8-4K3N, possess both significant AA and AAE interaction effects with PV of 1.71–9.70% and 1.68–12.03% expressed, respectively (Table 4). However, the remaining 12 QTLs pairs had only significant AA effects and did not possess any significant AAE interaction effects (Table 4). Hence, the above findings indicate that environment and epistatic interaction effects have considerable influence on the regulation of phenotypic expressions of seed size and shape traits in soybeans. Though, except for three QTLs, viz., qSL-13-3ZY, qSL-13-4ZY, and qSW-13-4ZY, all the remaining additive-effect QTLs did not show any epistatic effects.

2.6. Colocalization of QTLs in QTL cluster/Hotspot

A QTL cluster/hotspot is defined as a densely populated QTL region of the chromosome that contains multiple QTLs associated with various traits. In this study, we observed colocalization of QTLs on four QTL Clusters/hotspots located on different chromosomes, viz., Chr6, Chr10, Chr13, and Chr20, and were named Cluster-06/QTL Hotspot A, Cluster-10/QTL Hotspot B, Cluster-13/QTL Hotspot C, and Cluster-20/QTL Hotspot D, respectively (Table 5). The highest concentration of QTLs for seed size and shape traits was identified in “QTL Hotspot A” of Chr06, spanning the physical interval of 2.19Mb (Figure 3). This QTL hotspot harbors six QTLs (three major and three minor), viz., qSW-6-1ZY, qST-6-1ZY, qSL-6-1ZY, qSW-6-2ZY, qST-6-2ZY, and qSLT-6-1ZY, associated to seed size and shape traits, expressing a PV of 5.43–15.35% (Table 5). Another set of QTL-rich regions possessing five QTLs (two major and three minor), viz., qSL-13-1ZY, qSW-13-1ZY, qST-13-2ZY, qST-13-3ZY, and qSLW-13-1ZY was “QTL Hotspot C”, with a length of 6.3 Mb (Table 5 and Figure 3). However, both “QTL Hotspot B” and “QTL Hotspot D” contain three QTLs each associated with studied traits and spanning the physical interval of 4.0Mb and 2.3Mb expressed PV of 6.60–17.03% and 10.22–26.84%, respectively (Table 5). Furthermore, all these four “QTL cluster/hotspots” comprise many significant QTLs identified in more than one individual environment. QTLs within “QTL Hotspot B” were identified in both ZY and K3N populations (Table 5 and Figure 3). Hence, these four major “QTL hotspots” are the stable genomic regions governing the inheritance of seed shape and size in soybeans.

2.7. Candidate Gene Mining within Major “QTL Hotspots”

The whole-genome sequence and gene annotations availability makes it possible to identify possible candidate genes within major genomic regions. In the present study, all the model genes along with their gene annotations were downloaded from Phytozome and Soybase. In total, we identified 2406 gene models within the physical genomic interval of all four major “QTL hotspots” (Table S4). An online web-based toolkit agriGO V2.0 was used for a gene ontology (GO) enrichment analysis to visualize the biological process, molecular function, and cellular component main categories (Figure 4). Among all the genes present within the four “QTL hotspots”, only the 831, 193, 192, and 118 genes from “QTL Hotspot A”, “QTL Hotspot B”, “QTL Hotspot C”, and “QTL Hotspot D”, respectively, had GO annotations available (Figure 4). In all the four major “QTL hotspots”, a higher percentage of genes were associated within the terms cellular process, metabolic process, cell part, cell, catalytic activity, and binding (Figure 4), suggesting a vital role of these terms in regulating seed size and shape in soybeans.
Based on the gene annotations, available literature, and GO enrichment analysis, we predicted 26, 19, 35, and 18 candidate genes from “QTL Hotspot A”, “QTL Hotspot B”, “QTL Hotspot C”, and “QTL Hotspot D,” respectively (Table S6). These genes function directly or indirectly in regulating seed development, as well as seed shape and size, such as mitotic cell division, storage of proteins and lipids, transport, metabolic process, signal transduction of plant hormones, degradation of the ubiquitin-proteasome pathway, and fatty acid beta-oxidation (Table S6). To further refine the above-predicted candidate genes list, we retrieved RNA-Seq data of these candidate genes from Soybase (www.soybase.org) [35].
Based on RNA-seq analysis, 23 genes out of above 88 predicted candidate genes showed significantly higher gene expression/fold-change in the seed development stages, root nodules, leaf, and pod shell. These genes include nine (Glyma06g02390, Glyma06g08290, Glyma06g04810, Glyma06g03700, Glyma06g02790, Glyma06g06160, Glyma06g07200, Glyma06g09650, and Glyma06g10700); two (Glyma10g35360 and Glyma10g36440); six (Glyma13g17750, Glyma13g17980, Glyma13g21770, Glyma13g18730, Glyma13g21700, and Glyma13g22790); and six (Glyma20g28550, Glyma20g28460, Glyma20g28640, Glyma20g27300, Glyma20g29750, and Glyma20g30100) genes from “QTL Hotspot A”, “QTL Hotspot B”, “QTL Hotspot C”, and “QTL Hotspot D”, respectively (Figure 5 and Table 6). Hence, these 23 genes might be the possible candidate genes regulating seed size and shape in soybean. However, they need further functional validation to check their actual roles in governing seed size and development.

3. Discussion

Seed shape and size is an economically important trait determining the yield and quality in soybeans. Hence, developing soybean cultivars with improved seed shapes and sizes is considered as a critical objective of soybean breeding programs. However, to develop improved cultivars, it is a prerequisite to have a detailed understanding of genetic architecture, as well as a mechanism underlying the trait of interest. Both seed shape and size are complex quantitative traits, governed by multiple genes and are highly environmentally sensitive. Although, over the past decades, many QTLs related to soybean seed shape/size have been reported but not stable and confirmed, due to small-sized mapping populations and low-density genetic maps, and, hence, not implied for breeding improved seed shapes and sizes in soybean. Thus, the present study aimed to utilize high-density intraspecific linkage maps of ZY and K3N populations, evaluated in three different environments, to identify the stable significant main-effect QTLs, “QTL Hotspots”, and epistatic-effect QTLs, as well as their interactions with the environment; additionally, find possible candidate genes for soybean seed sizes and shape traits. In this study, ANOVA results revealed a significant difference among the RILs of both ZY and K3N populations for all six traits (P < 0.01, Table S2). Similar to previous studies, our study also reported that all six traits related to seed size/shape were significantly affected by G, E, and G × E [7,
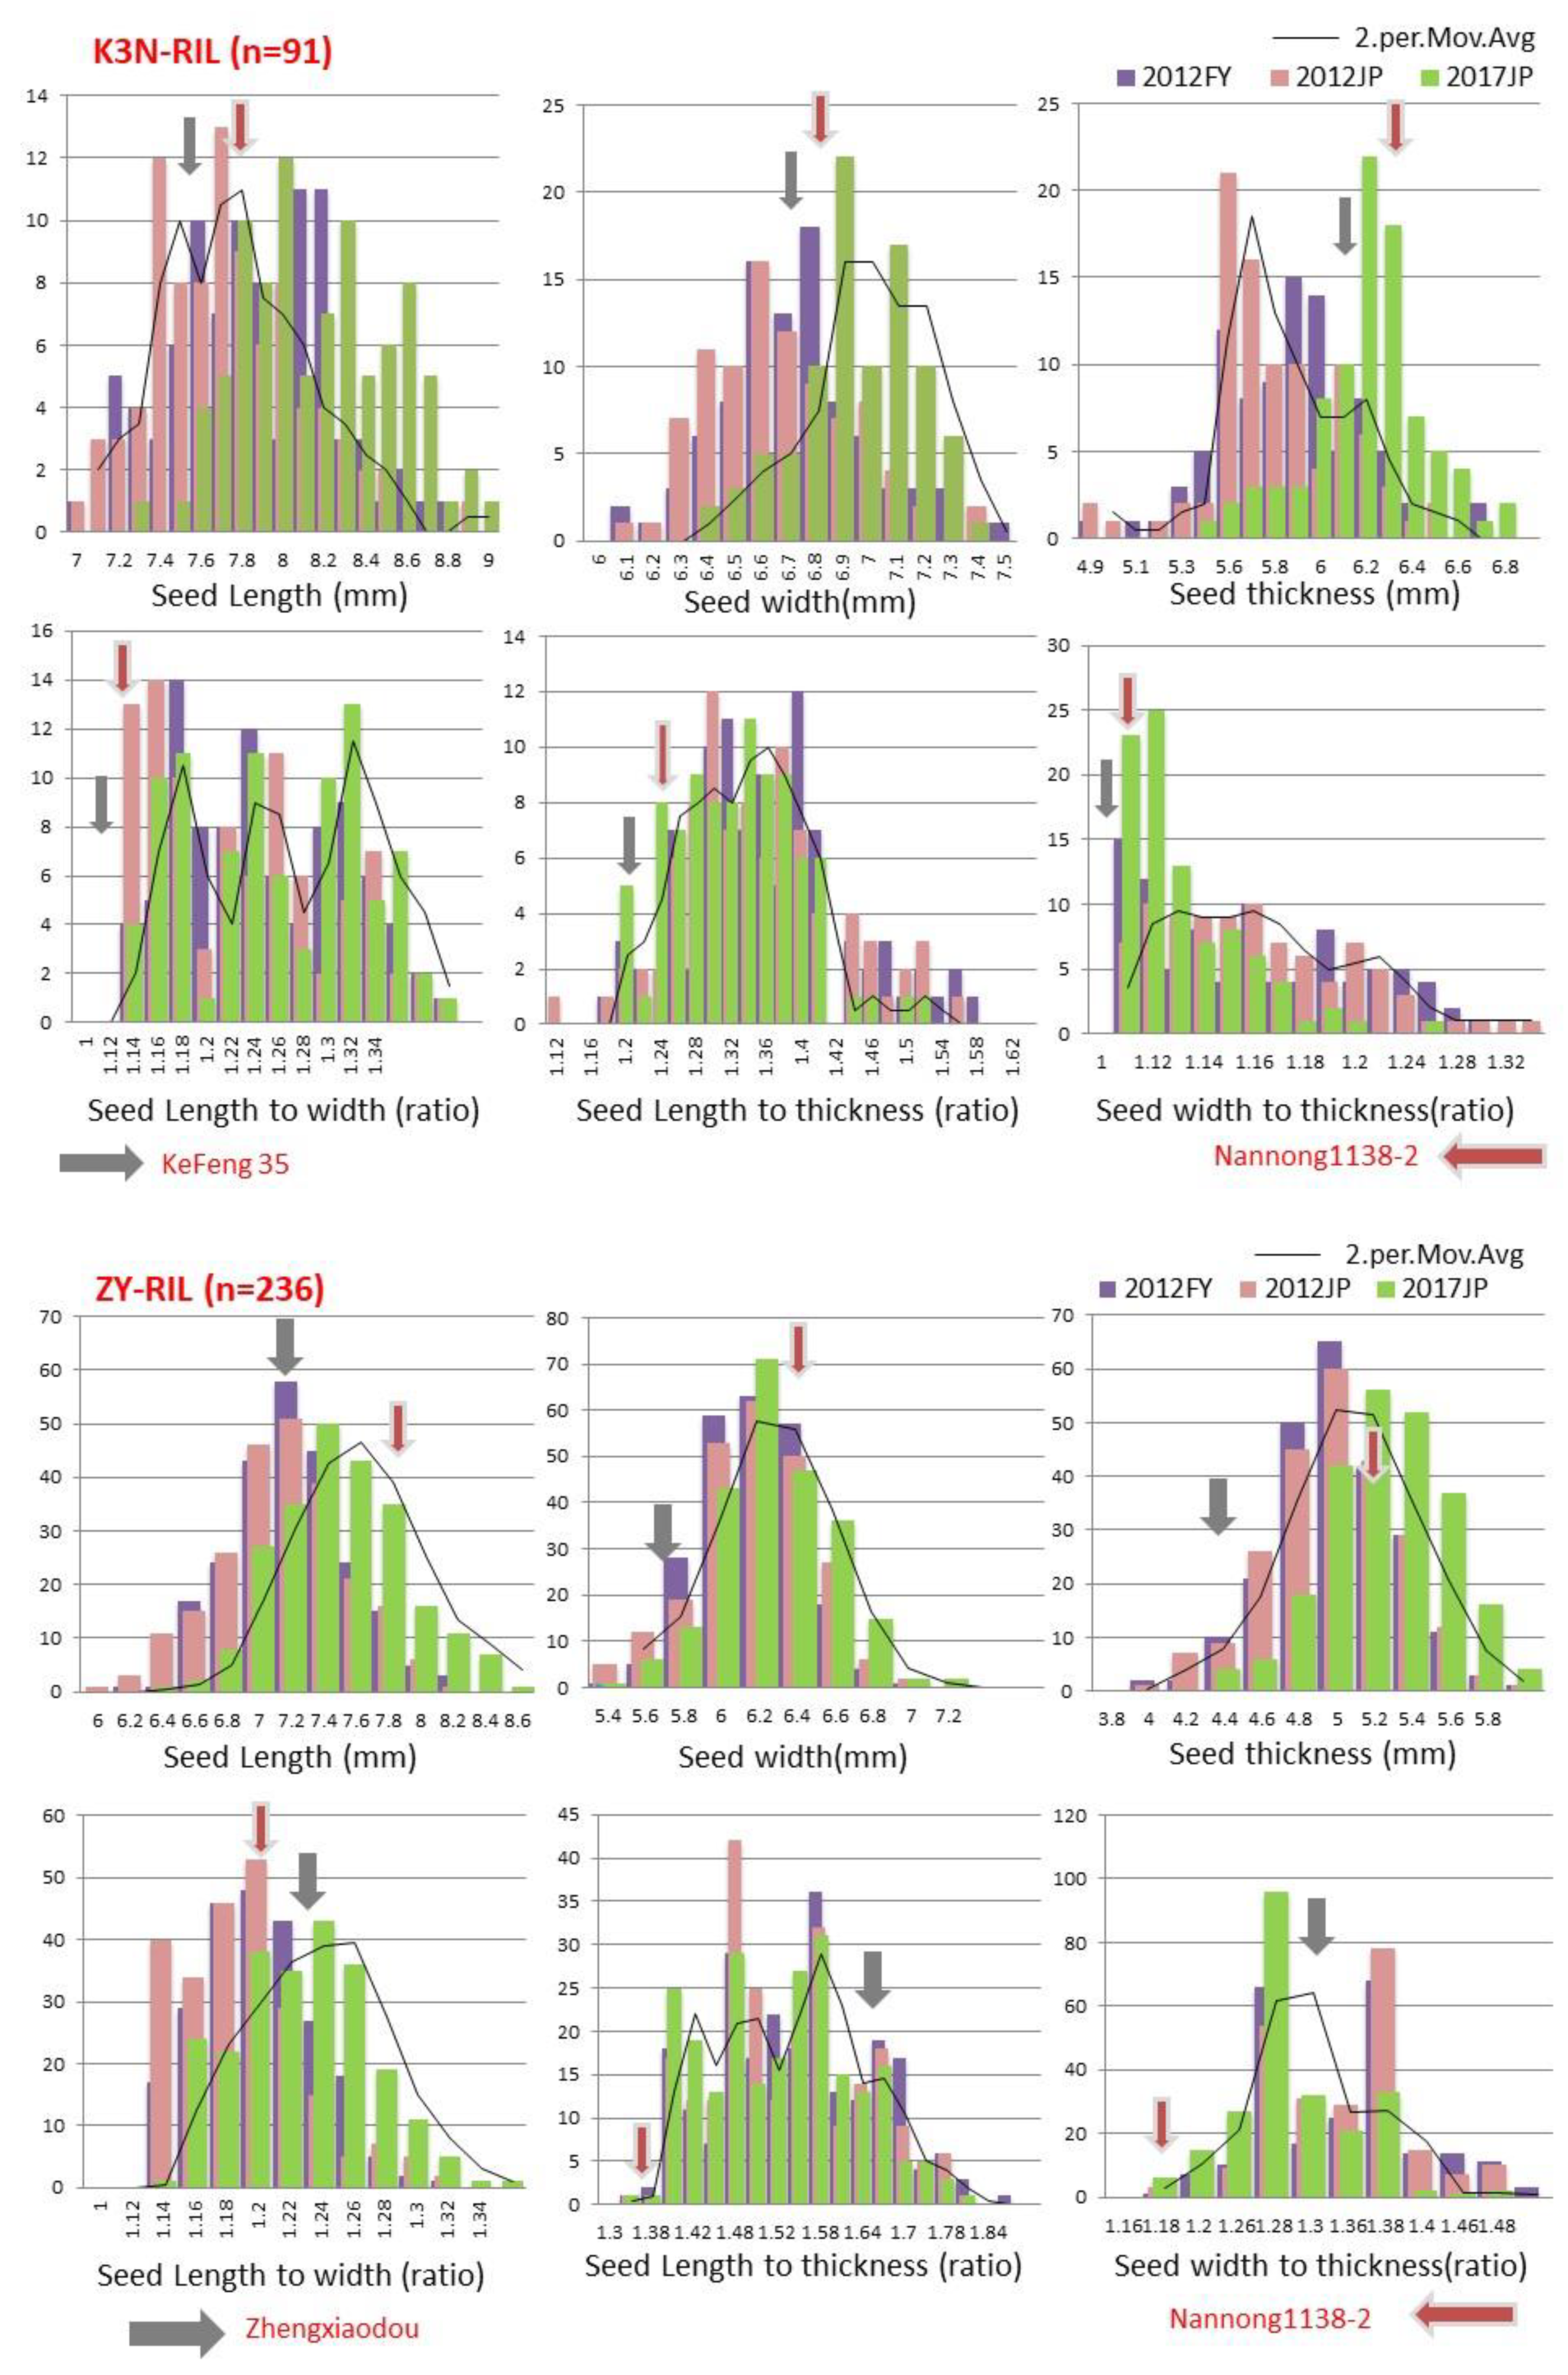
36]. Frequency distribution of all six traits (SL, SW, ST, SLW, SLT, and SWT) showed the characteristics of continuous variations, and all these traits have transgressive segregation in both directions, which indicates that both parents contributed favorable alleles for these traits (Figure 1). These findings are in agreement with the prior findings, which also stated continuous distribution and transgressive segregation for seed size/shape traits among RILs of soybeans in multiple environments [3,17,22]. In our study, the estimated heritability of all six traits was high (>60%) in both RIL populations across all three environments (Table S1), which was consistent with previous studies [7]. The high heritability suggests that if the trial repeated in the same growing/environment conditions, there would be a high possibility of achieving the same kind of phenotypic results. A highly significant correlation (either positive or negative) between any two seed shapes or seed size traits and between seed size and shape traits is in accordance, as previously reported by Xu et al. [5].
QTL mapping is a practical approach and has been frequently employed for the detection of QTLs/genes underlying the quantitative traits in crop plants. However, the efficiency and accuracy of QTL mappings are influenced, mainly by parental diversity and marker density [26]. The quality of genetic maps has a significant impact on the accuracy of QTL detection, and, consequently, increasing marker density can intensify the resolution of QTL mapping [37]. Hence, it is a prerequisite to utilize high-density linkage maps for improving the efficiency and accuracy of linkage mapping and MAS. In this study, high-density genetic maps of ZY and K3N populations were used, consisting of 3255 SLAF and 1733 bin markers, respectively. The markers in both linkage maps, viz., ZY and K3N, were integrated to all 20 LGs and covered the total length of 2144.85 and 2362.44 cM, respectively, with an average distance between adjacent markers of 0.66 cM and 1.36 cM, respectively.
The use of high-density bin-maps assisting in QTL identification with tightly linked markers provided a good foundation for analyzing quantitative traits. However, to reduce environmental errors, RILs were planted in three environments (consisting of different locations and years), and each of the environments was statistically different. Jansen et al. [38] described that the QTL position and effects could be accurately evaluated if the phenotypic data collected in various environments were different from a statistical perspective. Although, markers associated with the QTLs regulating the seed sizes and shapes in soybeans have been mapped on all linkage groups (Soybase, www.soybase.org). However, for cross-validation and improving the accuracy of QTL mapping results, we used two different methods for QTL mapping, viz., CIM and MCIM. A total of 88 and 48 QTLs were detected by CIM and MCIM methods, respectively, associated with all six traits related to seed size and shape (Table 1, Table 2 and Table 3). Among these QTLs, 15 common QTLs were verified through both CIM and MCIM, indicating that these QTLs were stable and utilized effectively as potential candidate regions for enhancing seed sizes and shapes in soybeans. The QTL results of our study revealed better matches with the SoyBase database (www.soybase.org; Table 1 and Table 2); however, 51 (CIM) and 27 (MCIM) QTLs were identified for the very first time (Table 1, Table 2 and Table 3). These novel QTLs collectively expressed more than 90% of PV for seed size and shape, suggesting their potential value for the development of improved soybean cultivars. Among these novel QTLs, qSL-9-1ZY,K3N, qST-6-2ZY, qSLW-6-1ZY, qSLW-20-1K3N, qSLT-10-1ZY, and qSLT-20-1K3N were reported as stable and major QTLs, identified in more than one individual environment, with R2 > 10%. Besides, by comparing the physical genomic regions of QTLs identified in both populations (ZY and K3N) and mapping methods (CIM and MCIM), two major and novel QTLs, viz., qSW-1-3ZY and qSLT-20-3K3N, were characterized commonly in both mapping methods. These above seven unique and stable QTLs significantly represent potential loci for the improvement of seed sizes and shapes in soybeans. Hence, identification of many new and unique QTLs in the present study suggests distinct genetic architecture in the population derived from the diverse Chinese cultivated soybean genotypes and the need to use more germplasm for revealing the complex genetic basis of soybeans. The favorable alleles for seed size and shape traits were contributed by both parents of two RIL populations, viz., ZY and K3N. Therefore, it is critical to note that not only the higher phenotype parent contributes beneficial alleles but also the contribution of favorable alleles by lower phenotype parents cannot be disregarded; similar results are also described earlier [30].
The stability of the QTL is essential for use in a breeding program. In addition to novel stable QTLs identified for both seed size and shape traits, this study also identified 37 and 21 QTLs through the CIM and MCIM methods, which have been previously colocalized in the same physical interval by earlier studies (see references in Table 1, Table 2 and Table 3). Out of these colocalized QTLs, 12 and 3 QTLs detected by the CIM and MCIM methods were major (R2 > 10%). Therefore, our results showed the reliability of QTL mapping. Furthermore, these QTLs can be utilized as principal targets to identify the candidate genes and MAS in future studies.
It has been demonstrated that epistatic and QTL by environment interaction effects are the two crucial genetic factors that make an enormous contribution to the phenotypic variation observed in complex traits, and the knowledge of those interaction effects is vital for understanding the genetic mechanism of complex traits [39,40]. Previous studies revealed that the seed sizes and shapes of soybeans is significantly affected by the environment [36]. Moreover, knowledge of specific QTL by environment interactions can guide the search of varieties adapted to particular environments. The QTLs with more significant additive effects are often considered more stable [41,42]. For example, the qSW-1-1ZY and qST-18-2ZY (additive effect: 0.14) identified in both CIM and MCIM methods; though, qSLT-6-5ZY (additive effect: 0.001) was detected only in the MCIM method (ZY only) (Table 3). The genetic architecture of seed size and shape also includes epistatic interactions between QTLs [11,43]. Hence, ignoring intergenic interactions will lead to the overestimation of individual QTL effects, and the underestimation of genetic variance [44], consequently, could result in a substantial drop in the genetic response to MAS, particularly at late generations [45]. In the present study, 16 pairs of digenetic epistatic QTLs pairs were identified for seed size and shape in both populations and expressed phenotypic variations that varied from 1.71 to 9.70% (Table 4). Except for qSL-13-3ZY, qSL-13-4ZY, and qST-13-4ZY, all the remaining epistatic QTLs do not possess additive effects alone, suggesting that these loci might serve as modifying genes that interact with other genes to affect the phenotypes of seed sizes and shapes (Table 4). All 16 pairs have significant AA, but only four QTL pairs, viz., qSL-2-1K3N and qSL-2-2K3N, qST-9-1K3N and qST-12-4K3N, qSLT-2-3K3N and qSLT-7-1K3N, and qSWT-6-1K3N and qSWT-8-4K3N, hold significant AAE interaction effects. However, the total AAE phenotypic variations expressed by these four epistatic pairs was 19.14%. These results show that epistatic and environmental interactions are fundamental for understanding the genetic basis of seed sizes and shapes in soybeans, demonstrating that these effects should be considered in a QTL mapping program and could increase the accuracy of phenotypic value predictions in MAS.
Colocalization of QTLs on chromosomes for different traits related to seed size and shape were also observed in this study. This colocalization of QTLs linked to related traits on chromosomes was reported earlier in soybeans and referred to as “QTL cluster/hotspots” [
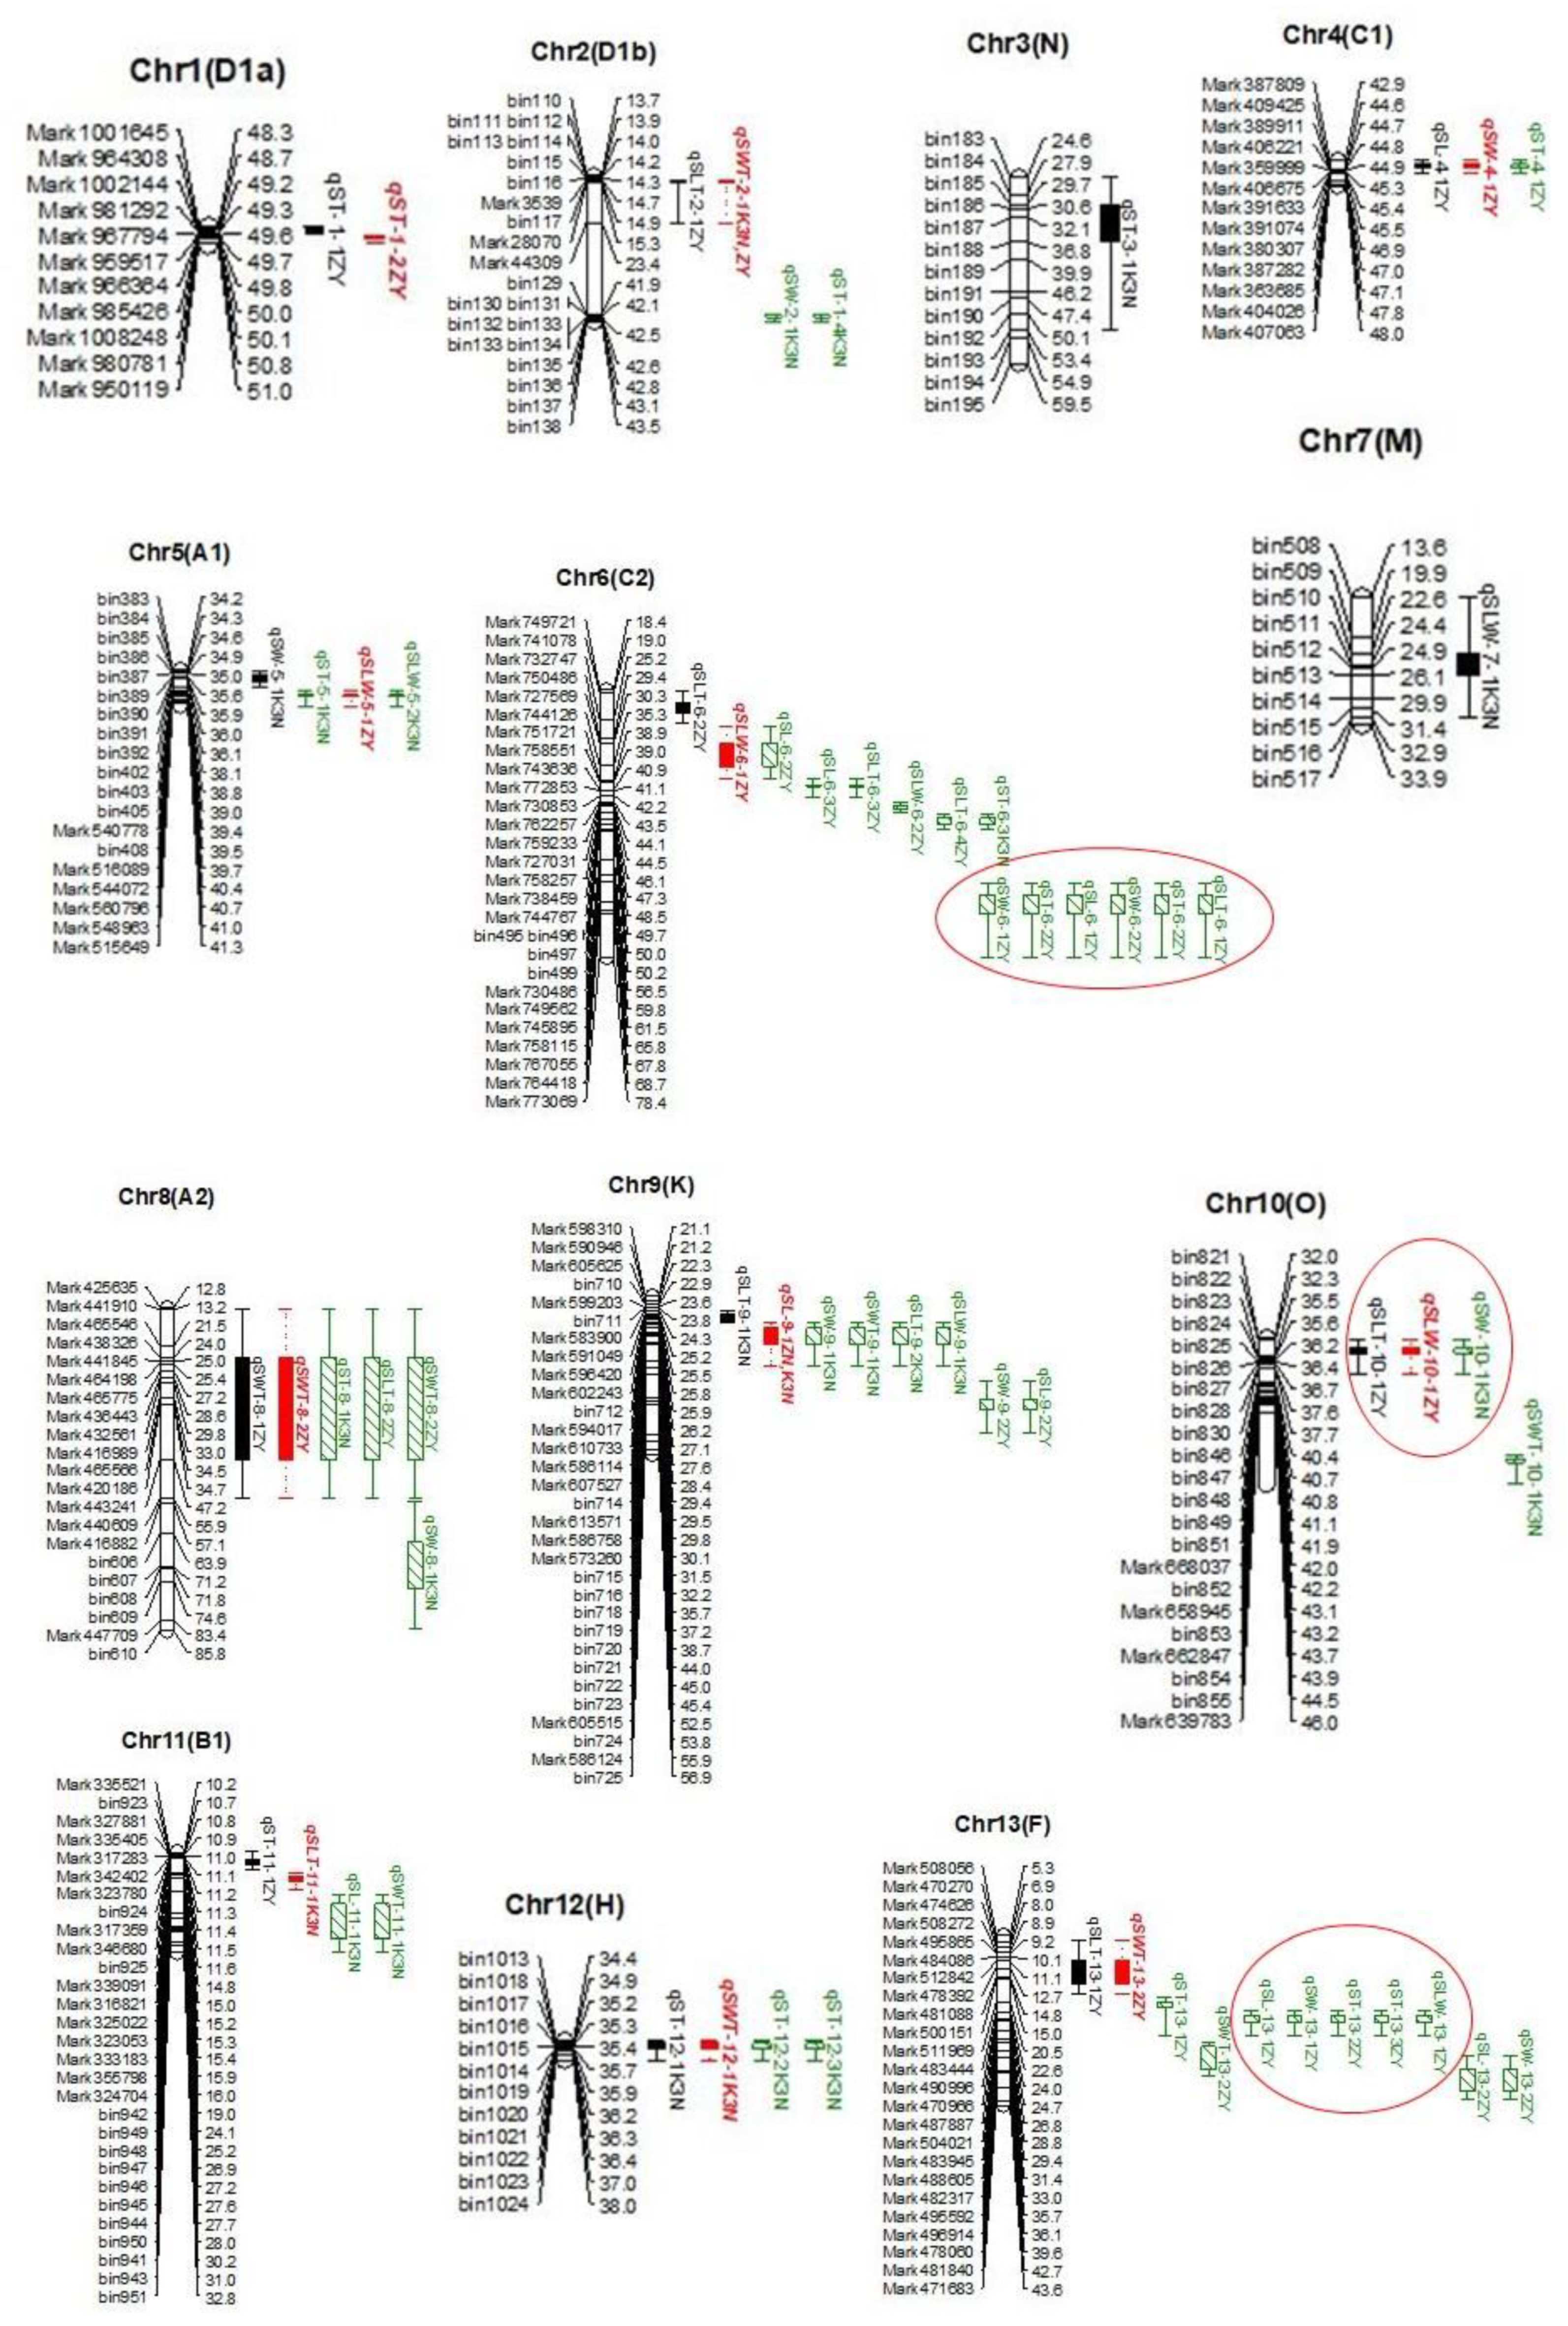
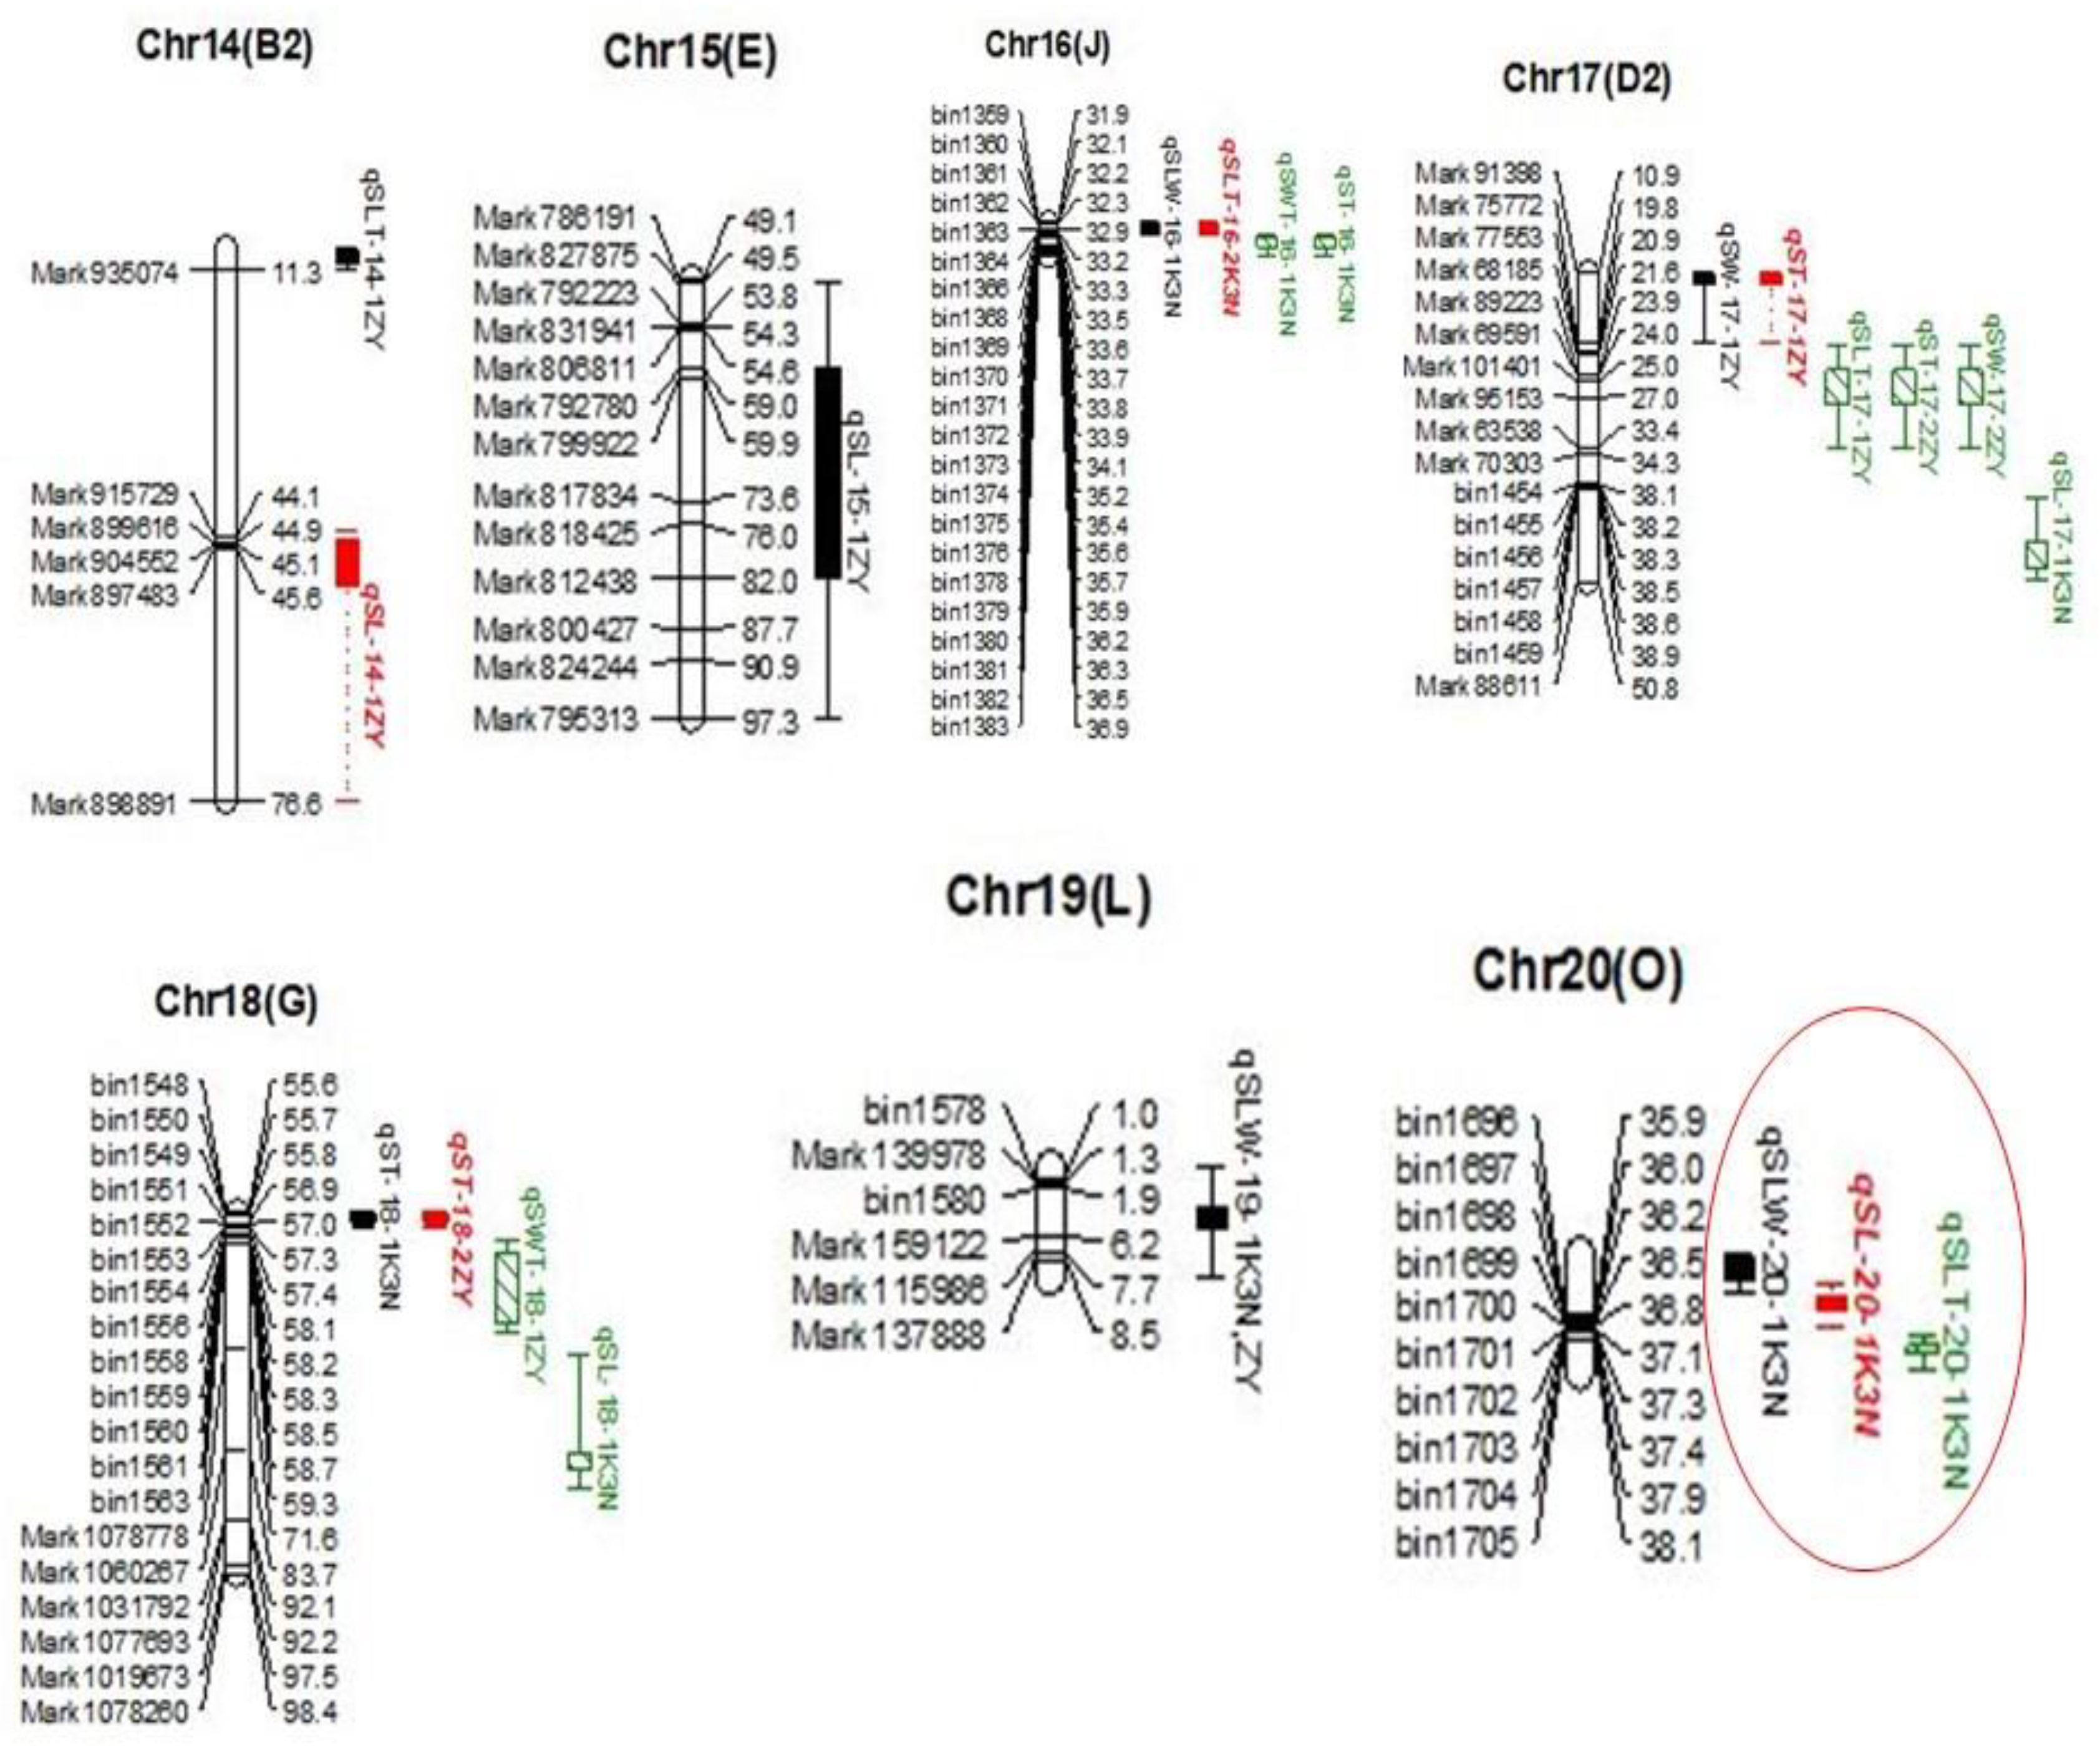
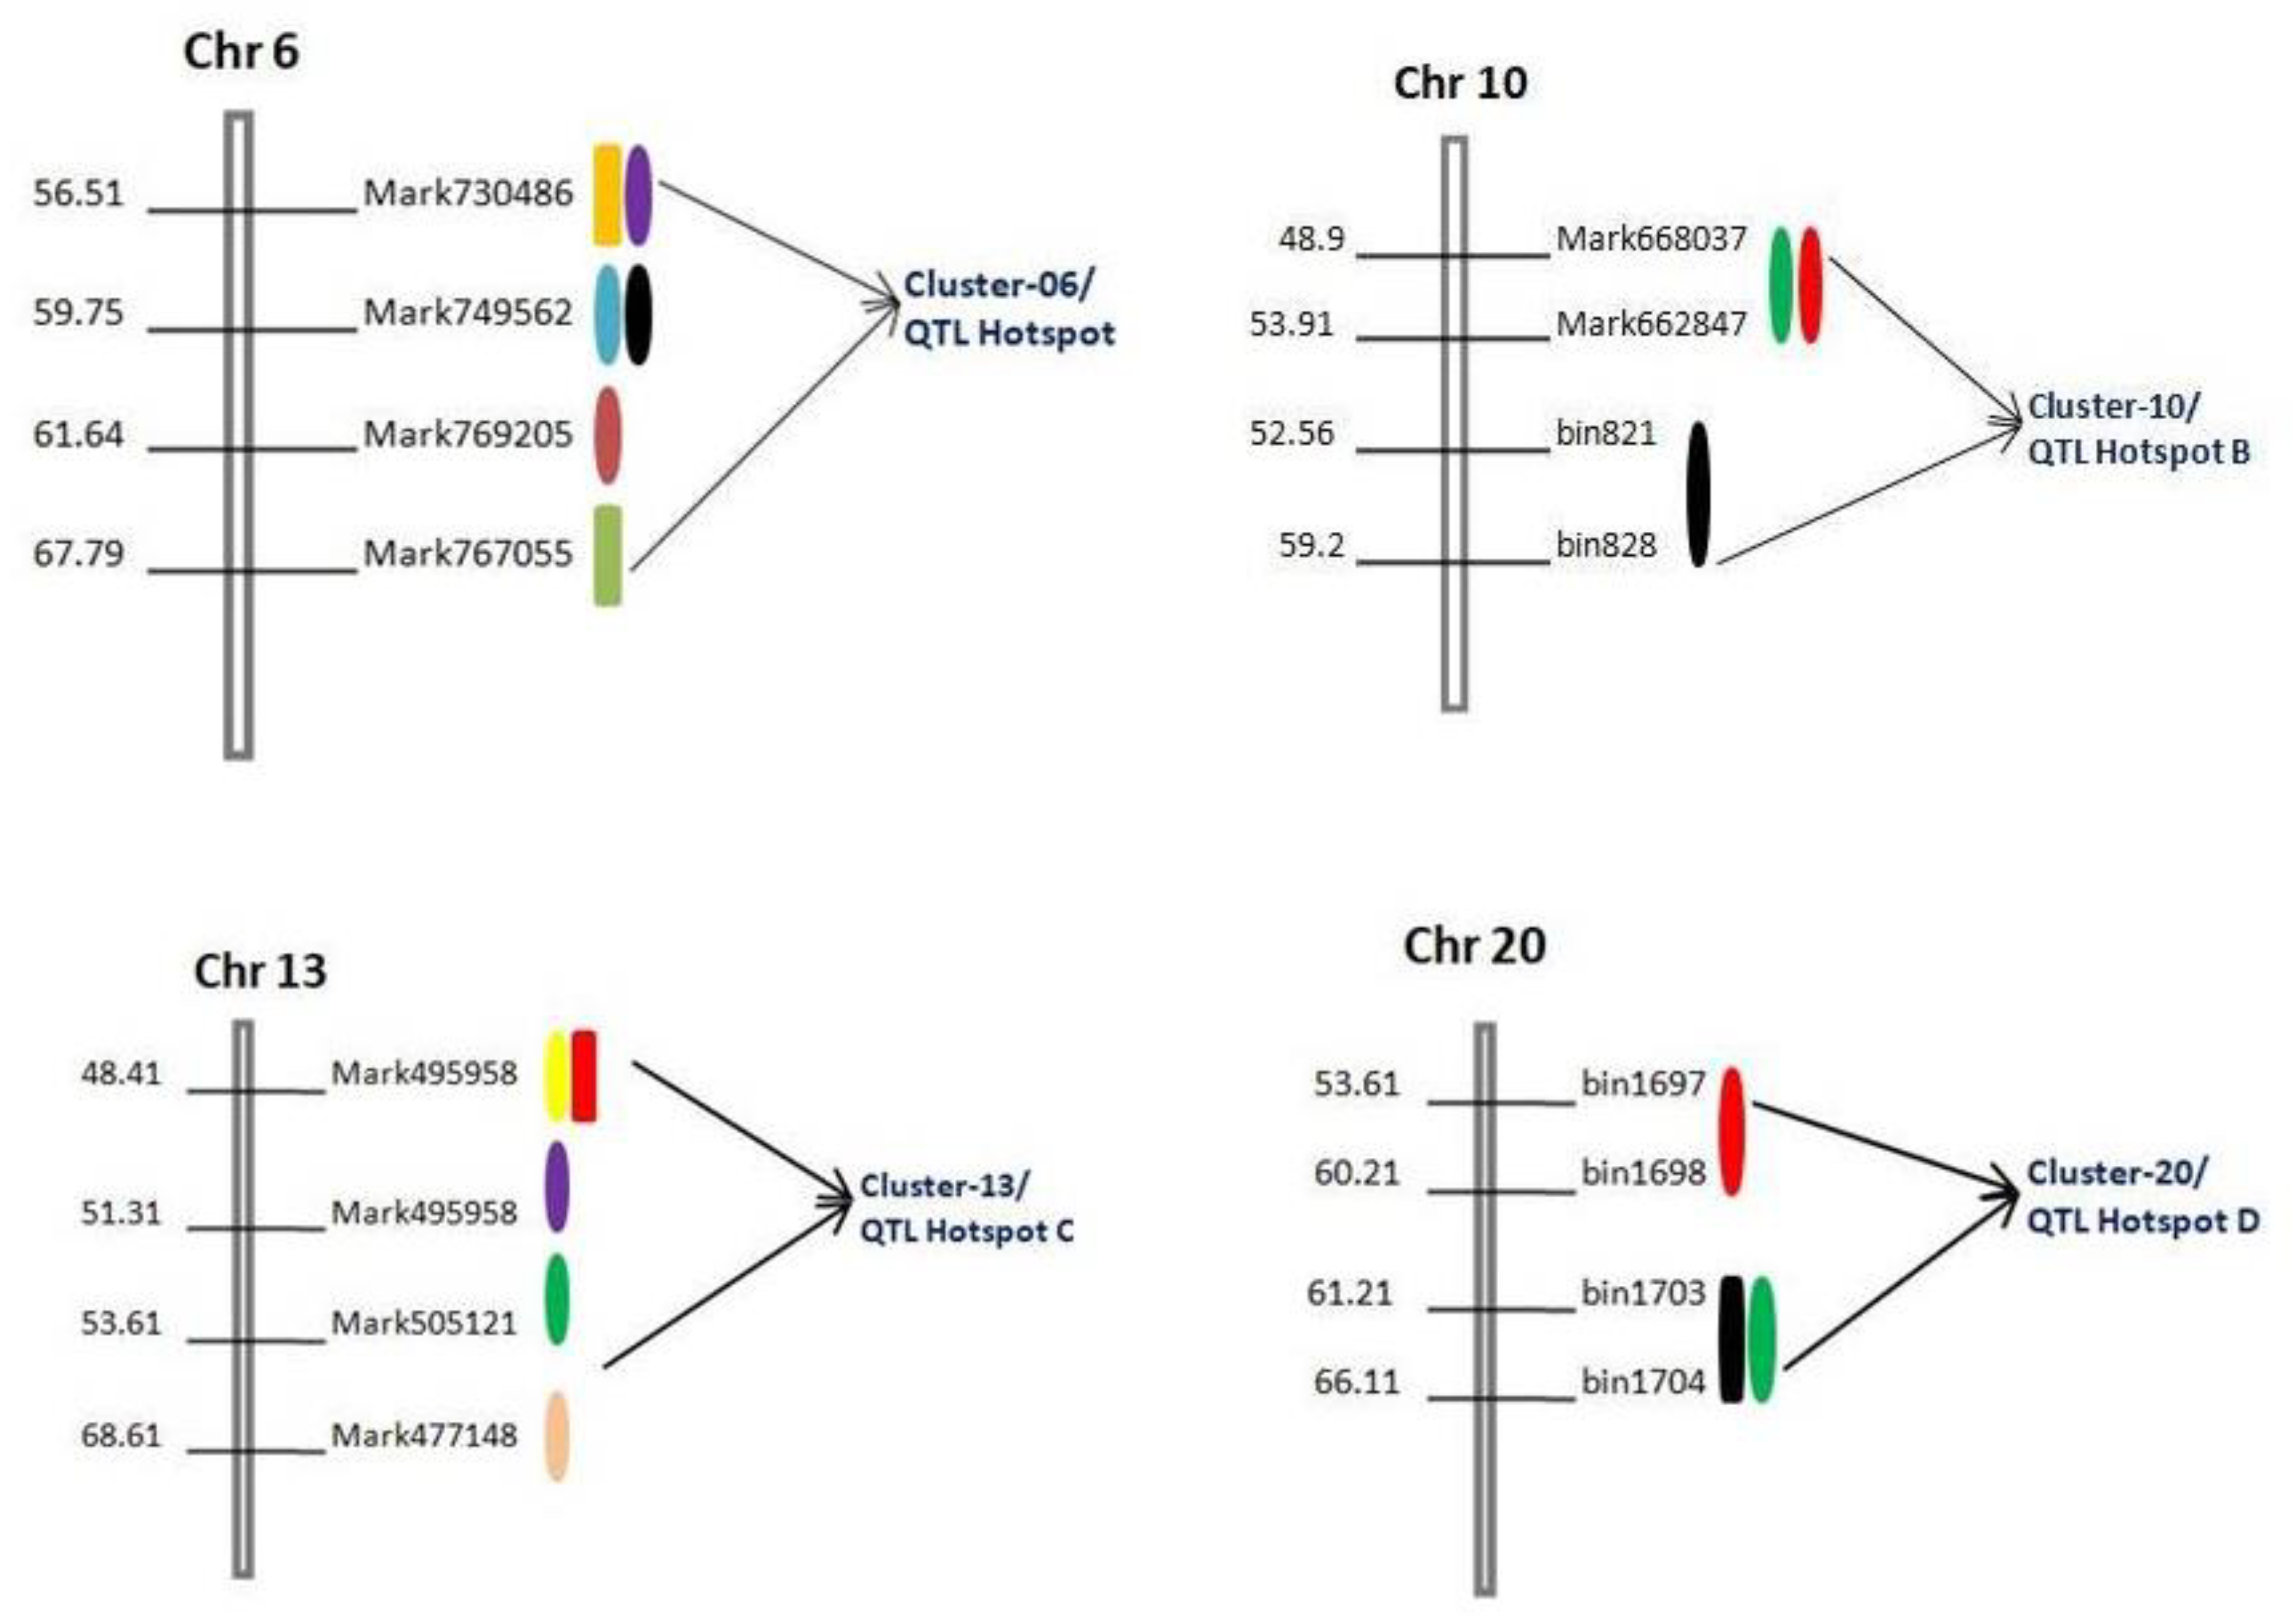
46]. In this study, we scrutinized a few genomic regions containing QTL clusters and found four QTL clusters/hotspots on four different chromosomes, viz., Chr06, Chr10, Chr13, and Chr20 (Figure 3 and Table 5). The QTLs within each cluster/hotspot are associated with three or more traits related to seed sizes and shapes in soybeans. The highest number of six and five QTLs were observed in “QTL Hotspot A” and “QTL Hotspot C”, respectively, harboring QTLs for more than three traits related to seed size and shape (Figure 3 and Table 5). The other two hotspots, viz., “QTL Hotspot B” and “QTL Hotspot D”, contain three QTLs, each for three different traits related to seed size and shape (Table 5). These QTLs clusters/hotspots have not reported and added to the growing knowledge of the genetic control of these traits. The phenomenon of the QTL clustering might represent a linkage of genes/QTLs or result from the pleiotropic effects of a single QTL in the same genomic region [47]. This colocalization of QTLs for different seed size and shape traits was following the fact that they were highly significantly correlated with each other (Table 1). These “QTL hotspot” regions showed that the QTLs linkage/pleiotropy could facilitate the enhancement of seed size and shape. Previously, some of the QTLs for other traits have also been identified in the same region of “QTL Hotspot A” on chromosome 06, which are related to seed oil and protein content [48,49] and days to flowering [50]. In the case of “QTL Hotspot B”, QTLs related to seed weight and seed yield [51], length of the reproductive stage [33], days to flowering, and maturity [33] were reported in the same physical interval.
Similarly, earlier studies have also reported QTLs for seed weight [7] and seed volume [33] in the “QTL Hotspot C” region on Chr13. In “QTL Hotspot D”, QTLs related to seed maturity [33] and seed oil content [52] have formerly reported. Seed oil and protein content in soybeans have reported a significant correlation with seed size and shape [53], as seed oil and protein content represents a major component of soybean seeds, representing 38–42% and 18–22%, respectively; hence, these traits are directly related to seed sizes and shapes in soybeans [13]. Both seed size and shape are important yield component traits [54] and it has been reported that days to flowering and maturity is directly correlated to yield in soybeans [55,56], signifying the potential probability of common genic factors for these traits and also showing the necessity to promote further study for these regions. These QTL clusters have provided some valuable information to define genome regions associated with different traits. Based on the comprehensive analysis of clusters in this study, breeding programs targeting an increase of seed sizes and shapes with high yield and superior quality can focus on hotspot clustering and select QTLs around the region. Finally, the existence of QTL clusters/hotspots has provided proof that genes related to some crop traits are more densely concentrated in certain genomic regions of crop genomes than others [33,51].
Identification of candidate genes underlying the QTL region is of great interest for practical plant breeding. Earlier studies based on QTL mapping of seed size and shape did not practice mining for candidate genes [22,54], and, to date, only a few seed size/shape-related genes have been isolated from the soybean. For example, the Ln gene has a large effect on the number of seeds per pod and seed size/shape [57], and, recently, the PP2C-1 (protein phosphatase type-2 C) allele from wild soybean accession ZYD7 were found to contribute toward the increase in seed size/shape [
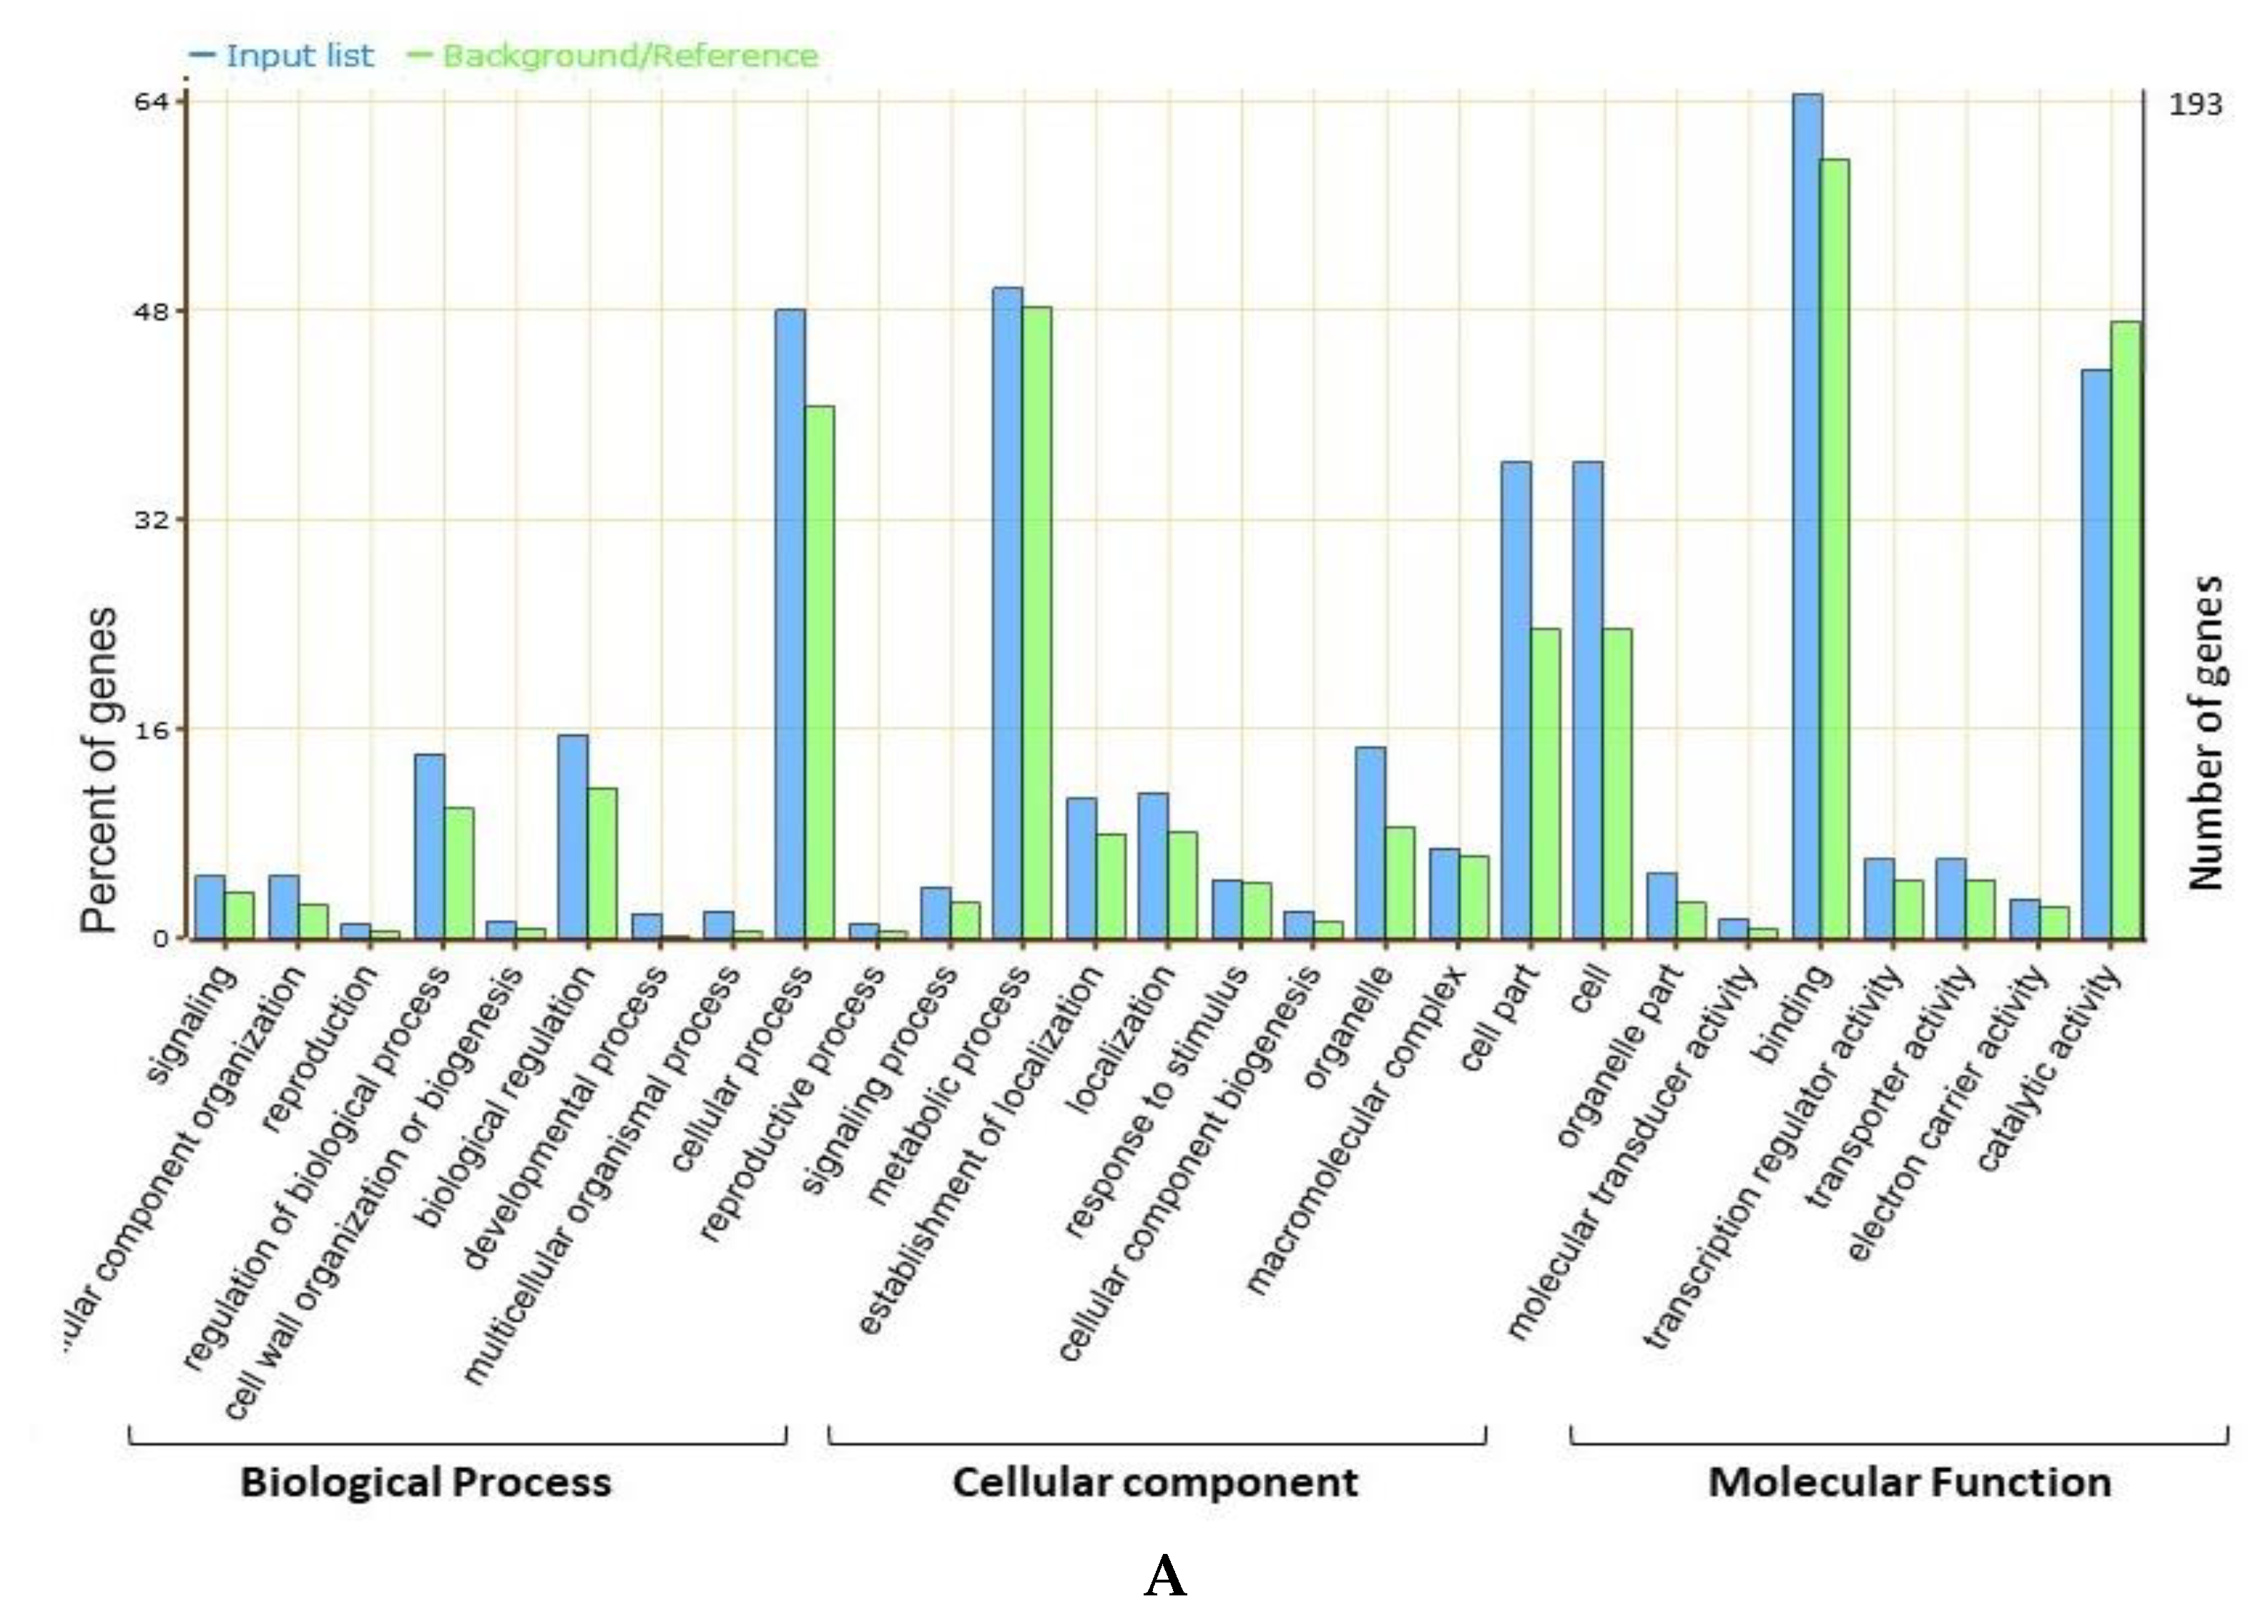
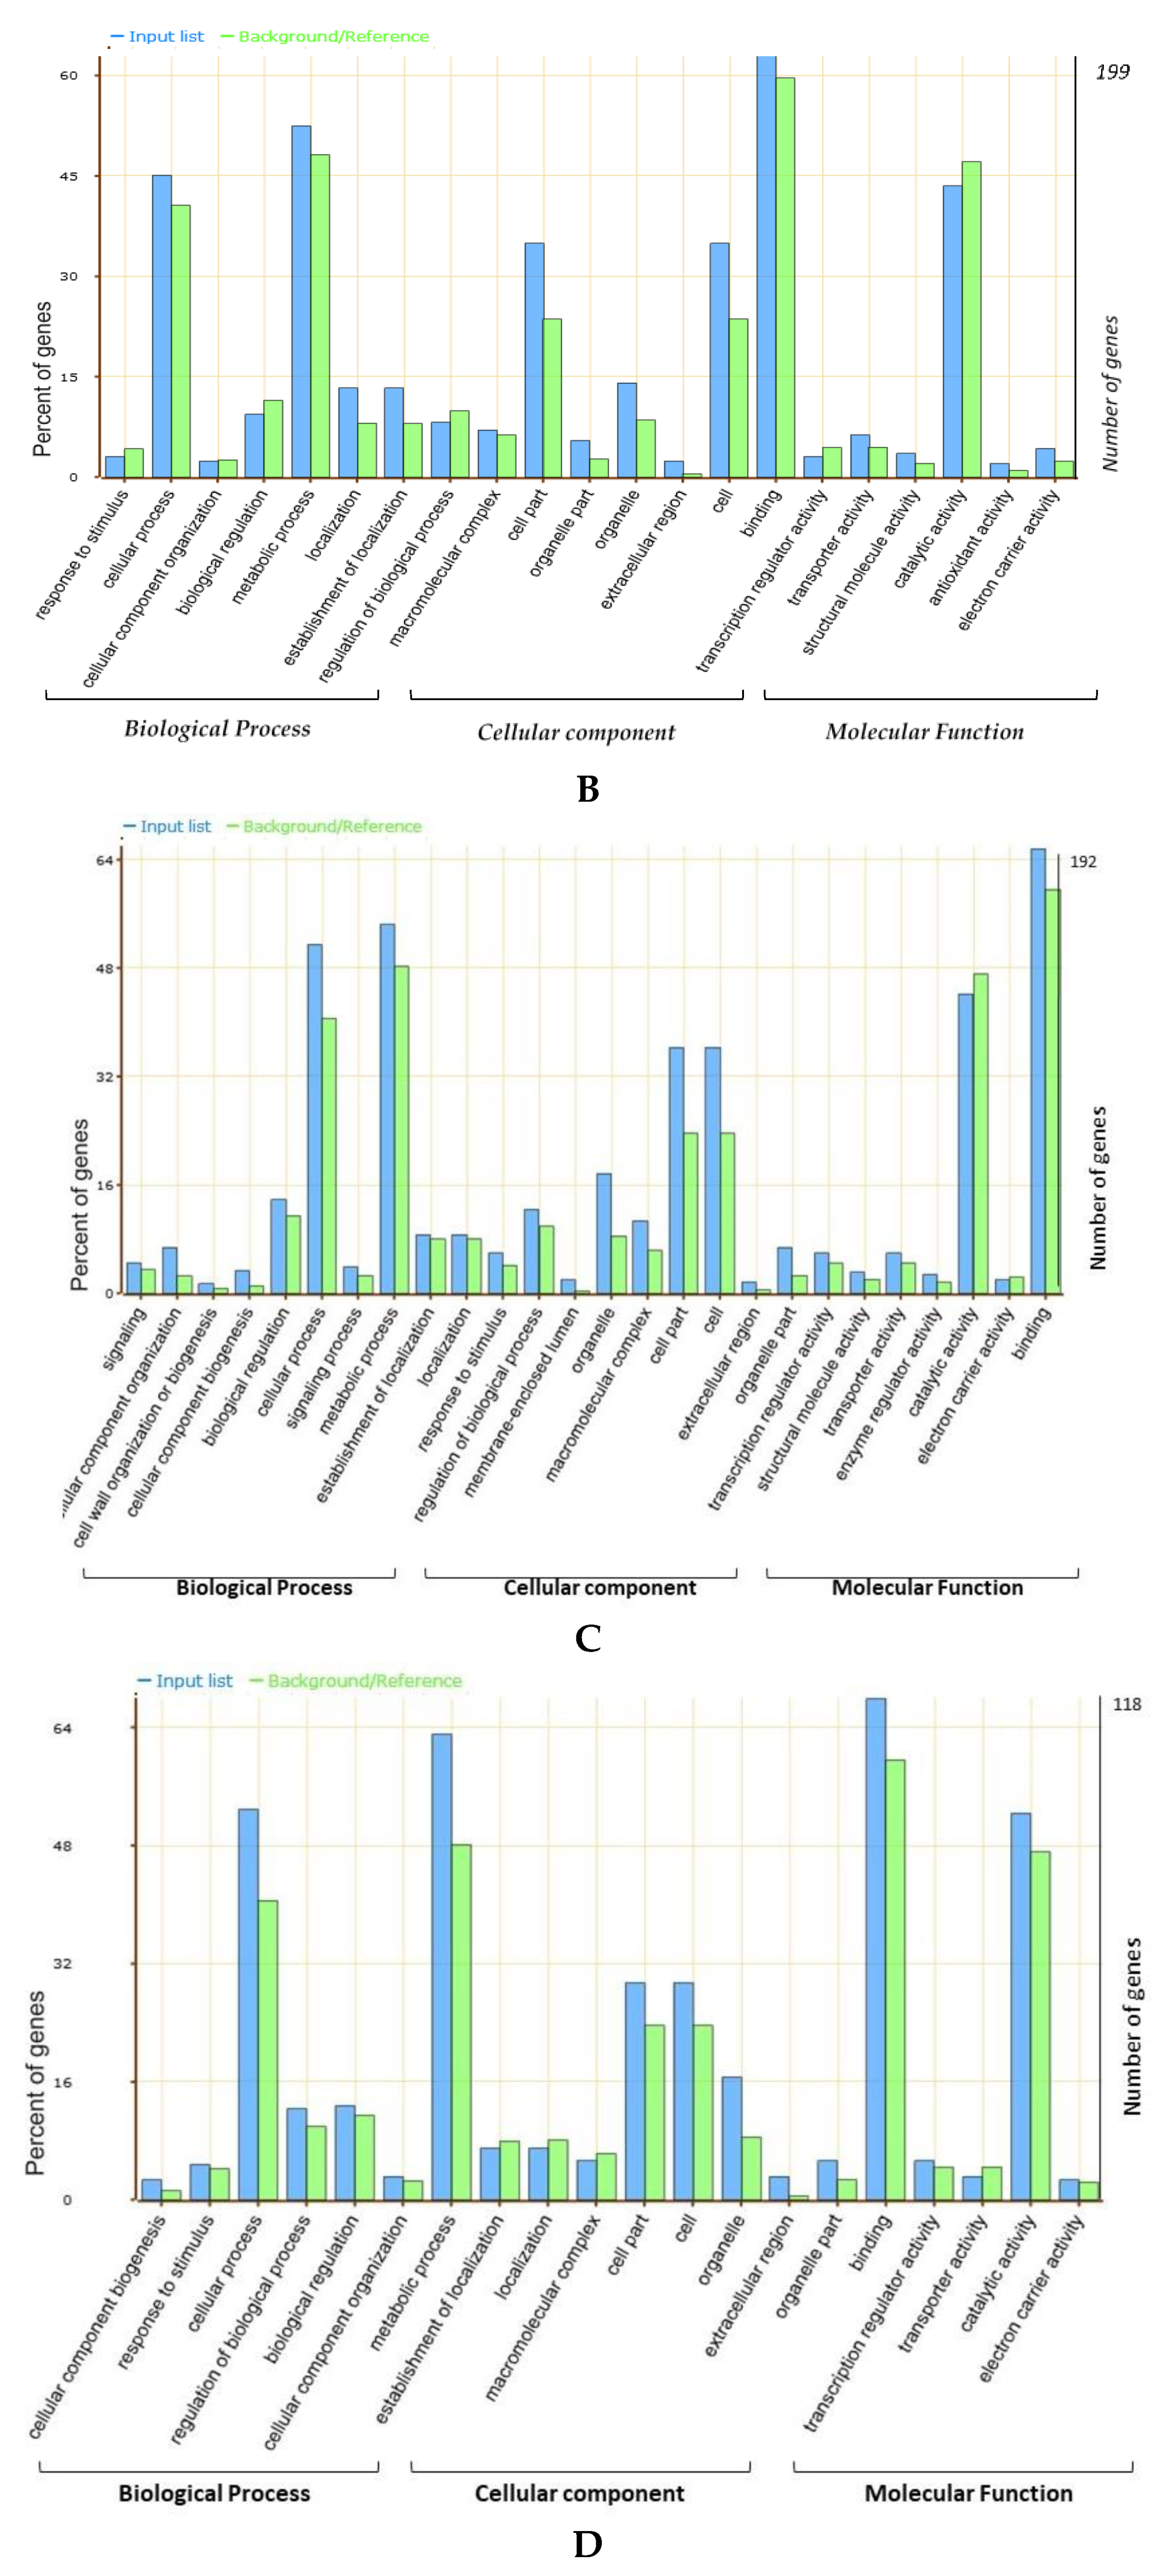
58]. Based on the gene annotations, available literature, and GO enrichment analysis, the present study identified the possible candidate genes regulating the seed sizes and shapes in soybeans that underlies the four categorized “QTL hotspots”. Gene ontology (GO) analysis revealed that most of the genes underlying the above four “QTL hotspots” belong to the terms cellular process, metabolic process, cell part, cell, catalytic activity, and binding, and these elements are reported as being vital in seed development [59,60,61]. A total of 2406 gene models were mined within the physical interval of the four “QTL hotspots.” Out of them, 88 were considered as possible candidate genes, based on the GO enrichment analysis, gene function, and available literature. These 88 predicted candidate genes have functions that are directly or indirectly involved in seed development, influencing the shape and size of seeds, such as lipid storage, transport and metabolic processes, signal transduction of plant hormones, degradation of the ubiquitin-proteasome pathway, fatty acid beta-oxidation, the brassinosteroid-mediated signaling pathway, and the auxin biosynthetic process (
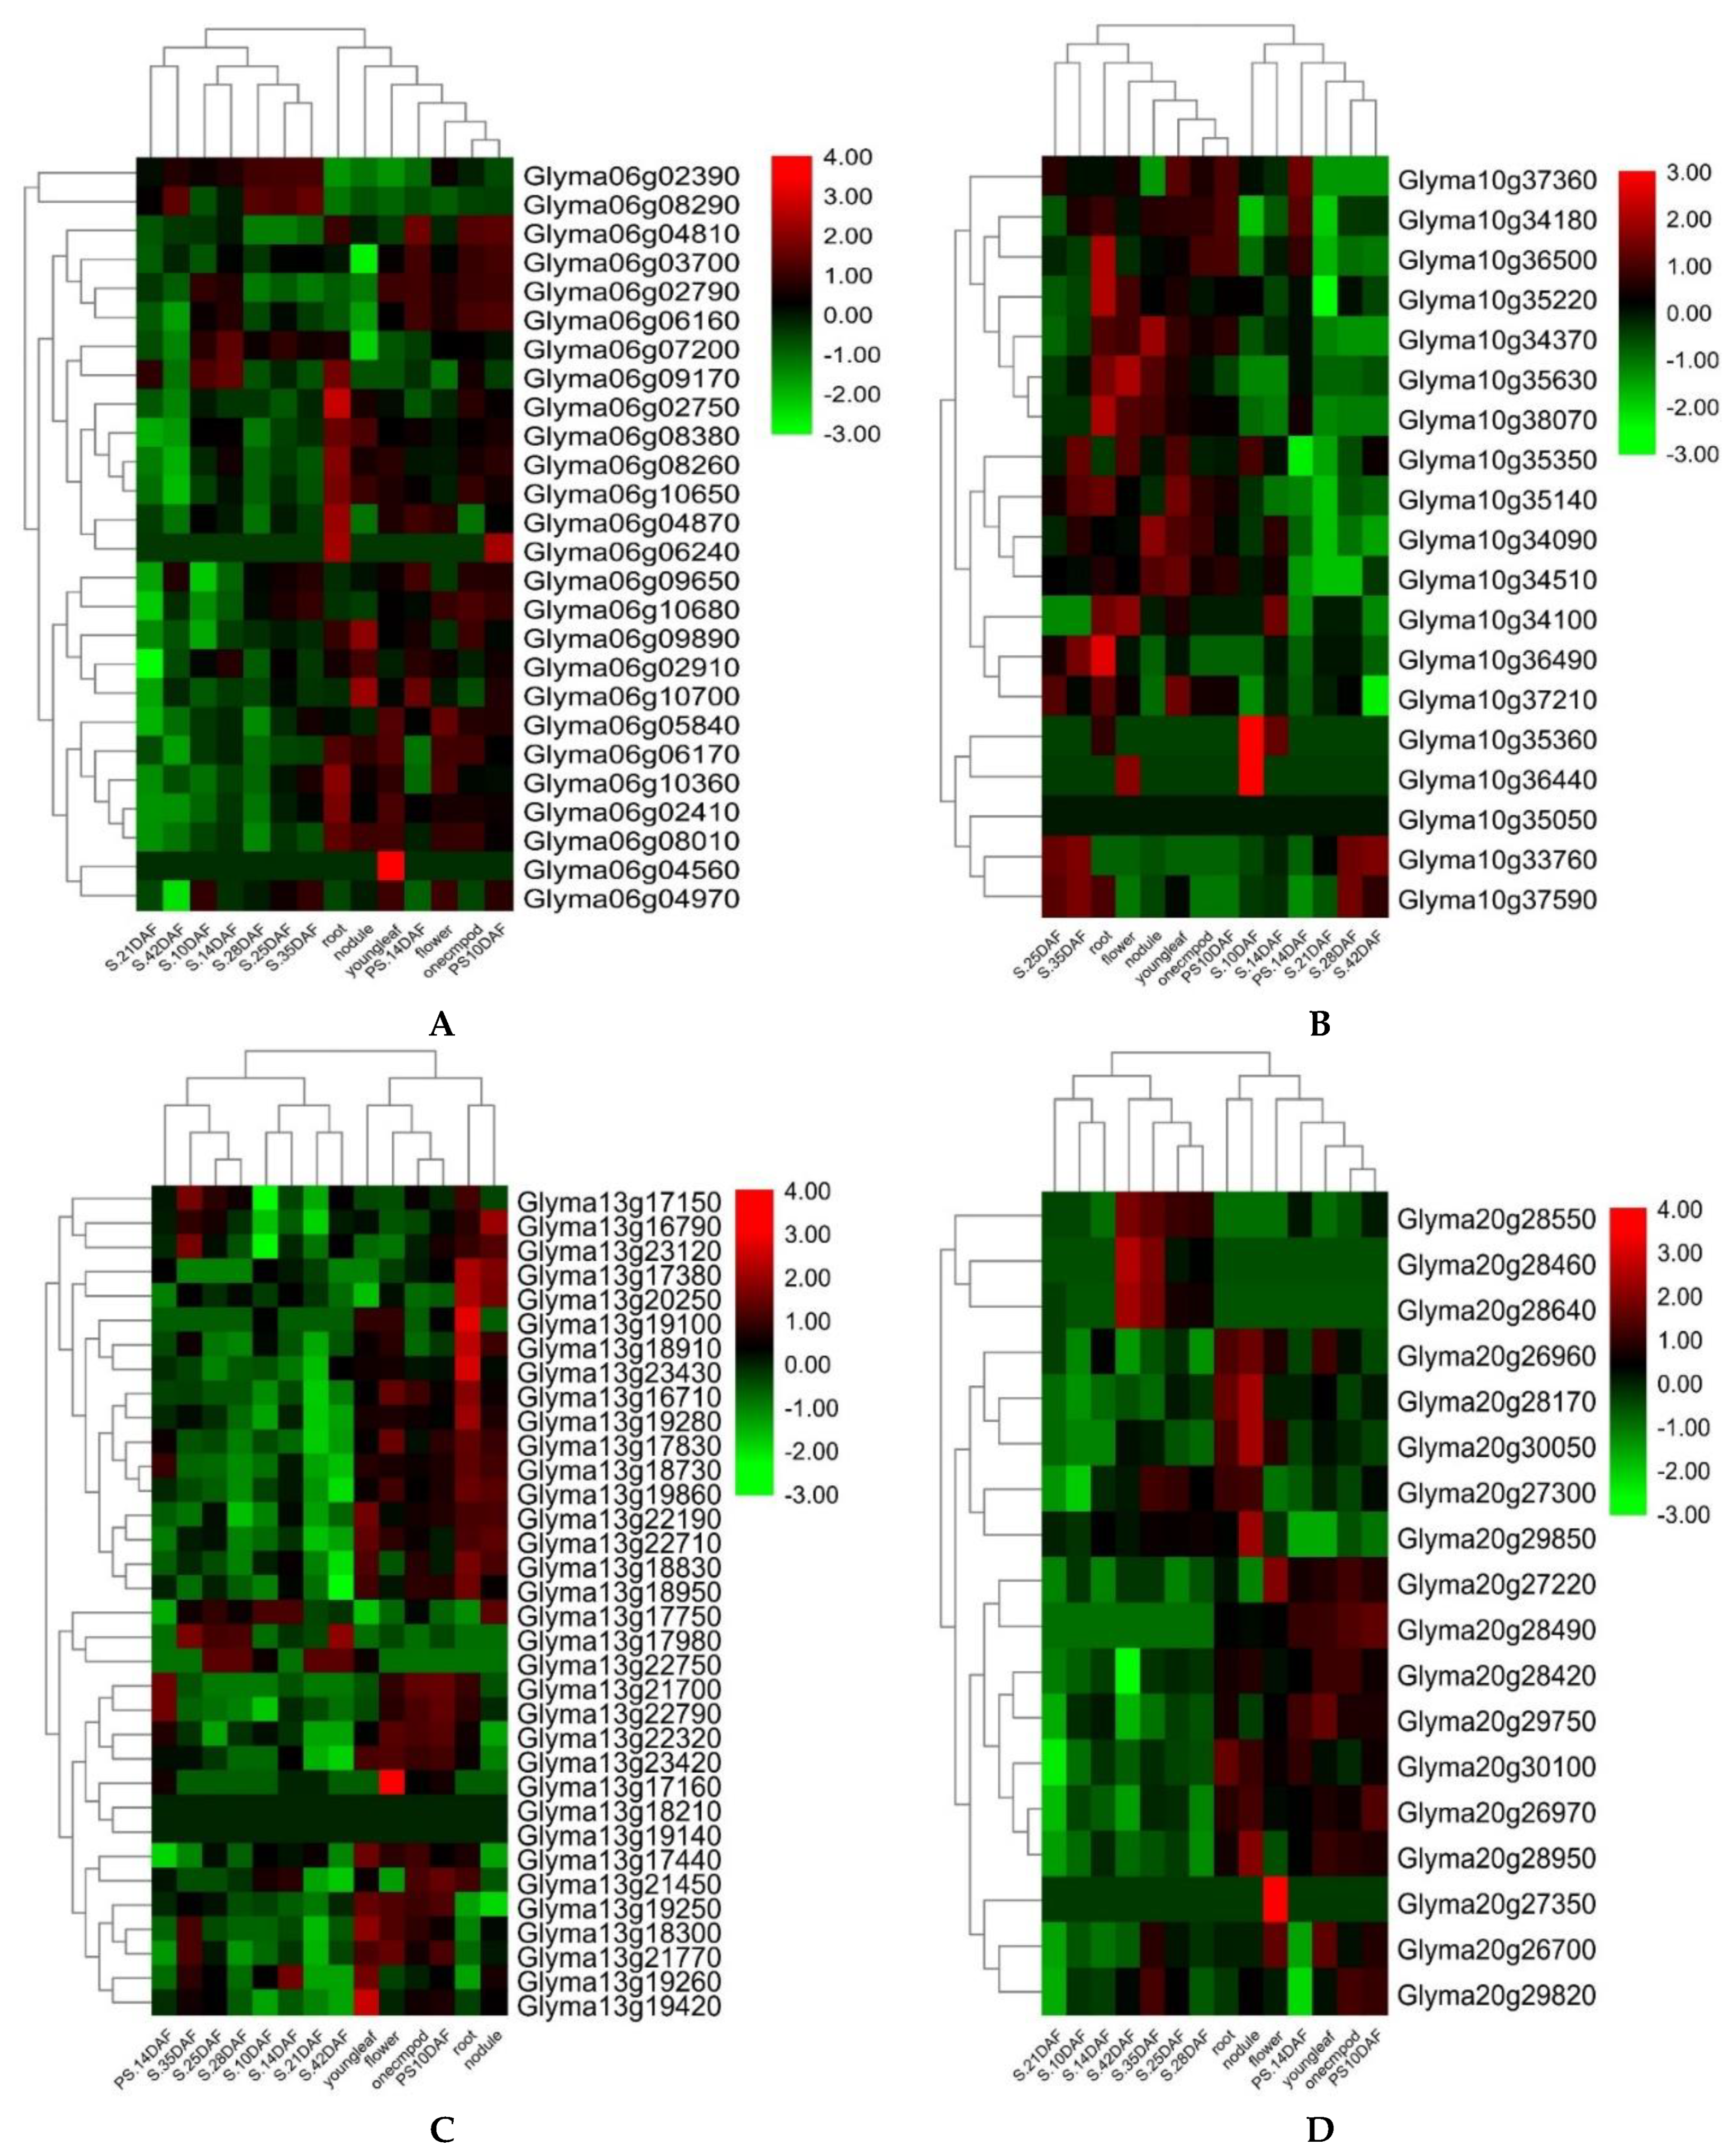
Table S5). From the available gene expression data (RNA-seq), 23 of the 88 predicted candidate genes expressed significantly higher gene expression, particularly in seed development stages, root nodules, leaf, and pod shell (Figure 5 and Table S5). Out of these 23 genes, five genes, viz., Glyma06g04810, Glyma06g03700, Glyma13g17980, Glyma13g21770, and Glyma20g30100 have functions that are related to seed development, ovule development, endosperm, and embryo development, which have been reported to directly contribute to seed sizes and shapes in crop plants, including soybeans [62,63]. Likewise, Glyma06g02390, Glyma06g06160, Glyma06g07200, and Glyma13g18730 encode RING/U-box superfamily proteins/protein ubiquitination. The ubiquitin pathway has recently been known to play an essential part in seed size determination [60]. Several factors involved in ubiquitin-related activities have been revealed to determine seed sizes in Arabidopsis and rice [60]. Genes, viz., Glyma06g08290, Glyma20g28460, Glyma20g28640, Glyma20g29750, Glyma20g28550, Glyma13g22790, Glyma20g29750, and Glyma20g27300, function in lipid storage, seed maturation, and cell growth, which have formerly been reported to determine seed size and shape in oilseeds, including soybeans [64]. For example, overexpression of GmMYB73 promotes lipid accumulation in soybean seeds, which leads to increased seed sizes in soybeans [65]. Genes, viz., Glyma06g09650, Glyma10g35360, Glyma10g36440, Glyma13g17750, and Glyma13g21700, are involved in auxin biosynthesis, responses to auxin stimulus, and responses to ethylene stimulus. The auxin regulates seed weights and sizes in Arabidopsis [22,66]. Glyma06g10700 functions to regulate the brassinosteroid stimulus, which positively governs seed size [62]. Hence, based on the gene function, GO, and RNA-Seq analysis, the above 23 genes were considered as the most potentially possible candidate genes for regulating the seed sizes and shapes in soybeans. However, it requires further validation and verification to confirm their actual roles in seed sizes/shapes in soybeans, as well as their future uses for the improvement of seed quality traits. Some of these genes were already included in our ongoing project for functional validation to ascertain their effects on the seed sizes and shapes. Hence, the precise identification of QTLs in a specific physical interval through the use of a high-density map would make it easy to identify candidate genes.

4. Materials and Methods

4.1. Plant Material and Experimental Conditions

In the present study, two related RIL populations, viz., ZY and K3N, consisting of 236 and 91 lines, respectively, were used for elucidating the genetic basis of seed shapes and sizes in soybeans. The ZY and K3N populations were derived through a single seed descent (SSD) method by crossing a common higher seed size parent Nannong1138-2 (N) with two cultivated soybean varieties, viz., Zhengxiaodou (Z) and KeFeng35 (K3), having smaller seed sizes [67]. All the plant material was received from Soybean Germplasm Gene Bank, located at the National Centre for Soybean Improvement (Ministry of Agriculture), Nanjing Agricultural University, Nanjing, China. The F6:9–F6:11 generations of both RIL populations were planted in three different environments, viz., Jiangpu Experimental Station, Nanjing, Jiangsu Province (Latitude 33°03′ N; Longitude 63°118′ E) in 2012 and 2017 (2012JP and 2017JP) and Fengyang Experimental Station, Chuzhou, Anhui Province (Latitude 32°87′ N; Longitude 117°56′ E) in 2012 (2012FY). Both RIL populations, along with their parents, were planted in a single-line plot of 1 m in length and 0.5 m in width in a randomized complete block design with three replications. In each environment, standard cultural and agronomic practices were trailed, as previously described [68,69].

4.2. Phenotypic Evaluation and Statistical Analysis

For the phenotypic assessment of seed size and shape, we collected seeds from the randomly selected ten plants harvested from the middle of each block across three different environments (2012JP, 2012FY, and 2017JP) in both RIL populations. The seed size traits include seed length (SL), seed width (SW), and seed thickness (ST), whereas seed shape was assessed using three different ratios, viz., seed length/seed width (SLW), seed length/seed thickness (SLT), and seed width/seed thickness (SWT). The SL, SW, and ST were measured in millimeters (mm) using the vernier caliper instrument, according to Kaushik et al. [39]. However, SLW, SLT, and SWT were estimated from the individual values of the SL, SW, and ST, respectively, by following Omokhafe and Alika [41].
Descriptive statistics, such as mean, range (maximum and minimum values), coefficient of variation (CV%), skewness, and kurtosis for above seed size and shape traits in both RIL populations, including their parents, were calculated using the SPSS17.0 software (http://www.spss.com) [42]. For each environment, an analysis of variance (ANOVA) was carried out using a generalized linear model (GLM) program of SAS PROC (SAS Institute Inc. v. 9.02, 2010, Cary, NC, USA). The ANOVA for the combined environment (CE) was also performed in SAS software using mixed PROC with random factors: lines, environments, replication within environments, and the line-by-environment interaction. Pearson correlation coefficient (r) among traits was calculated from the average data using PROC CORR in combined environments. The broad-sense heritability (h2) in RIL populations was estimated using the following equation:
h 2 = σ G 2 / ( σ G 2 + σ G E 2 / n + σ e 2 / nr )
where σ G 2 is the genotypic variance, σ G E 2 is the variance of the genotype-by-environment interaction, σ e 2 is the error variance, n is the number of environments, and r is the number of replications within an environment [44].

4.3. SNP Genotyping and Bin Map Construction

Genetic map construction began with the extraction of DNA from the young and fresh leaves of both RIL populations, along with their parents, by following the protocol of Zhang et al. [45]. DNA library construction, high-throughput sequencing (RAD-Seq), high-quality SNP acquisition, and SLAF/bin marker integration for ZY and K3N populations, respectively, were performed as described by Huang et al. [70] and Cao et al. [30]. These SLAF and bin markers were employed to develop the linkage maps of the ZY and K3N populations, respectively, using JoinMap 4.0 [71]. High-density genetic maps of the ZY and K3N populations contained 3255 SLAF and 1733 bin markers, respectively. The total length of the ZY and K3N maps were 2144.85 and 2362.44 cM, with an average distance between the adjacent markers as 0.659 and 1.36 cM, respectively (Table S7). The average length of each linkage group was 162.75 and 86.65 cM for ZY and K3N linkage maps, with the mean marker density of each linkage group as 107.24 and 118.122, respectively (Table S7).

4.4. QTL Mapping for Seed Size and Shape

For QTL analysis, we used the WinQTLCart 2.5 software [47] and QTLNetwork 2.2 [72]. The model of composite interval mapping (CIM) was used to identify the main-effect QTLs (M-QTLs) with a 10 cM window at a walking speed of 1cM for the WinQTLCart 2.5 software. The LOD threshold was premeditated using 1000 permutations for an experimental-wise error rate of P = 0.05 to determine whether the QTL was significantly associated with the traits [73]. The model of mixed linear composite interval mapping (MCIM) was applied to identify significant additive effect QTLs, epistatic QTLs (AA), genotype-by-environment interaction effects (additive by the environment (AE) and AA by the environment (AAE)) in the QTLNetwork 2.2 [74]. The physical location of M-QTLs on each chromosome were drawn by using MapChart 2.1 software [75].
QTLs were named by following standard nomenclature [76], with minor modifications. For example, for the QTL denoted as qSW-1-1ZY, q indicates QTL, SW stands for the trait (seed width), -1 show the chromosome on which the QTL detected, -1 also indicates the order of QTL identified on the chromosome for each trait, andZY represents the ZY-RIL population in which QTL was detected.

4.5. Mining of Candidate Genes for Major QTLs

QTLs identified in two or more than two environments with R2 > 10% were considered as significant and stable QTLs [77]. By utilizing the online resource databases of Phytozome (http://phytozome.jgi.doe.gov) and SoyBase (http://www.soybase.org), we downloaded all the genomic data within the physical interval position of the major “QTL hotspots”, and candidate genes were predicted based on the gene annotations (http://www.soybase.org and https://phytozome.jgi.doe.gov), as well as previously published literature. Gene ontology (GO) information was derived from SoyBase through online resources: GeneMania (http://genemania.org/); Gramene (http://archive.gramene.org/db/ontology); the Kyoto Encyclopedia of Genes and Genomes website (KEGG, www.kegg.jp); and the National Centre for Biotechnology Information (NCBI: https://www.ncbi.nlm.nih.gov). These were used to screen the predicted candidate genes further. Gene ontology (GO) enrichment analysis was conducted for all the genes within the four major “QTL hotspots”, viz., “QTL Hotspot A”, “QTL Hotspot B”, “QTL Hotspot C”, and “QTL Hotspot D”, using agriGO V2.0 (http://systemsbiology.cau.edu.cn/agri-GOv2/) [78]. The freely available RNA-Seq dataset at the SoyBase website was obtained to analyze the expression of predicted candidate genes in different soybean tissues, as well as the development stages. A heat map for the visualization of fold-change in the expression patterns of these predicted candidate genes was constructed by using TBtools_JRE1.6 software [79].

5. Conclusions

In conclusion, the present study is a detailed investigation for elucidating the genetic architecture of seed sizes and shapes in soybean. In aggregate, 88 and 48 QTLs were detected through CIM and MCIM, respectively, including 15 common QTLs, with two major (R2 > 10%) and novel QTLs, viz., qSW-1-1ZY and qSLT-20-1K3N. Besides, 51 and 27 QTLs, identified through CIM and MCIM, respectively, were reported for the first time. All identified QTLs were clustered into four major “QTL cluster/hotspots” and represent the major and stable genomic regions governing the inheritance of soybean seed sizes and shapes. Hence, these “QTL hotspot” regions could be of significant consideration for future soybean breeding. Our study predicted 23 genes as the possible candidates, regulating seed sizes and shapes within the genomic region of four “QTL hotspots”; however, they need further functional validation to clarify their actual roles in seed development. Moreover, our results showed that 15 QTLs exhibited significant AE effects, and 16 pairs of QTLs possessed an epistatic effect. However, except for three QTLs, viz., qSL-13-3ZY, qSL-13-4ZY, and qSW-13-4ZY, all the remaining epistatic QTLs showed no main effects. Hence, the hotspot regions and novel significant stable QTLs identified in the present study will be the main focus of soybean breeders for fine mapping, gene cloning, and the MAB of soybean varieties with improved seed quality and yield.

Supplementary Materials

The following are available online at https://0-www-mdpi-com.brum.beds.ac.uk/1422-0067/21/3/1040/s1, Table S1: Descriptive statistics, broad-sense heritability (h2) of Seed Shape & size traits evaluated in two recombinant inbred lines (RILs) ZY & K3N. The RILs and the parent were grown in different field environments of years and locations. * &** represent significance at 5% and 1%, respectively; Table S2: Combined analysis of variance (ANOVA) for Seed shape & size trait (SL,SW,ST,SLW,SLT,SWT) in ZY & K3N RIL Populations across three different environments (2012FY, 2012JP and 2017JP); Table S3: Correlation analysis among six Seed size/shape traits (SL,SW,ST,SLW,SLT,SWT). * &** represent significance at 5% and 1%, respectively; Table S4: Model genes within cluster-06, cluster-10, cluster-13 and cluster-20 regions in both RIL Populations (ZY & K3N); Table S5: Candidate genes within cluster-06, cluster-10, cluster-13 and cluster-20 in ZY and K3N-RIL Populations and their relative expression data retrived from RNA-seq data available in soybase; Table S6: Predicted candidate genes within cluster-06, cluster-10, cluster-13 and cluster-20 regions in both RI Populations (ZY & K3N) based on known functional annotation; Table S7: Distribution of SLAF and bin markers mapped on soybean chromosomes/linkage groups in ZY & K3N Populations, respectively.

Author Contributions

T.Z. and J.A.B. conceived and designed the project. A.H. and S.S. performed the experiments. A.H., Y.C., S.S., S.L., R.A.S., and M.A.E. analyzed the data. A.H. drafted the manuscript. T.Z. and, J.A.B. revised the paper. All authors have read and agreed to the published version of the manuscript.

Funding

This research was funded by the National Key Research and Development Program (2018YFD0201006), the National Natural Science Foundation of China (Grant Nos. 31871646 and 31571691), the MOE Program for Changjiang Scholars and Innovative Research Team in University (PCSIRT_17R55), the Fundamental Research Funds for the Central Universities (KYT201801), and the Jiangsu Collaborative Innovation Center for Modern Crop Production (JCIC-MCP) Program.

Conflicts of Interest

The authors declare no conflicts of interest. The funders had no role in the design of the study; in the collection, analyses, or interpretation of data; in the writing of the manuscript, or in the decision to publish the results.

Abbreviations

SLSeed Length
SWSeed Width
STSeed Thickness
SLWSeed Length-to-Width
SLTSeed Length-to-Thickness
SWTSeed Width-to-Thickness
G x EGenotype x Environment
QTLQuantitative Trait Loci
USDAUnited States Department of Agriculture
SSRsSimple Sequence Repeats
M-QTLMain-Effect QTL
E-QTLEpistatic-Effect QTL
RILRecombinant Inbred Line
PVPhenotypic Variation
SSDSingle Seed Decent
RCBDRandomized Complete Block Design
Mmmillimeters
CVCoefficient of Variation
ANOVAAnalysis of Variance
GLMGeneralized Linear Model
CECombined Environment
MSGMultiplexed Shotgun Genotyping
SNPSingle Nucleotide Polymorphisms
CIMComposite Interval Mapping
LODLogarithm of the Odds

References

  1. Wang, D.; Bales-Arcelo, C.; Zhang, Z.; Gu, C.; DiFonzo, C.D.; ZHANG, G.; Yang, Z.; Liu, M.; Mensah, C. Sources of Aphid Resistance in Soybean Plants. Google Patents. 2019. Available online: https://peshkin.mech.northwestern.edu/patents/10108288. (accessed on 1 October 2019).
  2. Liu, D.; Yan, Y.; Fujita, Y.; Xu, D. Identification and validation of QTLs for 100-seed weight using chromosome segment substitution lines in soybean. Breed. Sci. 2018, 68, 442–448. [Google Scholar] [CrossRef] [PubMed] [Green Version]
  3. Salas, P.; Oyarzo-Llaipen, J.; Wang, D.; Chase, K.; Mansur, L. Genetic mapping of seed shape in three populations of recombinant inbred lines of soybean (Glycine max L. Merr.). Theor. Appl. Genet. 2006, 113, 1459–1466. [Google Scholar] [CrossRef] [PubMed]
  4. Yan, S.; Zou, G.; Li, S.; Wang, H.; Liu, H.; Zhai, G.; Guo, P.; Song, H.; Yan, C.; Tao, Y. Seed size is determined by the combinations of the genes controlling different seed characteristics in rice. Theor. Appl. Genet. 2011, 123, 1173. [Google Scholar] [CrossRef] [PubMed]
  5. Xu, Y.; Li, H.-N.; Li, G.-J.; Wang, X.; Cheng, L.-G.; Zhang, Y.-M. Mapping quantitative trait loci for seed size traits in soybean (Glycine max L. Merr.). Theor. Appl. Genet. 2011, 122, 581–594. [Google Scholar] [CrossRef] [PubMed]
  6. Tao, Y.; Mace, E.S.; Tai, S.; Cruickshank, A.; Campbell, B.C.; Zhao, X.; Van Oosterom, E.J.; Godwin, I.D.; Botella, J.R.; Jordan, D.R. Whole-genome analysis of candidate genes associated with seed size and weight in sorghum bicolor reveals signatures of artificial selection and insights into parallel domestication in cereal crops. Front. Plant. Sci. 2017, 8, 1237. [Google Scholar] [CrossRef] [Green Version]
  7. Hu, Z.; Zhang, H.; Kan, G.; Ma, D.; Zhang, D.; Shi, G.; Hong, D.; Zhang, G.; Yu, D. Determination of the genetic architecture of seed size and shape via linkage and association analysis in soybean (Glycine max L. Merr.). Genetica 2013, 141, 247–254. [Google Scholar] [CrossRef]
  8. Sax, K. The association of size differences with seed-coat pattern and pigmentation in Phaseolus vulgaris. Genetics 1923, 8, 552. [Google Scholar]
  9. Cui, Z.; James, A.; Miyazaki, S.; Wilson, R.F.; Carter, T. Breeding specialty soybeans for traditional and new soyfoods. In Soybeans as Functional Foods and Ingredients; Liu, K., Ed.; AOSC Press: Champaign, IL, USA, 2004; pp. 274–332. [Google Scholar]
  10. Gandhi, A. Quality of soybean and its food products. Int. Food Res. J. 2009, 16, 11–19. [Google Scholar]
  11. Liang, H.; Xu, L.; Yu, Y.; Yang, H.; Dong, W.; Zhang, H. Identification of QTLs with main, epistatic and QTL by environment interaction effects for seed shape and hundred-seed weight in soybean across multiple years. J. Genet. 2016, 95, 475–477. [Google Scholar] [CrossRef]
  12. Teng, W.; Feng, L.; Li, W.; Wu, D.; Zhao, X.; Han, Y.; Li, W. Dissection of the genetic architecture for soybean seed weight across multiple environments. Crop. Pasture Sci. 2017, 68, 358–365. [Google Scholar] [CrossRef]
  13. Wu, D.; Zhan, Y.; Sun, Q.; Xu, L.; Lian, M.; Zhao, X.; Han, Y.; Li, W. Identification of quantitative trait loci underlying soybean (Glycine max [L.] Merr.) seed weight including main, epistatic and QTL× environment effects in different regions of Northeast China. Plant. Breed. 2018, 137, 194–202. [Google Scholar] [CrossRef]
  14. Coomes, D.A.; Grubb, P.J. Colonization, tolerance, competition and seed-size variation within functional groups. Trends Ecol. Evol. 2003, 18, 283–291. [Google Scholar] [CrossRef]
  15. Gómez, J.M. Bigger is not always better: Conflicting selective pressures on seed size in Quercus ilex. Evolution 2004, 58, 71–80. [Google Scholar] [CrossRef] [PubMed]
  16. Haig, D. Kin conflict in seed development: An interdependent but fractious collective. Annu. Rev. Cell Dev. Biol. 2013, 29, 189–211. [Google Scholar] [CrossRef]
  17. Che, J.; Ding, J.; Liu, C.; Xin, D.; Jiang, H.; Hu, G.; Chen, Q. Quantative trait loci of seed traits for soybean in multiple environments. Genet. Mol. Res. 2014, 13, 4000–4012. [Google Scholar] [CrossRef]
  18. Lü, H.-Y.; Liu, X.-F.; Wei, S.-P.; Zhang, Y.-M. Epistatic association mapping in homozygous crop cultivars. PLoS ONE 2011, 6, e17773. [Google Scholar]
  19. Mian, M.; Bailey, M.; Tamulonis, J.; Shipe, E.; Carter, T.; Parrott, W.; Ashley, D.; Hussey, R.; Boerma, H. Molecular markers associated with seed weight in two soybean populations. Theor. Appl. Genet. 1996, 93, 1011–1016. [Google Scholar] [CrossRef]
  20. Hoeck, J.A.; Fehr, W.R.; Shoemaker, R.C.; Welke, G.A.; Johnson, S.L.; Cianzio, S.R. Molecular marker analysis of seed size in soybean. Crop. Sci. 2003, 43, 68–74. [Google Scholar] [CrossRef] [Green Version]
  21. Li, C.; Jiang, H.; Zhang, W.; Qiu, P.; Liu, C.; Li, W.; Gao, Y.; Chen, Q.; Hu, G. QTL analysis of seed and pod traits in soybean. Mol. Plant. Breed. 2008, 6, 1091–1100. [Google Scholar]
  22. Xie, F.-T.; Niu, Y.; Zhang, J.; Bu, S.-H.; Zhang, H.-Z.; Geng, Q.-C.; Feng, J.-Y.; Zhang, Y.-M. Fine mapping of quantitative trait loci for seed size traits in soybean. Mol. Breed. 2014, 34, 2165–2178. [Google Scholar] [CrossRef]
  23. Tanksley, S.D.; Miller, J.; Paterson, A.; Bernatzky, R. Molecular mapping of plant chromosomes. In Chromosome Structure and Function; Springer: Boston, MA, USA, 1988; pp. 157–173. [Google Scholar]
  24. Li, W.-H.; Wei, L.; Li, L.; You, M.-S.; Liu, G.-T.; Li, B.-Y. QTL mapping for wheat flour color with additive, epistatic, and QTL× environmental interaction effects. Agric. Sci. China 2011, 10, 651–660. [Google Scholar] [CrossRef]
  25. Panthee, D.R.; Marois, J.J.; Wright, D.L.; Narváez, D.; Yuan, J.S.; Stewart, C.N. Differential expression of genes in soybean in response to the causal agent of Asian soybean rust (Phakopsora pachyrhizi Sydow) is soybean growth stage-specific. Theor. Appl. Genet. 2009, 118, 359. [Google Scholar] [CrossRef] [PubMed]
  26. Zhang, Y.; Li, W.; Lin, Y.; Zhang, L.; Wang, C.; Xu, R. Construction of a high-density genetic map and mapping of QTLs for soybean (Glycine max) agronomic and seed quality traits by specific length amplified fragment sequencing. BMC Genom. 2018, 19, 641. [Google Scholar] [CrossRef] [PubMed]
  27. Xu, Y.; Crouch, J.H. Marker-assisted selection in plant breeding: From publications to practice. Crop. Sci. 2008, 48, 391–407. [Google Scholar] [CrossRef] [Green Version]
  28. Yang, B.Z.; Zhao, H.; Kranzler, H.R.; Gelernter, J. Practical population group assignment with selected informative markers: Characteristics and properties of Bayesian clustering via STRUCTURE. Genet. Epidemiol. 2005, 28, 302–312. [Google Scholar] [CrossRef]
  29. Wang, R.-L.; Stec, A.; Hey, J.; Lukens, L.; Doebley, J. The limits of selection during maize domestication. Nature 1999, 398, 236. [Google Scholar] [CrossRef]
  30. Cao, Y.; Li, S.; Chen, G.; Wang, Y.; Bhat, J.; Karikari, B.; Kong, J.; Junyi, G.; Zhao, T.-J. Deciphering the Genetic Architecture of Plant Height in Soybean Using Two RIL Populations Sharing a Common M8206 Parent. Plants 2019, 8, 373. [Google Scholar] [CrossRef] [Green Version]
  31. Li, H.; Liu, H.; Han, Y.; Wu, X.; Teng, W.; Liu, G.; Li, W. Identification of QTL underlying vitamin E contents in soybean seed among multiple environments. Theor. Appl. Genet. 2010, 120, 1405–1413. [Google Scholar] [CrossRef] [Green Version]
  32. Moongkanna, J.; Nakasathien, S.; Novitzky, W.; Kwanyuen, P.; Sinchaisri, P.; Srinives, P. SSR markers linking to seed traits and total oil content in soybean. Thai J. Agric. Sci. 2011, 44, 233–241. [Google Scholar]
  33. Fang, C.; Ma, Y.; Wu, S.; Liu, Z.; Wang, Z.; Yang, R.; Hu, G.; Zhou, Z.; Yu, H.; Zhang, M. Genome-wide association studies dissect the genetic networks underlying agronomical traits in soybean. Genome Biol. 2017, 18, 161. [Google Scholar] [CrossRef] [PubMed]
  34. Jun, T.H.; Freewalt, K.; Michel, A.P.; Mian, R. Identification of novel QTL for leaf traits in soybean. Plant. Breed. 2014, 133, 61–66. [Google Scholar] [CrossRef]
  35. Severin, A.J.; Woody, J.L.; Bolon, Y.-T.; Joseph, B.; Diers, B.W.; Farmer, A.D.; Muehlbauer, G.J.; Nelson, R.T.; Grant, D.; Specht, J.E. RNA-Seq Atlas of Glycine max: A guide to the soybean transcriptome. BMC Plant. Biol. 2010, 10, 160. [Google Scholar] [CrossRef] [PubMed] [Green Version]
  36. Niu, Y.; Xu, Y.; Liu, X.-F.; Yang, S.-X.; Wei, S.-P.; Xie, F.-T.; Zhang, Y.-M. Association mapping for seed size and shape traits in soybean cultivars. Mol. Breed. 2013, 31, 785–794. [Google Scholar] [CrossRef]
  37. Fasoula, V.A.; Harris, D.K.; Boerma, H.R. Validation and designation of quantitative trait loci for seed protein, seed oil, and seed weight from two soybean populations. Crop. Sci. 2004, 44, 1218–1225. [Google Scholar] [CrossRef]
  38. Jansen, R.; Van Ooijen, J.; Stam, P.; Lister, C.; Dean, C. Genotype-by-environment interaction in genetic mapping of multiple quantitative trait loci. Theor. Appl. Genet. 1995, 91, 33–37. [Google Scholar] [CrossRef] [Green Version]
  39. Kaushik, N.; Kumar, K.; Kumar, S.; Kaushik, N.; Roy, S. Genetic variability and divergence studies in seed traits and oil content of Jatropha (Jatropha curcas L.) accessions. Biomass Bioenergy 2007, 31, 497–502. [Google Scholar] [CrossRef]
  40. Tanksley, S.D. Mapping polygenes. Annu. Rev. Genet. 1993, 27, 205–233. [Google Scholar] [CrossRef]
  41. Omokhafe, K.; Alika, J. Clonal variation and correlation of seed characters in Hevea brasiliensis Muell. Arg. Ind. Crop. Prod. 2004, 19, 175–184. [Google Scholar] [CrossRef]
  42. Palanga, K.K.; Jamshed, M.; Rashid, M.; Gong, J.; Li, J.; Iqbal, M.S.; Liu, A.; Shang, H.; Shi, Y.; Chen, T. Quantitative trait locus mapping for Verticillium wilt resistance in an upland cotton recombinant inbred line using SNP-based high density genetic map. Front. Plant. Sci. 2017, 8, 382. [Google Scholar] [CrossRef] [Green Version]
  43. Chen, W.; Yao, Q.; Patil, G.B.; Agarwal, G.; Deshmukh, R.K.; Lin, L.; Wang, B.; Wang, Y.; Prince, S.J.; Song, L. Identification and comparative analysis of differential gene expression in soybean leaf tissue under drought and flooding stress revealed by RNA-Seq. Front. Plant. Sci. 2016, 7, 1044. [Google Scholar] [CrossRef] [Green Version]
  44. Nyquist, W.E.; Baker, R. Estimation of heritability and prediction of selection response in plant populations. Crit. Rev. Plant. Sci. 1991, 10, 235–322. [Google Scholar] [CrossRef]
  45. Zhang, W.-K.; Wang, Y.-J.; Luo, G.-Z.; Zhang, J.-S.; He, C.-Y.; Wu, X.-L.; Gai, J.-Y.; Chen, S.-Y. QTL mapping of ten agronomic traits on the soybean (Glycine max L. Merr.) genetic map and their association with EST markers. Theor. Appl. Genet. 2004, 108, 1131–1139. [Google Scholar] [CrossRef] [PubMed]
  46. Zhang, X.; Hina, A.; Song, S.; Kong, J.; Bhat, J.A.; Zhao, T. Whole-genome mapping identified novel “QTL hotspots regions” for seed storability in soybean (Glycine max L.). BMC Genom. 2019, 20, 499. [Google Scholar] [CrossRef] [PubMed] [Green Version]
  47. Wang, S. Windows QTL Cartographer 2.5. Raleigh,NC: Department of Statistics, North Carolina State University. 2007. Available online: https://brcwebportal.cos.ncsu.edu/qtlcart/WQTLCart.htm. (accessed on 1 June 2019).
  48. Bandillo, N.; Jarquin, D.; Song, Q.; Nelson, R.; Cregan, P.; Specht, J.; Lorenz, A. A population structure and genome-wide association analysis on the USDA soybean germplasm collection. Plant. Genome 2015, 8. [Google Scholar] [CrossRef] [Green Version]
  49. Priolli, R.H.G.; Campos, J.; Stabellini, N.; Pinheiro, J.B.; Vello, N.A. Association mapping of oil content and fatty acid components in soybean. Euphytica 2015, 203, 83–96. [Google Scholar] [CrossRef]
  50. Zhang, J.; Song, Q.; Cregan, P.B.; Nelson, R.L.; Wang, X.; Wu, J.; Jiang, G.-L. Genome-wide association study for flowering time, maturity dates and plant height in early maturing soybean (Glycine max) germplasm. BMC Genom. 2015, 16, 217. [Google Scholar] [CrossRef] [Green Version]
  51. Zhou, Z.; Jiang, Y.; Wang, Z.; Gou, Z.; Lyu, J.; Li, W.; Yu, Y.; Shu, L.; Zhao, Y.; Ma, Y. Resequencing 302 wild and cultivated accessions identifies genes related to domestication and improvement in soybean. Nat. Biotechnol. 2015, 33, 408. [Google Scholar] [CrossRef] [Green Version]
  52. Leamy, L.J.; Zhang, H.; Li, C.; Chen, C.Y.; Song, B.-H. A genome-wide association study of seed composition traits in wild soybean (Glycine soja). BMC Genom. 2017, 18, 18. [Google Scholar] [CrossRef] [Green Version]
  53. Hacisalihoglu, G.; Settles, A.M. Quantification of seed ionome variation in 90 diverse soybean (Glycine max) lines. J. Plant. Nutr. 2017, 40, 2808–2817. [Google Scholar] [CrossRef]
  54. Zhao, X.; Li, W.; Zhao, X.; Wang, J.; Liu, Z.; Han, Y.; Li, W. Genome-wide association mapping and candidate gene analysis for seed shape in soybean (Glycine max). Crop. Pasture Sci. 2019, 70, 684–693. [Google Scholar] [CrossRef]
  55. Cober, E.R.; Morrison, M.J. Regulation of seed yield and agronomic characters by photoperiod sensitivity and growth habit genes in soybean. Theor. Appl. Genet. 2010, 120, 1005–1012. [Google Scholar] [CrossRef] [PubMed]
  56. Copley, T.R.; Duceppe, M.-O.; O’Donoughue, L.S. Identification of novel loci associated with maturity and yield traits in early maturity soybean plant introduction lines. BMC Genom. 2018, 19, 167. [Google Scholar] [CrossRef] [PubMed] [Green Version]
  57. Jeong, N.; Suh, S.J.; Kim, M.-H.; Lee, S.; Moon, J.-K.; Kim, H.S.; Jeong, S.-C. Ln is a key regulator of leaflet shape and number of seeds per pod in soybean. Plant. Cell 2012, 24, 4807–4818. [Google Scholar] [CrossRef] [PubMed] [Green Version]
  58. Lu, X.; Xiong, Q.; Cheng, T.; Li, Q.-T.; Liu, X.-L.; Bi, Y.-D.; Li, W.; Zhang, W.-K.; Ma, B.; Lai, Y.-C. A PP2C-1 allele underlying a quantitative trait locus enhances soybean 100-seed weight. Mol. Plant. 2017, 10, 670–684. [Google Scholar] [CrossRef] [Green Version]
  59. Fan, C.; Xing, Y.; Mao, H.; Lu, T.; Han, B.; Xu, C.; Li, X.; Zhang, Q. GS3, a major QTL for grain length and weight and minor QTL for grain width and thickness in rice, encodes a putative transmembrane protein. Theor. Appl. Genet. 2006, 112, 1164–1171. [Google Scholar] [CrossRef]
  60. Li, N.; Li, Y. Ubiquitin-mediated control of seed size in plants. Front. Plant. Sci. 2014, 5, 332. [Google Scholar] [CrossRef] [Green Version]
  61. Mao, H.; Sun, S.; Yao, J.; Wang, C.; Yu, S.; Xu, C.; Li, X.; Zhang, Q. Linking differential domain functions of the GS3 protein to natural variation of grain size in rice. Proc. Natl. Acad. Sci. USA 2010, 107, 19579–19584. [Google Scholar] [CrossRef] [Green Version]
  62. Jiang, W.-B.; Huang, H.-Y.; Hu, Y.-W.; Zhu, S.-W.; Wang, Z.-Y.; Lin, W.-H. Brassinosteroid regulates seed size and shape in Arabidopsis. Plant. Physiol. 2013, 162, 1965–1977. [Google Scholar] [CrossRef]
  63. Meng, Y.; Chen, F.; Shuai, H.; Luo, X.; Ding, J.; Tang, S.; Xu, S.; Liu, J.; Liu, W.; Du, J. Karrikins delay soybean seed germination by mediating abscisic acid and gibberellin biogenesis under shaded conditions. Sci. Rep. 2016, 6, 22073. [Google Scholar] [CrossRef] [Green Version]
  64. Siloto, R.M.; Findlay, K.; Lopez-Villalobos, A.; Yeung, E.C.; Nykiforuk, C.L.; Moloney, M.M. The accumulation of oleosins determines the size of seed oilbodies in Arabidopsis. Plant. Cell 2006, 18, 1961–1974. [Google Scholar] [CrossRef] [PubMed] [Green Version]
  65. Liu, Y.-F.; Li, Q.-T.; Lu, X.; Song, Q.-X.; Lam, S.-M.; Zhang, W.-K.; Ma, B.; Lin, Q.; Man, W.-Q.; Du, W.-G. Soybean GmMYB73 promotes lipid accumulation in transgenic plants. BMC Plant. Biol. 2014, 14, 73. [Google Scholar] [CrossRef] [PubMed] [Green Version]
  66. Schruff, M.C.; Spielman, M.; Tiwari, S.; Adams, S.; Fenby, N.; Scott, R.J. The AUXIN RESPONSE FACTOR 2 gene of Arabidopsis links auxin signalling, cell division, and the size of seeds and other organs. Development 2006, 133, 251–261. [Google Scholar] [CrossRef] [PubMed] [Green Version]
  67. Arnaud-Santana, E.; Coyne, D.; Eskridge, K.M.; Vidaver, A. Inheritance; low correlations of leaf, pod, and seed reactions to common blight disease in common beans; and implications for selection. J. Am. Soc. Hortic. Sci. 1994, 119, 116–121. [Google Scholar] [CrossRef] [Green Version]
  68. Lihua, C.Y.D. The principle of high-yielding soybean and its culture technique. Acta Agron. Sin. 1982, 1. Available online: http://zwxb.chinacrops.org (accessed on 1 June 2019).
  69. Liu, X.; Jin, J.; Wang, G.; Herbert, S. Soybean yield physiology and development of high-yielding practices in Northeast China. Field Crop. Res. 2008, 105, 157–171. [Google Scholar] [CrossRef]
  70. Huang, X.; Feng, Q.; Qian, Q.; Zhao, Q.; Wang, L.; Wang, A.; Guan, J.; Fan, D.; Weng, Q.; Huang, T. High-throughput genotyping by whole-genome resequencing. Genome Res. 2009, 19, 1068–1076. [Google Scholar] [CrossRef] [Green Version]
  71. Van Ooijen, J. JoinMap® 4, Software for the calculation of genetic linkage maps in experimental populations. Kyazma Bvwageningen 2006, 33. Available online: https://www.kyazma.nl/index.php/JoinMap/ (accessed on 1 March 2019).
  72. Yang, J.; Hu, C.; Hu, H.; Yu, R.; Xia, Z.; Ye, X.; Zhu, J. QTLNetwork: Mapping and visualizing genetic architecture of complex traits in experimental populations. Bioinformatics 2008, 24, 721–723. [Google Scholar] [CrossRef] [Green Version]
  73. Churchill, G.A.; Doerge, R.W. Empirical threshold values for quantitative trait mapping. Genetics 1994, 138, 963–971. [Google Scholar]
  74. Xu, H.; Zhu, J. Statistical approaches in QTL mapping and molecular breeding for complex traits. Chin. Sci. Bull. 2012, 57, 2637–2644. [Google Scholar] [CrossRef] [Green Version]
  75. Voorrips, R. MapChart: Software for the graphical presentation of linkage maps and QTLs. J. Hered. 2002, 93, 77–78. [Google Scholar] [CrossRef] [PubMed] [Green Version]
  76. McCouch, S.R.; Chen, X.; Panaud, O.; Temnykh, S.; Xu, Y.; Cho, Y.G.; Huang, N.; Ishii, T.; Blair, M. Microsatellite marker development, mapping and applications in rice genetics and breeding. Plant Mol. Biol. 1997, 35, 89–99. [Google Scholar]
  77. Qi, Z.; Xiaoying, Z.; Huidong, Q.; Dawei, X.; Xue, H.; Hongwei, J.; Zhengong, Y.; Zhanguo, Z.; Jinzhu, Z.; Rongsheng, Z. Identification and validation of major QTLs and epistatic interactions for seed oil content in soybeans under multiple environments based on a high-density map. Euphytica 2017, 213, 162. [Google Scholar]
  78. Tian, T.; Liu, Y.; Yan, H.; You, Q.; Yi, X.; Du, Z.; Xu, W.; Su, Z. agriGO v2. 0: A GO analysis toolkit for the agricultural community, 2017 update. Nucleic Acids Res. 2017, 45, W122–W129. [Google Scholar] [CrossRef] [PubMed]
  79. Chen, C.; Xia, R.; Chen, H.; He, Y. TBtools, a Toolkit for Biologists integrating various biological data handling tools with a user-friendly interface. BioRxiv 2018, 289660. [Google Scholar]
Figure 1. Frequency distribution of seed length (SL), seed width (SW), seed thickness (ST), seed length-to-width (SLW), seed length-to-thickness (SLT), and seed width-to-thickness (SWT) in ZY and K3N recombinant inbred line (RIL) populations across three different environments (2012FY, 2012JP, and 2017JP). Trend lines show the moving average. Arrows represent mean value of corresponding parent. Horizontal and vertical axis represent trait value and number of genotypes, respectively.
Ijms 21 01040 g001
Figure 2. Location of quantitative trait loci (QTLs) on the genetic linkage map of the ZY and K3N RIL populations. Distances among markers are indicated using the physical location to the right of the linkage groups; names of markers are shown on the left. Only those SNP/SLAF markers are shown that were in and around the QTL regions. The red circles indicate the four QTL hotspots/clusters. Colored bars represent different QTLs.
Ijms 21 01040 g002aIjms 21 01040 g002b
Figure 3. Diagram showing the physical location of four QTL clusters/hotspot regions (cluster-06, cluster-10, cluster-13, and cluster-20) on four different chromosomes viz., Chr6, Chr10, Chr13, and Chr20 identified in two RIL populations across multiple environments Different colors indicate different QTLs within same region.
Ijms 21 01040 g003
Figure 4. agriGO annotation information. (A) Cluster-06 (QTL Hotspot A), (B) Cluster-10 (QTL Hotspot B), (C) Cluster-13 (QTL Hotspot C), and (D) Cluster-20 (QTL Hotspot D).
Ijms 21 01040 g004aIjms 21 01040 g004b
Figure 5. Heat map exhibiting the expression profiles of 23 candidate genes among the different soybean tissues and development stages from four QTL hotspots/clusters. (A) Cluster-06 (QTL Hotspot A), (B) Cluster-10 (QTL Hotspot B), (C) Cluster-13 (QTL Hotspot C), and (D) Cluster-20 (QTL Hotspot D). Heat map was generated using the RNA-sequencing data downloaded from online dataset SoyBase. Youngleaf—young leaf, Onecmpod—1 cm of pod, PS—pod shell, DAF—days after flowering, and S—seed.
Ijms 21 01040 g005
Table 1. Main-effect quantitative trait loci (M-QTLs) identified for three seed-size traits (seed length (SL), seed width (SW), and seed thickness (ST)) in ZY and K3N recombinant inbred line (RIL) populations across multiple environments.
TraitQTL aChr (LG) bPos (cM) cLOD dAdd eR2(%) fConfidence Interval (cM) gPhysical Range(bp) hEnv iRef j
SLqSL-4-1ZY4 (C1)61.814.920.17.2160.4–82.242,941,550–44,864,5972012FY[3]
72.013.470.094.492012JP
79.414.520.16.32017JP
qSL-6-1ZY6 (C2)23.614.120.15.4318.7–25.95,404,972–7,692,6632012JP[3]
qSL-6-2ZY6 (C2)59.513.780.085.1858.9–66.617,259,711–38,704,6962012FY[32]
qSL-6-3ZY6 (C2)66.216.220.128.3565.7–66.738,704,696–41,044,2012012JP[32]
qSL-9-1ZY,K3N9(K)27.214.950.17.0324.6–32.35,252,918–5,818,1092017JPTHIS STUDY
31.114.020.151330–36.42012FYTHIS STUDY
qSL-9-2ZY9 (K)82.813.51−0.084.8279.2–8638,148,965–40,891,8702012FYTHIS STUDY
qSL-11-1K3N11 (B1)83.814.160.1412.5777.5–85.510,660,406–15,527,0962012JPTHIS STUDY
qSL-13-1ZY13 (F)48.813.50.095.0747–49.820,463,309–22,44,29892017JP[32]
48.818.140.1411.4648–49.82012JP
qSL-13-2ZY13 (F)124.416.240.118.89123.4–124.842,740,832–43,643,3152012FY[3]
qSL-14-1ZY14 (B2)184.314.94−0.117.2181.8–185.319,020,008–26,651,1672017JPTHIS STUDY
qSL-15-1ZY15 (E)26.313.440.095.0518.8–37.54,951,107–9,734,4862017JPTHIS STUDY
qSL-17-1K3N17 (D2)101.413.80.1411.9599.2–103.338,148,257–39,028,1192012FYTHIS STUDY
qSL-18-1K3N18 (G)84.313.69−0.1311.8483.3–88.815,974,989–35,229,7742017JPTHIS STUDY
qSL-20-1K3N20 (I)61.217.19-0.1822.6455.9–67.736,184,890–38,300,9822012JPTHIS STUDY
SWqSW-1-1ZY1 (D1a)95.316.350.098.6389.9–99.549,641,073–51,122,0752012JPTHIS STUDY
qSW-2-1K3N2 (D1b)97.115.24−0.0917.3296–10242,094,237–43,533,1582017JPTHIS STUDY
qSW-4-1ZY4 (C1)61.814.040.065.8560.2–65.142,941,550–47,127,3892012FY[3]
qSW-5-1K3N5(A1)56.313.640.0811.2653.4–6134,233,479–36,140,8652017JPTHIS STUDY
qSW-6-1ZY6 (C2)16.3110.530.1215.3515.6–16.65,651,662–5,975,4432012JP[3,32]
qSW-6-2ZY6 (C2)23.3110.760.1114.4520.9–24.76,147,315–7,6,92,6632012JP[32]
qSW-8-1K3N8 (A2)25.614.17−0.112.6120.5–27.86,386,731–8,823,5722012JPTHIS STUDY
qSW-9-1K3N9 (k)29.315.220.1517.2429.2–3732,901,15–58,181,092012FYTHIS STUDY
qSW-9-2ZY9 (k)46.613.770.075.3944.6–5221,069,019–30,126,6842012JPTHIS STUDY
qSW-10-1K3N10 (O)55.213.83−0.112.8552–59.232,040,762–38,080,7812012FYTHIS STUDY
qSW-13-1ZY13 (F)48.417.070.099.5948–49.120,443,593–22,442,9892012JP[33]
51.313.570.075.3249.8–52.62017JP
qSW-13-2ZY13 (F)124.313.570.065.19123.5–124.842,740,832–43,643,3152012FYTHIS STUDY
qSW-17-1ZY17 (D2)2.016.220.0810.920–3.333,39,67–2,389,8162012FYTHIS STUDY
qSW-17-2ZY17 (D2)9.815.760.0810.335.1–12.120,877,60–34,333,862012FYTHIS STUDY
STqST-1-1ZY1 (D1a)86.614.610.096.8382.4–89.648,271,814–49,736,5972012JPTHIS STUDY
qST-1-2ZY1 (D1a)92.814.580.096.1789.6–98.349,7363,57–50,776,8542012JPTHIS STUDY
qST-2-1K3N2 (D1b)97.115.29−0.1115.5993.6–97.841,894,158–42,544,8032017JP[33]
qST-3-1K3N3 (N)21.313.930.110.9814.6–23.424,562,76–59,471,802017JPTHIS STUDY
qST-4-1ZY4 (C1)62.813.450.074.4658.2–65.142,894,734–47,127,3892012JPTHIS STUDY
qST-5-1K3N5(A1)93.414.920.1315.891.1–9438,801,307–39,045,6212012JPTHIS STUDY
qST-6-1ZY6 (C2)16.316.160.119.6815.1–16.65,651,662–5,975,4432012JP[3]
qST-6-2ZY6 (C2)23.618.140.1211.5321.9–266,164,792–7,843,,3892012JP[3]
23.614.460.0811.1221.5–26.22012FY
qST-6-3 K3N6 (C2)129.814.17−0.1112.49128.3–132.349,654,656–50,477,2772017JP[3]
qST-8-1K3N8 (A2)13.413.44−0.1107.5–15.53,060,492–5,128,1852012JP[3]
qST-11-1ZY11 (B1)23.815.440.098.0423–31.210,235,376–15,990,2552017JPTHIS STUDY
qST-12-1 K3N12 (H)84.015.280.1416.6780.4–8634,404,607–35,936,2122012FYTHIS STUDY
qST-12-2K3N12 (H)89.516.260.14988.5–92.335,660,845–36,343,4272012FYTHIS STUDY
qST-12-3K3N12 (H)96.514.320.1213.6993.1–110.136,343,428–38,545,3172012FYTHIS STUDY
qST-13-1ZY13 (F)19.213.610.086.3910.1–337,974,412–1,484,3362012FYTHIS STUDY
qST-13-2ZY13 (F)48.414.230.0910.2846.7–9.771,87,17–22,442,9892012JP[3]
qST-13-3ZY13 (F)51.315.170.097.8750.1–52.622,197,750–23,410,8882017JP[33]
53.613.570.084.8652.9–55.62012JP
qST-16-1K3N16 (J)77.014.80.1214.2466–78.231,905,448–35,735,7512012JP[33]
qST-17-1ZY17 (D2)3.015.290.097.630.7–3.327,02,76–2,389,8162012FYTHIS STUDY
qST-17-2ZY17 (D2)8.815.240.18.413.3–17.42,389,537–5,085,0982012FY[33]
qST-18-1 K3N18 (G)72.115.390.1314.4373–8255,571,932–57,042,4622012FYTHIS STUDY
qST-18-2ZY18 (G)78.014.780.096.7473.5–8211,268,490–46,240,3472012FYTHIS STUDY
a: QTLs detected in different environments at the same, adjacent, or overlapping marker intervals were considered the same QTL; b: chromosome; c: position of the QTL; d: the log of odds (LOD) value at the peak likelihood of the QTL; e: indicates additive; f: phenotypic variance (%) expressed by the QTL; g: 1-LOD support confidence intervals (confidence interval length); h: physical position of QTL; i: environment; and j: references from www.soybase.org.
Table 2. M-QTLs identified for three seed-shape traits (seed length-to-width (SLW), seed length-to-thickness (SLT), and seed width-to-thickness (SWT)) in ZY and K3N RIL populations across multiple environments.
TraitQTL aChr (LG) bPos (cM) cLOD dAdd eR2(%) fConfidence Interval (cM) gPhysical Range (bp) hEnv iRef j
SLWqSLW-5-1ZY5(A1)60.013.55−0.014.7756.6–62.939,366,066–41,2966,262012FYTHIS STUDY
qSLW-5-2K3N5(A1)92.816.73−0.029.1589.9–93.438,337,588–39,465,9632017JPTHIS STUDY
qSLW-6-1ZY6 (C2)63.616.590.0218.6850.1–65.613,274,690–38,704,6962012FY[3,32]
63.618.030.0212.1762.6–65.92017JP
66.215.940.0217.2457.6–66.72012JP
qSLW-6-2ZY6 (C2)77.015.660.018.1576.4–77.846,087,483–46,232,2572017JP[3]
qSLW-7-1K3N7 (M)10.014.80.0212.787.5–20.11,361,954–3,819,2242017JPTHIS STUDY
qSLW-9-1K3N9 (K)98.413.970.0212.9788.2–102.238,138,667–41,052,0482012FYTHIS STUDY
qSLW-10-1ZY10 (O)53.914.64−0.016.649–61.741,983,494–45,988,2212017JPTHIS STUDY
qSLW-13-1ZY13 (F)68.614.040.016.4462.2–70.823,963,991–26,852,0392012JP[33]
qSLW-16-1K3N16 (J)68.216.39−0.0216.9266.5–73.931,905,448–33,541,6612012JP[33]
qSLW-19-1K3N,ZY19(L)0.013.890.0212.250–10.81–1,939,3632012FYTHIS STUDY
5.813.55−0.026.090–9.62017JP
qSLW-20-1K3N20 (I)53.619.01−0.0326.8452.5–55.135,924,513–38,138,4352012JPTHIS STUDY
60.214.64−0.0211.6453.6–64.82017JP
SLTqSLT-2-1ZY2 (D1b)63.914.04−0.036.4561.8–65.714,715,990–15,293,2252012FY[33]
qSLT-6-1ZY6 (C2)29.013.7−0.025.2725.6–30.36,779,201–8,789,2012012JP[3]
qSLT-6-2ZY6 (C2)62.313.920.025.7162–65.618,806,329–29,376,9802012JP[3]
qSLT-6-3ZY6 (C2)70.314.710.026.7968.6–70.639,478,712–42,3014,722012JP[3]
qSLT-6-4ZY6 (C2)82.614.980.037.8279.3–83.747,288,454–48,097,9502012JP[3]
qSLT-8-1ZY8 (A2)3.515.30.038.210.5–10.31,281,677–4,722,5312017JPTHIS STUDY
qSLT-8-2ZY8 (A2)16.113.830.025.5613.2–204,722,281–8,343,1422012FY[3]
qSLT-9-1K3N9 (K)24.314.8−0.0311.4422.6–28.62,378,279–3,574,6892012JPTHIS STUDY
qSLT-9-2K3N9 (K)84.314.050.0312.6281.9–88.436,947,988–40,302,7522012FYTHIS STUDY
qSLT-10-1ZY10 (O)53.914.55−0.031748.9–59.441,983,494–45,988,2212012FYTHIS STUDY
53.914.61−0.0216.849.5–57.82012JP
53.914.96−0.037.447.5–60.12017JP
qSLT-11-1 K3N11 (B1)82.613.770.0311.777.6–84.510,660,406–15,086,9142012FYTHIS STUDY
qSLT-13-1ZY13 (F)16.215.44−0.0310.296.5–23.38,857,191–5,270,5362012FY[33]
qSLT-14-1ZY14 (B2)57.215.29−0.037.3155.7–6976,63,93–45,068,562012JPTHIS STUDY
qSLT-16-1K3N16 (J)69.613.25−0.053.4468.7–84.132,060,131–37,397,3852012JP[33]
qSLT-17-1ZY17 (D2)5.114.58−0.036.614.4–16.42,498,772–5,085,0982012FY[33]
qSLT-20-1K3N20 (I)64.213.82−0.0210.2259–65.535,673,231–38,972,9722017JP
66.117.28−0.0418.5459.3–71.92012JPTHIS STUDY
SWTqSWT-2-1K3N, ZY2 (D1b)63.913.89−0.026.456.4–65.714,715,990–23,379,9242012FY[33]
67.813.92−0.015.967–70.32017JP
67.815.74−0.028.5565.7–70.32012JP
qSWT-8-1ZY8 (A2)2.113.460.015.20–13.41,315,065–8,343,1422017JPTHIS SYUDY
2.514.730.0110.881.2–9.32012JP
qSWT-8-2ZY8 (A2)16.613.480.025.3213.2–204,722,281–8,343,1422012FYTHIS STUDY
qSWT-9-1 K3N9 (K)71.515.44−0.0116.2965.8–72.232,505,690–36,079,7512017JPTHIS STUDY
qSWT-10-1K3N10 (O)87.714.110.0112.4780.7–99.240,440,079–44,537,2902017JPTHIS STUDY
qSWT-11-1K3N11 (B1)103.613.78−0.0110.89101.5–105.318,952,782–33,288,7182017JPTHIS STUDY
qSWT-12-1K3N12 (H)87.315−0.024.5585.8–92.434,926,974–36,343,4272012FYTHIS STUDY
qSWT-13-1ZY13 (F)16.214.93−0.029.846.4–23.48,857,191–5,270,5362012FY[33]
qSWT-13-2ZY13 (F)29.814.26−0.028.0717.8–37.26,777,564–1,267,7462017JP[33]
qSWT-16-1K3N16 (J)74.814.66−0.0213.5972.7–78.633,458,104–35,735,7512012JP[33]
qSWT-18-1ZY18 (G)78.713.74−0.025.8672.4–83.756,974,254–46,749,7682012FYTHIS STUDY
a: QTLs detected in different environments at the same, adjacent, or overlapping marker intervals were considered the same QTL; b: chromosome; c: position of the QTL; d: the log of odds (LOD) value at the peak likelihood of the QTL; e: indicates additive; f: phenotypic variance (%) expressed by the QTL; g: 1-LOD support confidence intervals (confidence interval length); h: physical position of QTL; i: environment; and j: references from www.soybase.org.
Table 3. Additive and additive x environment interaction effects of QTLs associated with seed shape traits in two RIL populations.
RILTraitQTLChrPos (cM)Physical Range (bp)Flanking MarkerAdditive EffectAE EffectRef
APVE (%)AE1AE2AE3PVE (%)
ZYSLqSL-4-2ZY439.2219283057–19438579Mark386837–Mark3596250.1822.47NSNSNS0[3]
qSL-6-1ZY665.9318831802–19024597Mark750099–Mark7410780.096.04NSNSNS1.69[32]
qSL-9-2ZY982.0339583668–39417035Mark596882–Mark5702290.083.89NSNSNS0THIS STUDY
qSL-13-3ZY1378.7531540635–31390215Mark473668–Mark4785240.084.65−0.03 **0.03 **NS0.82[3]
qSL-13-4ZY134.00113278146–14133381Mark471284–Mark4869870.062.620.02 **−0.01 *−0.01 *0.45[3]
qSL-14-2ZY1412.1447107927–47737451Mark941949–Mark890565−0.083.970.01 **NS−0.01 *0.11THIS STUDY
qSL-15-1ZY1530.547595034–8201285Mark817834–Mark8184250.072.89NSNSNS0.04[3]
qSL-17-2ZY1754.613439080–13701008Mark96769–Mark847170.062.61NSNNSNS0[34]
SWqSW-1-2ZY167.2217489394–20846299Mark974988–Mark9776690.031.69NS0.03 **−0.04 **2.78THIS STUDY
qSW-1-1ZY1100.251095466–51296512Mark1014325–Mark9887340.1429.35NSNSNS0THIS STUDY
qSW-4-1ZY464.0948139232–48129734Mark370122–Mark3836500.089.23NSNSNS0.1[3]
qSW-4-3ZY413.93681724–5115633Mark411964–Mark3753600.1325.78NSNS−0.01 *0.25[3]
qSW-6-1ZY623.636820998–6873235Mark743934–Mark7644180.076.39NS0.05 **−0.05 **4.15[32]
qSW-9-3ZY958.1930576094–33868843Mark584128–Mark5772100.042.86NSNSNS0THIS STUDY
qSW-13-3ZY1380.0432094249–32215414Mark487690–Mark4772700.0912.55−0.01 *0.03 **−0.02 **1.67THIS STUDY
qSW-17-3ZY1726.125914087–5923952Mark80080–Mark1024490.076.280.03 **NS−0.02 **1.4[3]
qSW-20-1ZY2082.1441039353–41758780Mark244793–Mark2308020.042.48NSNS−0.01 *0.16THIS STUDY
STqST-1-3ZY166.1524564849–25434623Mark988529–Mark9666300.063.58NSNSNS0THIS STUDY
qST-4-2ZY444.1330867521–32458924Mark404804–Mark4102740.063.430.01 **NS−0.02 **0.47[3]
qST-6-4ZY628.988734791–8864415Mark778253–Mark7682620.097.87NSNSNS0THIS STUDY
qST-13-4ZY1374.529909876–29933390Mark492165–Mark4806510.086.47−0.04 **0.02 **0.01 **1.31[33]
qST-17-3ZY1726.125914087–5923952Mark80080–Mark1024490.085.27NSNSNS0.03[3]
qST-18-2ZY1873.2511452216–56974484Mark107824–Mark10415060.1417.36NSNSNS0THIS STUDY
qST-20-1ZY2046.132964872–34278811Mark222598–Mark2609220.096.68NSNSNS0[33]
SLWqSLW-6-3ZY668.6139116570–39478973Mark735467–Mark7526960.0216.59NSNSNS0.02[33]
qSLW-9-2ZY926.465253206–5593340Mark586124–Mark6055150.026.23NSNSNS0.01THIS STUDY
qSLW-10-1ZY1034.2240118012–41534124Mark647482–Mark674118−0.013.59NSNSNS0.22THIS STUDY
qSLW-14-1ZY142.6246512262–46896487Mark910347–Mark906347−0.033.59NSNS−0.010.22THIS STUDY
SLTqSLT-2-2ZY254.9613892893–14031565Mark45679–Mark24395−0.0414.3NSNSNS0THIS STUDY
qSLT-6-5ZY672.2643230405–43114475Mark747633–Mark77007407.18NSNSNS0[34]
qSLT-8-3ZY8107.0644543723–45326890Mark457232–Mark4232050.038.95NSNSNS0THIS STUDY
qSLT-10-1ZY1034.2240118012–41534124Mark647482–Mark674118−0.038.65NSNSNS0THIS STUDY
qSLT-10-2ZY103.314454862–4625724Mark637694–Mark6598170.039.56NSNSNS0[34] -
qSLT-14-2ZY14118.7427709972–27836278Mark905511–Mark937850−0.024.16NSNSNS0THIS STUDY
qSLT-17-1ZY1712.063433165–1091815Mark91398–Mark70303−0.023.77NSNSNS0[33]
qSLT-18-1ZY1872.7111452216–56974484Mark107824–Mark1041506−0.043.77NSNSNS0THIS STUDY
SWTqSWT-2-2ZY245.810992717–11277233Mark4308–Mark33823−0.043.72NSNSNS0THIS STUDY
qSWT-8-3ZY8111.6845326630–45114110Mark466182–Mark4572320.014.91NSNSNS0THIS STUDY
qSWT-13-3ZY13118.2239676002–42053780Mark492087–Mark510247−0.014.03NSNSNS0.36[34]
qSWT-14-1ZY14132.7843567951–44159326Mark927308–Mark890844−0.013.64NSNSNS0.01THIS STUDY
qSWT-18-1ZY1873.2556974254–11452436Mark107824–Mark1041506−0.0318.77NSNSNS0.79THIS STUDY
K3NSLqSL-17-3K3N17118.0140207655–41906774bin1466–bin14670.085.71NSNSNS0THIS STUDY
qSL-20-1K3N2055.9136184890–36777026bin1698–bin1699−0.096.72NS−0.01 *0.03 **1.02THIS STUDY
STqST-10-1K3N1059.2236682803–37647030bin827–−0.087.05−0.03 **0.02 **0.02 **2.06THIS STUDY
bin829
SLWqSLW-5-2K3N594.4638132148–38801307bin402–−0.017.06NSNSNS0.01[34]
bin403
qSLW-16-1K3N1669.632318950–33186025bin1362–bin1363−0.012.2NSNSNS0.02[34]
SLTqSLT-16-1K3N1675.6833853674–35244129bin1371–bin1372−0.0419.15NS−0.01 *NS1.49THIS STUDY
qSLT-20-1K3N2068.2737878839–38300982bin1704–bin1705−0.0311.77NSNSNS0.05THIS STUDY
Chr.: chromosome. * p < 0.05 and ** p < 0.01. PVE indicates phenotypic variation expressed by additive effects. AE1: 2012FY, AE2: 2012JP, and AE3: 2017JP.
Table 4. Estimated epistatic effects (AA) and environmental (AAE) interactions of QTLs for seed shape and size traits across all environments.
RILQTL_iChr_iPos_iMarker Interval_iQTL_jChr_jPos_jMarker Interval_j(AA) Effect(AAE) Effect
AAPVE (%)AE1AE2AE3PVE (%)
ZYqSL-13-3ZY1378.75Mark473668–Mark478524qSL-13-4ZY134.001Mark471284–Mark486987−0.051.84NSNSNS-
qST-1-4ZY167.22Mark962092–Mark962281qST-13-5ZY13118.5Mark492087–Mark510247−0.074.16NSNSNS-
qST-1-5ZY188.72Mark1006029–Mark981292qST-13-4ZY1332.59Mark489890–Mark487004−0.074.11NSNSNS0.02
qST-6-5ZY626.19Mark738100–Mark750615qST- 9-1ZY998.04Mark591384–Mark570193−0.074.96NSNSNS0.06
qSLT-6-6ZY611.85Mark729845–Mark775156qSLT-10-3ZY1014.29Mark628845–Mark6239260.023.98NSNSNS-
qSLT-15-1ZY1526.29Mark799922–Mark817834qSLT-19-1ZY1964.16Mark114395–Mark1413360.039.59NSNSNS-
qSWT-1-1ZY167.22Mark990284–Mark986367qSWT-13-4ZY1383.91Mark484073–Mark4893010.026.7NSNSNS0.25
qSWT-13-5ZY1353.11Mark505121–Mark508857qSWT-20-1ZY2083.56Mark250253–Mark2574730.026.2NSNSNS0.01
K3NqSL-2-1K3N240.91bin87–bin88qSL-2-2K3N295.94bin130–bin131−0.119.7−0.05 **0.01 **NS3.02
qST-9-1K3N971.51bin748–bin749qST-12-4K3N120.6bin962–bin9630.041.71NS0.03 **NS2.41
qSLW-4-1K3N450.29bin285–bin286qSLW-15-1K3N15148.55bin1298–bin12990.034.34NSNSNS-
qSLW-7-2K3N737.3bin526–bin527qSLW- 12-1K3N1255.09bin990–bin991−0.016.33NSNSNS0.08
qSLT-2-3K3N24.2bin164–bin165qSLT-7-1K3N794.74bin568–bin569−0.013.21NS0.01 **NS1.68
qSWT-6-1K3N697.8bin470–bin471qSWT-8-4K3N8109.71bin672–bin673−0.047.56−0.01 *NS0.01**12.03
qSWT-11-2K3N1197.12bin934–bin935qSWT-17-1K3N175.47bin1386–bin13870.017.1NSNSNS1.11
qSWT-11-3K3N11106.76bin952–bin953qSWT-14-2K3N1445.84bin1170–bin11710.016.48NSNSNS0.74
Chr_i and Chr_j indicate the two sites involved in epistatic interactions and Pos indicates genetic position for each of the sites. * p < 0.05 and ** p < 0.01. PVE indicates phenotypic variation expressed by epistatic effects. AE1: 2012FY, AE2: 2012JP, and AE3: 2017JP.
Table 5. Four QTL hotspots/clusters detected in ZY and K3N RIL populations across multiple environments.
QTL Cluster NameChr_Bin RangeQTL NamePhysical Range (bp)LODAdditive EffectR2 (%)
Cluster-06/QTL Hotspot AChr06_Mark730486-Mark767055(ZY)qSW-6-1ZY5651662–784338910.530.1215.35
qST-6-1ZY6.160.119.68
qSL-6-1ZY4.120.15.43
qSW-6-2ZY10.760.1114.45
qST-6-2ZY8.140.1211.53
4.460.0811.12
qSLT-6-1ZY3.70−0.025.27
Cluster-10/QTL Hotspot BChr10_ Mark668037-Mark662847(ZY) Chr10_bin821-bin828(K3N)qSLT-10-1ZY41983494–459882214.55−0.0317.03
4.61−0.0216.83
4.96−0.037.40
qSLW-10-1ZY4.64−0.016.60
qSW-10-1K3N3.83−0.112.85
Cluster-13/QTL Hotspot CChr13_ Mark477148-Mark495958(ZY)qSL-13-1ZY20463309–268520393.50.095.07
8.140.1411.46
qSW-13-1ZY7.070.099.59
3.570.075.32
qST-13-2ZY4.230.0910.28
qST-13-3ZY5.170.097.87
3.570.084.86
qSLW-13-3ZY4.040.016.44
Cluster-20/QTL Hotspot DChr20_bin1697-bin1704(K3N)qSLW-20-1K3N35957343–383009829.01−0.0326.84
4.64−0.0211.64
qSL-20-1K3N7.19−0.1822.64
qSLT-20-1K3N3.82−0.0210.22
7.28−0.0418.54
Table 6. Predictive gene annotation information.
Cluster/QTL HotspotMapped IDsGene Functional Annotation
Cluster-06/QTL Hotspot AGlyma06g02390RING/U-box superfamily protein/protein ubiquitination
Glyma06g08290Lipid storage
Glyma06g04810Seed coat development extracellular region
Glyma06g03700Seed development ovule development
Glyma06g02790Response to auxin stimulus
Glyma06g06160Ubiquitin-protein ligase activity
Glyma06g07200Response to ethylene stimulus ubiquitin-protein ligase activity
Glyma06g09650microtubule nucleation, response to auxin stimulus, cytokinin mediated signaling pathway
Glyma06g10700Response to brassinosteroid stimulus sterol biosynthetic process
Cluster-10/QTL Hotspot BGlyma10g35360Response to auxin stimulus cellular component
Glyma10g36440Auxin biosynthesis
Cluster-13/QTL Hotspot CGlyma13g17750Response to auxin stimulus protein dimerization activity
Glyma13g17980Embryo development
Glyma13g21770Endosperm development embryo development
Glyma13g18730Ubiquitin-dependent protein catabolic process
Glyma13g21700Response to ethylene stimulus-response to auxin stimulus
Glyma13g22790Protein kinase activity
Cluster-20/QTL Hotspot DGlyma20g28550Seed maturation protein
Glyma20g28460Lipid storage
Glyma20g28640Lipid storage
Glyma20g27300Lipid metabolic process seed maturation cell growth
Glyma20g29750Multidimensional cell growth polysaccharide biosynthetic process regulation of hormone levels
Glyma20g30100Embryo development seed development protein phosphorylation

