Hyaluronan-Metal Gold Nanoparticle Hybrids for Targeted Tumor Cell Therapy

 , ,
, ,
Abstract
:1. Introduction
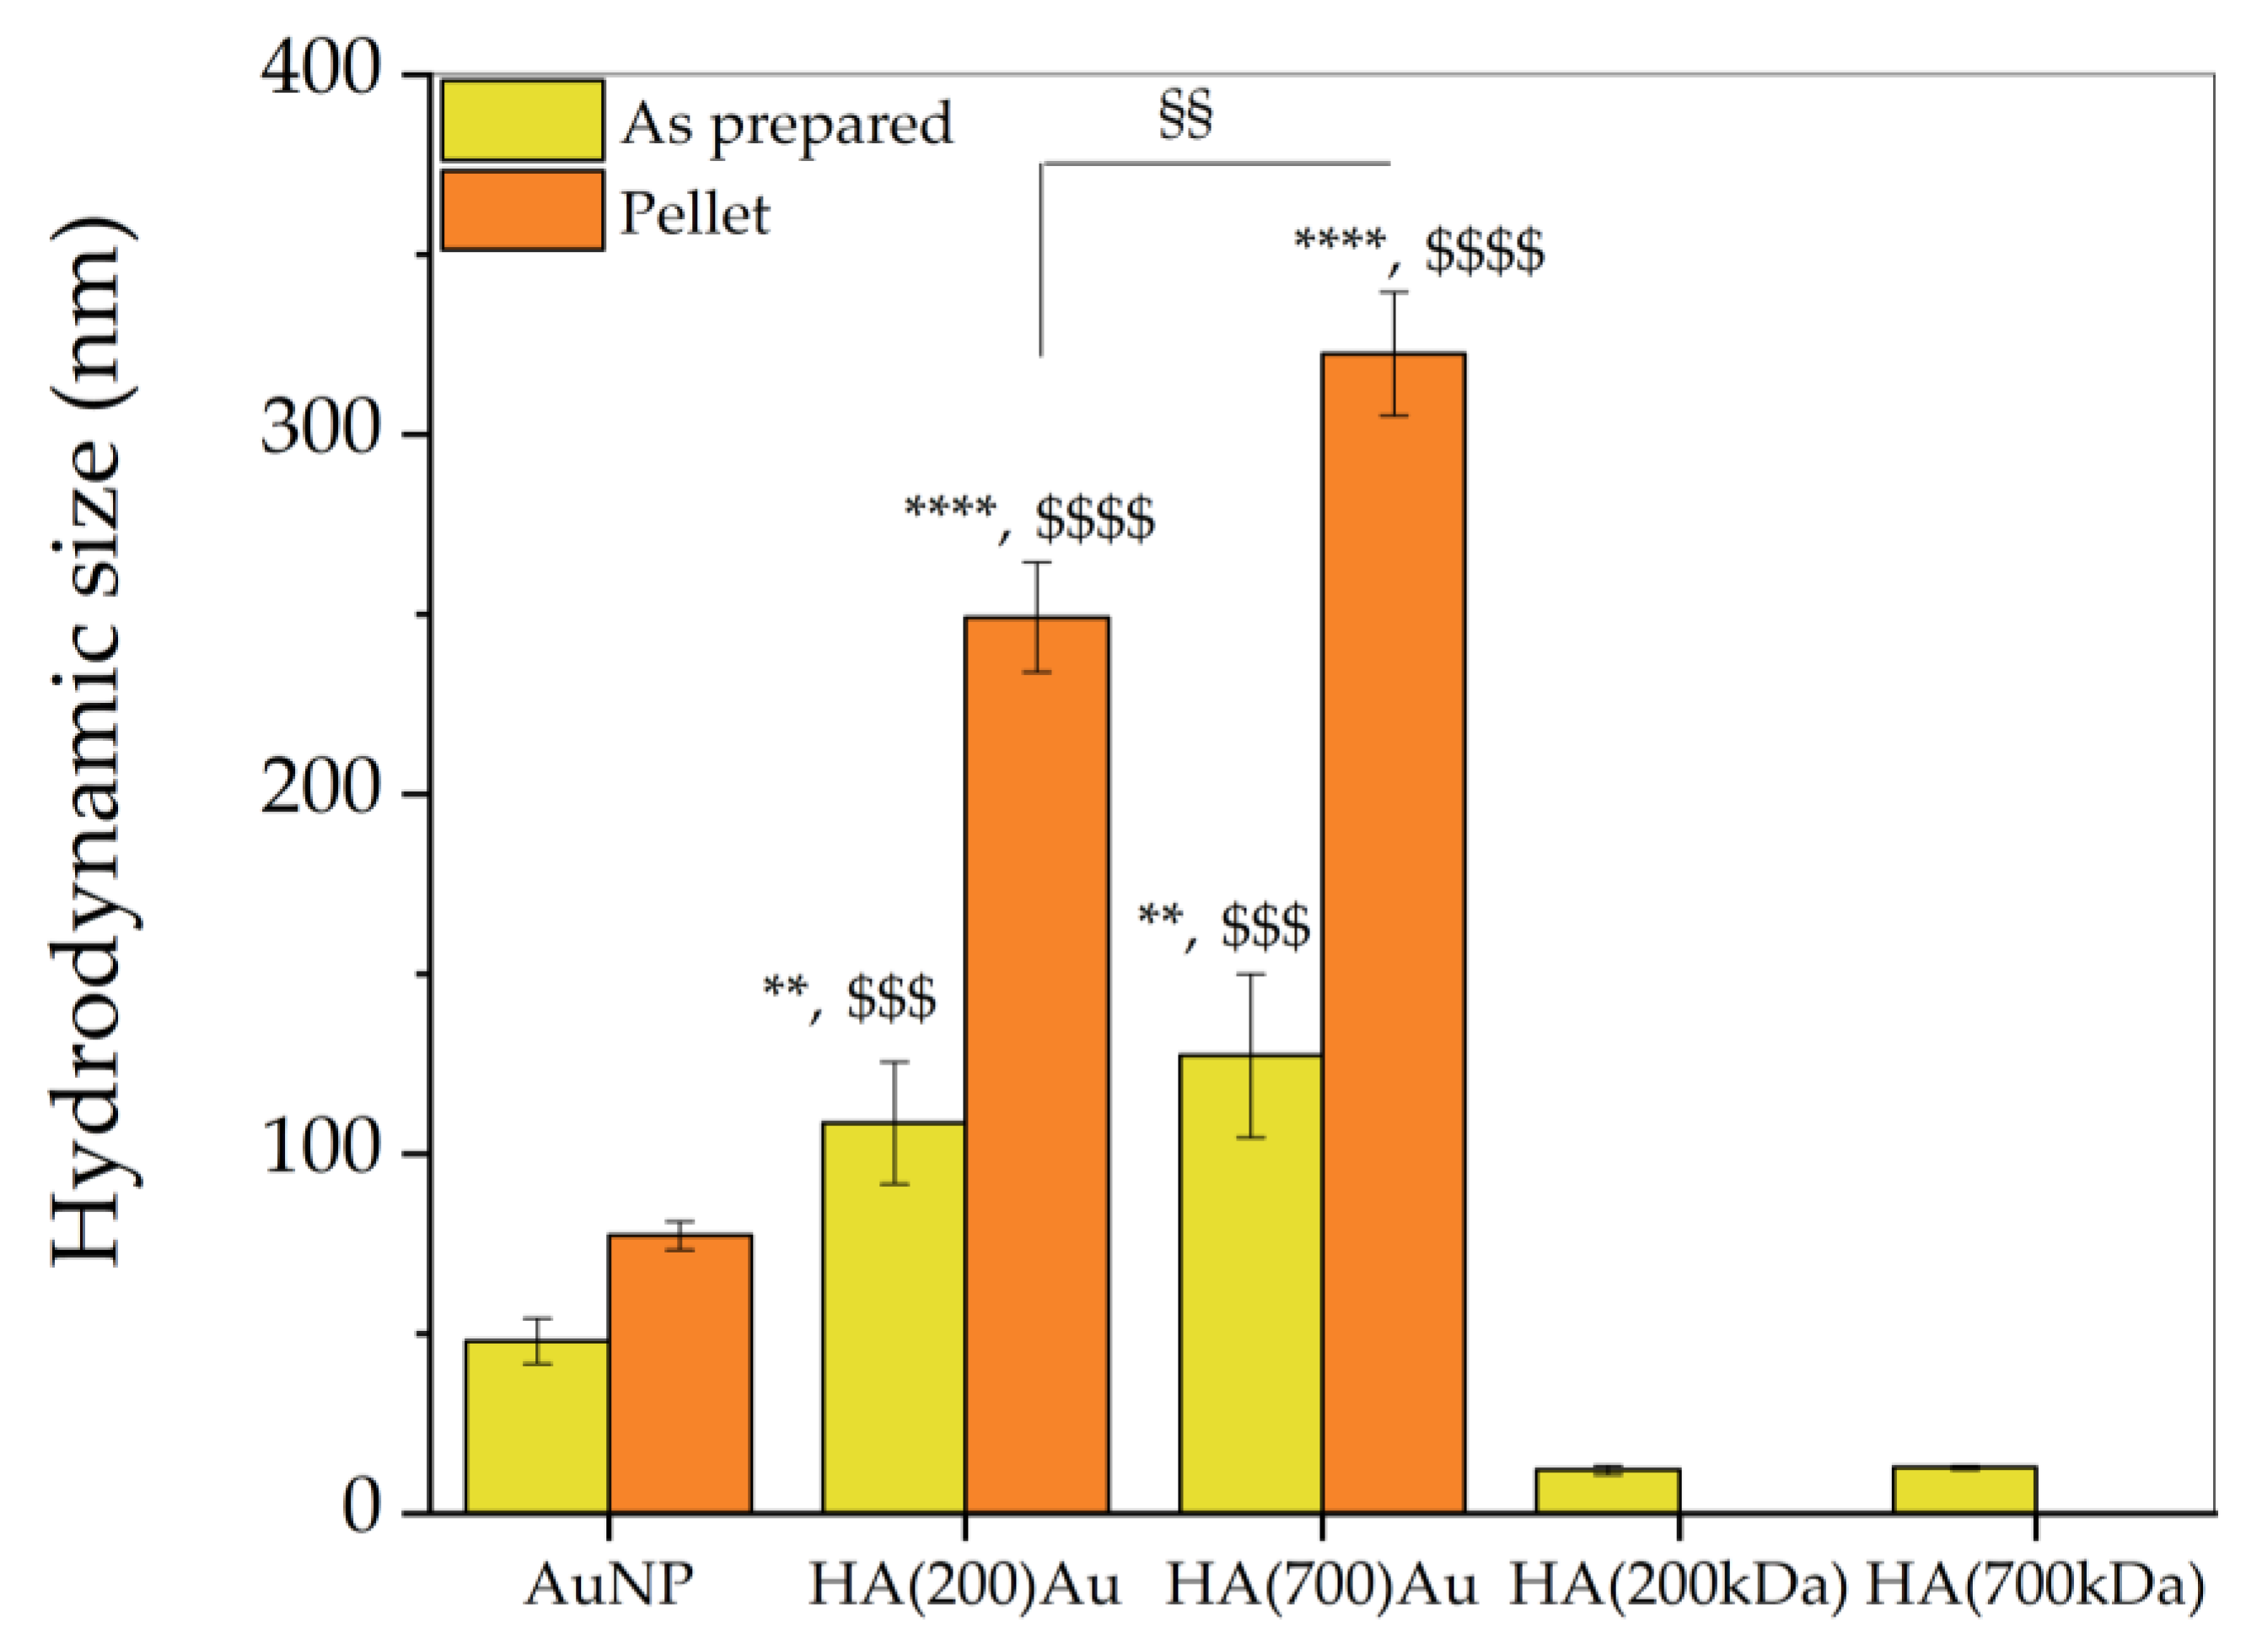
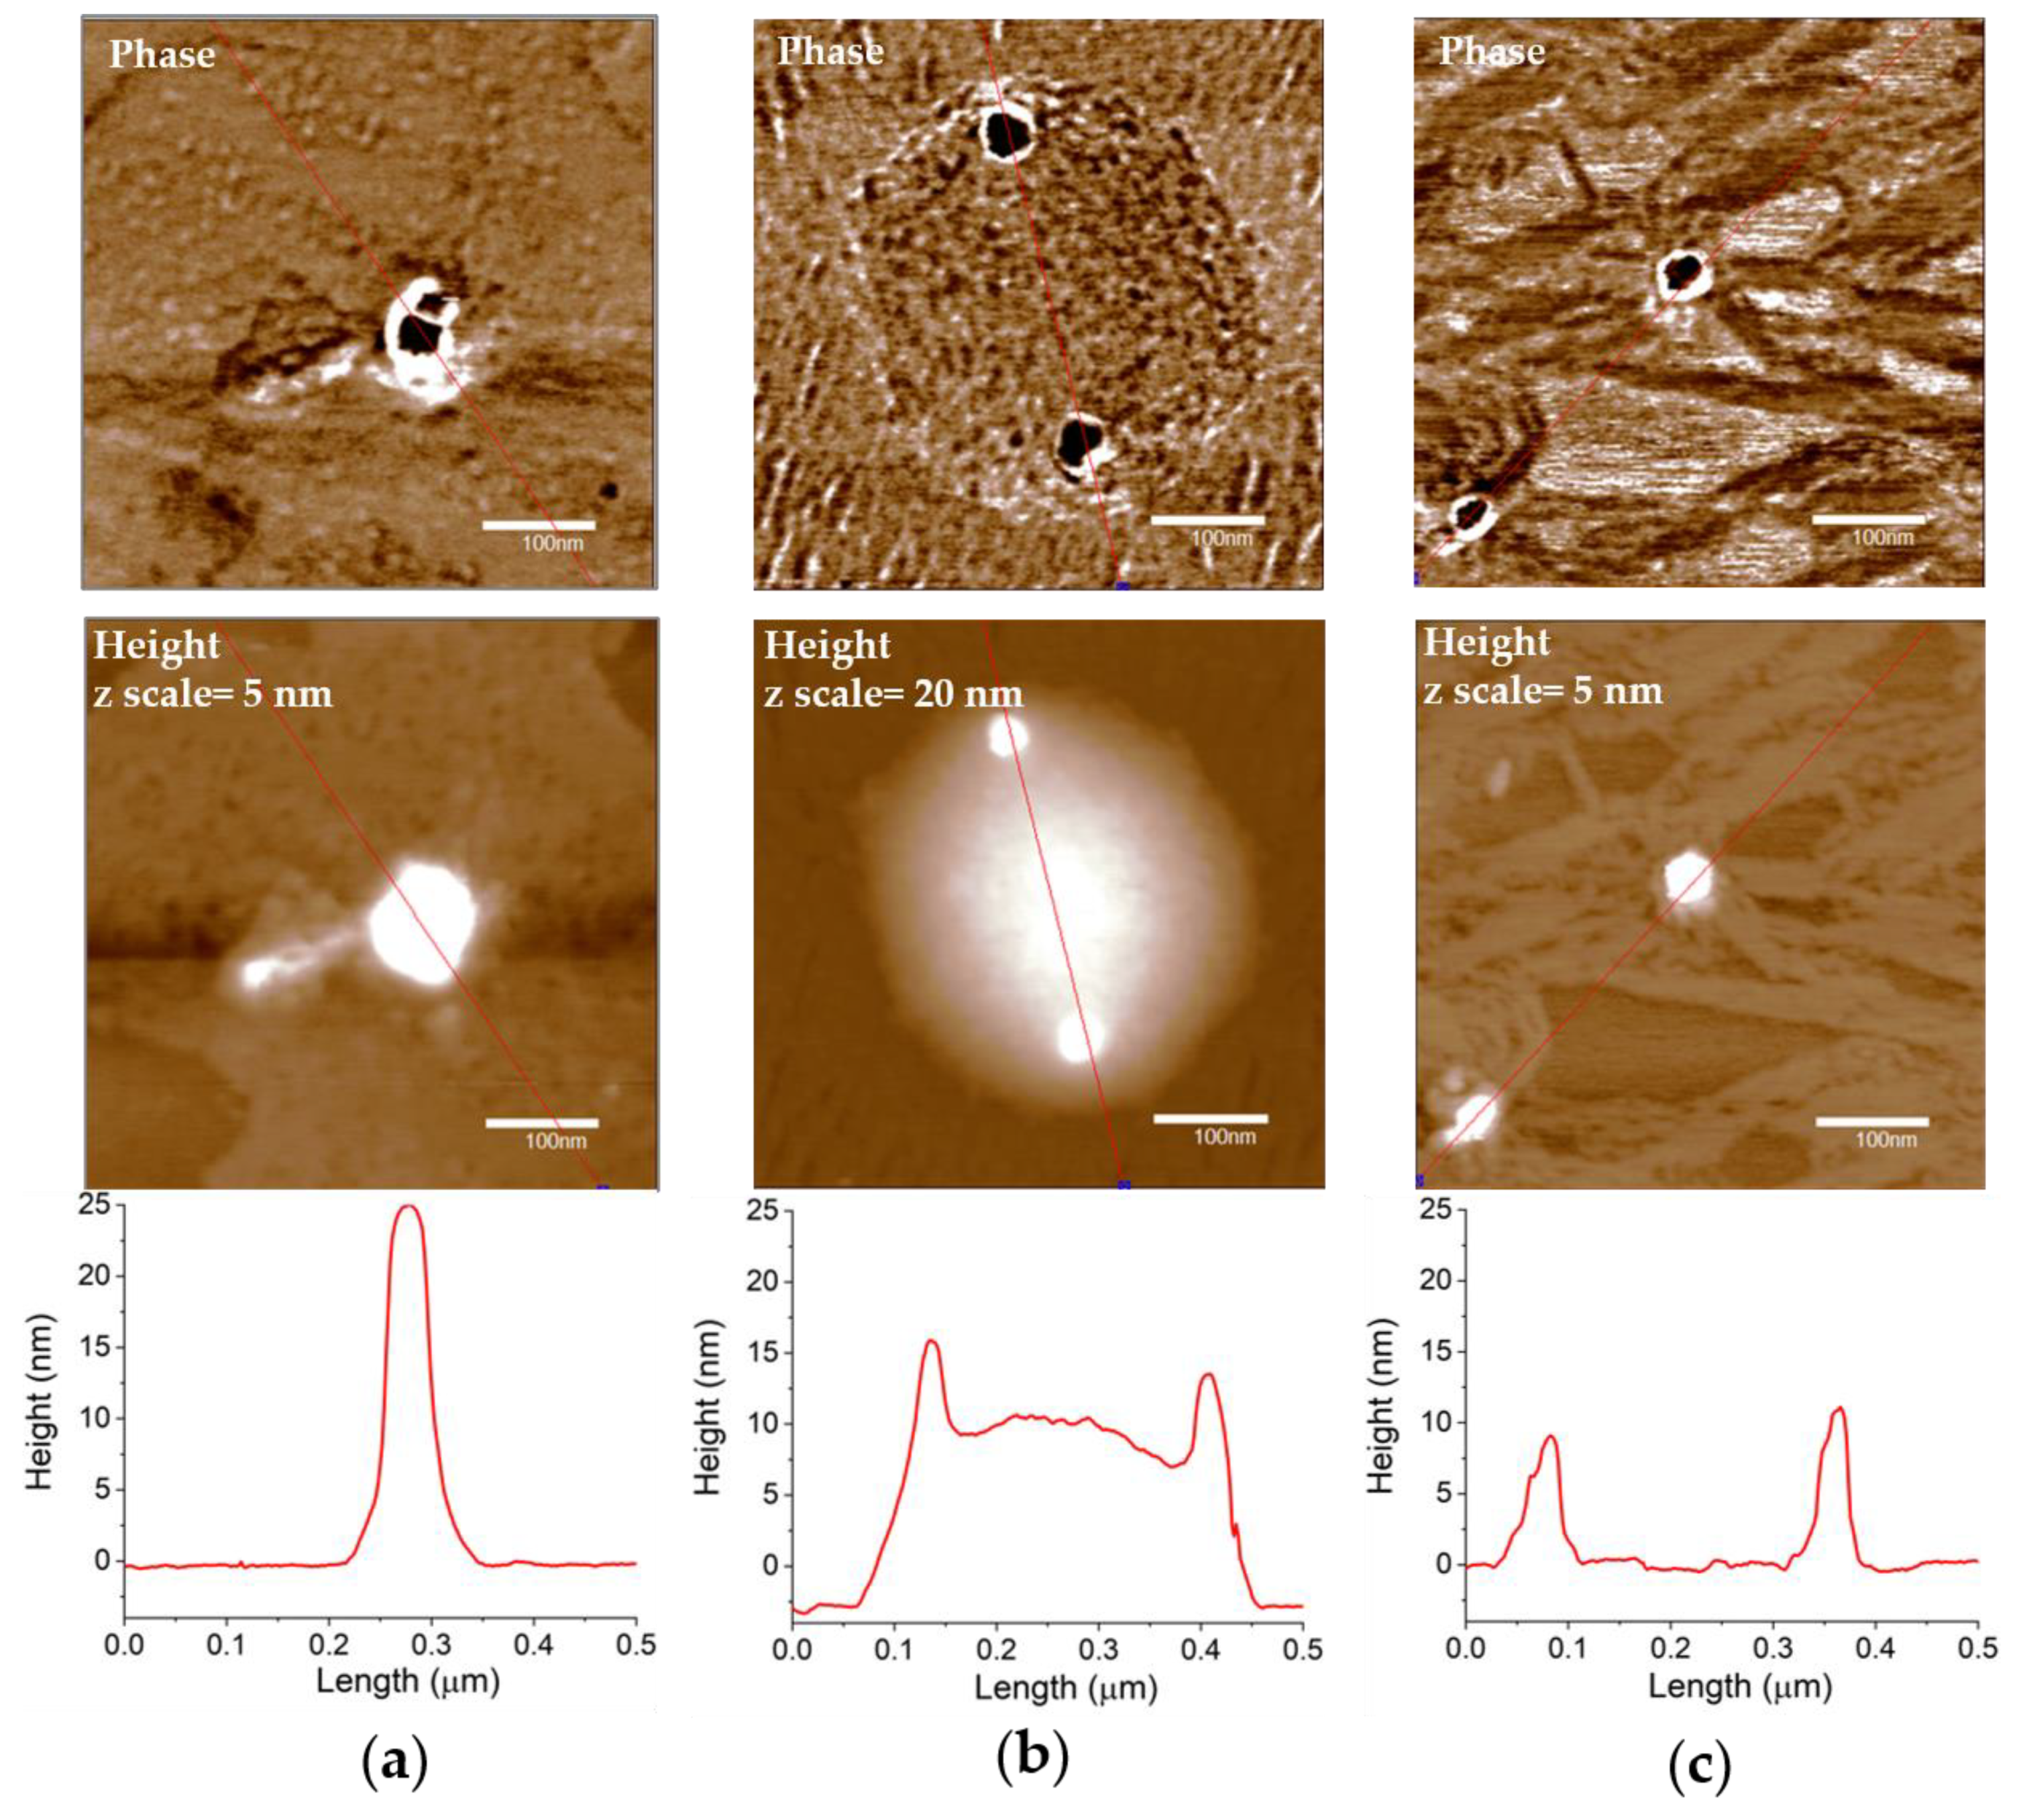
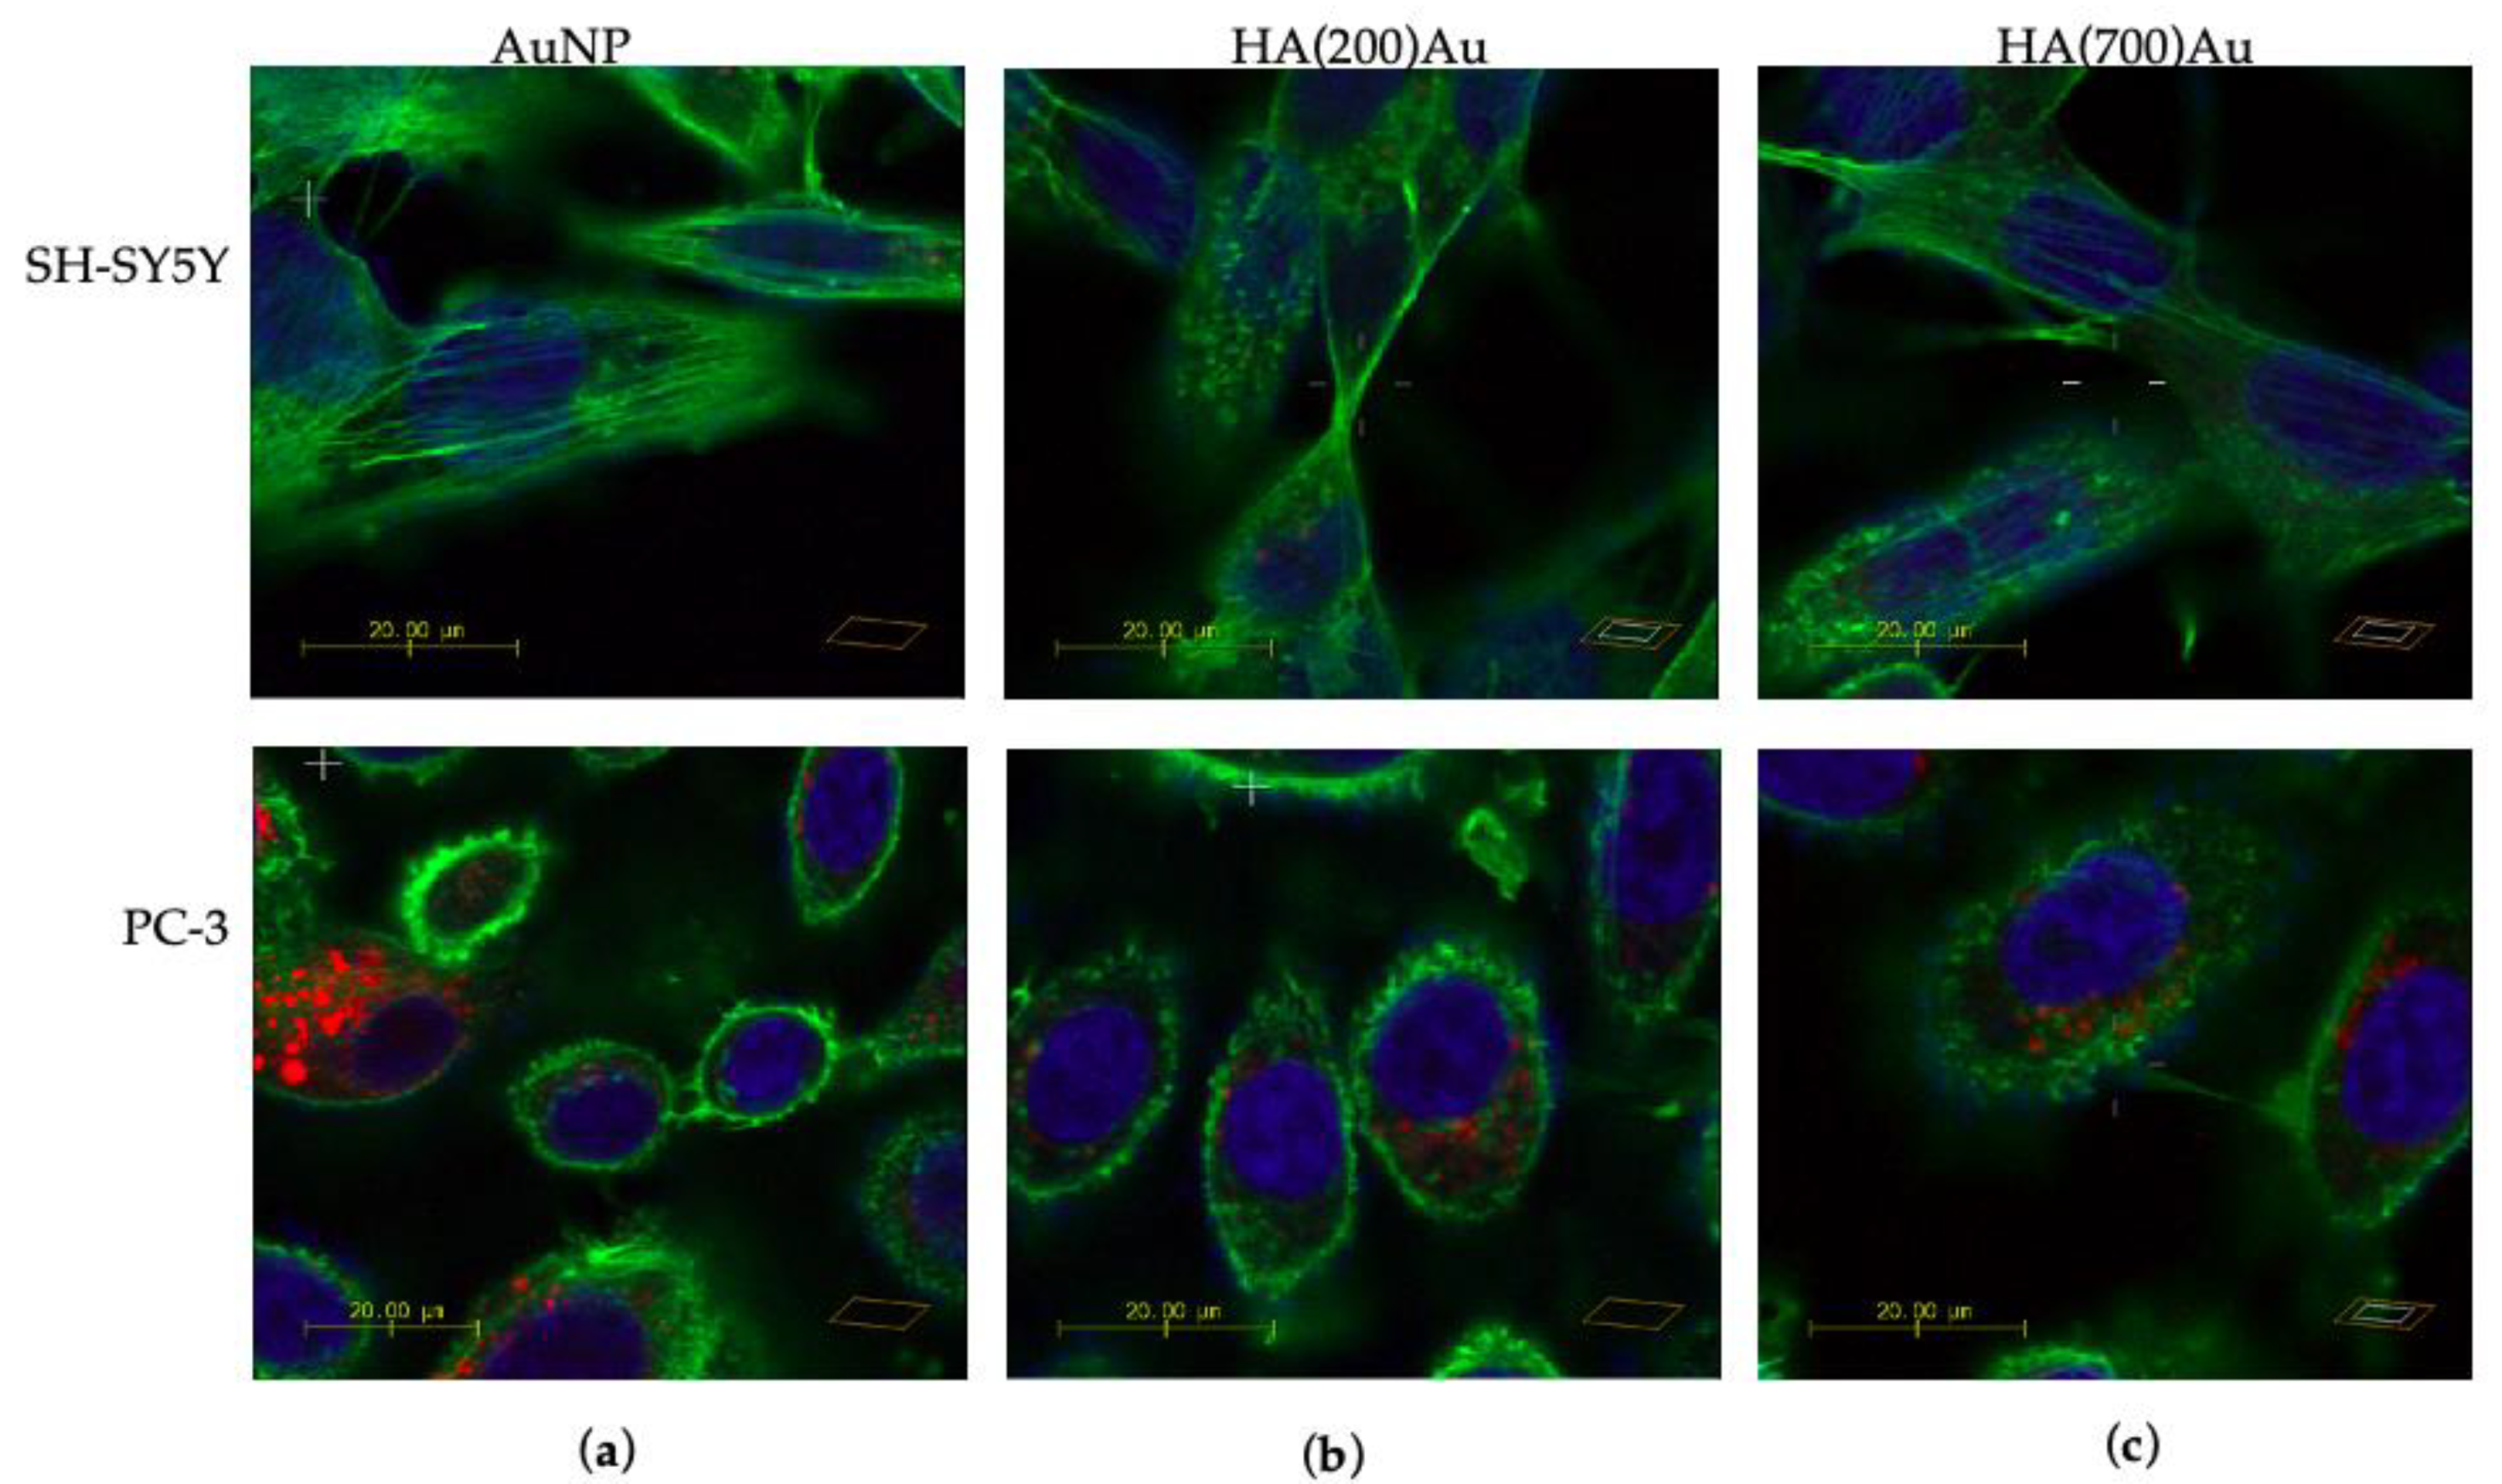
2. Results
3. Discussion
4. Materials and Methods
4.1. Chemicals
4.2. Synthesis of Bare and HA-Conjugated AuNP
4.3. UV–Visible (UV-vis) Spectroscopy and Dynamic Light Scattering (DLS) Analysis
4.4. Bacterial Assays
4.4.1. Strains and Culture Conditions
4.4.2. Broth Microdilution Assay
4.5. Cell Cultures and Maintenance
4.5.1. Cell Viability Assay
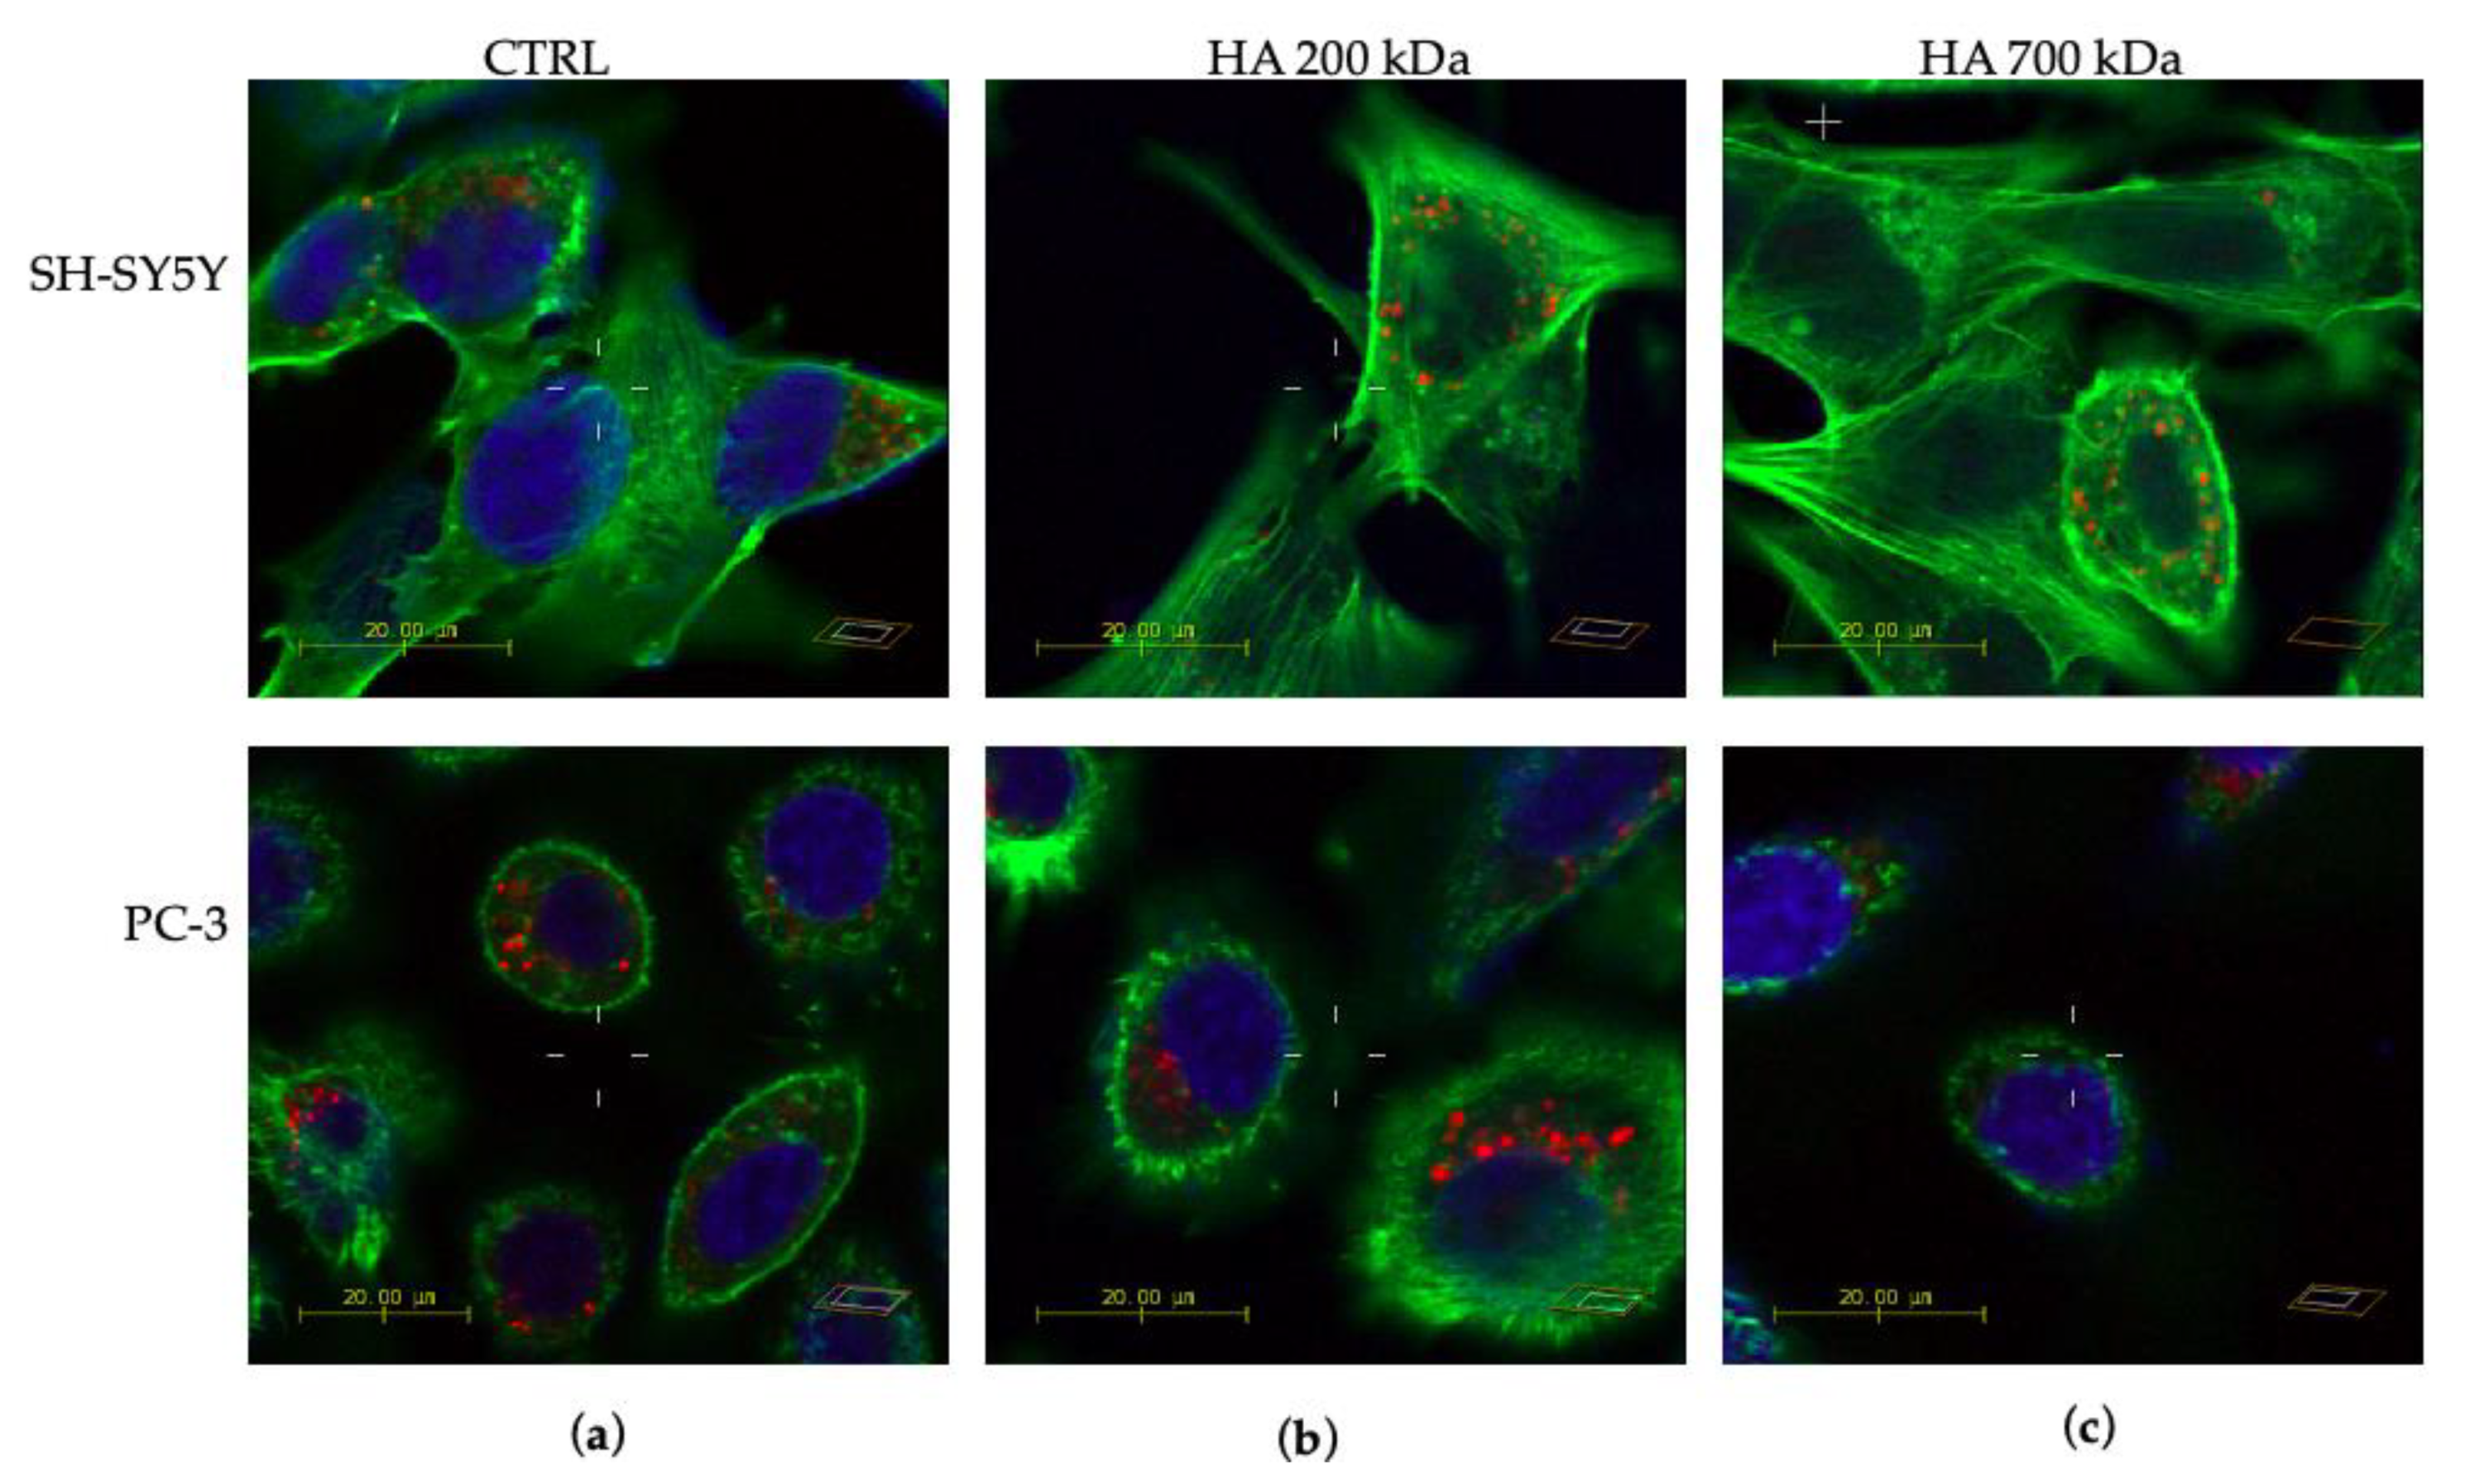
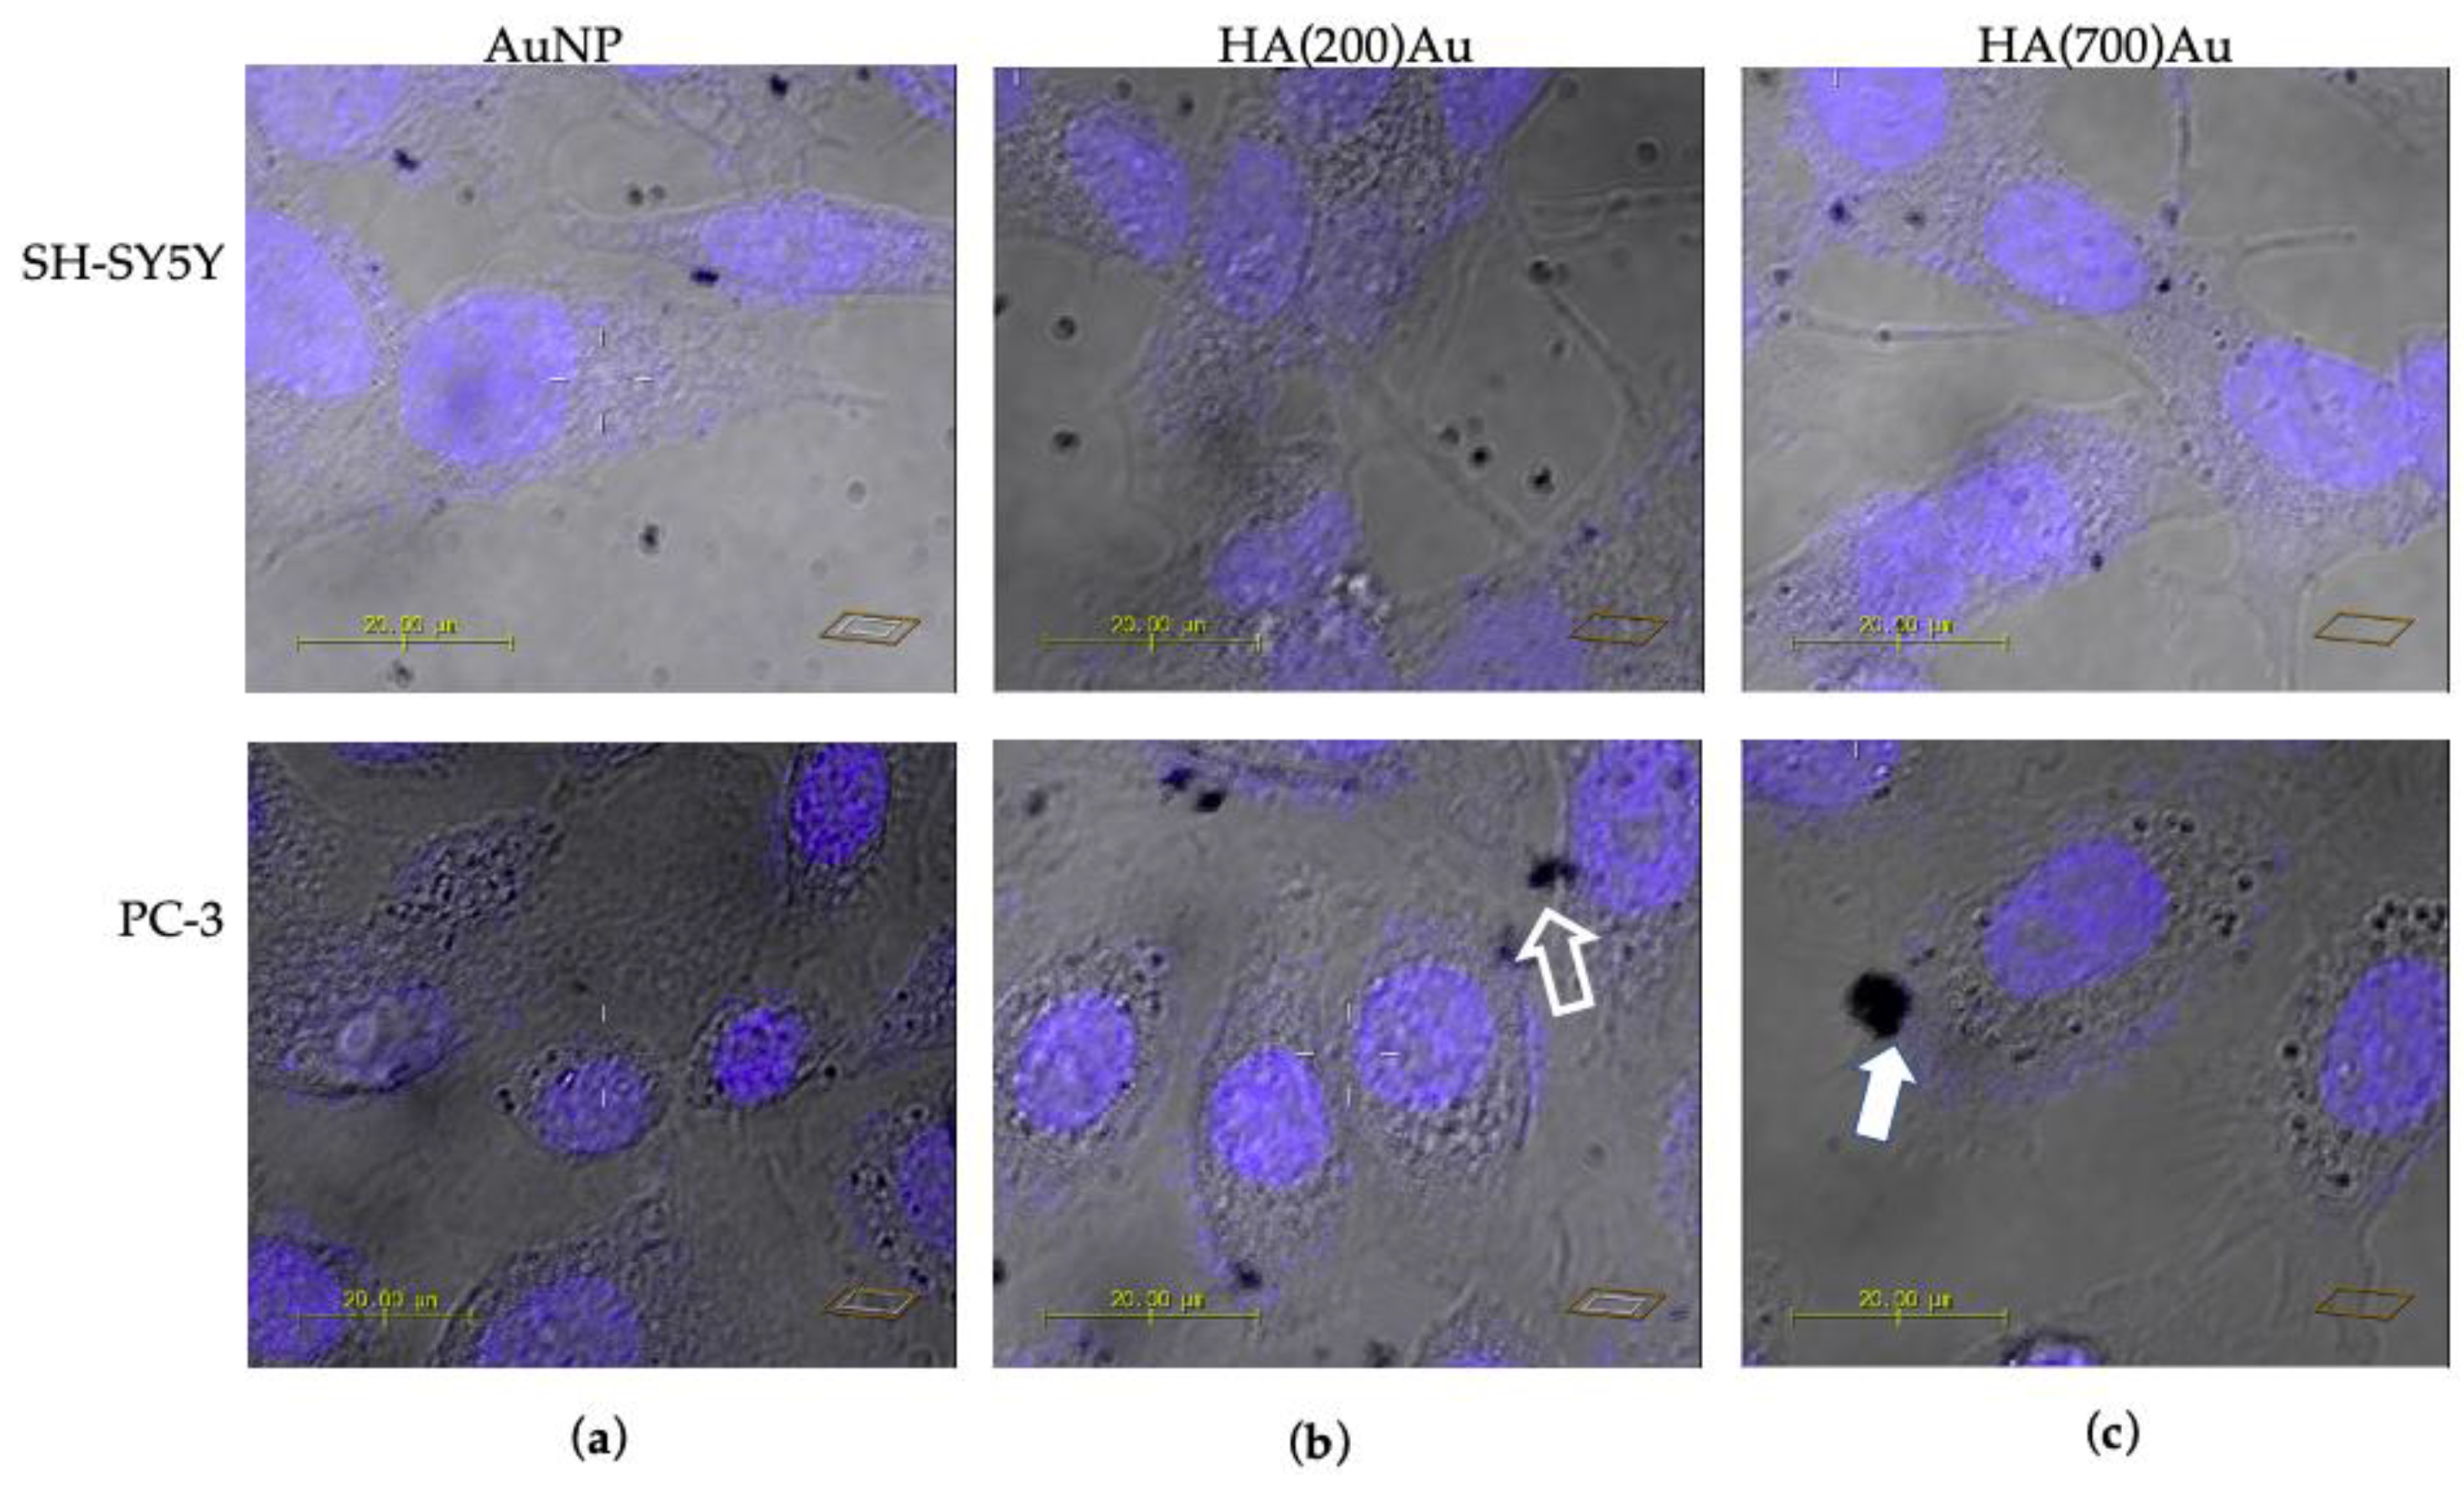
4.5.2. Confocal Microscopy Analysis
5. Conclusions
Author Contributions
Funding
Acknowledgments
Conflicts of Interest
Abbreviations
| AuNP | Gold Nanoparticles |
| CD44 | Cluster Determinant 44 |
| DLS | Dynamic Light Scattering |
| DMEM | Dulbecco’s Modified Eagle Medium |
| DMSO | Dimethyl sulfoxide |
| E. coli | Escherichia coli |
| EPR | Enhanced Permeability Retention |
| FBS | Foetal Bovine Serum |
| FWHM | Full Width at Half Maximum |
| HA | Hyaluronic Acid |
| HUVEC | Human Umbilical Vein Endothelial Cell |
| LSM | Laser Scanning Microscopy |
| MIC | Minimum Inhibitory Concentration |
| NPs | Nanoparticles |
| S. aureus | Staphylococcus aureus |
| S.E.M. | Standard Error of Means |
| VEGF | Vascular-Endothelial Growth Factor |
References
- Bharali, D.J.; Mousa, S.A. Emerging nanomedicines for early cancer detection and improved treatment: Current perspective and future promise. Pharmacol. Ther. 2010, 128, 324–335. [Google Scholar] [CrossRef] [PubMed]
- Patra, J.K.; Das, G.; Fraceto, L.F.; Campos, E.V.R.; Rodriguez-Torres, M.D.P.; Acosta-Torres, L.S.; Diaz-Torres, L.A.; Grillo, R.; Swamy, M.K.; Sharma, S.; et al. Nano based drug delivery systems: Recent developments and future prospects. J. Nanobiotechnol. 2018, 16, 71. [Google Scholar] [CrossRef] [PubMed] [Green Version]
- Sahoo, A.K.; Banerjee, S.; Ghosh, S.S.; Chattopadhyay, A. Simultaneous RGB emitting Au nanoclusters in chitosan nanoparticles for anticancer gene theranostics. ACS Appl. Mater. Interfaces 2014, 6, 712–724. [Google Scholar] [CrossRef]
- Chatterjee, D.K.; Diagaradjane, P.; Krishnan, S. Nanoparticle-mediated hyperthermia in cancer therapy. Ther. Deliv. 2011, 2, 1001–1014. [Google Scholar] [CrossRef] [Green Version]
- Huang, K.; Ma, H.; Liu, J.; Huo, S.; Kumar, A.; Wei, T.; Zhang, X.; Jin, S.; Gan, Y.; Wang, P.C.; et al. Size-dependent localization and penetration of ultrasmall gold nanoparticles in cancer cells, multicellular spheroids, and tumors in vivo. ACS Nano 2012, 6, 4483–4493. [Google Scholar] [CrossRef] [Green Version]
- Di Pietro, P.; Strano, G.; Zuccarello, L.; Satriano, C. Gold and Silver Nanoparticles for Applications in Theranostics. Curr. Top. Med. Chem. 2016, 16, 3069–3102. [Google Scholar] [CrossRef]
- Yezhelyev, M.V.; Gao, X.; Xing, Y.; Al-Hajj, A.; Nie, S.; O’Regan, R.M. Emerging use of nanoparticles in diagnosis and treatment of breast cancer. Lancet Oncol. 2006, 7, 657–667. [Google Scholar] [CrossRef]
- Lee, K.-S.; El-Sayed, M.A. Gold and Silver Nanoparticles in Sensing and Imaging: Sensitivity of Plasmon Response to Size, Shape, and Metal Composition. J. Phys. Chem. B 2006, 110, 19220–19225. [Google Scholar] [CrossRef]
- Connor, E.E.; Mwamuka, J.; Gole, A.; Murphy, C.J.; Wyatt, M.D. Gold nanoparticles are taken up by human cells but do not cause acute cytotoxicity. Small 2005, 1, 325–327. [Google Scholar] [CrossRef] [PubMed]
- Qu, Y.; Lu, X. Aqueous synthesis of gold nanoparticles and their cytotoxicity in human dermal fibroblasts-fetal. Biomed. Mater. 2009, 4, 025007. [Google Scholar] [CrossRef] [PubMed]
- Brandenberger, C.; Rothen-Rutishauser, B.; Muhlfeld, C.; Schmid, O.; Ferron, G.A.; Maier, K.L.; Gehr, P.; Lenz, A.G. Effects and uptake of gold nanoparticles deposited at the air-liquid interface of a human epithelial airway model. Toxicol. Appl. Pharmacol. 2010, 242, 56–65. [Google Scholar] [CrossRef] [PubMed]
- Yen, H.J.; Hsu, S.H.; Tsai, C.L. Cytotoxicity and immunological response of gold and silver nanoparticles of different sizes. Small 2009, 5, 1553–1561. [Google Scholar] [CrossRef] [PubMed]
- Vijayakumar, S.; Ganesan, S. Size-dependentin vitrocytotoxicity assay of gold nanoparticles. Toxicol. Environ. Chem. 2013, 95, 277–287. [Google Scholar] [CrossRef]
- Moore, K.A.; Pate, K.M.; Soto-Ortega, D.D.; Lohse, S.; van der Munnik, N.; Lim, M.; Jackson, K.S.; Lyles, V.D.; Jones, L.; Glassgow, N.; et al. Influence of gold nanoparticle surface chemistry and diameter upon Alzheimer’s disease amyloid-beta protein aggregation. J. Biol. Eng. 2017, 11, 5. [Google Scholar] [CrossRef] [Green Version]
- Jazayeri, M.H.; Amani, H.; Pourfatollah, A.A.; Pazoki-Toroudi, H.; Sedighimoghaddam, B. Various methods of gold nanoparticles (GNPs) conjugation to antibodies. Sens. Bio-Sens. Res. 2016, 9, 17–22. [Google Scholar] [CrossRef] [Green Version]
- Horikoshi, S.; Serpone, N. Microwaves in Nanoparticle Synthesis; Wiley-VCH Verlag GmbH & Co. KGaA: Weinheim, Germany, 2013. [Google Scholar] [CrossRef]
- Jain, P.K.; Lee, K.S.; El-Sayed, I.H.; El-Sayed, M.A. Calculated Absorption and Scattering Properties of Gold Nanoparticles of Different Size, Shape, and Composition: Applications in Biological Imaging and Biomedicine. J. Phys. Chem. B 2006, 110, 7238–7248. [Google Scholar] [CrossRef] [Green Version]
- Zeng, S.; Yong, K.-T.; Roy, I.; Dinh, X.-Q.; Yu, X.; Luan, F. A Review on Functionalized Gold Nanoparticles for Biosensing Applications. Plasmonics 2011, 6, 491–506. [Google Scholar] [CrossRef]
- Satriano, C. Special Issue on Nano-Biointerface for Biosensing. Appl. Sci. 2019, 9. [Google Scholar] [CrossRef] [Green Version]
- Dickerson, E.B.; Dreaden, E.C.; Huang, X.; El-Sayed, I.H.; Chu, H.; Pushpanketh, S.; McDonald, J.F.; El-Sayed, M.A. Gold nanorod assisted near-infrared plasmonic photothermal therapy (PPTT) of squamous cell carcinoma in mice. Cancer Lett. 2008, 269, 57–66. [Google Scholar] [CrossRef] [Green Version]
- Oueslati, M.H.; Tahar, L.B.; Harrath, A.H. Catalytic, antioxidant and anticancer activities of gold nanoparticles synthesized by kaempferol glucoside from Lotus leguminosae. Arab. J. Chem. 2020, 13, 3112–3122. [Google Scholar] [CrossRef]
- Yakimovich, N.O.; Ezhevskii, A.A.; Guseinov, D.V.; Smirnova, L.A.; Gracheva, T.A.; Klychkov, K.S. Antioxidant properties of gold nanoparticles studied by ESR spectroscopy. Russ. Chem. Bull. 2009, 57, 520–523. [Google Scholar] [CrossRef]
- Naletova, C.; D’Angeli, A.; Magrì La, M.; Lupo, S. A Tunable Nanoplatform of Nanogold Functionalised with Angiogenin Peptides for Anti-Angiogenic Therapy of Brain Tumours. Cancers 2019, 11, 1322. [Google Scholar] [CrossRef] [PubMed] [Green Version]
- Cucci, L.; Naletova, I.; Consiglio, G.; Satriano, C. A Hybrid Nanoplatform of Graphene Oxide/Nanogold for Plasmonic Sensing and Cellular Applications at the Nanobiointerface. Appl. Sci. 2019, 9, 676. [Google Scholar] [CrossRef] [Green Version]
- Maillard, J.Y.; Hartemann, P. Silver as an antimicrobial: Facts and gaps in knowledge. Crit. Rev. Microbiol. 2013, 39, 373–383. [Google Scholar] [CrossRef]
- Lin, C.-M.; Kao, W.-C.; Yeh, C.-A.; Chen, H.-J.; Lin, S.-Z.; Hsieh, H.-H.; Sun, W.-S.; Chang, C.-H.; Hung, H.-S. Hyaluronic acid-fabricated nanogold delivery of the inhibitor of apoptosis protein-2 siRNAs inhibits benzo[a]pyrene-induced oncogenic properties of lung cancer A549 cells. Nanotechnology 2015, 26, 105101. [Google Scholar] [CrossRef]
- Nel, A.E.; Madler, L.; Velegol, D.; Xia, T.; Hoek, E.M.; Somasundaran, P.; Klaessig, F.; Castranova, V.; Thompson, M. Understanding biophysicochemical interactions at the nano-bio interface. Nat. Mater. 2009, 8, 543–557. [Google Scholar] [CrossRef]
- Ventola, C.L. The nanomedicine revolution: Part 1: Emerging concepts. Pharm. Ther. 2012, 37, 512–525. [Google Scholar]
- Sajja, H.K.; East, M.P.; Mao, H.; Wang, Y.A.; Nie, S.; Yang, L. Development of multifunctional nanoparticles for targeted drug delivery and noninvasive imaging of therapeutic effect. Curr. Drug Discov. Technol. 2009, 6, 43–51. [Google Scholar] [CrossRef] [Green Version]
- Zhong, L.; Liu, Y.; Xu, L.; Li, Q.; Zhao, D.; Li, Z.; Zhang, H.; Zhang, H.; Kan, Q.; Sun, J.; et al. Exploring the relationship of hyaluronic acid molecular weight and active targeting efficiency for designing hyaluronic acid-modified nanoparticles. Asian J. Pharm. Sci. 2019, 14, 521–530. [Google Scholar] [CrossRef]
- Ropponen, K.; Tammi, M.; Parkkinen, J.; Eskelinen, M.; Tammi, R.; Lipponen, P.; Agren, U.; Alhava, E.; Kosma, V.M. Tumor cell-associated hyaluronan as an unfavorable prognostic factor in colorectal cancer. Cancer Res. 1998, 58, 342–347. [Google Scholar]
- Auvinen, P.; Tammi, R.; Parkkinen, J.; Tammi, M.; Ågren, U.; Johansson, R.; Hirvikoski, P.; Eskelinen, M.; Kosma, V.-M. Hyaluronan in Peritumoral Stroma and Malignant Cells Associates with Breast Cancer Spreading and Predicts Survival. Am. J. Pathol. 2000, 156, 529–536. [Google Scholar] [CrossRef]
- Itano, N.; Atsumi, F.; Sawai, T.; Yamada, Y.; Miyaishi, O.; Senga, T.; Hamaguchi, M.; Kimata, K. Abnormal accumulation of hyaluronan matrix diminishes contact inhibition of cell growth and promotes cell migration. Proc. Natl. Acad. Sci. USA 2002, 99, 3609–3614. [Google Scholar] [CrossRef] [PubMed] [Green Version]
- Toole, B.P. Hyaluronan promotes the malignant phenotype. Glycobiology 2002, 12, 37R–42R. [Google Scholar] [CrossRef] [PubMed] [Green Version]
- Sugahara, K.N.; Murai, T.; Nishinakamura, H.; Kawashima, H.; Saya, H.; Miyasaka, M. Hyaluronan Oligosaccharides Induce CD44 Cleavage and Promote Cell Migration in CD44-expressing Tumor Cells. J. Biol. Chem. 2003, 278, 32259–32265. [Google Scholar] [CrossRef] [Green Version]
- Zeng, C.; Toole, B.P.; Kinney, S.D.; Kuo, J.W.; Stamenkovic, I. Inhibition of tumor growth in vivo by hyaluronan oligomers. Int. J. Cancer 1998, 77, 396–401. [Google Scholar] [CrossRef]
- Ghatak, S.; Misra, S.; Toole, B.P. Hyaluronan oligosaccharides inhibit anchorage-independent growth of tumor cells by suppressing the phosphoinositide 3-kinase/Akt cell survival pathway. J. Biol. Chem. 2002, 277, 38013–38020. [Google Scholar] [CrossRef] [PubMed] [Green Version]
- Misra, S.; Ghatak, S.; Zoltan-Jones, A.; Toole, B.P. Regulation of Multidrug Resistance in Cancer Cells by Hyaluronan. J. Biol. Chem. 2003, 278, 25285–25288. [Google Scholar] [CrossRef] [PubMed] [Green Version]
- Lokeshwar, V.B.; Obek, C.; Soloway, M.S.; Block, N.L. Tumor-associated hyaluronic acid: A new sensitive and specific urine marker for bladder cancer. Cancer Res. 1997, 57, 773–777. [Google Scholar] [PubMed]
- Papakonstantinou, E.; Roth, M.; Karakiulakis, G. Hyaluronic acid: A key molecule in skin aging. Derm.-Endocrinol. 2012, 4, 253–258. [Google Scholar] [CrossRef] [Green Version]
- Fakhari, A.; Berkland, C. Applications and emerging trends of hyaluronic acid in tissue engineering, as a dermal filler and in osteoarthritis treatment. Acta Biomater. 2013, 9, 7081–7092. [Google Scholar] [CrossRef] [Green Version]
- Laurent, T.C.; Fraser, J.R. Hyaluronan. FASEB J. 1992, 6, 2397–2404. [Google Scholar] [CrossRef] [PubMed]
- Solis, M.A.; Chen, Y.-H.; Wong, T.Y.; Bittencourt, V.Z.; Lin, Y.-C.; Huang, L.L.H. Hyaluronan Regulates Cell Behavior: A Potential Niche Matrix for Stem Cells. Biochem. Res. Int. 2012, 2012, 1–11. [Google Scholar] [CrossRef] [PubMed] [Green Version]
- Mattheolabakis, G.; Milane, L.; Singh, A.; Amiji, M.M. Hyaluronic acid targeting of CD44 for cancer therapy: From receptor biology to nanomedicine. J. Drug Target. 2015, 23, 605–618. [Google Scholar] [CrossRef] [PubMed]
- Savani, R.C.; Cao, G.; Pooler, P.M.; Zaman, A.; Zhou, Z.; DeLisser, H.M. Differential Involvement of the Hyaluronan (HA) Receptors CD44 and Receptor for HA-mediated Motility in Endothelial Cell Function and Angiogenesis. J. Biol. Chem. 2001, 276, 36770–36778. [Google Scholar] [CrossRef] [Green Version]
- Chen, W.Y.; Abatangelo, G. Functions of hyaluronan in wound repair. Wound Repair Regen. 1999, 7, 79–89. [Google Scholar] [CrossRef]
- Necas, J.; Bartosikova, L.; Brauner, P.; Kolar, J. Hyaluronic acid (hyaluronan): A review. Veterinární Medicína 2008, 53, 397–411. [Google Scholar] [CrossRef] [Green Version]
- Misra, S.; Hascall, V.C.; Markwald, R.R.; Ghatak, S. Interactions between Hyaluronan and Its Receptors (CD44, RHAMM) Regulate the Activities of Inflammation and Cancer. Front. Immunol. 2015, 6, 201. [Google Scholar] [CrossRef] [Green Version]
- Aruffo, A.; Stamenkovic, I.; Melnick, M.; Underhill, C.B.; Seed, B. CD44 is the principal cell surface receptor for hyaluronate. Cell 1990, 61, 1303–1313. [Google Scholar] [CrossRef]
- Agnantis, N.J.; Goussia, A.C.; Batistatou, A.; Stefanou, D. Tumor markers in cancer patients. An Update of Their Prognostic Significance. Part II. In Vivo 2004, 18, 481–488. [Google Scholar]
- Mowbray, C.A.; Shams, S.; Chung, G.; Stanton, A.; Aldridge, P.; Suchenko, A.; Pickard, R.S.; Ali, A.S.M.; Hall, J. High molecular weight hyaluronic acid: A two-pronged protectant against infection of the urogenital tract? Clin. Transl. Immunol. 2018, 7, e1021. [Google Scholar] [CrossRef]
- Lim, H.W.; Pak, K.; Kurabi, A.; Ryan, A.F. Lack of the hyaluronan receptor CD44 affects the course of bacterial otitis media and reduces leukocyte recruitment to the middle ear. BMC Immunol. 2019, 20, 20. [Google Scholar] [CrossRef] [PubMed]
- Presti, D.; Scott, J.E. Hyaluronan-mediated protective effect against cell damage caused by enzymatically produced hydroxyl (OH.) radicals is dependent on hyaluronan molecular mass. Cell Biochem. Funct. 1994, 12, 281–288. [Google Scholar] [CrossRef] [PubMed]
- Fukuda, K.; Takayama, M.; Ueno, M.; Oh, M.; Asada, S.; Kumano, F.; Tanaka, S. Hyaluronic acid inhibits interleukin-1-induced superoxide anion in bovine chondrocytes. Inflamm. Res. 1997, 46, 114–117. [Google Scholar] [CrossRef] [PubMed]
- Cortivo, R.; Brun, P.; Cardarelli, L.; O’Regan, M.; Radice, M.; Abatangelo, G. Antioxidant effects of hyaluronan and its α-methyl-prednisolone derivative in chondrocyteand cartilage cultures. Semin. Arthritis Rheum. 1996, 26, 492–501. [Google Scholar] [CrossRef]
- Lee, D.-G.; Cho, J.-J.; Park, H.K.; Kim, D.K.; Kim, J.I.; Chang, S.-G.; Lee, S.-J. Preventive Effects of Hyaluronic Acid on Escherichia coli-induced Urinary Tract Infection in Rat. Urology 2010, 75, 949–954. [Google Scholar] [CrossRef] [PubMed]
- Li, C.; Wu, Y.; Riehle, A.; Orian-Rousseau, V.; Zhang, Y.; Gulbins, E.; Grassmé, H. Regulation of Staphylococcus aureus Infection of Macrophages by CD44, Reactive Oxygen Species, and Acid Sphingomyelinase. Antioxid. Redox Signal. 2018, 28, 916–934. [Google Scholar] [CrossRef] [Green Version]
- Eliaz, R.E.; Szoka, F.C., Jr. Liposome-encapsulated doxorubicin targeted to CD44: A strategy to kill CD44-overexpressing tumor cells. Cancer Res. 2001, 61, 2592–2601. [Google Scholar]
- Arpicco, S.; De Rosa, G.; Fattal, E. Lipid-Based Nanovectors for Targeting of CD44-Overexpressing Tumor Cells. J. Drug Deliv. 2013, 2013, 1–8. [Google Scholar] [CrossRef]
- Ganesh, S.; Iyer, A.K.; Morrissey, D.V.; Amiji, M.M. Hyaluronic acid based self-assembling nanosystems for CD44 target mediated siRNA delivery to solid tumors. Biomaterials 2013, 34, 3489–3502. [Google Scholar] [CrossRef] [Green Version]
- Kumar, C.S.; Raja, M.D.; Sundar, D.S.; Gover Antoniraj, M.; Ruckmani, K. Hyaluronic acid co-functionalized gold nanoparticle complex for the targeted delivery of metformin in the treatment of liver cancer (HepG2 cells). Carbohydr. Polym. 2015, 128, 63–74. [Google Scholar] [CrossRef]
- Lee, M.-Y.; Yang, J.-A.; Jung, H.S.; Beack, S.; Choi, J.E.; Hur, W.; Koo, H.; Kim, K.; Yoon, S.K.; Hahn, S.K. Hyaluronic Acid–Gold Nanoparticle/Interferon α Complex for Targeted Treatment of Hepatitis C Virus Infection. ACS Nano 2012, 6, 9522–9531. [Google Scholar] [CrossRef] [PubMed]
- Dreaden, E.C.; Austin, L.A.; Mackey, M.A.; El-Sayed, M.A. Size matters: Gold nanoparticles in targeted cancer drug delivery. Ther. Deliv. 2012, 3, 457–478. [Google Scholar] [CrossRef] [PubMed] [Green Version]
- Yan, P.; Mühlethaler, A.; Bourloud, K.B.; Beck, M.N.; Gross, N. Hypermethylation-mediated regulation ofCD44gene expression in human neuroblastoma. Genes Chromosomes Cancer 2003, 36, 129–138. [Google Scholar] [CrossRef]
- Sneath, R.J.; Mangham, D.C. The normal structure and function of CD44 and its role in neoplasia. Mol. Pathol. 1998, 51, 191–200. [Google Scholar] [CrossRef] [PubMed] [Green Version]
- Cucci, L.M.; Munzone, A.; Naletova, I.; Magrì, A.; La Mendola, D.; Satriano, C. Gold nanoparticles functionalized with angiogenin-mimicking peptides modulate cell membrane interactions. Biointerphases 2018, 13, 03C401. [Google Scholar] [CrossRef] [PubMed]
- Oliveira, J.P.; Prado, A.R.; Keijok, W.J.; Ribeiro, M.R.N.; Pontes, M.J.; Nogueira, B.V.; Guimarães, M.C.C. A helpful method for controlled synthesis of monodisperse gold nanoparticles through response surface modeling. Arab. J. Chem. 2020, 13, 216–226. [Google Scholar] [CrossRef]
- Kim, S.Y.; Zukoski, C.F. Molecular Weight Effects on Particle and Polymer Microstructure in Concentrated Polymer Solutions. Macromolecules 2013, 46, 6634–6643. [Google Scholar] [CrossRef]
- Uppal, M.A.; Kafizas, A.; Lim, T.H.; Parkin, I.P. The extended time evolution size decrease of gold nanoparticles formed by the Turkevich method. New J. Chem. 2010, 34, 1401–1407. [Google Scholar] [CrossRef]
- Zamanhuri, N.A.; Alrozi, R.; Osman, M.S. Biosynthesis of silver nanoparticles using pink guava waste extract (PGWE). In Proceedings of the 2012 IEEE Business, Engineering & Industrial Applications Colloquium (BEIAC), Kuala Lumpur, Malaysia, 7–8 April 2012; pp. 98–102. [Google Scholar]
- He, Y.Q.; Liu, S.P.; Kong, L.; Liu, Z.F. A study on the sizes and concentrations of gold nanoparticles by spectra of absorption, resonance Rayleigh scattering and resonance non-linear scattering. Spectrochim. Acta A Mol. Biomol. Spectrosc. 2005, 61, 2861–2866. [Google Scholar] [CrossRef]
- Navarro, J.R.G.; Werts, M.H.V. Resonant light scattering spectroscopy of gold, silver and gold–silver alloy nanoparticles and optical detection in microfluidic channels. Analyst 2013, 138, 583–592. [Google Scholar] [CrossRef]
- Di Pietro, P.; Zaccaro, L.; Comegna, D.; Del Gatto, A.; Saviano, M.; Snyders, R.; Cossement, D.; Satriano, C.; Rizzarelli, E. Silver nanoparticles functionalized with a fluorescent cyclic RGD peptide: A versatile integrin targeting platform for cells and bacteria. RSC Adv. 2016, 6, 112381–112392. [Google Scholar] [CrossRef]
- Farkas, N.; Scaria, P.V.; Woodle, M.C.; Dagata, J.A. Physical-chemical measurement method development for self-assembled, core-shell nanoparticles. Sci. Rep. 2019, 9, 1655. [Google Scholar] [CrossRef] [PubMed] [Green Version]
- Evanko, S.P.; Wight, T.N. Intracellular localization of hyaluronan in proliferating cells. J. Histochem. Cytochem. 1999, 47, 1331–1342. [Google Scholar] [CrossRef] [PubMed]
- Jung, J.; Park, S.; Hong, S.; Ha, M.W.; Park, H.G.; Park, Y.; Lee, H.J.; Park, Y. Synthesis of gold nanoparticles with glycosides: Synthetic trends based on the structures of glycones and aglycones. Carbohydr. Res. 2014, 386, 57–61. [Google Scholar] [CrossRef]
- Mishra, Y.K.; Suvarna, S.; Das, U.; Kc, S.; Mishra, S.; Sudarshan, M.; Saha, K.D.; Dey, S.; Chakraborty, A.; Narayana, Y. Synthesis of a novel glucose capped gold nanoparticle as a better theranostic candidate. PLoS ONE 2017, 12, e0178202. [Google Scholar] [CrossRef]
- Katti, K.; Kattumuri, V.; Bhaskaran, S.; Katti, K.; Kannan, R. Facile and General Method for Synthesis of Sugar-Coated Gold Nanoparticles. Int. J. Nanotechnol.: Biomed. 2009, 1, 53–59. [Google Scholar] [CrossRef] [Green Version]
- Shimmin, R.G.; Schoch, A.B.; Braun, P.V. Polymer Size and Concentration Effects on the Size of Gold Nanoparticles Capped by Polymeric Thiols. Langmuir 2004, 20, 5613–5620. [Google Scholar] [CrossRef]
- Zhao, S.; Tian, Y.; Liu, W.; Su, Y.; Zhang, Y.; Teng, Z.; Zhao, Y.; Wang, S.; Lu, G.; Yu, Z. High and low molecular weight hyaluronic acid-coated gold nanobipyramids for photothermal therapy. RSC Adv. 2018, 8, 9023–9030. [Google Scholar] [CrossRef] [Green Version]
- Chistyakov, D.V.; Astakhova, A.A.; Azbukina, N.V.; Goriainov, S.V.; Chistyakov, V.V.; Sergeeva, M.G. High and Low Molecular Weight Hyaluronic Acid Differentially Influences Oxylipins Synthesis in Course of Neuroinflammation. Int. J. Mol. Sci. 2019, 20, 3894. [Google Scholar] [CrossRef] [Green Version]
- Qhattal, H.S.S.; Liu, X. Characterization of CD44-Mediated Cancer Cell Uptake and Intracellular Distribution of Hyaluronan-Grafted Liposomes. Mol. Pharm. 2011, 8, 1233–1246. [Google Scholar] [CrossRef] [Green Version]
- Wolny, P.M.; Banerji, S.; Gounou, C.; Brisson, A.R.; Day, A.J.; Jackson, D.G.; Richter, R.P. Analysis of CD44-Hyaluronan Interactions in an Artificial Membrane System. J. Biol. Chem. 2010, 285, 30170–30180. [Google Scholar] [CrossRef] [PubMed] [Green Version]
- Wu, Y.; Zhang, Q.; Ruan, Z.; Yin, Y. Intrinsic effects of gold nanoparticles on proliferation and invasion activity in SGC-7901 cells. Oncol. Rep. 2016, 35, 1457–1462. [Google Scholar] [CrossRef] [PubMed]
- Foroozandeh, P.; Aziz, A.A. Insight into Cellular Uptake and Intracellular Trafficking of Nanoparticles. Nanoscale Res. Lett. 2018, 13, 339. [Google Scholar] [CrossRef] [PubMed]
- Ong, C.; Lim, J.Z.; Ng, C.T.; Li, J.J.; Yung, L.Y.; Bay, B.H. Silver nanoparticles in cancer: Therapeutic efficacy and toxicity. Curr. Med. Chem. 2013, 20, 772–781. [Google Scholar]
- Chen, C.; Zhao, S.; Karnad, A.; Freeman, J.W. The biology and role of CD44 in cancer progression: Therapeutic implications. J. Hematol. Oncol. 2018, 11, 64. [Google Scholar] [CrossRef] [Green Version]
- Shtivelman, E.; Bishop, J.M. Expression of CD44 is repressed in neuroblastoma cells. Mol. Cell. Biol. 1991, 11, 5446–5453. [Google Scholar] [CrossRef] [Green Version]
- De Marzo, A.M.; Bradshaw, C.; Sauvageot, J.; Epstein, J.I.; Miller, G.J. CD44 and CD44v6 downregulation in clinical prostatic carcinoma: Relation to Gleason grade and cytoarchitecture. Prostate 1998, 34, 162–168. [Google Scholar] [CrossRef]
- Verkaik, N.S.; van Steenbrugge, G.J.; van Weerden, W.M.; Bussemakers, M.J.; van der Kwast, T.H. Silencing of CD44 Expression in Prostate Cancer by Hypermethylation of the CD44 Promoter Region. Lab. Investig. 2000, 80, 1291–1298. [Google Scholar] [CrossRef] [Green Version]
- Marhaba, R.; Zöller, M. CD44 in Cancer Progression: Adhesion, Migration and Growth Regulation. J. Mol. Histol. 2003, 35, 211–231. [Google Scholar] [CrossRef]
- Nagano, O.; Saya, H. Mechanism and biological significance of CD44 cleavage. Cancer Sci. 2004, 95, 930–935. [Google Scholar] [CrossRef]
- Croce, M.A.; Boraldi, F.; Quaglino, D.; Tiozzo, R.; Pasquali-Ronchetti, I. Hyaluronan uptake by adult human skin fibroblasts in vitro. Eur. J. Histochem. 2003, 47, 63–73. [Google Scholar] [CrossRef] [PubMed]
- M7-A7. Methods for Dilution Antimicrobial Susceptibility Tests for Bacteria That Grow Aerobically; Clinical Laboratory Standards Institute: Wayne, PA, USA, 2006. [Google Scholar]


| Sample | FWHM ± S.D. (nm) | λmax ± S.D. (nm) | Amax ± S.D |
|---|---|---|---|
| AuNP | 61 ± 4 | 531 ± 1 | 0.21 ± 0.04 |
| HA(200)Au | 88 ± 5 | 568 ± 1 | 0.32 ± 0.02 |
| HA(700)Au | 95 ± 3 | 555 ± 1 | 0.22 ± 0.02 |
| Sample | FWHM (ΔFWHM), nm | λmax (Δλmax), nm | Amax (ΔA, %), nm |
|---|---|---|---|
| AuNP (t = 0) | 57 (0) | 535 (0) | 0.567 (0) |
| AuNP (t = 2 days) | 59 (2) | 537 (2) | 0.402 (50%) |
| AuNP (t = 7 days) | 58 (1) | 537 (2) | 0.324 (29%) |
| AuNP (t = 8 days) | 57 (0) | 537 (2) | 0.291 (49%) |
| AuNP (t = 10 days) | 59 (2) | 537 (2) | 0.216 (62%) |
| HA(200)Au (t = 0) | 82 (0) | 561 (0) | 0.554 (0) |
| HA(200)Au (t = 2 days) | 81 (−1) | 560 (−1) | 0.486 (12) |
| HA(200)Au (t = 7 days) | 94 (12) | 566 (5) | 0.345 (38) |
| HA(200)Au (t = 8 days) | 92 (10) | 566 (5) | 0.294 (47) |
| HA(200)Au (t = 10 days) | 107 (25) | 566 (5) | 0.231 (58) |
| HA(700)Au (t = 0) | 84 (0) | 548 (0) | 0.394 (0) |
| HA(700)Au (t = 2 days) | 86 (2) | 549 (1) | 0.347 (12%) |
| HA(700)Au (t = 7 days) | 87 (3) | 548 (0) | 0.296 (25%) |
| HA(700)Au (t = 8 days) | 93 (9) | 549 (1) | 0.223 (43%) |
| HA(700)Au (t = 10 days) | 93 (9) | 549 (1) | 0.132 (66%) |
| Sample | d (nm) | ε (108 mol−1·L·cm −1) | c (10−12 mol·L−1) | NP/mL |
|---|---|---|---|---|
| AuNPas prep (t = 0) | 47 | 150 | 160 | 2.0 × 10⁴ |
| AuNP (t = 0) | 55 | 265 | 220 | 2.6 × 10⁴ |
| AuNP (t = 2 days) | 60 | 35.1 | 120 | 1.0 × 10⁴ |
| AuNP (t = 7 days) | 60 | 35.1 | 90 | 8.3 × 10³ |
| AuNP (t = 8 days) | 60 | 35.1 | 80 | 7.4 × 10³ |
| AuNP (t = 10 days) | 60 | 35.1 | 60 | 5.5 × 10³ |
| HA(200)Auas prep (t = 0) | 148 | 2480 | 11 | 6.8 × 101 |
| HA(200)Au (t = 0) | 126 | 1960 | 30 | 2.8 × 10² |
| HA(200)Au (t = 2 days) | 126 | 1900 | 30 | 2.7 × 10² |
| HA(200)Au (t = 7 days) | 140 | 2280 | 20 | 1.1 × 10² |
| HA(200)Au (t = 8 days) | 140 | 2280 | 10 | 9.2 × 101 |
| HA(200)Au (t=10 days) | 140 | 2280 | 10 | 7.2 × 101 |
| HA(700)Auas prep (t = 0) | 107 | 1540 | 11 | 2.0 × 10² |
| HA(700)Au (t = 0) | 90 | 1200 | 30 | 8.7 × 10² |
| HA(700)Au (t = 2 days) | 93 | 1250 | 30 | 6.7 × 10² |
| HA(700)Au (t = 7 days) | 90 | 1200 | 20 | 6.5 × 10² |
| HA(700)Au (t = 8 days) | 93 | 1250 | 20 | 4.3 × 10² |
| HA(700)Au (t=10 days) | 93 | 1250 | 10 | 2.6 × 10² |
| Sample | E. coli ATCC 9637 or S. aureus ATCC 29213 | |
|---|---|---|
| Minimum Inhibitory Concentration (MIC) | ||
| nM | µg/mL | |
| AuNP | 0.58 | 1.4 × 10⁻¹ |
| HA(200)Au | 0.55 | 1.4 × 10⁻⁵ |
| HA(700)Au | 0.42 | 1.0 × 10⁻⁵ |
| CHL | 8.0 | |
© 2020 by the authors. Licensee MDPI, Basel, Switzerland. This article is an open access article distributed under the terms and conditions of the Creative Commons Attribution (CC BY) license (http://creativecommons.org/licenses/by/4.0/).
Share and Cite
Sanfilippo, V.; Caruso, V.C.L.; Cucci, L.M.; Inturri, R.; Vaccaro, S.; Satriano, C. Hyaluronan-Metal Gold Nanoparticle Hybrids for Targeted Tumor Cell Therapy. Int. J. Mol. Sci. 2020, 21, 3085. https://0-doi-org.brum.beds.ac.uk/10.3390/ijms21093085
Sanfilippo V, Caruso VCL, Cucci LM, Inturri R, Vaccaro S, Satriano C. Hyaluronan-Metal Gold Nanoparticle Hybrids for Targeted Tumor Cell Therapy. International Journal of Molecular Sciences. 2020; 21(9):3085. https://0-doi-org.brum.beds.ac.uk/10.3390/ijms21093085
Chicago/Turabian StyleSanfilippo, Vanessa, Viviana Carmela Linda Caruso, Lorena Maria Cucci, Rosanna Inturri, Susanna Vaccaro, and Cristina Satriano. 2020. "Hyaluronan-Metal Gold Nanoparticle Hybrids for Targeted Tumor Cell Therapy" International Journal of Molecular Sciences 21, no. 9: 3085. https://0-doi-org.brum.beds.ac.uk/10.3390/ijms21093085