Extracellular Matrix Composition Modulates the Responsiveness of Differentiated and Stem Pancreatic Cancer Cells to Lipophilic Derivate of Gemcitabine

 , , , , ,
  and
and 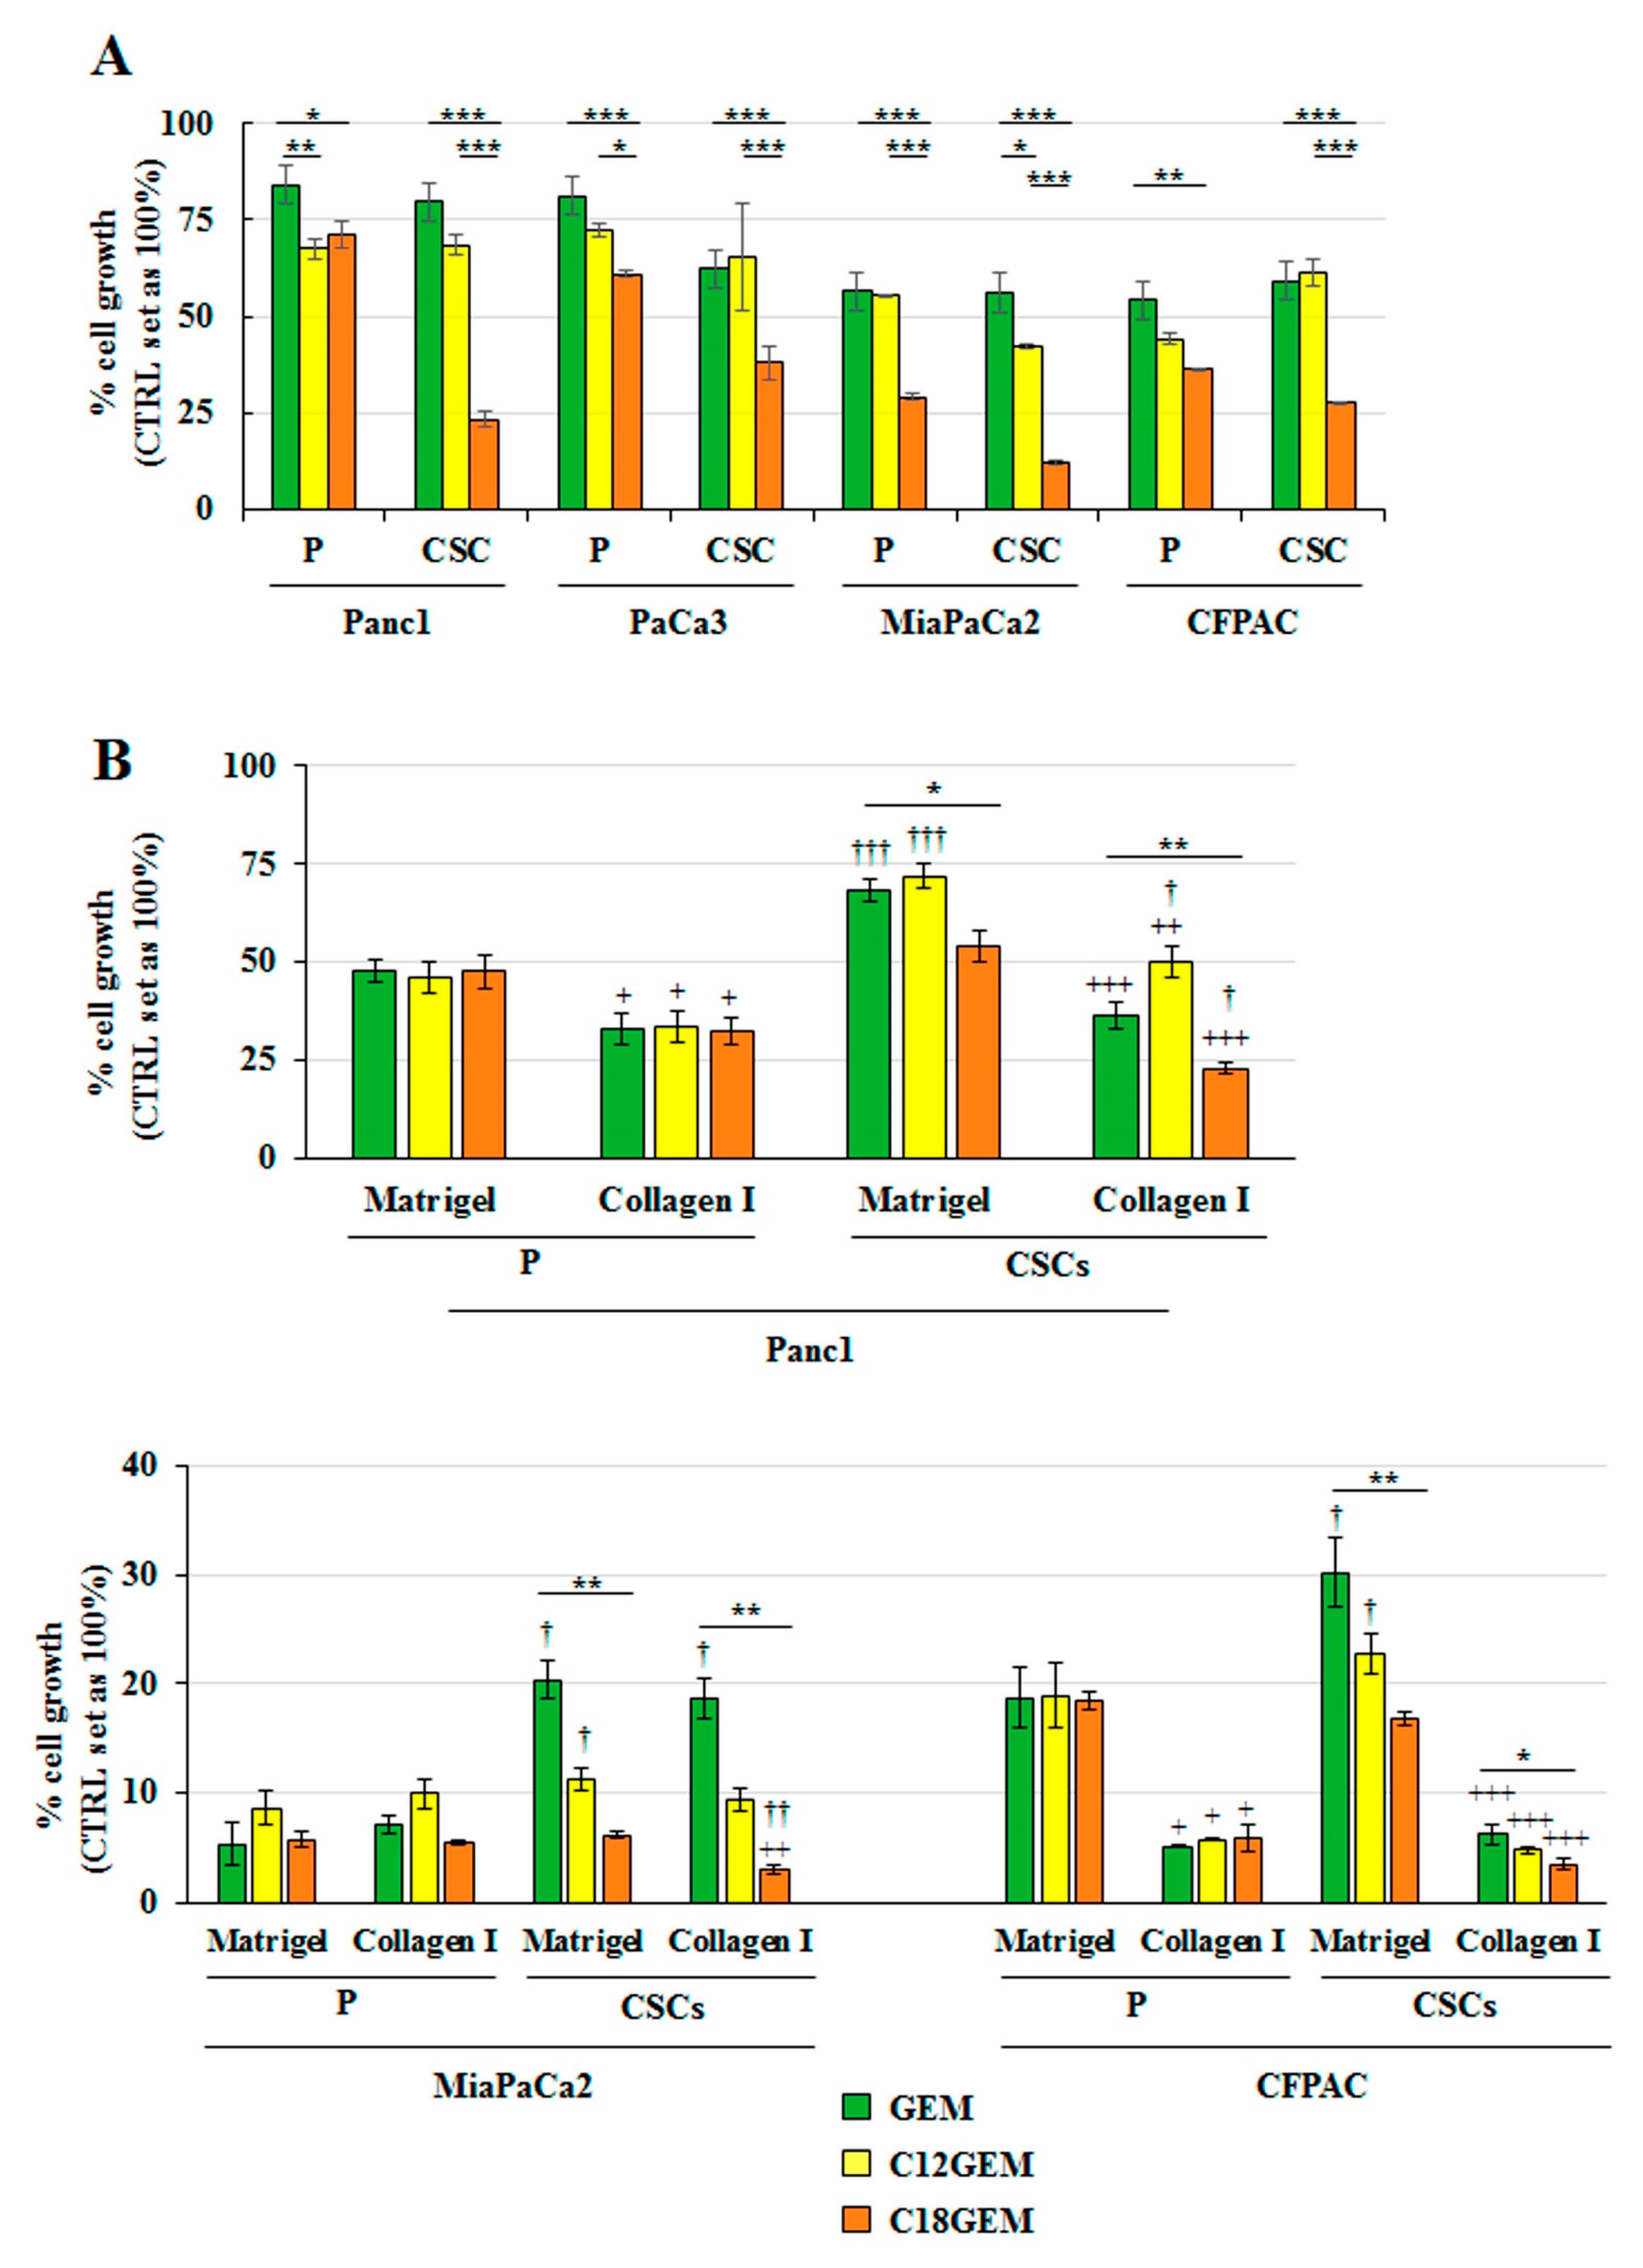
Abstract
:1. Introduction
2. Results
2.1. C18GEM Is More Effective Than GEM in Inhibiting PDAC CSCs’ Growth in Both 2D and 3D Conditions
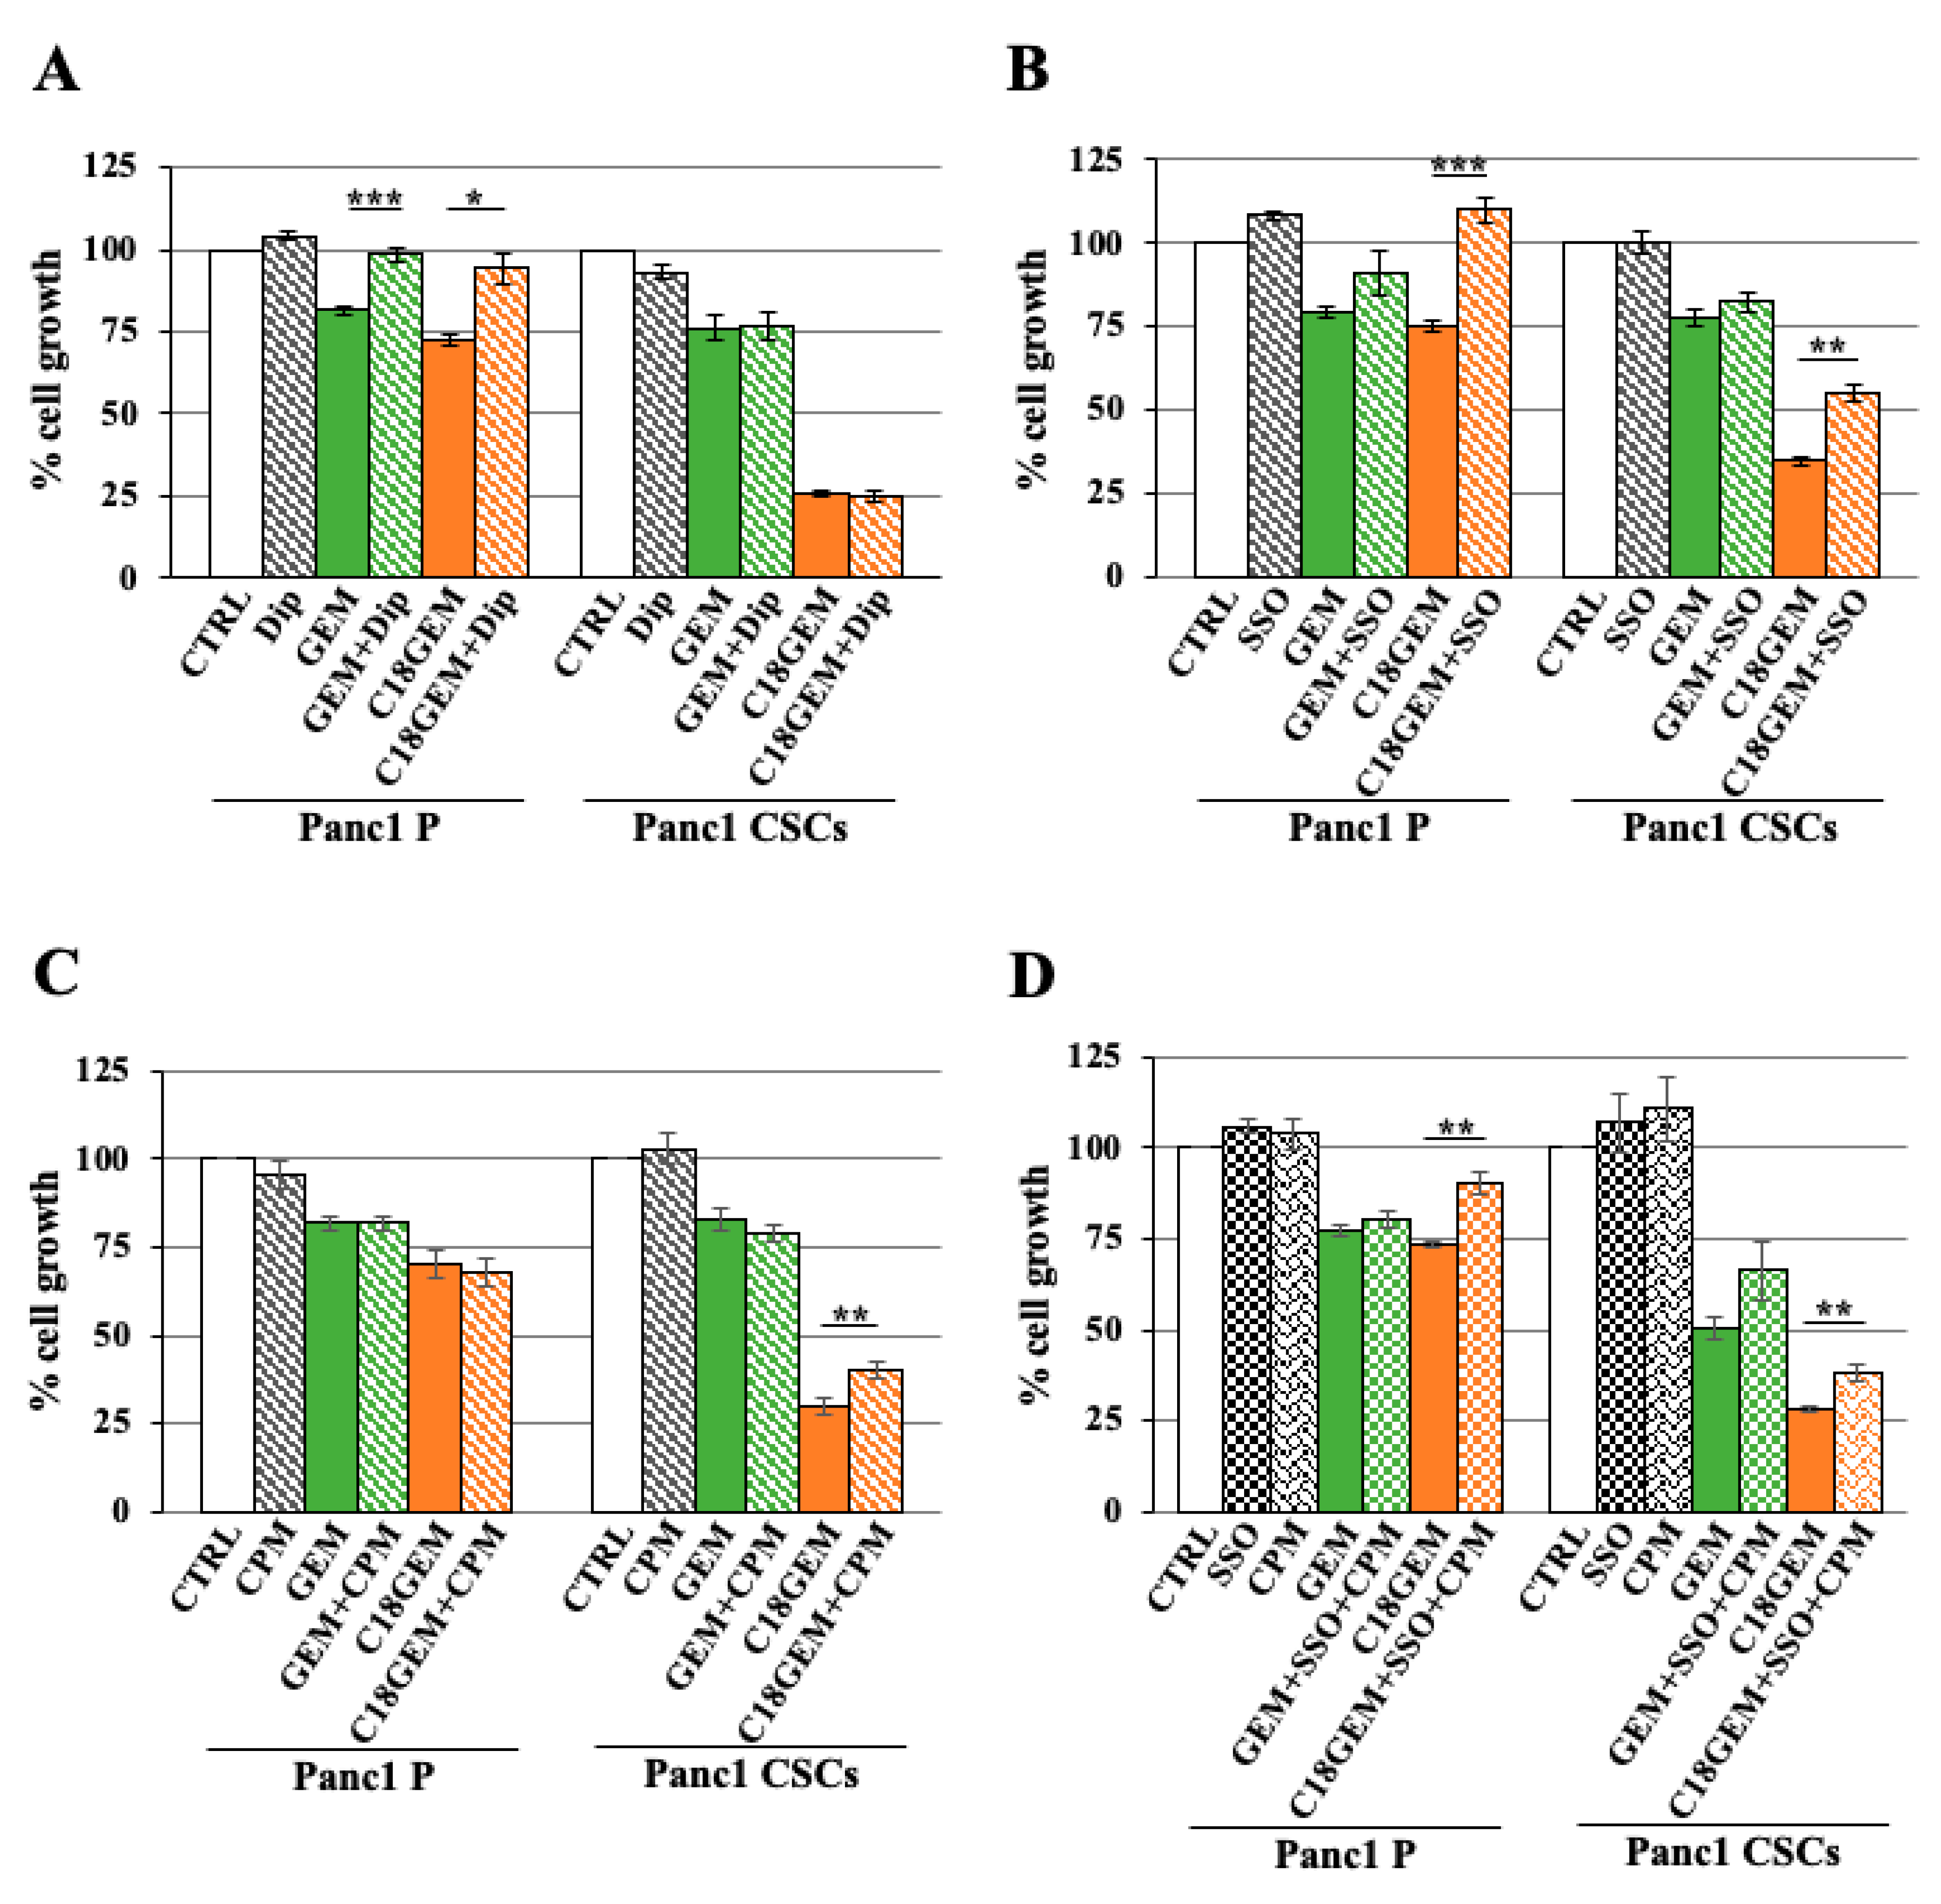
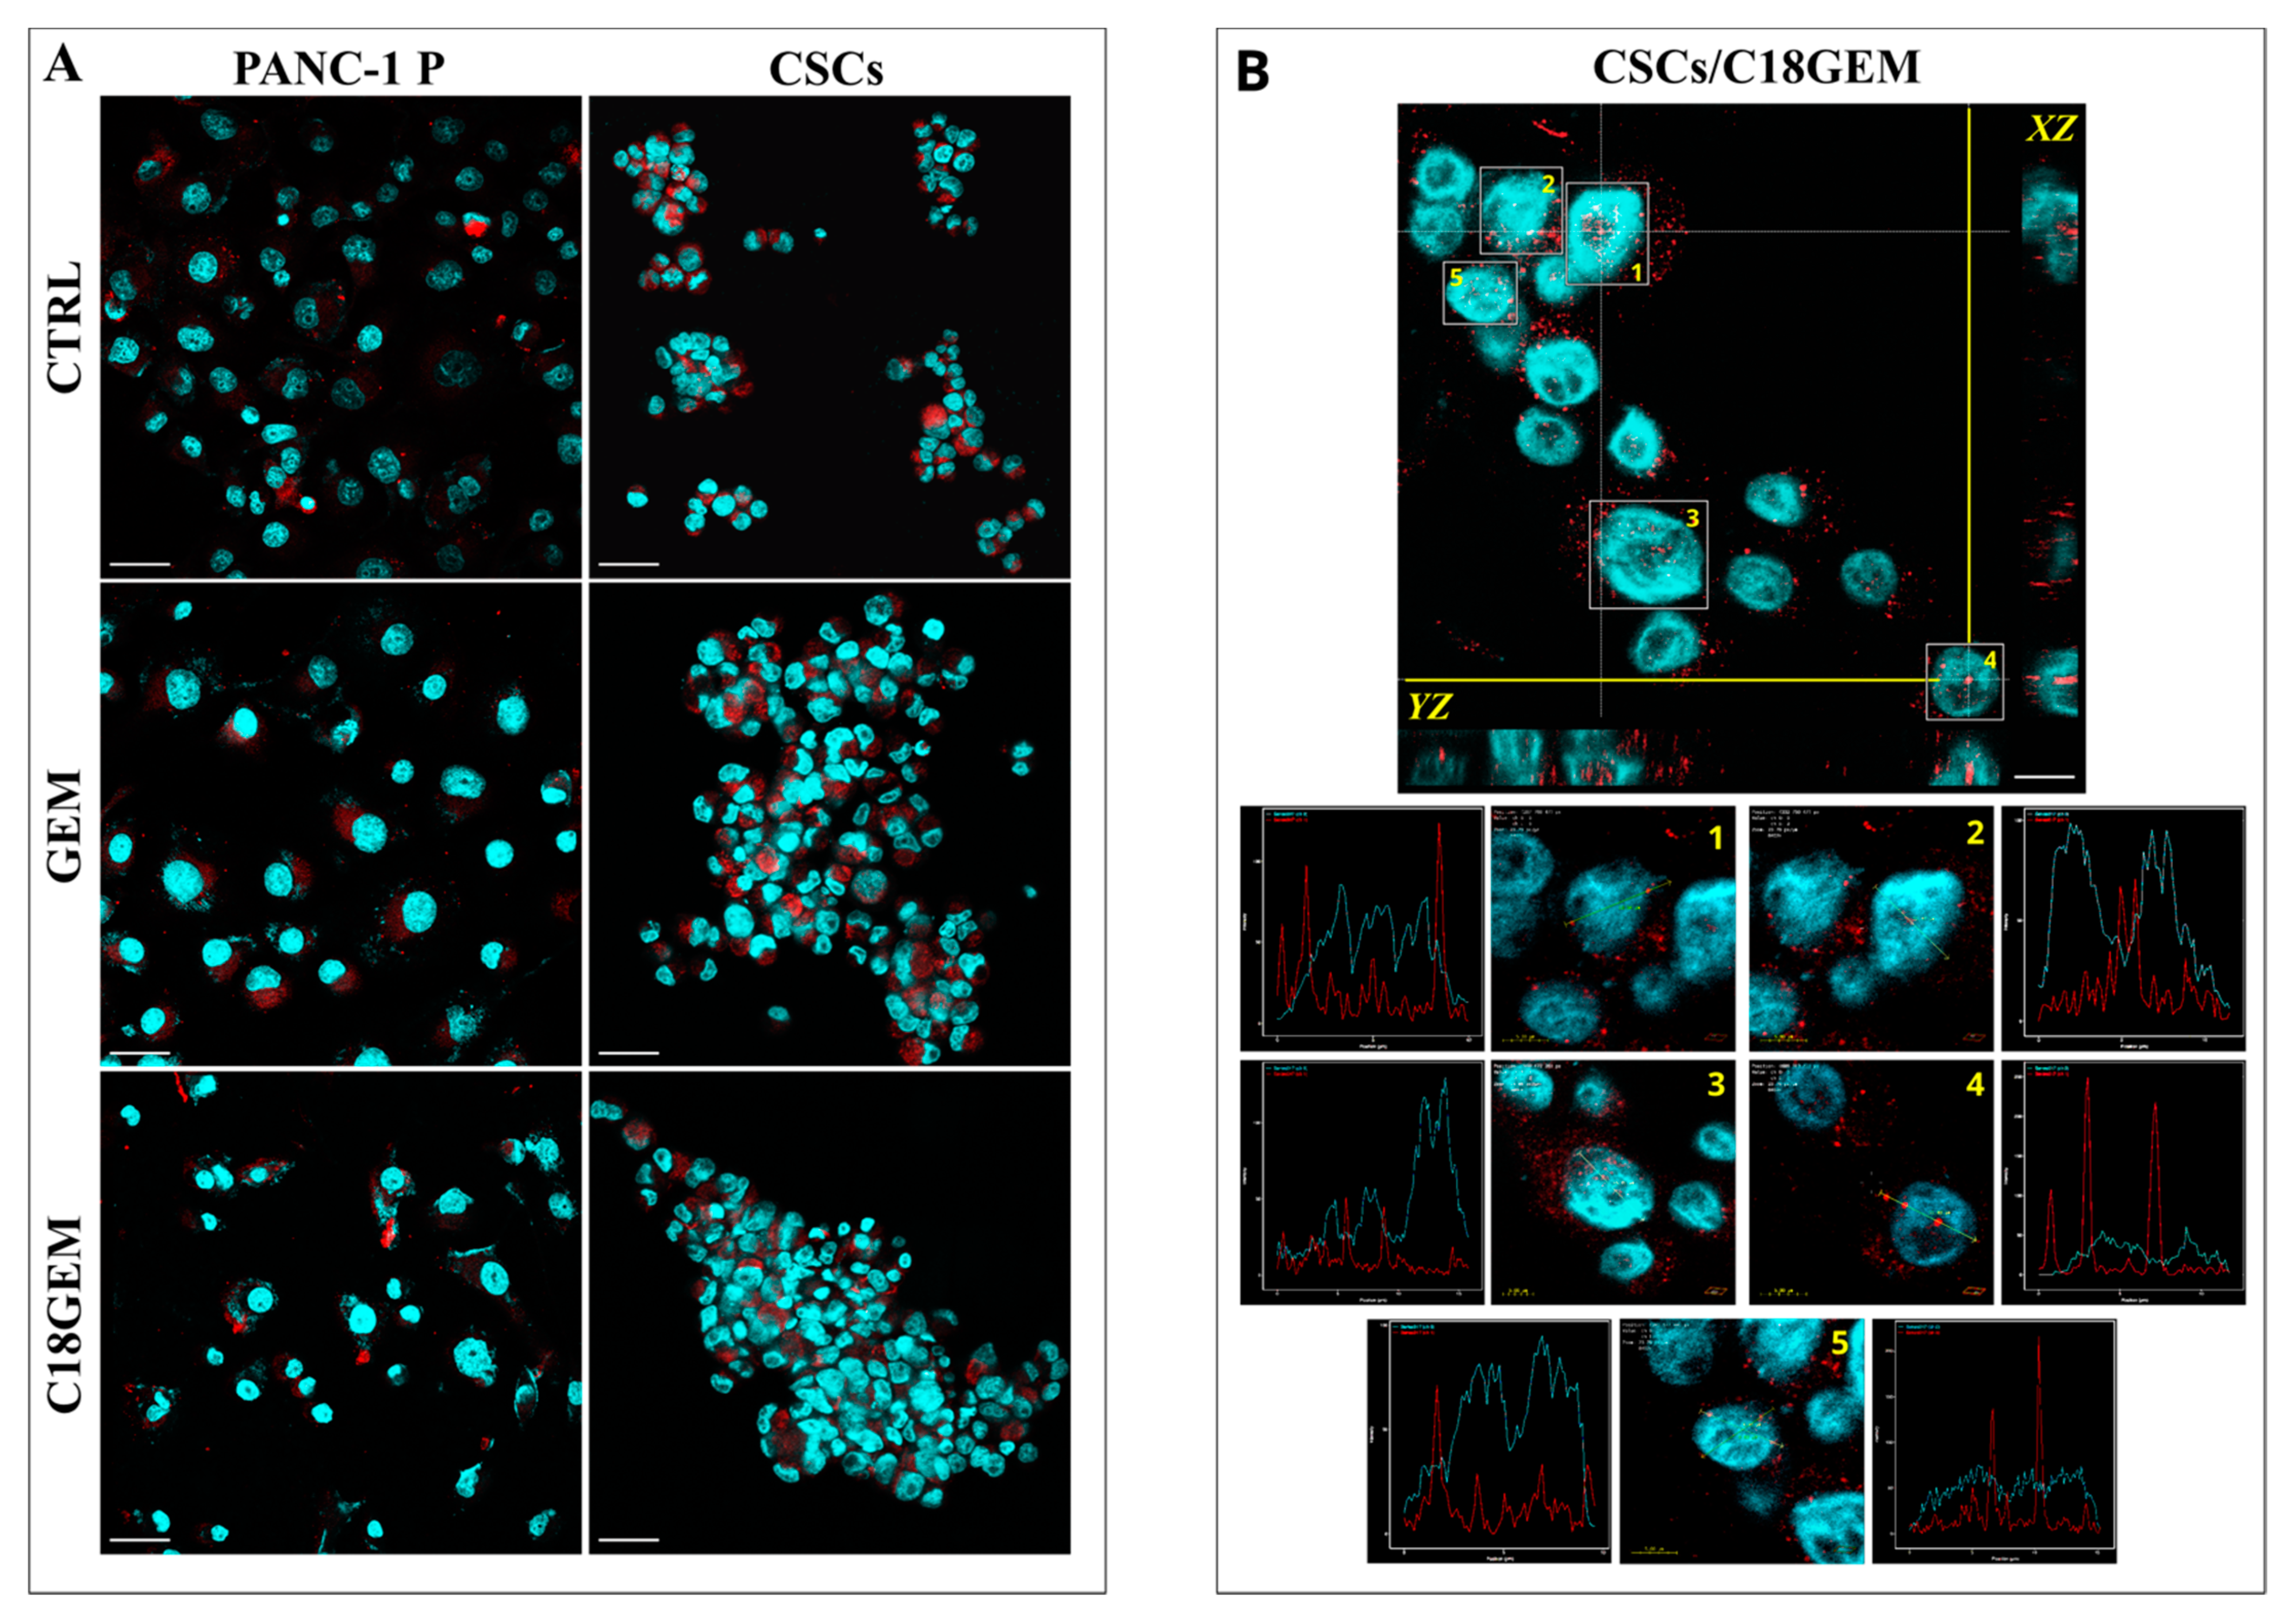
2.2. Intracellular Uptake Mechanisms of GEM and C18GEM in Panc1 P and Panc1 CSCs
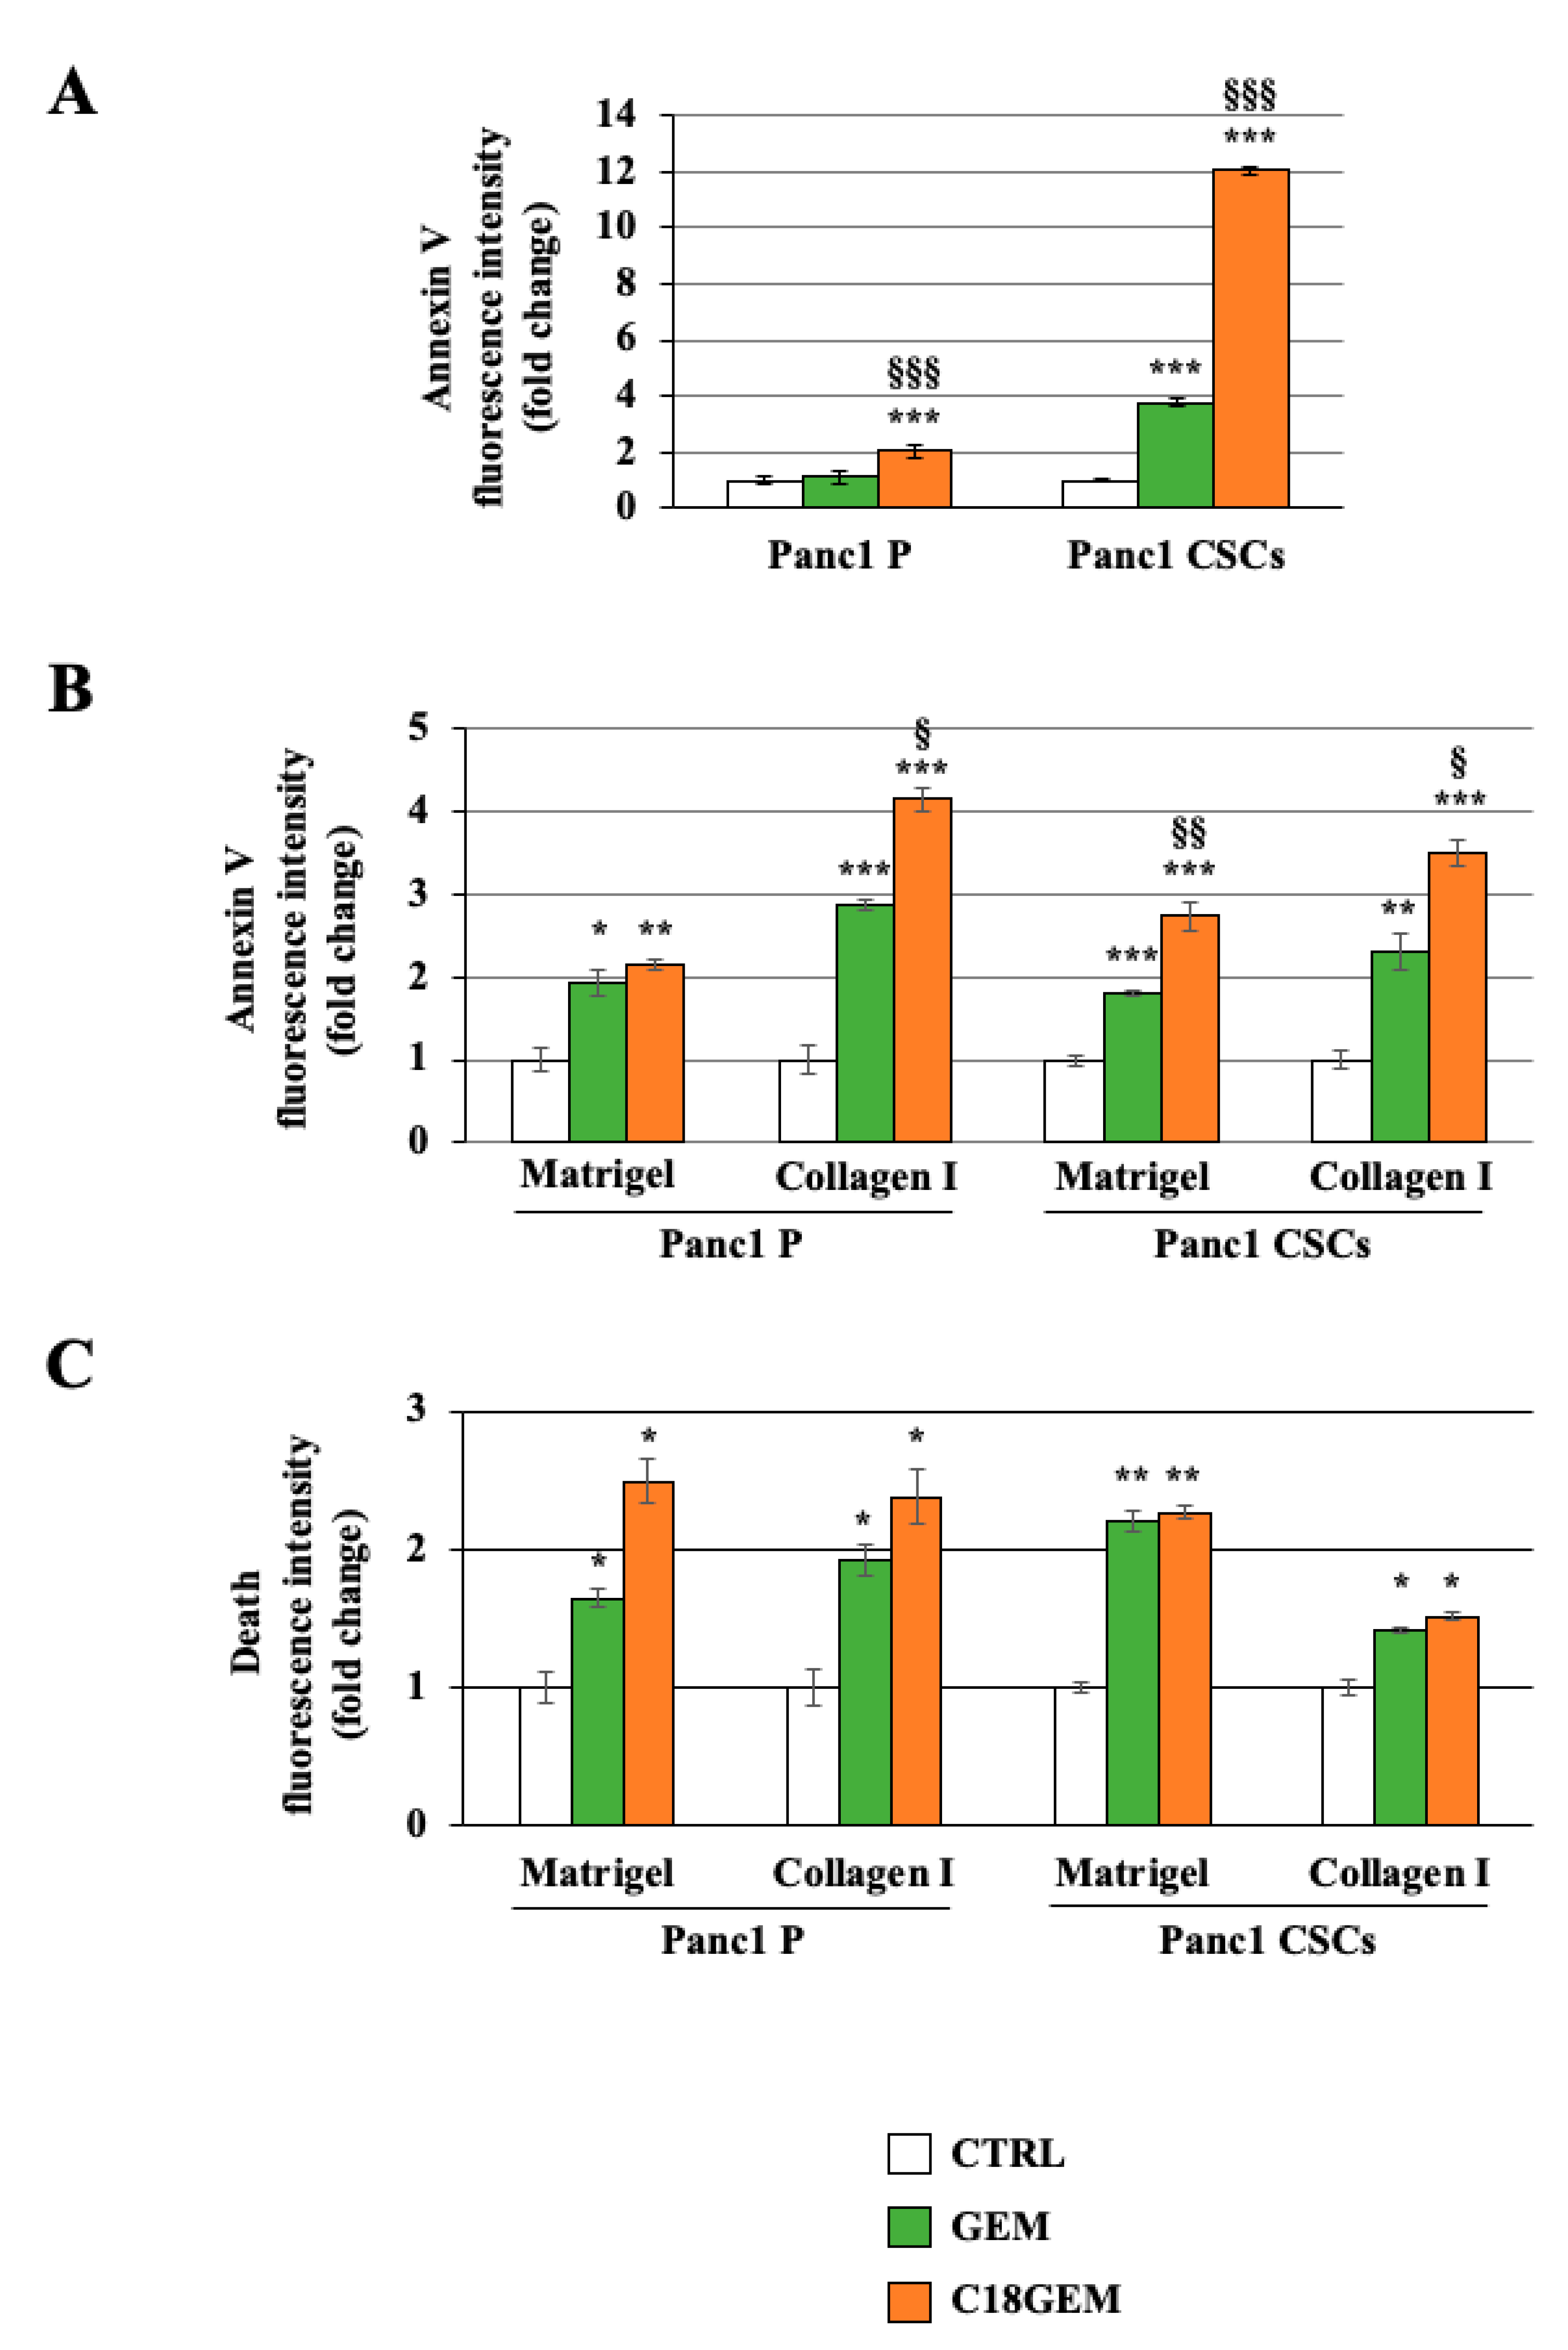
2.3. C18GEM Induces a Higher Regulated Cell Death Than GEM in Both Cell Lines Grown on 2D or 3D Cultures
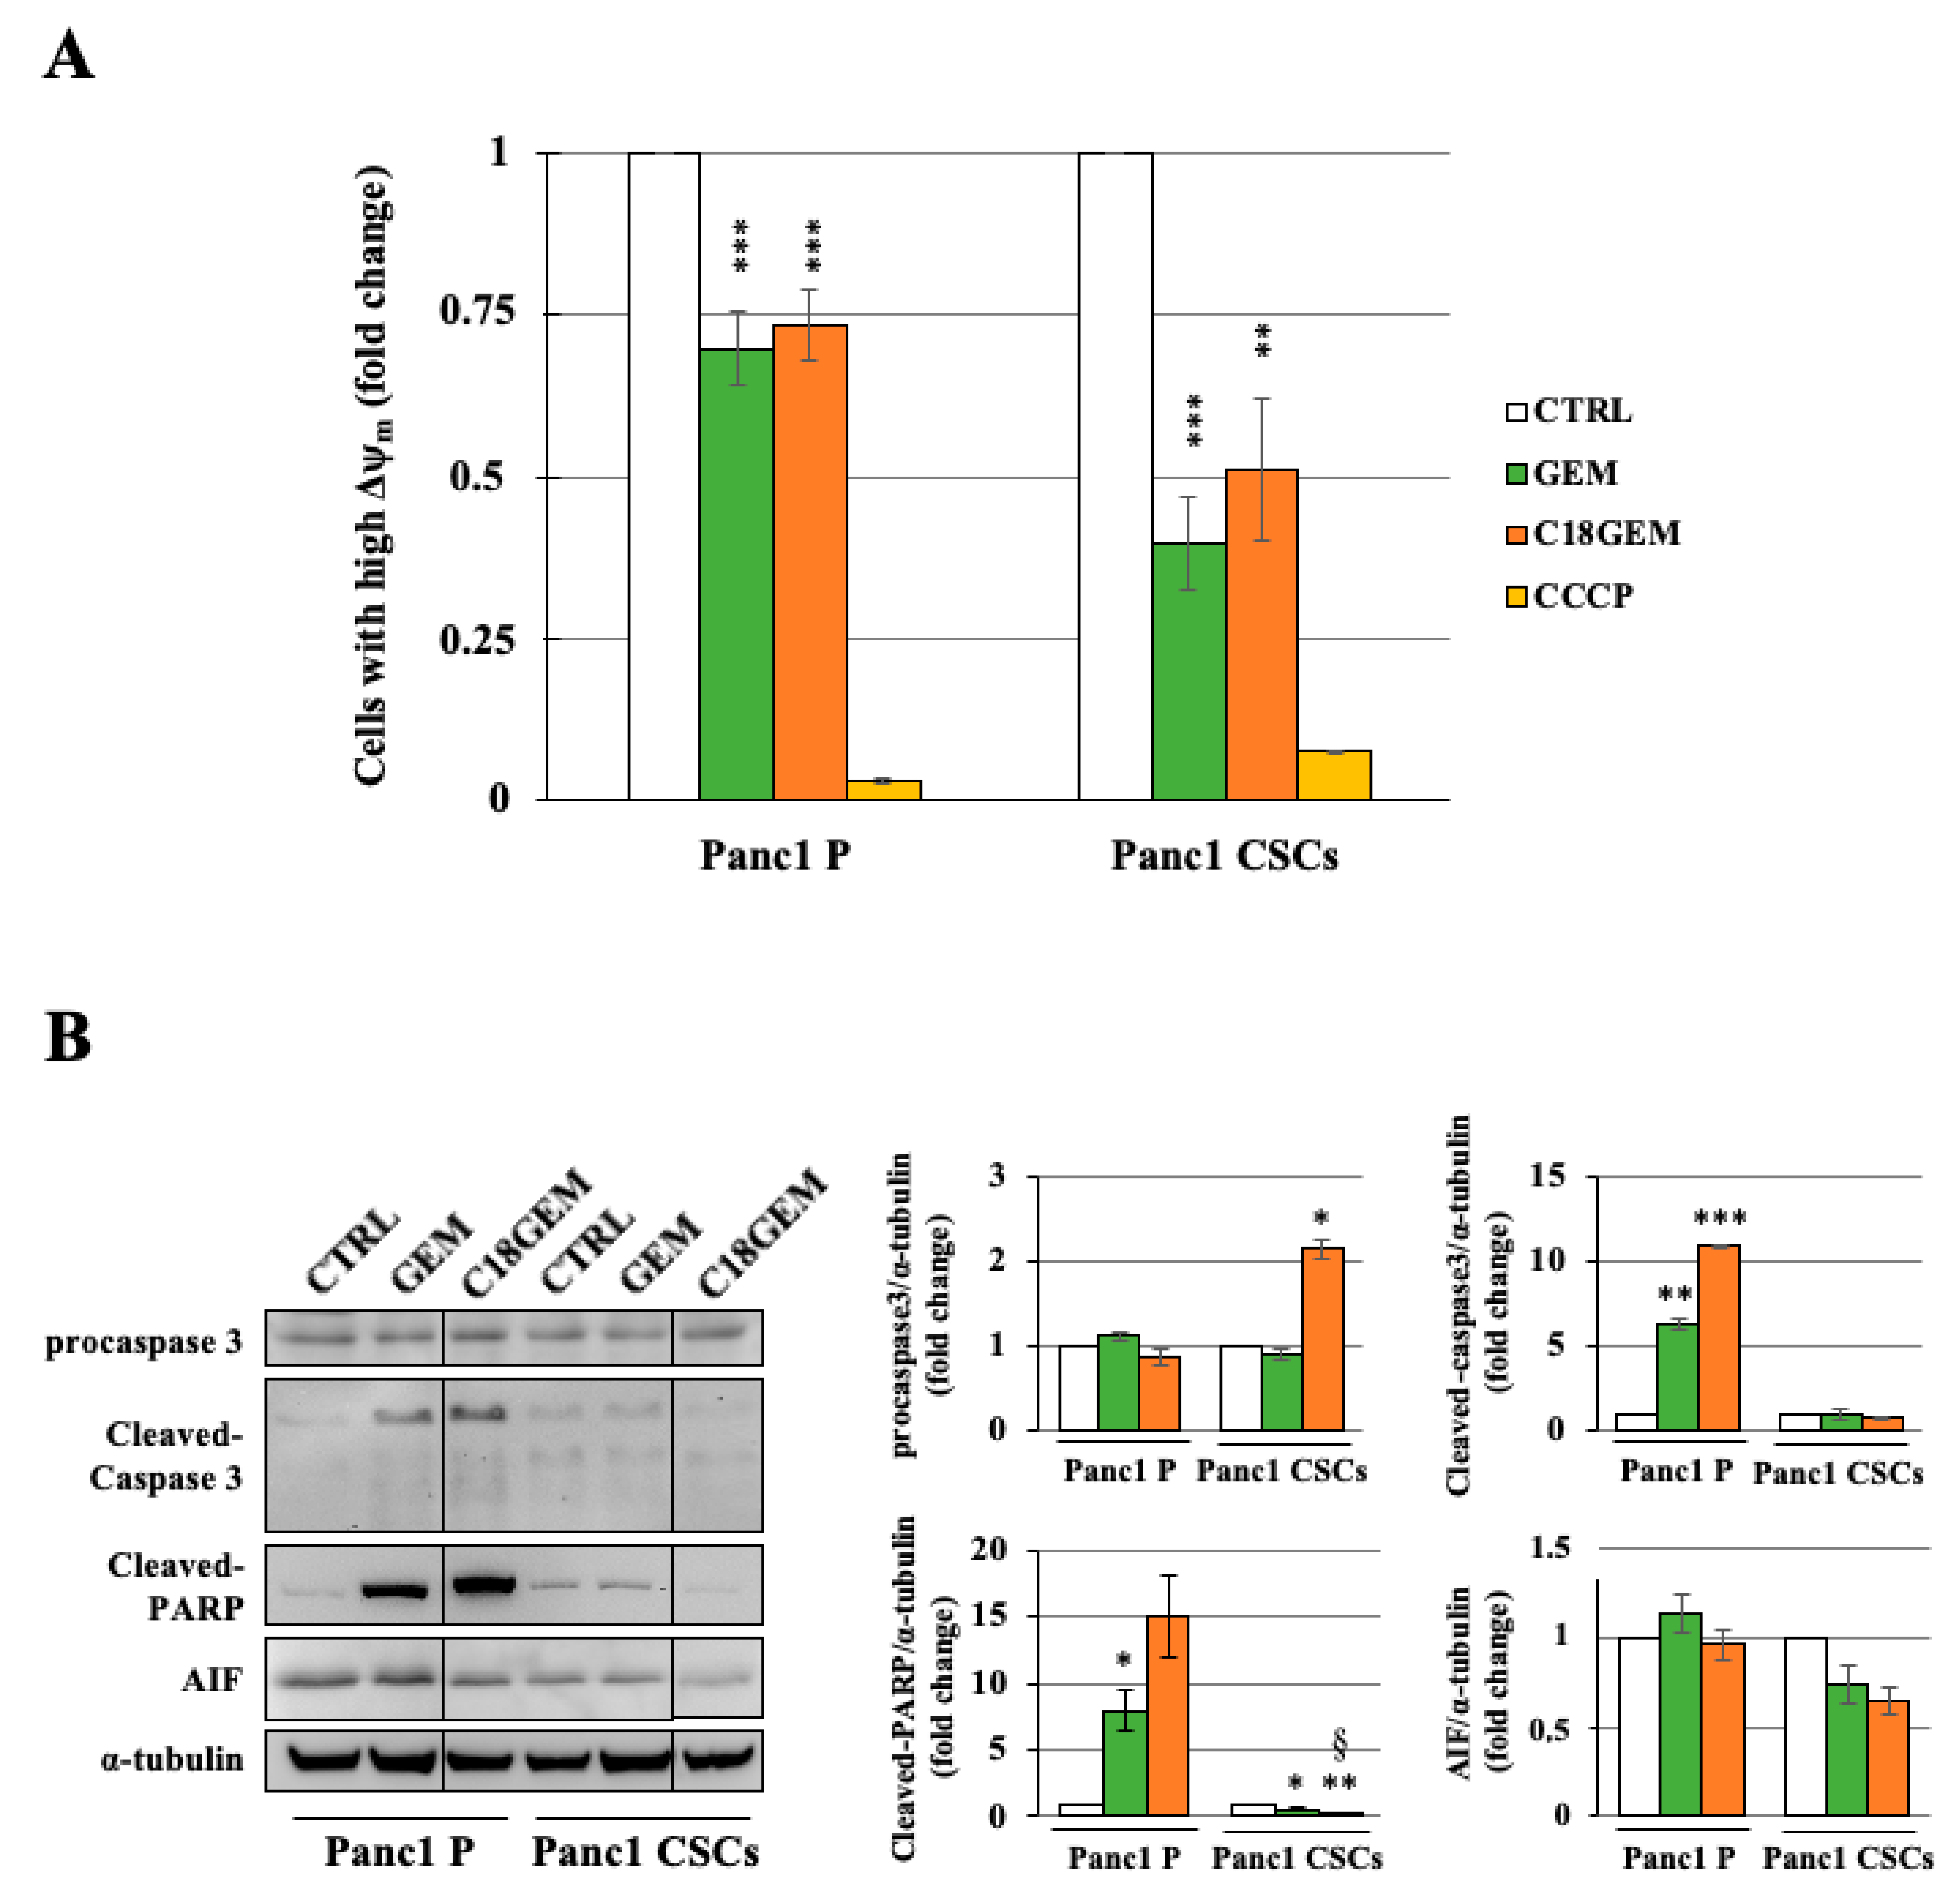
2.4. Induction of a Different Molecular Mechanism of Regulated Cell Death in Parental Cells and CSCs
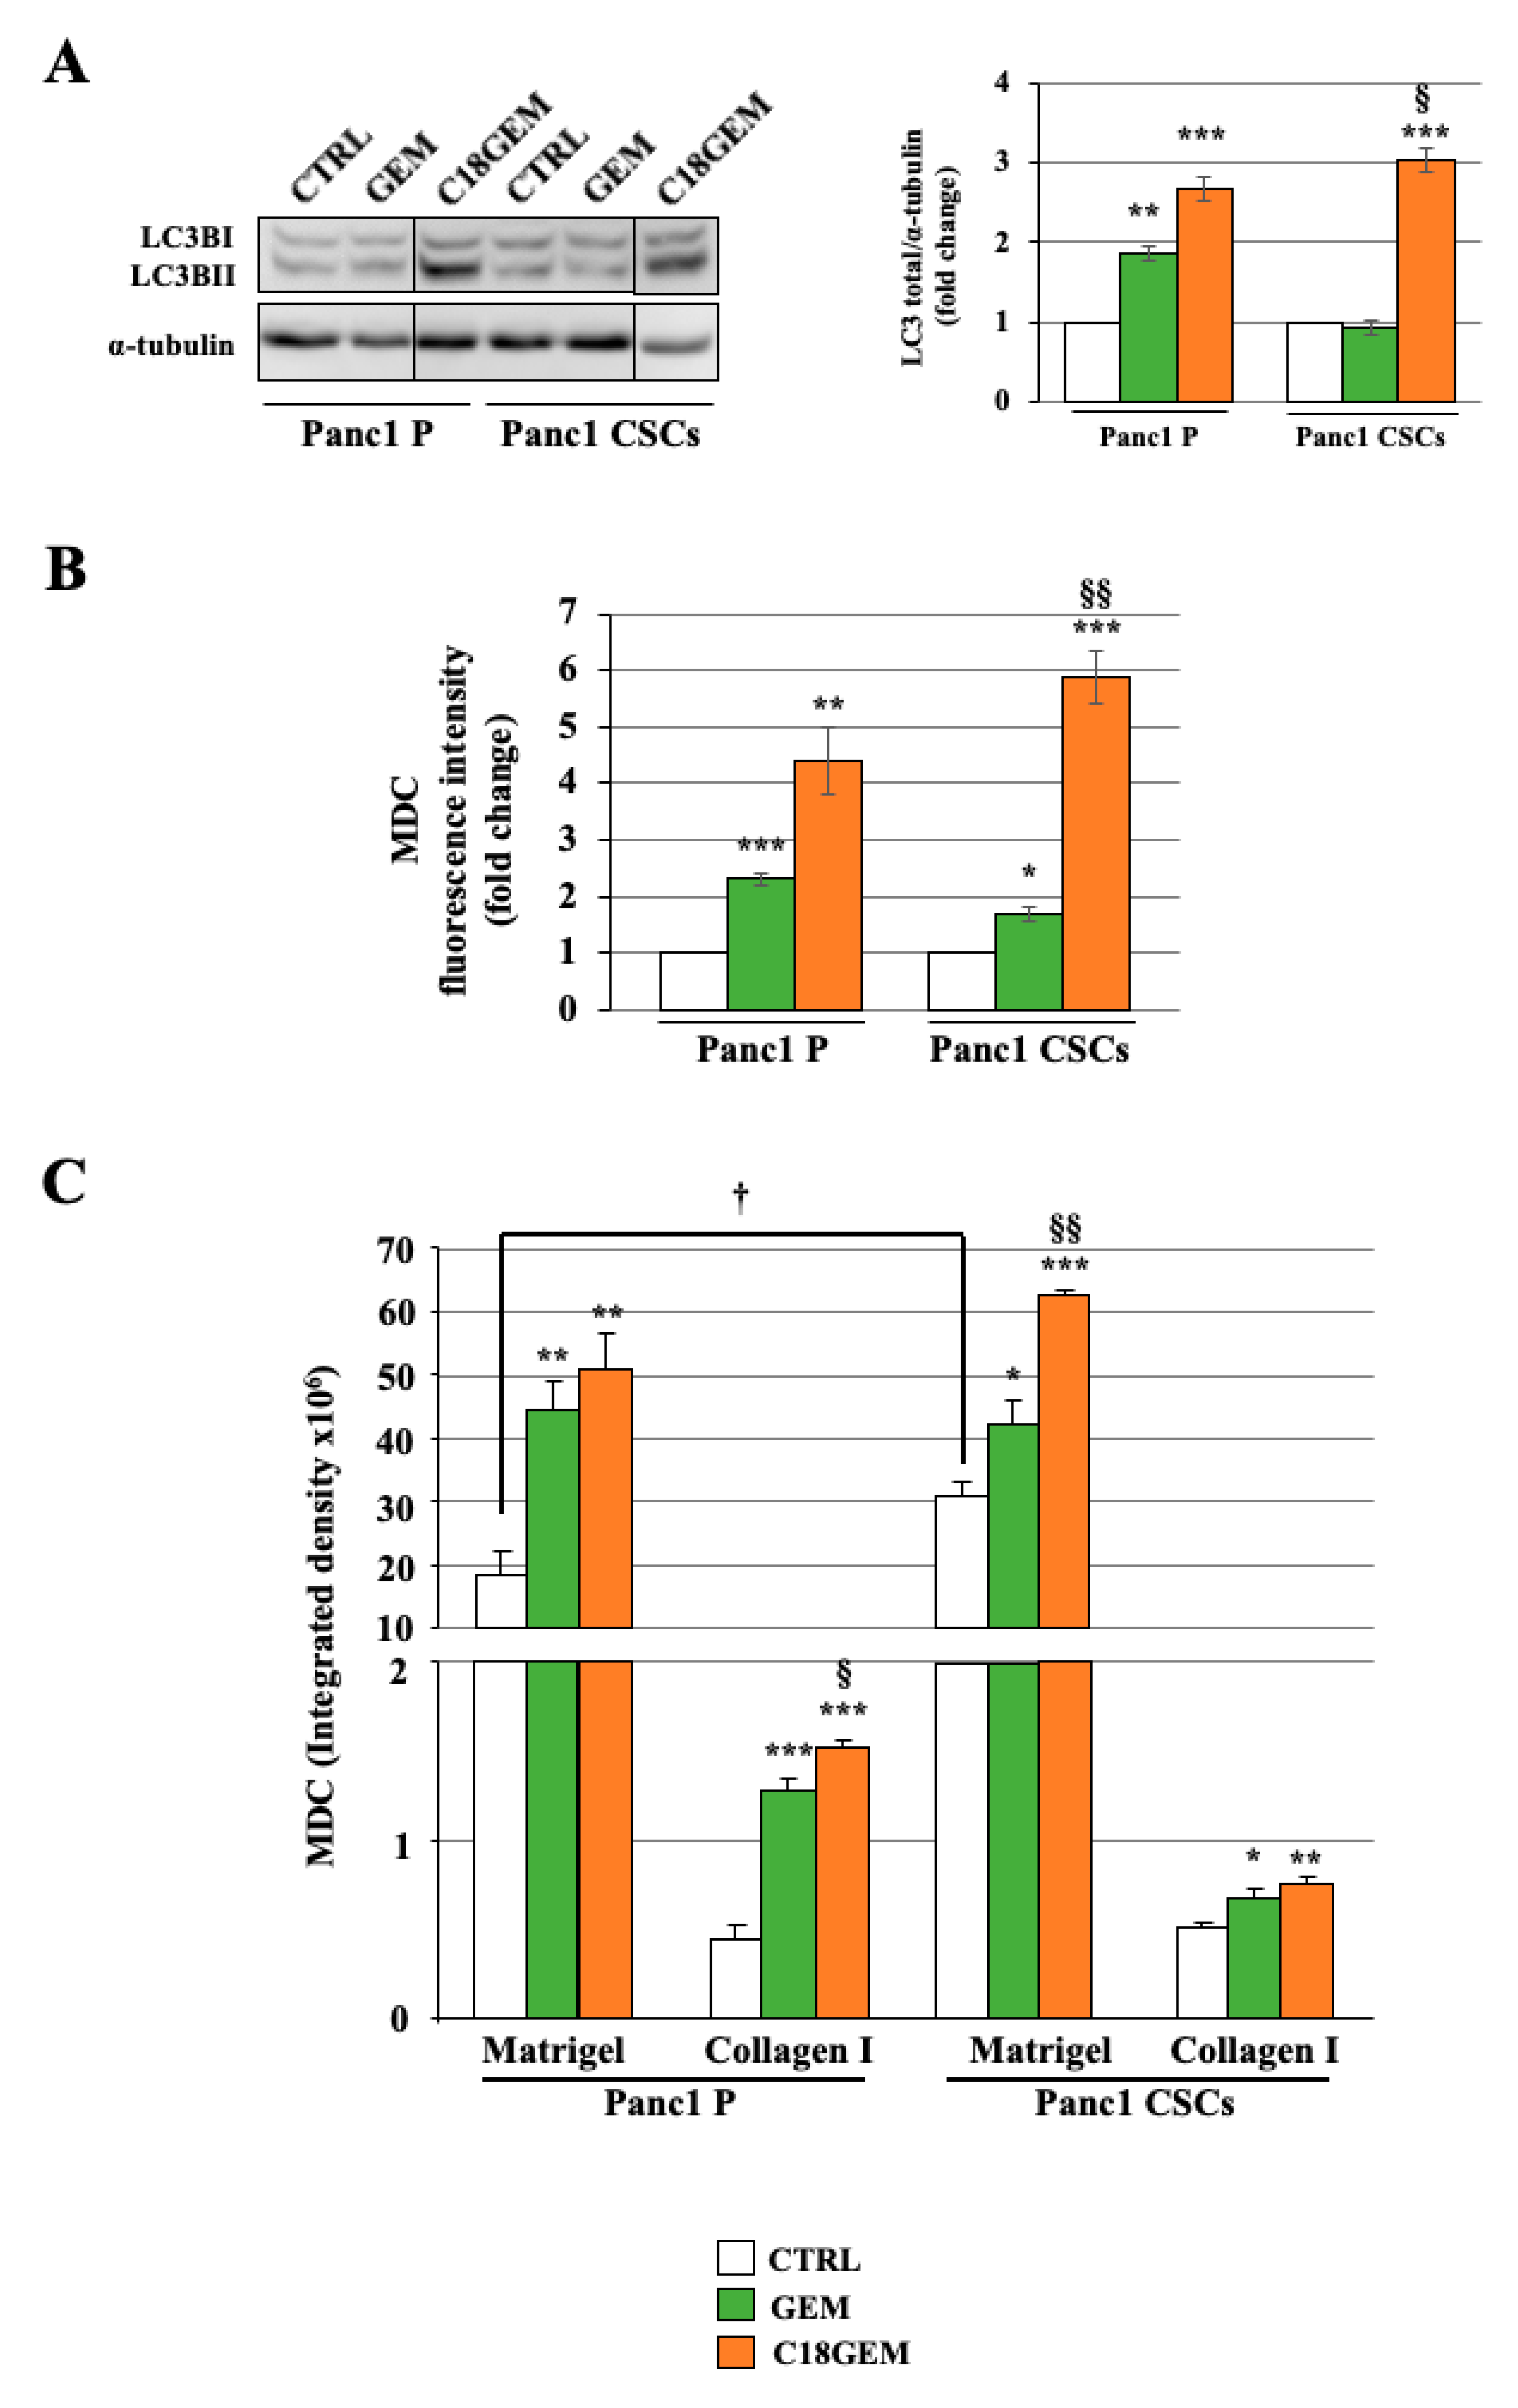
2.5. Induction of Autophagy after GEM or C18GEM Treatment in Cells Grown in 3D or 2D Cultures
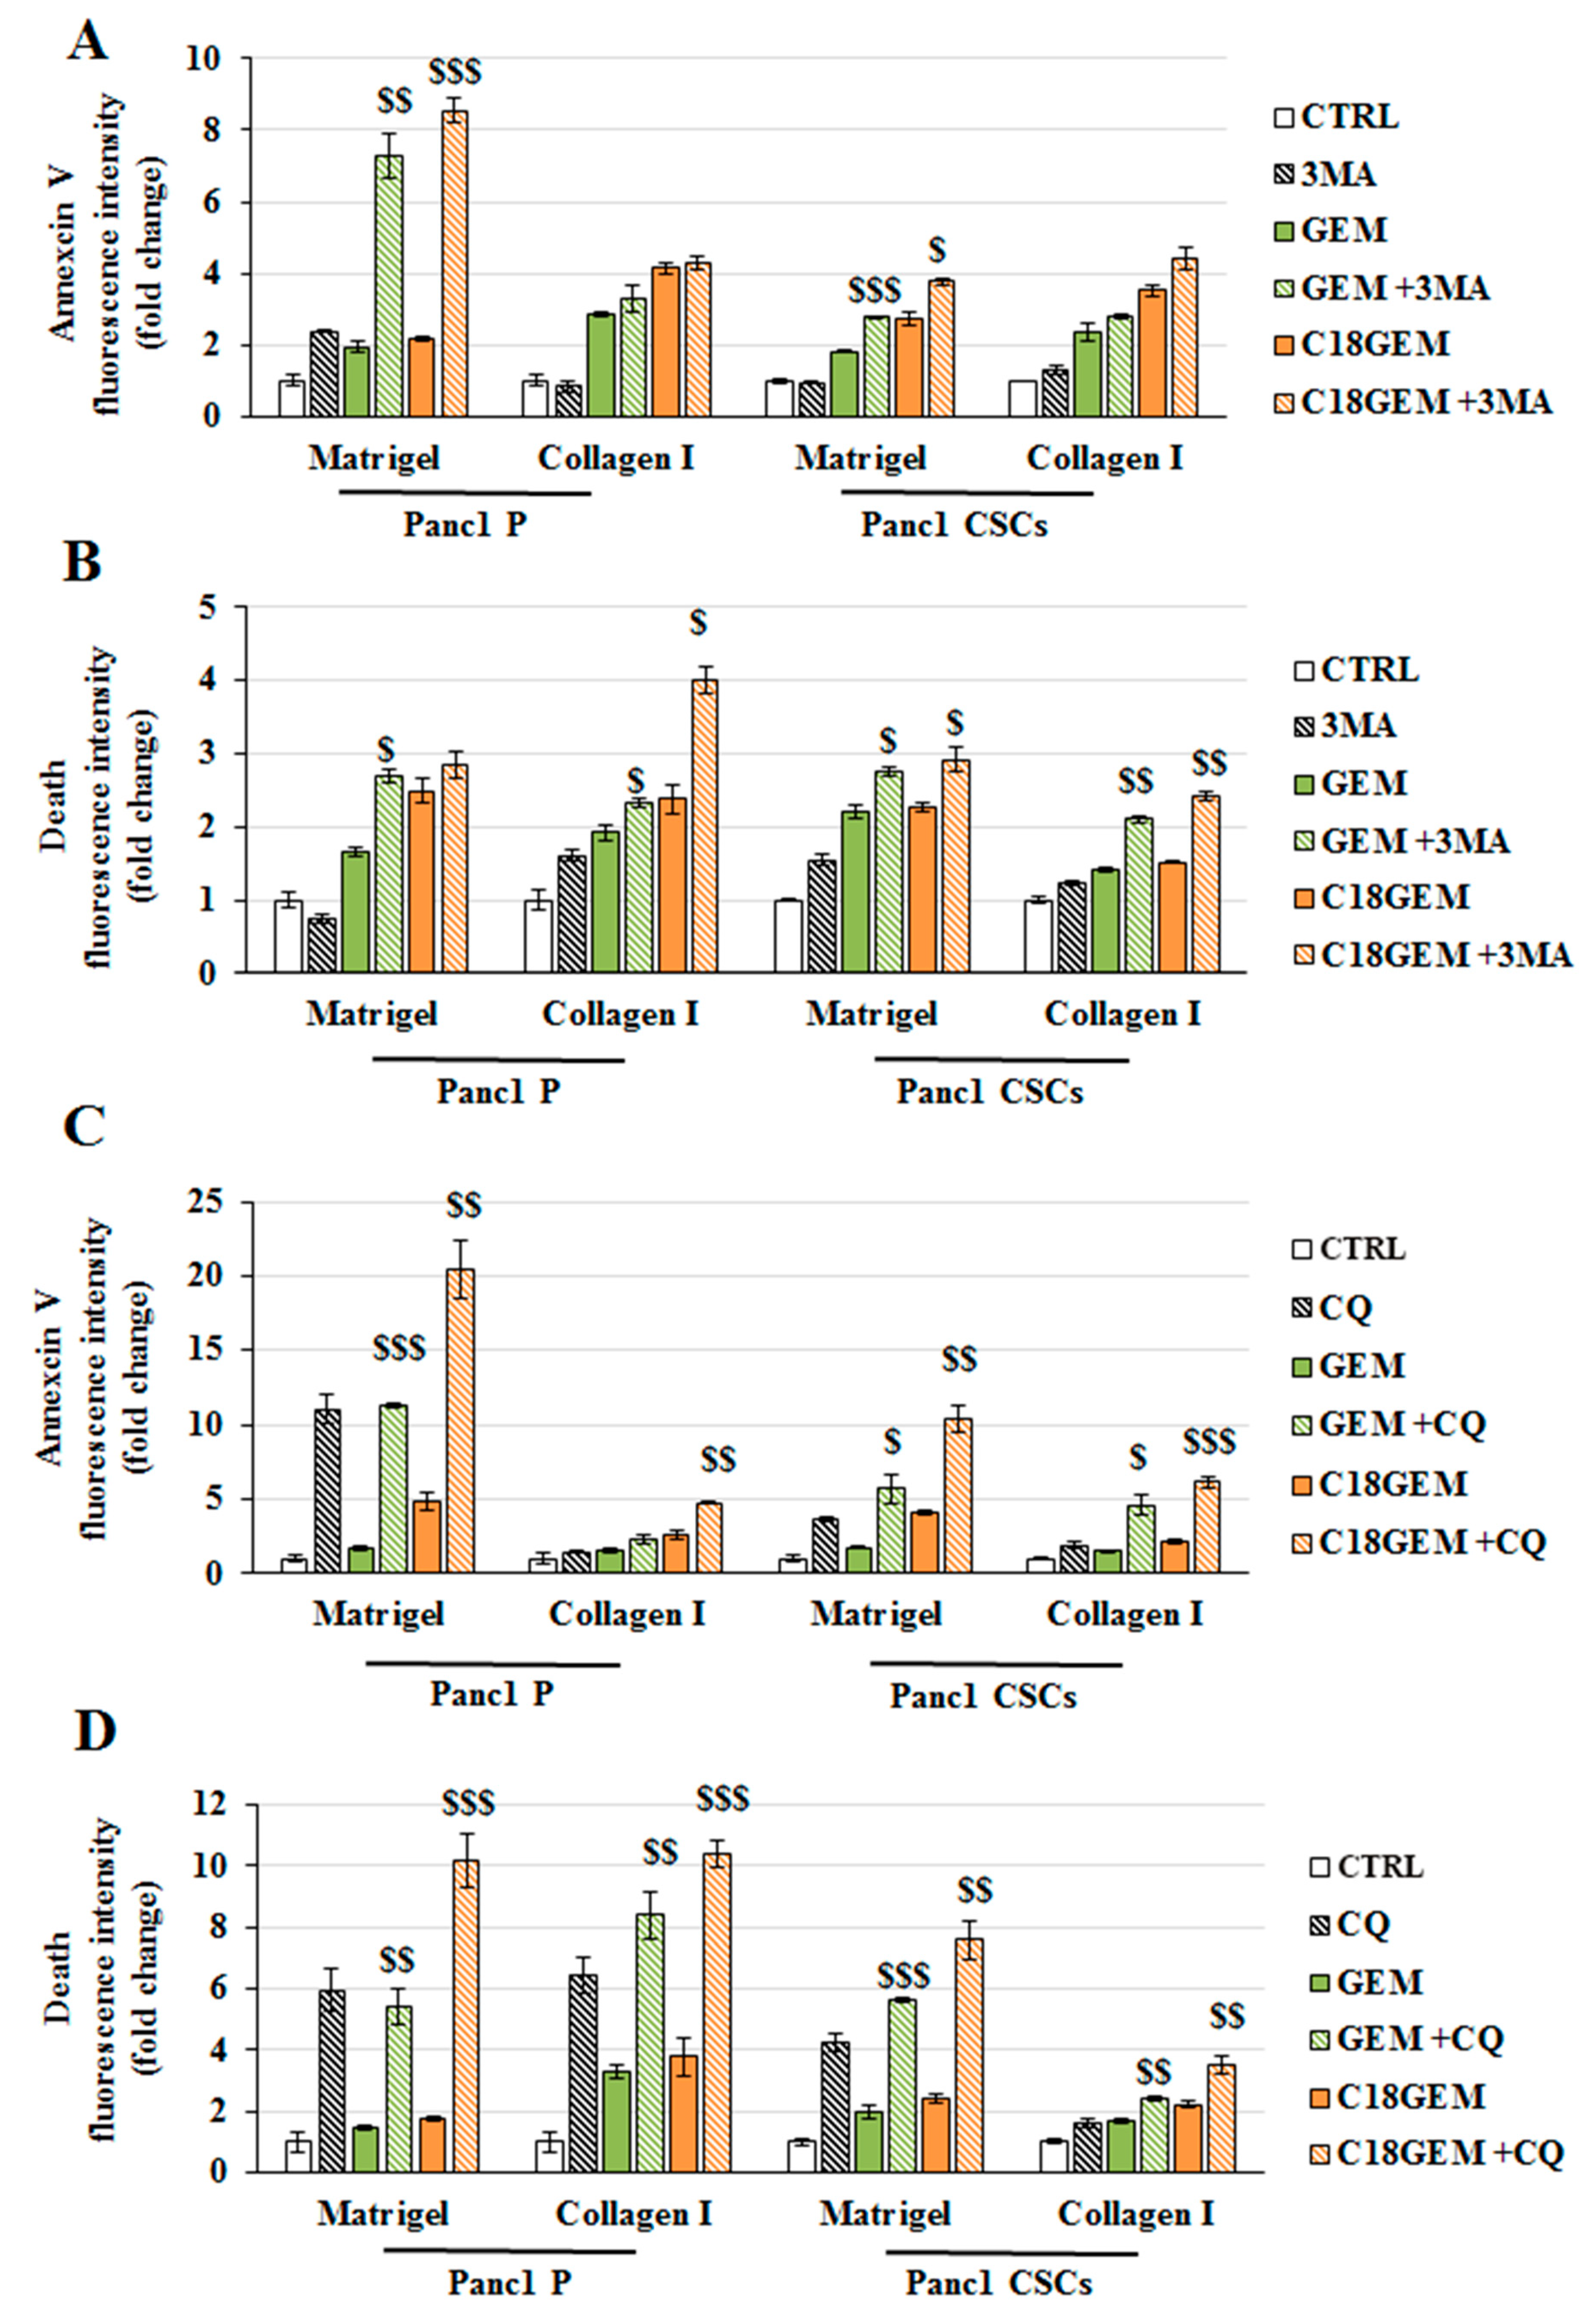
2.6. Autophagy Inhibition Sensitizes Parental Cells and CSCs Growing on Different ECM Compositions to Both GEM and C18GEM Treatments
3. Discussion
4. Materials and Methods
4.1. Cell Lines
4.2. Prodrug Synthesis and Stability
4.3. Organotypic 3D Cultures
4.4. Cell Viability Assay
4.5. Ethidium Homodimer Assay
4.6. Immunoblot Analysis
4.7. Annexin V and Apoptosis Inducing Factor (AIF) Immunofluorescence
4.8. Mitochondrial Membrane Potential Assay
4.9. Labeling of Autophagic Vacuoles with MDC
4.10. Statistical Analysis
Supplementary Materials
Author Contributions
Funding
Institutional Review Board Statement
Informed Consent Statement
Data Availability Statement
Conflicts of Interest
References
- Siegel, R.L.; Miller, K.D.; Jemal, A. Cancer statistics, 2019. CA Cancer J. Clin. 2019, 69, 7–34. [Google Scholar] [CrossRef] [PubMed] [Green Version]
- Rahib, L.; Smith, B.D.; Aizenberg, R.; Rosenzweig, A.B.; Fleshman, J.M.; Matrisian, L.M. Projecting cancer incidence and deaths to 2030: The unexpected burden of thyroid, liver, and pancreas cancers in the United States. Cancer Res. 2014, 74, 2913–2921. [Google Scholar] [CrossRef] [PubMed] [Green Version]
- Ducreux, M.; Cuhna, A.S.; Caramella, C.; Hollebecque, A.; Burtin, P.; Goere, D.; Seufferlein, T.; Haustermans, K.; Van Laethem, J.L.; Conroy, T.; et al. Cancer of the pancreas: ESMO Clinical Practice Guidelines for diagnosis, treatment and follow-up. Ann. Oncol. 2015, 26, v56–v68. [Google Scholar] [CrossRef] [PubMed]
- Gupta, R.; Amanam, I.; Chung, V. Current and future therapies for advanced pancreatic cancer. J. Surg. Oncol. 2017, 116, 25–34. [Google Scholar] [CrossRef] [PubMed]
- Gemenetzis, G.; Groot, V.P.; Blair, A.B.; Laheru, D.A.; Zheng, L.; Narang, A.K.; Fishman, E.K.; Hruban, R.H.; Yu, J.; Burkhart, R.A.; et al. Survival in locally advanced pancreatic cancer after neoadjuvant therapy and surgical resection. Ann. Surg. 2019, 270, 340–347. [Google Scholar] [CrossRef] [PubMed]
- Syed, A.R.; Carleton, N.M.; Horne, Z.; Dhawan, A.; Bedi, G.; Kochhar, G.; Morrissey, S.; Williams, H.; Atkinson, D.; Schiffman, S.; et al. Survival trends for resectable pancreatic cancer using a multidisciplinary conference: The impact of post-operative chemotherapy. J. Gastrointest. Cancer 2019. [Google Scholar] [CrossRef] [PubMed]
- Ellenrieder, V.; Konig, A.; Seufferlein, T. Current standard and future perspectives in first- and second-line treatment of metastatic pancreatic adenocarcinoma. Digestion 2016, 94, 44–49. [Google Scholar] [CrossRef]
- Koay, E.J.; Truty, M.J.; Cristini, V.; Thomas, R.M.; Chen, R.; Chatterjee, D.; Kang, Y.; Bhosale, P.R.; Tamm, E.P.; Crane, C.H.; et al. Transport properties of pancreatic cancer describe gemcitabine delivery and response. J. Clin. Investig. 2014, 124, 1525–1536. [Google Scholar] [CrossRef] [Green Version]
- Ju, H.Q.; Gocho, T.; Aguilar, M.; Wu, M.; Zhuang, Z.N.; Fu, J.; Yanaga, K.; Huang, P.; Chiao, P.J. Mechanisms of overcoming intrinsic resistance to Gemcitabine in Pancreatic Ductal Adenocarcinoma through the Redox Modulation. Mol. Cancer Ther. 2015, 14, 788–798. [Google Scholar] [CrossRef] [Green Version]
- Plunkett, W.; Huang, P.; Xu, Y.Z.; Heinemann, V.; Grunewald, R.; Gandhi, V. Gemcitabine: Metabolism, mechanisms of action, and self-potentiation. Semin. Oncol. 1995, 22, 3–10. [Google Scholar]
- Milella, M.; Gelibter, A.J.; Pino, M.S.; Bossone, G.; Marolla, P.; Sperduti, I.; Cognetti, F. Fixed-dose-rate gemcitabine: A viable first-line treatment option for advanced pancreatic and biliary tract cancer. Oncologist 2010, 15, e1–e4. [Google Scholar] [CrossRef] [PubMed] [Green Version]
- Arora, S.; Bhardwaj, A.; Singh, S.; Srivastava, S.K.; McClellan, S.; Nirodi, C.S.; Piazza, G.A.; Grizzle, W.E.; Owen, L.B.; Singh, A.P. An undesired effect of chemotherapy: Gemcitabine promotes pancreatic cancer cell invasiveness through reactive oxygen species-dependent, nuclear factor kappaB- and hypoxia-inducible factor 1alpha-mediated up-regulation of CXCR4. J. Biol. Chem. 2013, 288, 21197–21207. [Google Scholar] [CrossRef] [PubMed] [Green Version]
- Pauwels, B.; Korst, A.E.; Pattyn, G.G.; Lambrechts, H.A.; Van Bockstaele, D.R.; Vermeulen, K.; Lenjou, M.; de Pooter, C.M.; Vermorken, J.B.; Lardon, F. Cell cycle effect of gemcitabine and its role in the radiosensitizing mechanism in vitro. Int. J. Radiat. Oncol. Biol. Phys. 2003, 57, 1075–1083. [Google Scholar] [CrossRef]
- Yong-Xian, G.; Xiao-Huan, L.; Fan, Z.; Guo-Fang, T. Gemcitabine inhibits proliferation and induces apoptosis in human pancreatic cancer PANC-1 cells. J. Cancer Res. Ther. 2016, 12, 1–4. [Google Scholar] [CrossRef]
- Sebens, S.; Schafer, H. The tumor stroma as mediator of drug resistance-a potential target to improve cancer therapy? Curr. Pharm. Biotechnol. 2012, 13, 2259–2272. [Google Scholar] [CrossRef] [PubMed]
- Abet, V.; Filace, F.; Recio, J.; Alvarez-Builla, J.; Burgos, C. Prodrug approach: An overview of recent cases. Eur. J. Med. Chem. 2017, 127, 810–827. [Google Scholar] [CrossRef] [PubMed]
- Beaumont, K.; Webster, R.; Gardner, I.; Dack, K. Design of ester prodrugs to enhance oral absorption of poorly permeable compounds: Challenges to the discovery scientist. Curr. Drug. Metab. 2003, 4, 461–485. [Google Scholar] [CrossRef]
- Han, H.K.; Amidon, G.L. Targeted prodrug design to optimize drug delivery. AAPS PharmSci 2000, 2, E6. [Google Scholar] [CrossRef]
- Immordino, M.L.; Brusa, P.; Rocco, F.; Arpicco, S.; Ceruti, M.; Cattel, L. Preparation, characterization, cytotoxicity and pharmacokinetics of liposomes containing lipophilic gemcitabine prodrugs. J. Control Release 2004, 100, 331–346. [Google Scholar] [CrossRef]
- Brusa, P.; Immordino, M.L.; Rocco, F.; Cattel, L. Antitumor activity and pharmacokinetics of liposomes containing lipophilic gemcitabine prodrugs. Anticancer Res. 2007, 27, 195–199. [Google Scholar]
- Malfanti, A.; Miletto, I.; Bottinelli, E.; Zonari, D.; Blandino, G.; Berlier, G.; Arpicco, S. Delivery of Gemcitabine Prodrugs Employing Mesoporous Silica Nanoparticles. Molecules 2016, 21, 522. [Google Scholar] [CrossRef] [Green Version]
- Chu, G.C.; Kimmelman, A.C.; Hezel, A.F.; DePinho, R.A. Stromal biology of pancreatic cancer. J. Cell. Biochem. 2007, 101, 887–907. [Google Scholar] [CrossRef] [PubMed]
- Korc, M. Pancreatic cancer-associated stroma production. Am. J. Surg. 2007, 194, S84–S86. [Google Scholar] [CrossRef] [PubMed] [Green Version]
- Mueller, M.M.; Fusenig, N.E. Friends or foes-bipolar effects of the tumour stroma in cancer. Nat. Rev. Cancer 2004, 4, 839–849. [Google Scholar] [CrossRef] [PubMed]
- Thomas, D.; Radhakrishnan, P. Tumor-stromal crosstalk in pancreatic cancer and tissue fibrosis. Mol. Cancer 2019, 18, 14. [Google Scholar] [CrossRef] [PubMed]
- Liang, C.; Shi, S.; Meng, Q.; Liang, D.; Ji, S.; Zhang, B.; Qin, Y.; Xu, J.; Ni, Q.; Yu, X. Complex roles of the stroma in the intrinsic resistance to gemcitabine in pancreatic cancer: Where we are and where we are going. Exp. Mol. Med. 2017, 49, e406. [Google Scholar] [CrossRef] [Green Version]
- Plaks, V.; Kong, N.; Werb, Z. The cancer stem cell niche: How essential is the niche in regulating stemness of tumor cells? Cell Stem Cell 2015, 16, 225–238. [Google Scholar] [CrossRef] [Green Version]
- Ye, J.; Wu, D.; Wu, P.; Chen, Z.; Huang, J. The cancer stem cell niche: Cross talk between cancer stem cells and their microenvironment. Tumour Biol. 2014, 35, 3945–3951. [Google Scholar] [CrossRef]
- Hermann, P.C.; Bhaskar, S.; Cioffi, M.; Heeschen, C. Cancer stem cells in solid tumors. Semin. Cancer Biol. 2010, 20, 77–84. [Google Scholar] [CrossRef]
- Hermann, P.C.; Huber, S.L.; Herrler, T.; Aicher, A.; Ellwart, J.W.; Guba, M.; Bruns, C.J.; Heeschen, C. Distinct populations of cancer stem cells determine tumor growth and metastatic activity in human pancreatic cancer. Cell Stem Cell 2007, 1, 313–323. [Google Scholar] [CrossRef] [Green Version]
- Kure, S.; Matsuda, Y.; Hagio, M.; Ueda, J.; Naito, Z.; Ishiwata, T. Expression of cancer stem cell markers in pancreatic intraepithelial neoplasias and pancreatic ductal adenocarcinomas. Int. J. Oncol. 2012, 41, 1314–1324. [Google Scholar] [CrossRef] [PubMed]
- Ricci-Vitiani, L.; Lombardi, D.G.; Pilozzi, E.; Biffoni, M.; Todaro, M.; Peschle, C.; De Maria, R. Identification and expansion of human colon-cancer-initiating cells. Nature 2007, 445, 111–115. [Google Scholar] [CrossRef] [PubMed]
- Singh, S.K.; Hawkins, C.; Clarke, I.D.; Squire, J.A.; Bayani, J.; Hide, T.; Henkelman, R.M.; Cusimano, M.D.; Dirks, P.B. Identification of human brain tumour initiating cells. Nature 2004, 432, 396–401. [Google Scholar] [CrossRef] [PubMed]
- Dawood, S.; Austin, L.; Cristofanilli, M. Cancer stem cells: Implications for cancer therapy. Oncology (Williston Park) 2014, 28, 1101–1107, 1110. [Google Scholar] [PubMed]
- Sun, H.R.; Wang, S.; Yan, S.C.; Zhang, Y.; Nelson, P.J.; Jia, H.L.; Qin, L.X.; Dong, Q.Z. Therapeutic strategies targeting cancer stem cells and their microenvironment. Front. Oncol. 2019, 9, 1104. [Google Scholar] [CrossRef] [PubMed]
- Biondani, G.; Zeeberg, K.; Greco, M.R.; Cannone, S.; Dando, I.; Dalla Pozza, E.; Mastrodonato, M.; Forciniti, S.; Casavola, V.; Palmieri, M.; et al. Extracellular matrix composition modulates PDAC parenchymal and stem cell plasticity and behavior through the secretome. FEBS J. 2018, 285, 2104–2124. [Google Scholar] [CrossRef] [Green Version]
- Puls, T.J.; Tan, X.; Whittington, C.F.; Voytik-Harbin, S.L. 3D collagen fibrillar microstructure guides pancreatic cancer cell phenotype and serves as a critical design parameter for phenotypic models of EMT. PLoS ONE 2017, 12, e0188870. [Google Scholar] [CrossRef] [Green Version]
- Johnson, Z.L.; Lee, J.H.; Lee, K.; Lee, M.; Kwon, D.Y.; Hong, J.; Lee, S.Y. Structural basis of nucleoside and nucleoside drug selectivity by concentrative nucleoside transporters. Elife 2014, 3, e03604. [Google Scholar] [CrossRef]
- Golan, T.; Javle, M. DNA Repair Dysfunction in pancreatic cancer: A clinically relevant subtype for drug development. J. Natl. Compr. Cancer Netw. 2017, 15, 1063–1069. [Google Scholar] [CrossRef]
- Dando, I.; Donadelli, M.; Costanzo, C.; Dalla Pozza, E.; D’Alessandro, A.; Zolla, L.; Palmieri, M. Cannabinoids inhibit energetic metabolism and induce AMPK-dependent autophagy in pancreatic cancer cells. Cell. Death Dis. 2013, 4, e664. [Google Scholar] [CrossRef] [Green Version]
- Fiorini, C.; Menegazzi, M.; Padroni, C.; Dando, I.; Dalla Pozza, E.; Gregorelli, A.; Costanzo, C.; Palmieri, M.; Donadelli, M. Autophagy induced by p53-reactivating molecules protects pancreatic cancer cells from apoptosis. Apoptosis 2013, 18, 337–346. [Google Scholar] [CrossRef] [PubMed]
- Spratlin, J.; Sangha, R.; Glubrecht, D.; Dabbagh, L.; Young, J.D.; Dumontet, C.; Cass, C.; Lai, R.; Mackey, J.R. The absence of human equilibrative nucleoside transporter 1 is associated with reduced survival in patients with gemcitabine-treated pancreas adenocarcinoma. Clin. Cancer Res. 2004, 10, 6956–6961. [Google Scholar] [CrossRef] [PubMed] [Green Version]
- Nergiz-Unal, R.; Rademakers, T.; Cosemans, J.M.; Heemskerk, J.W. CD36 as a multiple-ligand signaling receptor in atherothrombosis. Cardiovasc. Hematol. Agents Med. Chem. 2011, 9, 42–55. [Google Scholar] [CrossRef] [PubMed]
- Shlomovitz, I.; Speir, M.; Gerlic, M. Flipping the dogma-phosphatidylserine in non-apoptotic cell death. Cell Commun. Signal 2019, 17, 139. [Google Scholar] [CrossRef] [Green Version]
- Wang, Y.; Dawson, V.L.; Dawson, T.M. Poly(ADP-ribose) signals to mitochondrial AIF: A key event in parthanatos. Exp. Neurol. 2009, 218, 193–202. [Google Scholar] [CrossRef] [Green Version]
- Hessmann, E.; Buchholz, S.M.; Demir, I.E.; Singh, S.K.; Gress, T.M.; Ellenrieder, V.; Neesse, A. Microenvironmental Determinants of Pancreatic Cancer. Physiol. Rev. 2020. [Google Scholar] [CrossRef]
- Ligorio, M.; Sil, S.; Malagon-Lopez, J.; Nieman, L.T.; Misale, S.; Di Pilato, M.; Ebright, R.Y.; Karabacak, M.N.; Kulkarni, A.S.; Liu, A.; et al. Stromal Microenvironment Shapes the Intratumoral Architecture of Pancreatic Cancer. Cell 2019, 178, 160–175 e127. [Google Scholar] [CrossRef]
- Willumsen, N.; Ali, S.M.; Leitzel, K.; Drabick, J.J.; Yee, N.; Polimera, H.V.; Nagabhairu, V.; Krecko, L.; Ali, A.; Maddukuri, A.; et al. Collagen fragments quantified in serum as measures of desmoplasia associate with survival outcome in patients with advanced pancreatic cancer. Sci. Rep. 2019, 9, 19761. [Google Scholar] [CrossRef]
- Visvader, J.E.; Lindeman, G.J. Cancer stem cells in solid tumours: Accumulating evidence and unresolved questions. Nat. Rev. Cancer 2008, 8, 755–768. [Google Scholar] [CrossRef]
- Ayob, A.Z.; Ramasamy, T.S. Cancer stem cells as key drivers of tumour progression. J. Biomed. Sci. 2018, 25, 20. [Google Scholar] [CrossRef]
- Domenichini, A.; Edmands, J.S.; Adamska, A.; Begicevic, R.R.; Paternoster, S.; Falasca, M. Pancreatic cancer tumorspheres are cancer stem-like cells with increased chemoresistance and reduced metabolic potential. Adv. Biol. Regul. 2019, 72, 63–77. [Google Scholar] [CrossRef]
- Mueller, M.T.; Hermann, P.C.; Witthauer, J.; Rubio-Viqueira, B.; Leicht, S.F.; Huber, S.; Ellwart, J.W.; Mustafa, M.; Bartenstein, P.; D’Haese, J.G.; et al. Combined targeted treatment to eliminate tumorigenic cancer stem cells in human pancreatic cancer. Gastroenterology 2009, 137, 1102–1113. [Google Scholar] [CrossRef]
- Smigiel, J.M.; Parameswaran, N.; Jackson, M.W. Targeting pancreatic cancer cell plasticity: The latest in therapeutics. Cancers 2018, 10, 14. [Google Scholar] [CrossRef] [PubMed] [Green Version]
- Rai, B.; Lin, J.L.; Lim, Z.X.; Guldberg, R.E.; Hutmacher, D.W.; Cool, S.M. Differences between in vitro viability and differentiation and in vivo bone-forming efficacy of human mesenchymal stem cells cultured on PCL-TCP scaffolds. Biomaterials 2010, 31, 7960–7970. [Google Scholar] [CrossRef] [PubMed]
- Candini, O.; Grisendi, G.; Foppiani, E.M.; Brogli, M.; Aramini, B.; Masciale, V.; Spano, C.; Petrachi, T.; Veronesi, E.; Conte, P.; et al. Author correction: A novel 3D in vitro platform for pre-clinical investigations in drug testing, gene therapy, and immuno-oncology. Sci. Rep. 2020, 10, 1845. [Google Scholar] [CrossRef] [PubMed] [Green Version]
- Nunes, A.S.; Barros, A.S.; Costa, E.C.; Moreira, A.F.; Correia, I.J. 3D tumor spheroids as in vitro models to mimic in vivo human solid tumors resistance to therapeutic drugs. Biotechnol. Bioeng. 2019, 116, 206–226. [Google Scholar] [CrossRef] [Green Version]
- Bouffard, D.Y.; Laliberte, J.; Momparler, R.L. Kinetic studies on 2’,2’-difluorodeoxycytidine (Gemcitabine) with purified human deoxycytidine kinase and cytidine deaminase. Biochem. Pharmacol. 1993, 45, 1857–1861. [Google Scholar] [CrossRef]
- Chen, Z.; Zheng, Y.; Shi, Y.; Cui, Z. Overcoming tumor cell chemoresistance using nanoparticles: Lysosomes are beneficial for (stearoyl) gemcitabine-incorporated solid lipid nanoparticles. Int. J. Nanomed. 2018, 13, 319–336. [Google Scholar] [CrossRef] [Green Version]
- Arlt, A.; Muerkoster, S.S.; Schafer, H. Targeting apoptosis pathways in pancreatic cancer. Cancer Lett. 2013, 332, 346–358. [Google Scholar] [CrossRef]
- Galluzzi, L.; Vitale, I.; Aaronson, S.A.; Abrams, J.M.; Adam, D.; Agostinis, P.; Alnemri, E.S.; Altucci, L.; Amelio, I.; Andrews, D.W.; et al. Molecular mechanisms of cell death: Recommendations of the Nomenclature Committee on Cell Death 2018. Cell Death Differ. 2018, 25, 486–541. [Google Scholar] [CrossRef]
- Weaver, A.N.; Yang, E.S. Beyond DNA repair: Additional functions of PARP-1 in cancer. Front. Oncol. 2013, 3, 290. [Google Scholar] [CrossRef] [PubMed] [Green Version]
- Ambrosini, G.; Dalla Pozza, E.; Fanelli, G.; Di Carlo, C.; Vettori, A.; Cannino, G.; Cavallini, C.; Carmona-Carmona, C.A.; Brandi, J.; Rinalducci, S.; et al. Progressively De-Differentiated Pancreatic Cancer Cells Shift from Glycolysis to Oxidative Metabolism and Gain a Quiescent Stem State. Cells 2020, 9, 1572. [Google Scholar] [CrossRef] [PubMed]
- Delavallee, L.; Mathiah, N.; Cabon, L.; Mazeraud, A.; Brunelle-Navas, M.N.; Lerner, L.K.; Tannoury, M.; Prola, A.; Moreno-Loshuertos, R.; Baritaud, M.; et al. Mitochondrial AIF loss causes metabolic reprogramming, caspase-independent cell death blockade, embryonic lethality, and perinatal hydrocephalus. Mol. Metab. 2020, 40, 101027. [Google Scholar] [CrossRef] [PubMed]
- Yang, A.; Herter-Sprie, G.; Zhang, H.; Lin, E.Y.; Biancur, D.; Wang, X.; Deng, J.; Hai, J.; Yang, S.; Wong, K.K.; et al. Autophagy sustains pancreatic cancer growth through both cell-autonomous and nonautonomous mechanisms. Cancer Discov. 2018, 8, 276–287. [Google Scholar] [CrossRef] [Green Version]
- Huang, Z.; Zhou, L.; Chen, Z.; Nice, E.C.; Huang, C. Stress management by autophagy: Implications for chemoresistance. Int. J. Cancer 2016, 139, 23–32. [Google Scholar] [CrossRef] [Green Version]
- Pan, S.T.; Li, Z.L.; He, Z.X.; Qiu, J.X.; Zhou, S.F. Molecular mechanisms for tumour resistance to chemotherapy. Clin. Exp. Pharmacol. Physiol. 2016, 43, 723–737. [Google Scholar] [CrossRef] [Green Version]
- Zheng, H.C. The molecular mechanisms of chemoresistance in cancers. Oncotarget 2017, 8, 59950–59964. [Google Scholar] [CrossRef] [Green Version]
- Gong, C.; Bauvy, C.; Tonelli, G.; Yue, W.; Delomenie, C.; Nicolas, V.; Zhu, Y.; Domergue, V.; Marin-Esteban, V.; Tharinger, H.; et al. Beclin 1 and autophagy are required for the tumorigenicity of breast cancer stem-like/progenitor cells. Oncogene 2013, 32, 2261–2272. [Google Scholar] [CrossRef]
- Kantara, C.; O’Connell, M.; Sarkar, S.; Moya, S.; Ullrich, R.; Singh, P. Curcumin promotes autophagic survival of a subset of colon cancer stem cells, which are ablated by DCLK1-siRNA. Cancer Res. 2014, 74, 2487–2498. [Google Scholar] [CrossRef] [Green Version]
- Dalla Pozza, E.; Dando, I.; Biondani, G.; Brandi, J.; Costanzo, C.; Zoratti, E.; Fassan, M.; Boschi, F.; Melisi, D.; Cecconi, D.; et al. Pancreatic ductal adenocarcinoma cell lines display a plastic ability to bidirectionally convert into cancer stem cells. Int. J. Oncol. 2015, 46, 1099–1108. [Google Scholar] [CrossRef] [Green Version]


Publisher’s Note: MDPI stays neutral with regard to jurisdictional claims in published maps and institutional affiliations. |
© 2020 by the authors. Licensee MDPI, Basel, Switzerland. This article is an open access article distributed under the terms and conditions of the Creative Commons Attribution (CC BY) license (http://creativecommons.org/licenses/by/4.0/).
Share and Cite
Forciniti, S.; Dalla Pozza, E.; Greco, M.R.; Amaral Carvalho, T.M.; Rolando, B.; Ambrosini, G.; Carmona-Carmona, C.A.; Pacchiana, R.; Di Molfetta, D.; Donadelli, M.; et al. Extracellular Matrix Composition Modulates the Responsiveness of Differentiated and Stem Pancreatic Cancer Cells to Lipophilic Derivate of Gemcitabine. Int. J. Mol. Sci. 2021, 22, 29. https://0-doi-org.brum.beds.ac.uk/10.3390/ijms22010029
Forciniti S, Dalla Pozza E, Greco MR, Amaral Carvalho TM, Rolando B, Ambrosini G, Carmona-Carmona CA, Pacchiana R, Di Molfetta D, Donadelli M, et al. Extracellular Matrix Composition Modulates the Responsiveness of Differentiated and Stem Pancreatic Cancer Cells to Lipophilic Derivate of Gemcitabine. International Journal of Molecular Sciences. 2021; 22(1):29. https://0-doi-org.brum.beds.ac.uk/10.3390/ijms22010029
Chicago/Turabian StyleForciniti, Stefania, Elisa Dalla Pozza, Maria Raffaella Greco, Tiago Miguel Amaral Carvalho, Barbara Rolando, Giulia Ambrosini, Cristian Andres Carmona-Carmona, Raffaella Pacchiana, Daria Di Molfetta, Massimo Donadelli, and et al. 2021. "Extracellular Matrix Composition Modulates the Responsiveness of Differentiated and Stem Pancreatic Cancer Cells to Lipophilic Derivate of Gemcitabine" International Journal of Molecular Sciences 22, no. 1: 29. https://0-doi-org.brum.beds.ac.uk/10.3390/ijms22010029