New Potential Biomarkers for Chronic Kidney Disease Management—A Review of the Literature

 , ,
, ,
Abstract
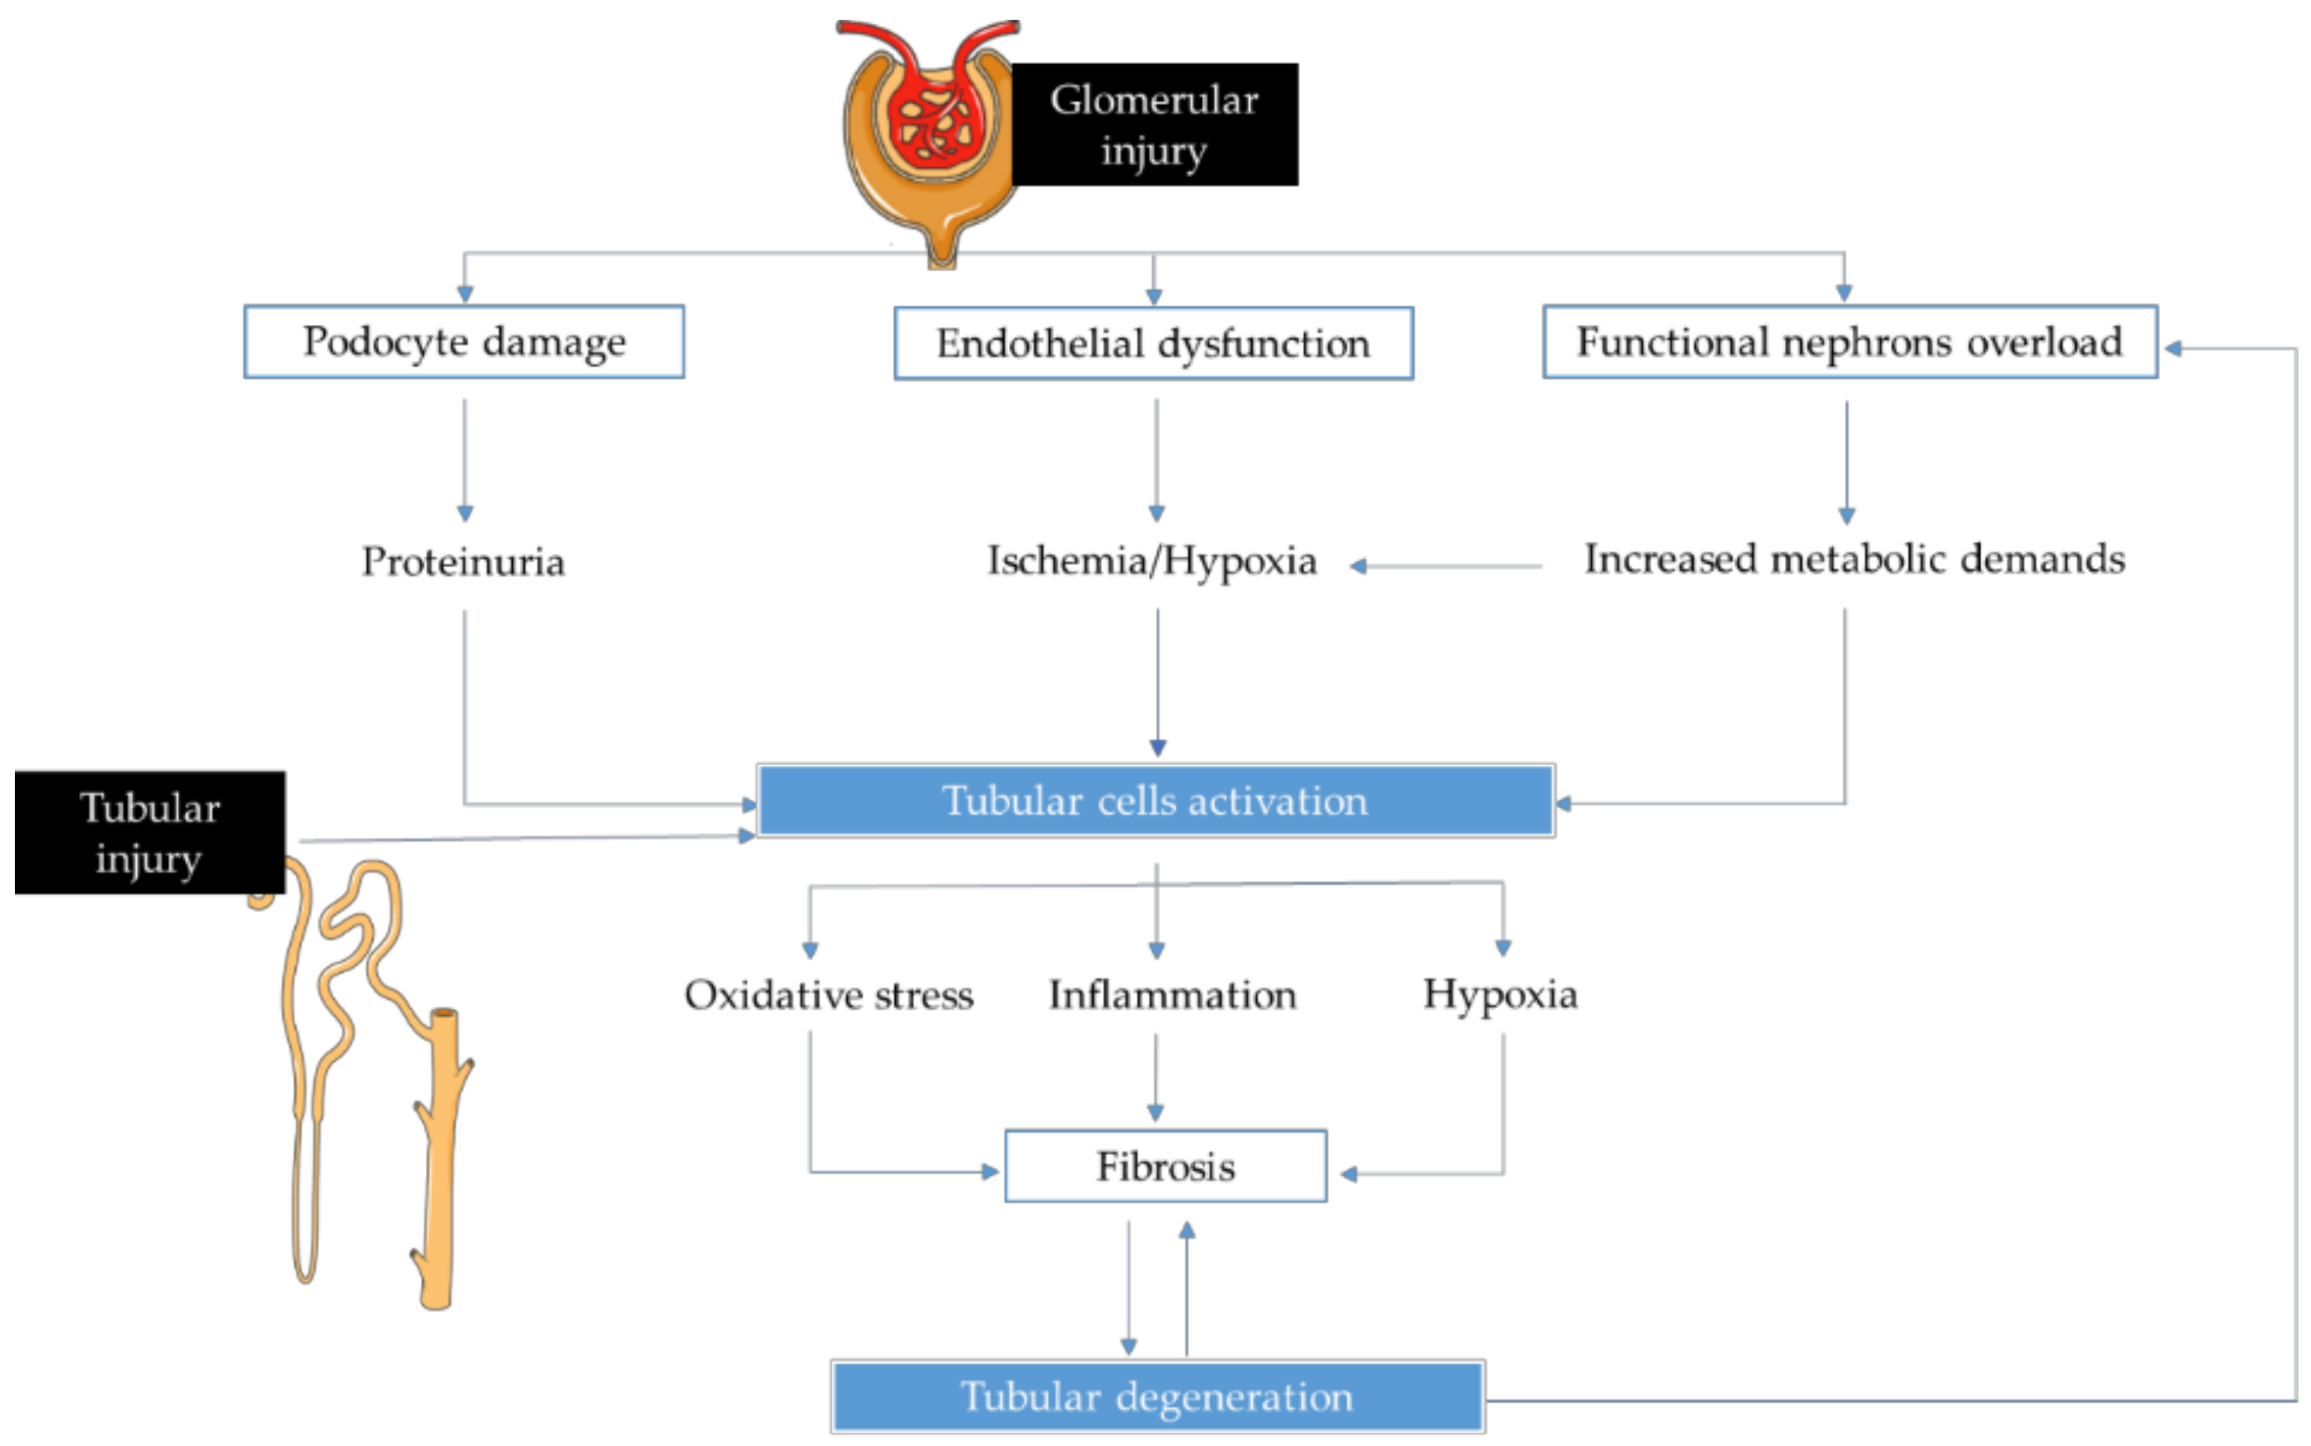
:1. Introduction
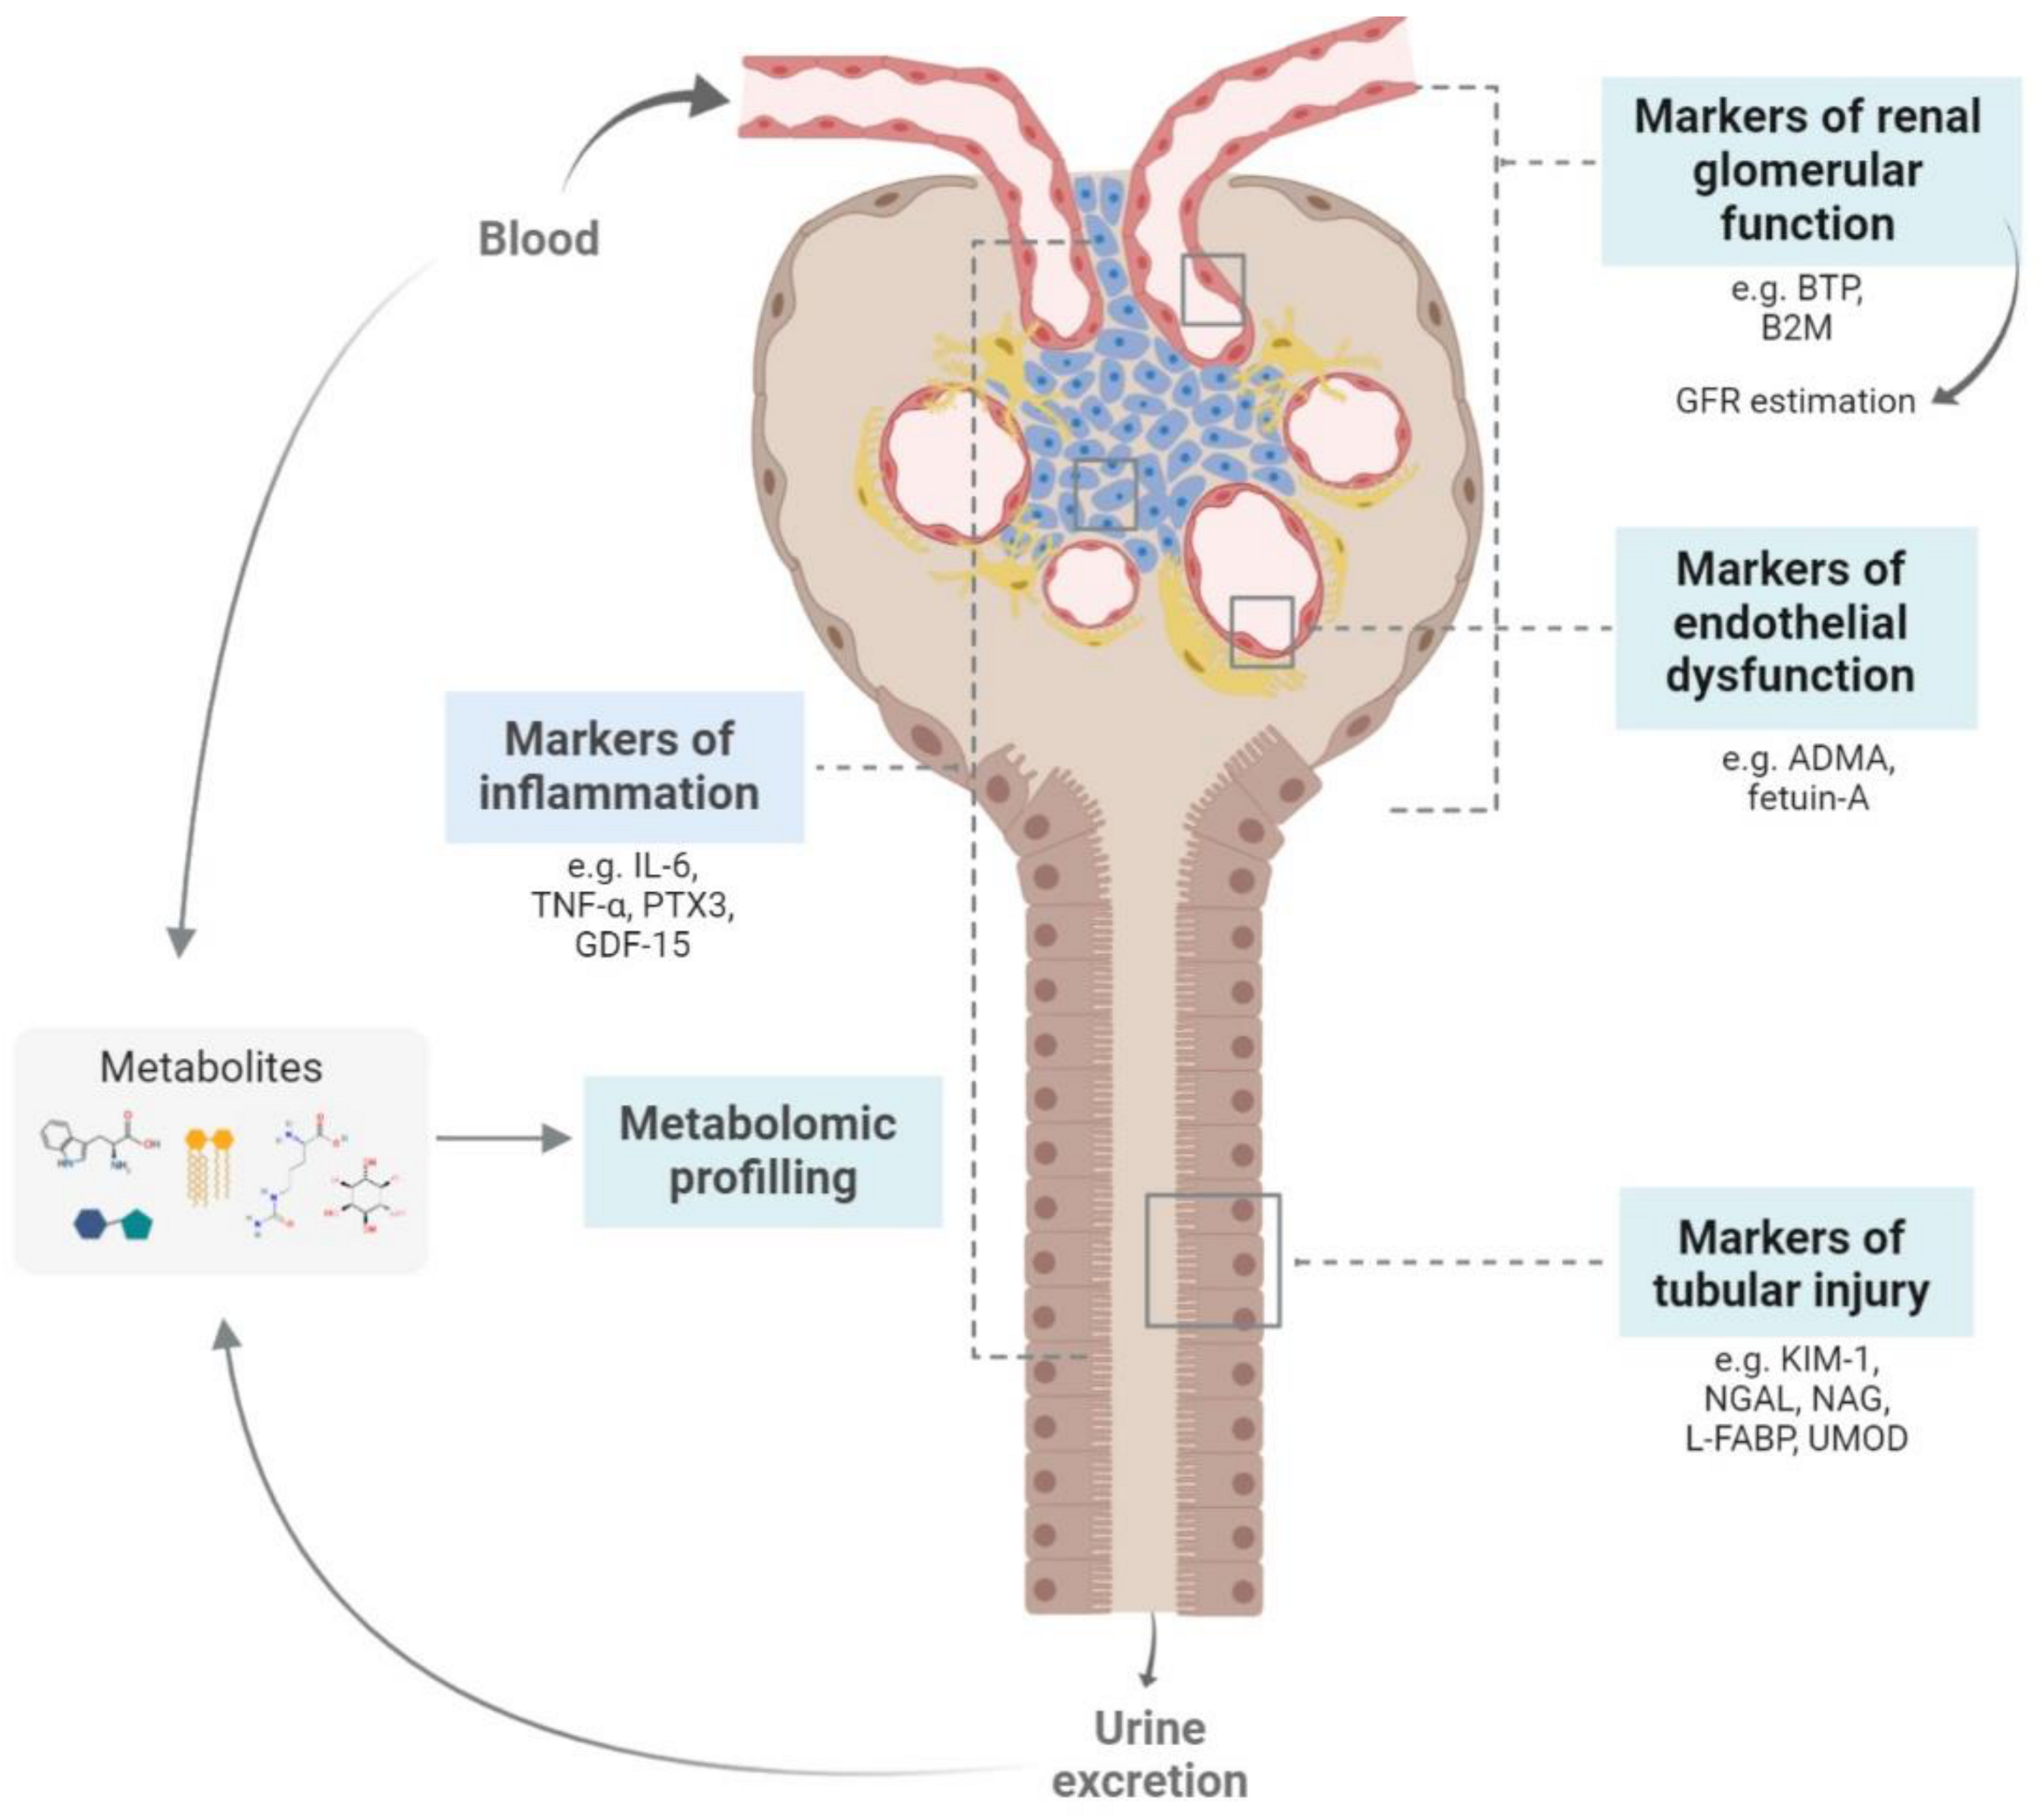
2. New Biomarkers for Chronic Kidney Disease Management
2.1. Biomarkers of Renal Function
2.1.1. Beta Trace Protein (BTP) and β2-Microglobulin (B2M)
2.1.2. Klotho
2.2. Biomarkers of Tubular Lesions
2.2.1. Neutrophil Gelatinase-Associated Lipocalin (NGAL), Kidney Injury Molecule-1 (KIM-1) and N-acetyl-β-D-glucosaminidase (NAG)
2.2.2. Liver-Type Fatty Acid Binding Protein (L-FABP)
2.2.3. Uromodulin (UMOD)
2.3. Biomarkers of Endothelial Dysfunction
2.3.1. Asymmetric Dimethylarginine (ADMA)
2.3.2. Fetuin-A
2.4. Biomarkers of Inflammation
2.5. Metabolomic Studies on CKD Biomarkers
3. Future Perspectives and Conclusions
Author Contributions
Funding
Acknowledgments
Conflicts of Interest
Abbreviations
| CKD | Chronic kidney disease |
| ESRD | End-stage renal disease |
| CVD | Cardiovascular disease |
| GFR | Glomerular filtration rate |
| BTP | Beta trace protein |
| B2M | β2-microglobulin |
| T2D | Type 2 diabetes |
| eGFR | Estimated glomerular filtration rate |
| NGAL | Neutrophil gelatinase-associated lipocalin |
| KIM-1 | Kidney injury molecule-1 |
| NAG | N-acetyl-β-D-glucosaminidase |
| L-FABP | Liver-type fatty acid binding protein |
| UMOD | Uromodulin |
| T1D | Type 1 diabetes |
| AKI | Acute kidney injury |
| NO | Nitric oxide |
| ADMA | Asymmetric dimethylarginine |
| IL-6 | Interleukin-6 |
| TNF-α | Tumor necrosis factor-α |
| PTX3 | Pentraxin 3 |
| CRP | C-reactive protein |
| GDF-15 | Growth differentiation factor-15 |
| cf-DNA | Cell-free DNA |
References
- Foundation, N.K. K/DOQI clinical practice guidelines for chronic kidney disease: Evaluation, classification, and stratification. Am. J. Kidney Dis. 2002, 39, S1–S266. [Google Scholar]
- Eckardt, K.U.; Coresh, J.; Devuyst, O.; Johnson, R.J.; Kottgen, A.; Levey, A.S.; Levin, A. Evolving importance of kidney disease: From subspecialty to global health burden. Lancet 2013, 382, 158–169. [Google Scholar] [CrossRef] [Green Version]
- Schlondorff, D.O. Overview of factors contributing to the pathophysiology of progressive renal disease. Kidney Int. 2008, 74, 860–866. [Google Scholar] [CrossRef] [PubMed] [Green Version]
- Yamaguchi, J.; Tanaka, T.; Nangaku, M. Recent advances in understanding of chronic kidney disease. F1000Res 2015, 4. [Google Scholar] [CrossRef] [PubMed] [Green Version]
- Zhang, W.R.; Parikh, C.R. Biomarkers of Acute and Chronic Kidney Disease. Annu. Rev. Physiol. 2019, 81, 309–333. [Google Scholar] [CrossRef] [PubMed]
- Levin, A.; Stevens, P.E.; Bilous, R.W.; Coresh, J.; De Francisco, A.L.M.; De Jong, P.E.; Griffith, K.E.; Hemmelgarn, B.R.; Iseki, K.; Lamb, E.J.; et al. Kidney Disease: Improving Global Outcomes (KDIGO) CKD Work Group. KDIGO 2012 clinical practice guideline for the evaluation and management of chronic kidney disease. Kidney Int. Suppl. 2012, 3, 1–150. [Google Scholar] [CrossRef]
- Levey, A.S.; Coresh, J. Chronic kidney disease. Lancet 2012, 379, 165–180. [Google Scholar] [CrossRef]
- Santos-Silva, A.; Costa, E.; Alves, R. Chronic Kidney Disease. In Biomarkers of Cardiometabolic Risk, Inflammation and Disease; Palavra, F., Reis, F., Marado, D., Sena, A., Eds.; Springer International Publishing: Cham, Switzerland, 2015; pp. 95–111. [Google Scholar]
- George, J.A.; Gounden, V. Novel glomerular filtration markers. Adv. Clin. Chem. 2019, 88, 91–119. [Google Scholar] [CrossRef] [PubMed]
- Inker, L.A.; Tighiouart, H.; Coresh, J.; Foster, M.C.; Anderson, A.H.; Beck, G.J.; Contreras, G.; Greene, T.; Karger, A.B.; Kusek, J.W.; et al. GFR Estimation Using beta-Trace Protein and beta2-Microglobulin in CKD. Am. J. Kidney Dis. 2016, 67, 40–48. [Google Scholar] [CrossRef] [Green Version]
- Foster, M.C.; Levey, A.S.; Inker, L.A.; Shafi, T.; Fan, L.; Gudnason, V.; Katz, R.; Mitchell, G.F.; Okparavero, A.; Palsson, R.; et al. Non-GFR Determinants of Low-Molecular-Weight Serum Protein Filtration Markers in the Elderly: AGES-Kidney and MESA-Kidney. Am. J. Kidney Dis. 2017, 70, 406–414. [Google Scholar] [CrossRef]
- Filler, G.; Kusserow, C.; Lopes, L.; Kobrzyński, M. Beta-trace protein as a marker of GFR--history, indications, and future research. Clin. Biochem. 2014, 47, 1188–1194. [Google Scholar] [CrossRef] [PubMed]
- Spanaus, K.S.; Kollerits, B.; Ritz, E.; Hersberger, M.; Kronenberg, F.; von Eckardstein, A. Serum creatinine, cystatin C, and beta-trace protein in diagnostic staging and predicting progression of primary nondiabetic chronic kidney disease. Clin. Chem. 2010, 56, 740–749. [Google Scholar] [CrossRef] [PubMed]
- Donadio, C. Serum and urinary markers of early impairment of gfr in chronic kidney disease patients: Diagnostic accuracy of urinary β-trace protein. Am. J. Physiol. Renal. Physiol. 2010, 299, f1407–f1423. [Google Scholar] [CrossRef] [PubMed] [Green Version]
- Chen, n.; Shi, h.; Zhang, L.; Zuo, L.; Xie, J.; Xie, D.; Karger, A.B.; Miao, S.; Ren, H.; Zhang, W.; et al. GFR Estimation Using a Panel of Filtration Markers in Shanghai and Beijing. Kidney Med. 2020, 2, 172–180. [Google Scholar] [CrossRef] [PubMed]
- Donadio, C.; Bozzoli, L. Urinary beta-trace protein: A unique biomarker to screen early glomerular filtration rate impairment. Medicine 2016, 95, e5553. [Google Scholar] [CrossRef] [PubMed]
- Ewadh, M. Beta trace protein level as a better diagnostic marker of renal impairment in patients with chronic kidney disease, diabetes mellitus, and renal transplants. J. Pharm. Sci. Res. 2018, 10, 1615–1618. [Google Scholar]
- Motawi, T.K.; Shehata, N.I.; ElNokeety, M.M.; El-Emady, Y.F. Potential serum biomarkers for early detection of diabetic nephropathy. Diabetes Res. Clin. Pract. 2018, 136, 150–158. [Google Scholar] [CrossRef]
- Dajak, M.; Ignjatovic, S.; Stojimirovic, B.; Gajic, S.; Majkic-Singh, N. Evaluation of renal damage by urinary beta-trace protein in patients with chronic kidney disease. Clin. Lab. 2011, 57, 29–36. [Google Scholar]
- Drüeke, T.B.; Massy, Z.A. Beta2-microglobulin. Semin. Dial. 2009, 22, 378–380. [Google Scholar] [CrossRef]
- Stefanović, V.; Djukanović, L.; Cukuranović, R.; Bukvić, D.; Ležaić, V.; Marić, I.; Ogrizovic, S.S.; Jovanović, I.; Vlahovic, P.; Pešić, I.; et al. Beta2-microglobulin and alpha1-microglobulin as markers of Balkan endemic nephropathy, a worldwide disease. Ren. Fail. 2011, 33, 176–183. [Google Scholar] [CrossRef]
- Foster, M.C.; Inker, L.A.; Hsu, C.Y.; Eckfeldt, J.H.; Levey, A.S.; Pavkov, M.E.; Myers, B.D.; Bennett, P.H.; Kimmel, P.L.; Vasan, R.S.; et al. Filtration markers as predictors of ESRD and mortality in Southwestern American Indians with type 2 diabetes. Am. J. Kidney Dis. 2015, 66, 75–83. [Google Scholar] [CrossRef] [PubMed] [Green Version]
- Rebholz, C.M.; Inker, L.A.; Chen, Y.; Liang, M.; Foster, M.C.; Eckfeldt, J.H.; Kimmel, P.L.; Vasan, R.S.; Feldman, H.I.; Sarnak, M.J.; et al. Risk of ESRD and Mortality Associated with Change in Filtration Markers. Am. J. Kidney Dis. 2017, 70, 551–560. [Google Scholar] [CrossRef] [PubMed]
- Rebholz, C.M.; Grams, M.E.; Matsushita, K.; Selvin, E.; Coresh, J. Change in novel filtration markers and risk of ESRD. Am. J. Kidney Dis. 2015, 66, 47–54. [Google Scholar] [CrossRef] [PubMed] [Green Version]
- Pottel, H.; Schaeffner, E.; Ebert, N. Evaluating the diagnostic value of rescaled beta-trace protein in combination with serum creatinine and serum cystatin C in older adults. Clin. Chim. Acta 2018, 480, 206–213. [Google Scholar] [CrossRef] [PubMed]
- White, C.A.; Allen, C.M.; Akbari, A.; Collier, C.P.; Holland, D.C.; Day, A.G.; Knoll, G.A. Comparison of the new and traditional CKD-EPI GFR estimation equations with urinary inulin clearance: A study of equation performance. Clin. Chim. Acta 2019, 488, 189–195. [Google Scholar] [CrossRef]
- Inker, L.A.; Coresh, J.; Sang, Y.; Hsu, C.Y.; Foster, M.C.; Eckfeldt, J.H.; Karger, A.B.; Nelson, R.G.; Liu, X.; Sarnak, M.; et al. Filtration Markers as Predictors of ESRD and Mortality: Individual Participant Data Meta-Analysis. Clin. J. Am. Soc. Nephrol. 2017, 12, 69–78. [Google Scholar] [CrossRef] [Green Version]
- Buchanan, S.; Combet, E.; Stenvinkel, P.; Shiels, P.G. Klotho, Aging, and the Failing Kidney. Front. Endocrinol. 2020, 11, 560. [Google Scholar] [CrossRef]
- Hu, M.-C.; Kuro-o, M.; Moe, O.W. Klotho and kidney disease. J. Nephrol. 2010, 23 (Suppl. 16), S136–S144. [Google Scholar]
- Zou, D.; Wu, W.; He, Y.; Ma, S.; Gao, J. The role of klotho in chronic kidney disease. BMC Nephrol. 2018, 19, 285. [Google Scholar] [CrossRef] [Green Version]
- Qian, J.; Zhong, J.; Yan, M.; Cheng, P.; Shi, H.; Hao, C.; Gu, Y.; Lai, L. Circulating α-Klotho is Related to Plasma Aldosterone and Its Follow-Up Change Predicts CKD Progression. Kidney Blood Press. Res. 2018, 43, 836–846. [Google Scholar] [CrossRef]
- Wang, Q.; Su, W.; Shen, Z.; Wang, R. Correlation between Soluble α-Klotho and Renal Function in Patients with Chronic Kidney Disease: A Review and Meta-Analysis. Biomed. Res. Int. 2018, 2018, 9481475. [Google Scholar] [CrossRef] [PubMed] [Green Version]
- Inci, A.; Sari, F.; Coban, M.; Olmaz, R.; Dolu, S.; Sarıkaya, M.; Yılmaz, N. Soluble Klotho and fibroblast growth factor 23 levels in diabetic nephropathy with different stages of albuminuria. J. Investig. Med. 2016, 64, 1128–1133. [Google Scholar] [CrossRef] [PubMed]
- Silva, A.P.; Mendes, F.; Carias, E.; Gonçalves, R.B.; Fragoso, A.; Dias, C.; Tavares, N.; Café, H.M.; Santos, N.; Rato, F.; et al. Plasmatic Klotho and FGF23 Levels as Biomarkers of CKD-Associated Cardiac Disease in Type 2 Diabetic Patients. Int. J. Mol. Sci. 2019, 20, 1536. [Google Scholar] [CrossRef] [PubMed] [Green Version]
- Memmos, E.; Sarafidis, P.; Pateinakis, P.; Tsiantoulas, A.; Faitatzidou, D.; Giamalis, P.; Vasilikos, V.; Papagianni, A. Soluble Klotho is associated with mortality and cardiovascular events in hemodialysis. BMC Nephrol. 2019, 20, 217. [Google Scholar] [CrossRef] [Green Version]
- He, T.; Xiong, J.; Huang, Y.; Zheng, C.; Liu, Y.; Bi, X.; Liu, C.; Han, W.; Yang, K.; Xiao, T.; et al. Klotho restrain RIG-1/NF-κB signaling activation and monocyte inflammatory factor release under uremic condition. Life Sci. 2019, 231, 116570. [Google Scholar] [CrossRef]
- Zheng, S.; Chen, Y.; Zheng, Y.; Zhou, Z.; Li, Z. Correlation of serum levels of fibroblast growth factor 23 and Klotho protein levels with bone mineral density in maintenance hemodialysis patients. Eur. J. Med. Res. 2018, 23, 18. [Google Scholar] [CrossRef] [Green Version]
- Liu, Z.; Zhou, H.; Chen, X.; Chen, H.; Wang, Y.; Wang, T.; Cai, L.; Hong, Y.; Ke, H.; Zheng, J. Relationship between cFGF23/Klotho ratio and phosphate levels in patients with chronic kidney disease. Int. Urol. Nephrol. 2019, 51, 503–507. [Google Scholar] [CrossRef]
- Hong, Y.A.; Lim, J.H.; Kim, M.Y.; Kim, Y.; Yang, K.S.; Chung, B.H.; Chung, S.; Choi, B.S.; Yang, C.W.; Kim, Y.S.; et al. Assessment of tubular reabsorption of phosphate as a surrogate marker for phosphate regulation in chronic kidney disease. Clin. Exp. Nephrol. 2015, 19, 208–215. [Google Scholar] [CrossRef]
- Foster, M.C.; Coresh, J.; Hsu, C.Y.; Xie, D.; Levey, A.S.; Nelson, R.G.; Eckfeldt, J.H.; Vasan, R.S.; Kimmel, P.L.; Schelling, J.; et al. Serum beta-Trace Protein and beta2-Microglobulin as Predictors of ESRD, Mortality, and Cardiovascular Disease in Adults With CKD in the Chronic Renal Insufficiency Cohort (CRIC) Study. Am. J. Kidney Dis. 2016, 68, 68–76. [Google Scholar] [CrossRef] [Green Version]
- Drew, D.A.; Katz, R.; Kritchevsky, S.; Ix, J.; Shlipak, M.; Gutiérrez, O.M.; Newman, A.; Hoofnagle, A.; Fried, L.; Semba, R.D.; et al. Association between Soluble Klotho and Change in Kidney Function: The Health Aging and Body Composition Study. J. Am. Soc. Nephrol. 2017, 28, 1859–1866. [Google Scholar] [CrossRef] [Green Version]
- Ebert, N.; Koep, C.; Schwarz, K.; Martus, P.; Mielke, N.; Bartel, J.; Kuhlmann, M.; Gaedeke, J.; Toelle, M.; van der Giet, M.; et al. Beta Trace Protein does not outperform Creatinine and Cystatin C in estimating Glomerular Filtration Rate in Older Adults. Sci. Rep. 2017, 7, 12656. [Google Scholar] [CrossRef] [PubMed] [Green Version]
- Khosravi, N.; Asgari, M.; Khalessi, N.; Hoseini, R.; Khosravi, N. Serum Beta-Trace Protein for Assessment of Kidney Function in Neonates. Iran. J. Kidney Dis. 2018, 12, 11–13. [Google Scholar] [PubMed]
- Liu, Q.F.; Yu, L.X.; Feng, J.H.; Sun, Q.; Li, S.S.; Ye, J.M. The Prognostic Role of Klotho in Patients with Chronic Kidney Disease: A Systematic Review and Meta-analysis. Dis. Markers 2019, 2019, 6468729. [Google Scholar] [CrossRef] [PubMed] [Green Version]
- Yue, L.; Pan, B.; Shi, X.; Du, X. Comparison between the Beta-2 Microglobulin-Based Equation and the CKD-EPI Equation for Estimating GFR in CKD Patients in China: ES-CKD Study. Kidney Dis. 2020, 6, 204–214. [Google Scholar] [CrossRef] [PubMed]
- Jung, J.Y.; Ro, H.; Chang, J.H.; Kim, A.J.; Lee, H.H.; Han, S.H.; Yoo, T.H.; Lee, K.B.; Kim, Y.H.; Kim, S.W.; et al. Mediation of the relationship between proteinuria and serum phosphate: Insight from the KNOW-CKD study. PLoS ONE 2020, 15, e0235077. [Google Scholar] [CrossRef]
- Devarajan, P. Neutrophil gelatinase-associated lipocalin (NGAL): A new marker of kidney disease. Scand J. Clin. Lab. Invest. Suppl. 2008, 241, 89–94. [Google Scholar] [CrossRef] [Green Version]
- Huo, W.; Zhang, K.; Nie, Z.; Li, Q.; Jin, F. Kidney injury molecule-1 (KIM-1): A novel kidney-specific injury molecule playing potential double-edged functions in kidney injury. Transplant. Rev. 2010, 24, 143–146. [Google Scholar] [CrossRef]
- Ning, M.; Mao, X.; Niu, Y.; Tang, B.; Shen, H. Usefulness and limitations of neutrophil gelatinase-associated lipocalin in the assessment of kidney diseases. J. Lab. Precis. Med. 2018, 3, 1. [Google Scholar] [CrossRef]
- Bolignano, D.; Donato, V.; Coppolino, G.; Campo, S.; Buemi, A.; Lacquaniti, A.; Buemi, M. Neutrophil gelatinase-associated lipocalin (NGAL) as a marker of kidney damage. Am. J. Kidney Dis. 2008, 52, 595–605. [Google Scholar] [CrossRef]
- Abbasi, F.; Moosaie, F.; Khaloo, P.; Dehghani Firouzabadi, F.; Fatemi Abhari, S.M.; Atainia, B.; Ardeshir, M.; Nakhjavani, M.; Esteghamati, A. Neutrophil Gelatinase-Associated Lipocalin and Retinol-Binding Protein-4 as Biomarkers for Diabetic Kidney Disease. Kidney Blood Press. Res. 2020, 45, 222–232. [Google Scholar] [CrossRef]
- Kapoula, G.V.; Kontou, P.I.; Bagos, P.G. Diagnostic Accuracy of Neutrophil Gelatinase-Associated Lipocalin for Predicting Early Diabetic Nephropathy in Patients with Type 1 and Type 2 Diabetes Mellitus: A Systematic Review and Meta-analysis. J. Appl. Lab. Med. 2019, 4, 78–94. [Google Scholar] [CrossRef] [PubMed]
- Sabbisetti, V.S.; Waikar, S.S.; Antoine, D.J.; Smiles, A.; Wang, C.; Ravisankar, A.; Ito, K.; Sharma, S.; Ramadesikan, S.; Lee, M.; et al. Blood kidney injury molecule-1 is a biomarker of acute and chronic kidney injury and predicts progression to ESRD in type I diabetes. J. Am. Soc. Nephrol. 2014, 25, 2177–2186. [Google Scholar] [CrossRef] [PubMed]
- Zhang, W.R.; Craven, T.E.; Malhotra, R.; Cheung, A.K.; Chonchol, M.; Drawz, P.; Sarnak, M.J.; Parikh, C.R.; Shlipak, M.G.; Ix, J.H. Kidney Damage Biomarkers and Incident Chronic Kidney Disease During Blood Pressure Reduction: A Case-Control Study. Ann. Intern. Med. 2018, 169, 610–618. [Google Scholar] [CrossRef] [PubMed]
- Żyłka, A.; Dumnicka, P.; Kuśnierz-Cabala, B.; Gala-Błądzińska, A.; Ceranowicz, P.; Kucharz, J.; Ząbek-Adamska, A.; Maziarz, B.; Drożdż, R.; Kuźniewski, M. Markers of Glomerular and Tubular Damage in the Early Stage of Kidney Disease in Type 2 Diabetic Patients. Mediat. Inflamm. 2018, 2018, 7659243. [Google Scholar] [CrossRef] [Green Version]
- Bjornstad, P.; Pyle, L.; Cherney, D.Z.I.; Johnson, R.J.; Sippl, R.; Wong, R.; Rewers, M.; Snell-Bergeon, J.K. Plasma biomarkers improve prediction of diabetic kidney disease in adults with type 1 diabetes over a 12-year follow-up: CACTI study. Nephrol. Dial. Transplant. 2018, 33, 1189–1196. [Google Scholar] [CrossRef]
- Skálová, S. The diagnostic role of urinary N-acetyl-beta-D-glucosaminidase (NAG) activity in the detection of renal tubular impairment. Acta Med. 2005, 48, 75–80. [Google Scholar]
- Jungbauer, C.G.; Uecer, E.; Stadler, S.; Birner, C.; Buchner, S.; Maier, L.S.; Luchner, A. N-acteyl-ss-D-glucosaminidase and kidney injury molecule-1: New predictors for long-term progression of chronic kidney disease in patients with heart failure. Nephrology 2016, 21, 490–498. [Google Scholar] [CrossRef]
- Lobato, G.R.; Lobato, M.R.; Thome, F.S.; Veronese, F.V. Performance of urinary kidney injury molecule-1, neutrophil gelatinase-associated lipocalin, and N-acetyl-beta-D-glucosaminidase to predict chronic kidney disease progression and adverse outcomes. Braz. J. Med. Biol. Res. 2017, 50, e6106. [Google Scholar] [CrossRef] [Green Version]
- Xu, Y.; Xie, Y.; Shao, X.; Ni, Z.; Mou, S. L-FABP: A novel biomarker of kidney disease. Clin. Chim. Acta 2015, 445, 85–90. [Google Scholar] [CrossRef]
- Negishi, K.; Noiri, E.; Doi, K.; Maeda-Mamiya, R.; Sugaya, T.; Portilla, D.; Fujita, T. Monitoring of Urinary L-Type Fatty Acid-Binding Protein Predicts Histological Severity of Acute Kidney Injury. Am. J. Pathol. 2009, 174, 1154–1159. [Google Scholar] [CrossRef] [Green Version]
- Suzuki, G.; Ichibayashi, R.; Yamamoto, S.; Nakamichi, Y.; Watanabe, M.; Honda, M. Clinical significance of urinary L-FABP in the emergency department. Int. J. Emerg. Med. 2019, 12, 24. [Google Scholar] [CrossRef] [PubMed] [Green Version]
- Ichikawa, D.; Kamijo-Ikemori, A.; Sugaya, T.; Ohata, K.; Hisamichi, M.; Hoshino, S.; Kimura, K.; Shibagaki, Y. Utility of urinary tubular markers for monitoring chronic tubulointerstitial injury after ischemia-reperfusion. Nephrology 2018, 23, 308–316. [Google Scholar] [CrossRef] [PubMed]
- Khatir, D.S.; Bendtsen, M.D.; Birn, H.; Norregaard, R.; Ivarsen, P.; Jespersen, B.; Buus, N.H. Urine liver fatty acid binding protein and chronic kidney disease progression. Scand. J. Clin. Lab. Invest. 2017, 77, 549–554. [Google Scholar] [CrossRef] [PubMed]
- Matsui, K.; Kamijo-Ikemori, A.; Imai, N.; Sugaya, T.; Yasuda, T.; Tatsunami, S.; Toyama, T.; Shimizu, M.; Furuichi, K.; Wada, T.; et al. Clinical significance of urinary liver-type fatty acid-binding protein as a predictor of ESRD and CVD in patients with CKD. Clin. Exp. Nephrol. 2016, 20, 195–203. [Google Scholar] [CrossRef] [PubMed]
- Maeda, Y.; Suzuki, A.; Ishii, J.; Sekiguchi-Ueda, S.; Shibata, M.; Yoshino, Y.; Asano, S.; Hayakawa, N.; Nakamura, K.; Akiyama, Y.; et al. Level of urinary liver-type fatty acid-binding protein is associated with cardiac markers and electrocardiographic abnormalities in type-2 diabetes with chronic kidney disease stage G1 and G2. Heart Vessel. 2015, 30, 362–368. [Google Scholar] [CrossRef] [PubMed]
- Devuyst, O.; Olinger, E.; Rampoldi, L. Uromodulin: From physiology to rare and complex kidney disorders. Nat. Rev. Nephrol. 2017, 13, 525–544. [Google Scholar] [CrossRef]
- Fedak, D.; Kuźniewski, M.; Fugiel, A.; Wieczorek-Surdacka, E.; Przepiórkowska-Hoyer, B.; Jasik, P.; Miarka, P.; Dumnicka, P.; Kapusta, M.; Solnica, B.; et al. Serum uromodulin concentrations correlate with glomerular filtration rate in patients with chronic kidney disease. Pol. Arch. Med. Wewn. 2016, 126, 995–1004. [Google Scholar] [CrossRef] [Green Version]
- Steubl, D.; Block, M.; Herbst, V.; Nockher, W.A.; Schlumberger, W.; Satanovskij, R.; Angermann, S.; Hasenau, A.L.; Stecher, L.; Heemann, U.; et al. Plasma Uromodulin Correlates With Kidney Function and Identifies Early Stages in Chronic Kidney Disease Patients. Medicine 2016, 95, e3011. [Google Scholar] [CrossRef]
- Scherberich, J.E.; Gruber, R.; Nockher, W.A.; Christensen, E.I.; Schmitt, H.; Herbst, V.; Block, M.; Kaden, J.; Schlumberger, W. Serum uromodulin-a marker of kidney function and renal parenchymal integrity. Nephrol. Dial. Transplant. 2018, 33, 284–295. [Google Scholar] [CrossRef] [Green Version]
- Lim, W.H.; Lewis, J.R.; Wong, G.; Teo, R.; Lim, E.M.; Byrnes, E.; Prince, R.L. Plasma neutrophil gelatinase-associated lipocalin and kidney function decline and kidney disease-related clinical events in older women. Am. J. Nephrol. 2015, 41, 156–164. [Google Scholar] [CrossRef]
- Lv, L.; Wang, J.; Gao, B.; Wu, L.; Wang, F.; Cui, Z.; He, K.; Zhang, L.; Chen, M.; Zhao, M.H. Serum uromodulin and progression of kidney disease in patients with chronic kidney disease. J. Transl. Med. 2018, 16, 316. [Google Scholar] [CrossRef] [PubMed]
- Seibert, F.S.; Sitz, M.; Passfall, J.; Haesner, M.; Laschinski, P.; Buhl, M.; Bauer, F.; Babel, N.; Pagonas, N.; Westhoff, T.H. Prognostic Value of Urinary Calprotectin, NGAL and KIM-1 in Chronic Kidney Disease. Kidney Blood Press. Res. 2018, 43, 1255–1262. [Google Scholar] [CrossRef] [PubMed]
- Ding, Y.; Nie, L.M.; Pang, Y.; Wu, W.J.; Tan, Y.; Yu, F.; Zhao, M.H. Composite urinary biomarkers to predict pathological tubulointerstitial lesions in lupus nephritis. Lupus 2018, 27, 1778–1789. [Google Scholar] [CrossRef] [PubMed]
- Steubl, D.; Block, M.; Herbst, V.; Nockher, W.A.; Schlumberger, W.; Kemmner, S.; Bachmann, Q.; Angermann, S.; Wen, M.; Heemann, U.; et al. Urinary uromodulin independently predicts end-stage renal disease and rapid kidney function decline in a cohort of chronic kidney disease patients. Medicine 2019, 98, e15808. [Google Scholar] [CrossRef] [PubMed]
- Steubl, D.; Buzkova, P.; Garimella, P.S.; Ix, J.H.; Devarajan, P.; Bennett, M.R.; Chaves, P.H.M.; Shlipak, M.G.; Bansal, N.; Sarnak, M.J. Association of Serum Uromodulin With ESKD and Kidney Function Decline in the Elderly: The Cardiovascular Health Study. Am. J. Kidney Dis. 2019, 74, 501–509. [Google Scholar] [CrossRef] [PubMed]
- Plesiński, K.; Adamczyk, P.; Świętochowska, E.; Morawiec-Knysak, A.; Gliwińska, A.; Korlacki, W.; Szczepańska, M. Evaluation of liver-type fatty acid binding protein (L-FABP) and interleukin 6 in children with renal cysts. Adv. Clin. Exp. Med. 2019, 28, 1675–1682. [Google Scholar] [CrossRef] [PubMed]
- An, C.; Akankwasa, G.; Liu, J.; Wang, D.; Cheng, G.; Zhang, J.; Qin, X. Urine markers of renal tubular injury in idiopathic membranous nephropathy: A cross sectional study. Clin. Chim. Acta 2019, 492, 7–11. [Google Scholar] [CrossRef]
- Li, A.; Yi, B.; Liu, Y.; Wang, J.; Dai, Q.; Huang, Y.; Li, Y.C.; Zhang, H. Urinary NGAL and RBP Are Biomarkers of Normoalbuminuric Renal Insufficiency in Type 2 Diabetes Mellitus. J. Immunol. Res. 2019, 2019, 5063089. [Google Scholar] [CrossRef]
- Garimella, P.S.; Lee, A.K.; Ambrosius, W.T.; Bhatt, U.; Cheung, A.K.; Chonchol, M.; Craven, T.; Hawfield, A.T.; Jotwani, V.; Killeen, A.; et al. Markers of kidney tubule function and risk of cardiovascular disease events and mortality in the SPRINT trial. Eur. Heart J. 2019, 40, 3486–3493. [Google Scholar] [CrossRef]
- Zhang, D.; Ye, S.; Pan, T. The role of serum and urinary biomarkers in the diagnosis of early diabetic nephropathy in patients with type 2 diabetes. PeerJ 2019, 7, e7079. [Google Scholar] [CrossRef] [Green Version]
- Schulz, C.A.; Engström, G.; Nilsson, J.; Almgren, P.; Petkovic, M.; Christensson, A.; Nilsson, P.M.; Melander, O.; Orho-Melander, M. Plasma kidney injury molecule-1 (p-KIM-1) levels and deterioration of kidney function over 16 years. Nephrol. Dial. Transplant. 2020, 35, 265–273. [Google Scholar] [CrossRef] [PubMed]
- Malyszko, J. Mechanism of endothelial dysfunction in chronic kidney disease. Clin. Chim. Acta 2010, 411, 1412–1420. [Google Scholar] [CrossRef] [PubMed]
- Quoc Hoang, T.A.; Tam, V.; Thang, H.V. Plasma asymmetric dimethylarginine and its association with some of cardiovascular disease risk factors in chronic kidney disease. Med. J. Malays. 2019, 74, 209–214. [Google Scholar]
- Triches, C.B.; Quinto, M.; Mayer, S.; Batista, M.; Zanella, M.T. Relation of asymmetrical dimethylarginine levels with renal outcomes in hypertensive patients with and without type 2 diabetes mellitus. J. Diabetes Complicat. 2018, 32, 316–320. [Google Scholar] [CrossRef]
- Ashokachakkaravarthy, K.; Rajappa, M.; Parameswaran, S.; Satheesh, S.; Priyadarshini, G.; Mohan Raj, P.S.; Revathy, G.; Priyadarssini, M. Asymmetric dimethylarginine and angiopoietin-like protein-2 are independent predictors of cardiovascular risk in pre-dialysis non-diabetic chronic kidney disease patients. Int. Urol. Nephrol. 2020. [Google Scholar] [CrossRef]
- Martens, C.R.; Kirkman, D.L.; Edwards, D.G. The Vascular Endothelium in Chronic Kidney Disease: A Novel Target for Aerobic Exercise. Exerc. Sport Sci. Rev. 2016, 44, 12–19. [Google Scholar] [CrossRef] [Green Version]
- Moe, S.M.; Chen, N.X. Mechanisms of vascular calcification in chronic kidney disease. J. Am. Soc. Nephrol. 2008, 19, 213–216. [Google Scholar] [CrossRef] [Green Version]
- Oliva-Damaso, E.; Oliva-Damaso, N.; Rodriguez-Esparragon, F.; Payan, J.; Baamonde-Laborda, E.; Gonzalez-Cabrera, F.; Santana-Estupiñan, R.; Rodriguez-Perez, J.C. Asymmetric (ADMA) and Symmetric (SDMA) Dimethylarginines in Chronic Kidney Disease: A Clinical Approach. Int. J. Mol. Sci. 2019, 20, 3668. [Google Scholar] [CrossRef] [Green Version]
- Schlesinger, S.; Sonntag, S.R.; Lieb, W.; Maas, R. Asymmetric and Symmetric Dimethylarginine as Risk Markers for Total Mortality and Cardiovascular Outcomes: A Systematic Review and Meta-Analysis of Prospective Studies. PLoS ONE 2016, 11, e0165811. [Google Scholar] [CrossRef]
- Choi, H.R.; Lee, S.W.; Jeon, D.H.; Hur, N.W.; Youm, Y.; Kim, H.C. Association between estimated glomerular filtration rate (eGFR) and asymmetric dimethylarginine (ADMA) concentrations among the elderly in a rural community: A cross-sectional study. BMC Geriatr. 2019, 19, 370. [Google Scholar] [CrossRef] [Green Version]
- Wang, F.; Xiong, R.; Feng, S.; Lu, X.; Li, H.; Wang, S. Association of Circulating Levels of ADMA with Carotid Intima-Media Thickness in Patients with CKD: A Systematic Review and Meta-Analysis. Kidney Blood Press. Res. 2018, 43, 25–33. [Google Scholar] [CrossRef] [PubMed]
- Bartnicki, P.; Kowalczyk, M.; Franczyk-Skóra, B.; Baj, Z.; Rysz, J. Evaluation of Endothelial (dys)Function, Left Ventricular Structure and Function in Patients with Chronic Kidney Disease. Curr. Vasc. Pharmacol. 2016, 14, 360–367. [Google Scholar] [CrossRef] [PubMed]
- Seliger, S.L.; Salimi, S.; Pierre, V.; Giffuni, J.; Katzel, L.; Parsa, A. Microvascular endothelial dysfunction is associated with albuminuria and CKD in older adults. BMC Nephrol. 2016, 17, 82. [Google Scholar] [CrossRef] [PubMed] [Green Version]
- Caglar, K.; Yilmaz, M.I.; Saglam, M.; Cakir, E.; Kilic, S.; Sonmez, A.; Eyileten, T.; Yenicesu, M.; Oguz, Y.; Tasar, M.; et al. Serum fetuin-a concentration and endothelial dysfunction in chronic kidney disease. Nephron. Clin. Pract. 2008, 108, c233–c240. [Google Scholar] [CrossRef]
- Cozzolino, M.; Galassi, A.; Biondi, M.L.; Turri, O.; Papagni, S.; Mongelli, N.; Civita, L.; Gallieni, M.; Brancaccio, D. Serum fetuin-A levels link inflammation and cardiovascular calcification in hemodialysis patients. Am. J. Nephrol. 2006, 26, 423–429. [Google Scholar] [CrossRef]
- Mutluay, R.; Konca Değertekin, C.; Işıktaş Sayılar, E.; Derici, Ü.; Gültekin, S.; Gönen, S.; Arınsoy, S.T.; Sindel, M. Serum fetuin-A is associated with the components of MIAC(malnutrition, inflammation, atherosclerosis, calcification) syndrome in different stages of chronic kidney disease. Turk. J. Med. Sci. 2019, 49, 327–335. [Google Scholar] [CrossRef]
- Zhou, Z.; Ji, Y.; Ju, H.; Chen, H.; Sun, M. Circulating Fetuin-A and Risk of All-Cause Mortality in Patients with Chronic Kidney Disease: A Systematic Review and Meta-Analysis. Front. Physiol. 2019, 10, 966. [Google Scholar] [CrossRef]
- Ciaccio, M.; Bivona, G.; Di Sciacca, R.; Iatrino, R.; Di Natale, E.; Li Vecchi, M.; Bellia, C. Changes in serum fetuin-A and inflammatory markers levels in end-stage renal disease (ESRD): Effect of a single session haemodialysis. Clin. Chem. Lab. Med. 2008, 46, 212–214. [Google Scholar] [CrossRef]
- Wang, A.Y.; Woo, J.; Lam, C.W.; Wang, M.; Chan, I.H.; Gao, P.; Lui, S.F.; Li, P.K.; Sanderson, J.E. Associations of serum fetuin-A with malnutrition, inflammation, atherosclerosis and valvular calcification syndrome and outcome in peritoneal dialysis patients. Nephrol. Dial. Transplant. 2005, 20, 1676–1685. [Google Scholar] [CrossRef] [Green Version]
- Pérez-Sotelo, D.; Roca-Rivada, A.; Larrosa-García, M.; Castelao, C.; Baamonde, I.; Baltar, J.; Crujeiras, A.B.; Seoane, L.M.; Casanueva, F.F.; Pardo, M. Visceral and subcutaneous adipose tissue express and secrete functional alpha2hsglycoprotein (fetuin a) especially in obesity. Endocrine 2017, 55, 435–446. [Google Scholar] [CrossRef]
- Zha, Y.; Qian, Q. Protein Nutrition and Malnutrition in CKD and ESRD. Nutrients 2017, 9, 208. [Google Scholar] [CrossRef]
- Iorember, F.M. Malnutrition in Chronic Kidney Disease. Front. Pediatr. 2018, 6, 161. [Google Scholar] [CrossRef] [PubMed]
- Chen, J.; Hamm, L.L.; Mohler, E.R.; Hudaihed, A.; Arora, R.; Chen, C.S.; Liu, Y.; Browne, G.; Mills, K.T.; Kleinpeter, M.A.; et al. Interrelationship of Multiple Endothelial Dysfunction Biomarkers with Chronic Kidney Disease. PLoS ONE 2015, 10, e0132047. [Google Scholar] [CrossRef] [Green Version]
- Kanbay, M.; Afsar, B.; Siriopol, D.; Unal, H.U.; Karaman, M.; Saglam, M.; Eyileten, T.; Gezer, M.; Verim, S.; Oguz, Y.; et al. Relevance of uric acid and asymmetric dimethylarginine for modeling cardiovascular risk prediction in chronic kidney disease patients. Int. Urol. Nephrol. 2016, 48, 1129–1136. [Google Scholar] [CrossRef] [PubMed]
- Alderson, H.V.; Ritchie, J.P.; Middleton, R.; Larsson, A.; Larsson, T.E.; Kalra, P.A. FGF-23 and Osteoprotegerin but not Fetuin-A are associated with death and enhance risk prediction in non-dialysis chronic kidney disease stages 3-5. Nephrology 2016, 21, 566–573. [Google Scholar] [CrossRef] [PubMed]
- Emrich, I.E.; Zawada, A.M.; Martens-Lobenhoffer, J.; Fliser, D.; Wagenpfeil, S.; Heine, G.H.; Bode-Böger, S.M. Symmetric dimethylarginine (SDMA) outperforms asymmetric dimethylarginine (ADMA) and other methylarginines as predictor of renal and cardiovascular outcome in non-dialysis chronic kidney disease. Clin. Res. Cardiol. 2018, 107, 201–213. [Google Scholar] [CrossRef] [PubMed]
- Amdur, R.L.; Feldman, H.I.; Gupta, J.; Yang, W.; Kanetsky, P.; Shlipak, M.; Rahman, M.; Lash, J.P.; Townsend, R.R.; Ojo, A.; et al. Inflammation and Progression of CKD: The CRIC Study. Clin. J. Am. Soc. Nephrol. 2016, 11, 1546–1556. [Google Scholar] [CrossRef] [PubMed] [Green Version]
- Gupta, J.; Mitra, N.; Kanetsky, P.A.; Devaney, J.; Wing, M.R.; Reilly, M.; Shah, V.O.; Balakrishnan, V.S.; Guzman, N.J.; Girndt, M.; et al. Association between albuminuria, kidney function, and inflammatory biomarker profile in CKD in CRIC. Clin. J. Am. Soc. Nephrol. 2012, 7, 1938–1946. [Google Scholar] [CrossRef] [PubMed] [Green Version]
- Mihai, S.; Codrici, E.; Popescu, I.D.; Enciu, A.-M.; Albulescu, L.; Necula, L.G.; Mambet, C.; Anton, G.; Tanase, C. Inflammation-Related Mechanisms in Chronic Kidney Disease Prediction, Progression, and Outcome. J. Immunol. Res. 2018, 2018, 2180373. [Google Scholar] [CrossRef] [PubMed]
- Bash, L.D.; Erlinger, T.P.; Coresh, J.; Marsh-Manzi, J.; Folsom, A.R.; Astor, B.C. Inflammation, hemostasis, and the risk of kidney function decline in the Atherosclerosis Risk in Communities (ARIC) Study. Am. J. Kidney Dis. 2009, 53, 596–605. [Google Scholar] [CrossRef] [Green Version]
- Sun, J.; Axelsson, J.; Machowska, A.; Heimbürger, O.; Bárány, P.; Lindholm, B.; Lindström, K.; Stenvinkel, P.; Qureshi, A.R. Biomarkers of Cardiovascular Disease and Mortality Risk in Patients with Advanced CKD. Clin. J. Am. Soc. Nephrol. 2016, 11, 1163–1172. [Google Scholar] [CrossRef] [PubMed]
- Romanova, Y.; Laikov, A.; Markelova, M.; Khadiullina, R.; Makseev, A.; Hasanova, M.; Rizvanov, A.; Khaiboullina, S.; Salafutdinov, I. Proteomic Analysis of Human Serum from Patients with Chronic Kidney Disease. Biomolecules 2020, 10, 257. [Google Scholar] [CrossRef] [PubMed] [Green Version]
- Kamińska, J.; Stopiński, M.; Mucha, K.; Jędrzejczak, A.; Gołębiowski, M.; Niewczas, M.A.; Pączek, L.; Foroncewicz, B. IL 6 but not TNF is linked to coronary artery calcification in patients with chronic kidney disease. Cytokine 2019, 120, 9–14. [Google Scholar] [CrossRef] [PubMed]
- Milas, O.; Gadalean, F.; Vlad, A.; Dumitrascu, V.; Velciov, S.; Gluhovschi, C.; Bob, F.; Popescu, R.; Ursoniu, S.; Jianu, D.C.; et al. Pro-inflammatory cytokines are associated with podocyte damage and proximal tubular dysfunction in the early stage of diabetic kidney disease in type 2 diabetes mellitus patients. J. Diabetes Complicat. 2020, 34, 107479. [Google Scholar] [CrossRef]
- Malhotra, R.; Katz, R.; Jotwani, V.; Ambrosius, W.T.; Raphael, K.L.; Haley, W.; Rastogi, A.; Cheung, A.K.; Freedman, B.I.; Punzi, H.; et al. Urine Markers of Kidney Tubule Cell Injury and Kidney Function Decline in SPRINT Trial Participants with CKD. Clin. J. Am. Soc. Nephrol. 2020, 15, 349–358. [Google Scholar] [CrossRef]
- Bae, E.; Cha, R.H.; Kim, Y.C.; An, J.N.; Kim, D.K.; Yoo, K.D.; Lee, S.M.; Kim, M.H.; Park, J.T.; Kang, S.W.; et al. Circulating TNF receptors predict cardiovascular disease in patients with chronic kidney disease. Medicine 2017, 96, e6666. [Google Scholar] [CrossRef]
- Murakoshi, M.; Gohda, T.; Suzuki, Y. Circulating Tumor Necrosis Factor Receptors: A Potential Biomarker for the Progression of Diabetic Kidney Disease. Int. J. Mol. Sci. 2020, 21, 1957. [Google Scholar] [CrossRef] [Green Version]
- Tong, M.; Carrero, J.J.; Qureshi, A.R.; Anderstam, B.; Heimbürger, O.; Bárány, P.; Axelsson, J.; Alvestrand, A.; Stenvinkel, P.; Lindholm, B.; et al. Plasma pentraxin 3 in patients with chronic kidney disease: Associations with renal function, protein-energy wasting, cardiovascular disease, and mortality. Clin. J. Am. Soc. Nephrol. 2007, 2, 889–897. [Google Scholar] [CrossRef] [Green Version]
- Speeckaert, M.M.; Speeckaert, R.; Carrero, J.J.; Vanholder, R.; Delanghe, J.R. Biology of human pentraxin 3 (PTX3) in acute and chronic kidney disease. J. Clin. Immunol. 2013, 33, 881–890. [Google Scholar] [CrossRef]
- Sjöberg, B.; Qureshi, A.R.; Heimbürger, O.; Stenvinkel, P.; Lind, L.; Larsson, A.; Bárány, P.; Ärnlöv, J. Association between levels of pentraxin 3 and incidence of chronic kidney disease in the elderly. J. Intern. Med. 2016, 279, 173–179. [Google Scholar] [CrossRef] [Green Version]
- Valente, M.J.; Rocha, S.; Coimbra, S.; Catarino, C.; Rocha-Pereira, P.; Bronze-da-Rocha, E.; Oliveira, J.G.; Madureira, J.; Fernandes, J.C.; do Sameiro-Faria, M.; et al. Long Pentraxin 3 as a Broader Biomarker for Multiple Risk Factors in End-Stage Renal Disease: Association with All-Cause Mortality. Mediat. Inflamm. 2019, 2019, 3295725. [Google Scholar] [CrossRef] [PubMed] [Green Version]
- Krzanowski, M.; Krzanowska, K.; Gajda, M.; Dumnicka, P.; Dziewierz, A.; Woziwodzka, K.; Litwin, J.A.; Sułowicz, W. Pentraxin 3 as a new indicator of cardiovascular-related death in patients with advanced chronic kidney disease. Pol. Arch. Intern. Med. 2017, 127, 170–177. [Google Scholar] [CrossRef] [PubMed]
- Nair, V.; Robinson-Cohen, C.; Smith, M.R.; Bellovich, K.A.; Bhat, Z.Y.; Bobadilla, M.; Brosius, F.; de Boer, I.H.; Essioux, L.; Formentini, I.; et al. Growth Differentiation Factor-15 and Risk of CKD Progression. J. Am. Soc. Nephrol. 2017, 28, 2233–2240. [Google Scholar] [CrossRef] [PubMed] [Green Version]
- Bansal, N.; Zelnick, L.; Shlipak, M.G.; Anderson, A.; Christenson, R.; Deo, R.; deFilippi, C.; Feldman, H.; Lash, J.; He, J.; et al. Cardiac and Stress Biomarkers and Chronic Kidney Disease Progression: The CRIC Study. Clin. Chem. 2019, 65, 1448–1457. [Google Scholar] [CrossRef]
- Tuegel, C.; Katz, R.; Alam, M.; Bhat, Z.; Bellovich, K.; de Boer, I.; Brosius, F.; Gadegbeku, C.; Gipson, D.; Hawkins, J.; et al. GDF-15, Galectin 3, Soluble ST2, and Risk of Mortality and Cardiovascular Events in CKD. Am. J. Kidney Dis. 2018, 72, 519–528. [Google Scholar] [CrossRef]
- Mirna, M.; Topf, A.; Wernly, B.; Rezar, R.; Paar, V.; Jung, C.; Salmhofer, H.; Kopp, K.; Hoppe, U.C.; Schulze, P.C.; et al. Novel Biomarkers in Patients with Chronic Kidney Disease: An Analysis of Patients Enrolled in the GCKD-Study. J. Clin. Med. 2020, 9, 886. [Google Scholar] [CrossRef] [Green Version]
- Ho, J.E.; Hwang, S.J.; Wollert, K.C.; Larson, M.G.; Cheng, S.; Kempf, T.; Vasan, R.S.; Januzzi, J.L.; Wang, T.J.; Fox, C.S. Biomarkers of cardiovascular stress and incident chronic kidney disease. Clin. Chem. 2013, 59, 1613–1620. [Google Scholar] [CrossRef] [Green Version]
- Celec, P.; Vlková, B.; Lauková, L.; Bábíčková, J.; Boor, P. Cell-free DNA: The role in pathophysiology and as a biomarker in kidney diseases. Expert Rev. Mol. Med. 2018, 20, e1. [Google Scholar] [CrossRef]
- Nuzzo, P.V.; Berchuck, J.E.; Korthauer, K.; Spisak, S.; Nassar, A.H.; Abou Alaiwi, S.; Chakravarthy, A.; Shen, S.Y.; Bakouny, Z.; Boccardo, F.; et al. Detection of renal cell carcinoma using plasma and urine cell-free DNA methylomes. Nat. Med. 2020. [Google Scholar] [CrossRef]
- Merkle, J.; Daka, A.; Deppe, A.C.; Wahlers, T.; Paunel-Görgülü, A. High levels of cell-free DNA accurately predict late acute kidney injury in patients after cardiac surgery. PLoS ONE 2019, 14, e0218548. [Google Scholar] [CrossRef]
- Coimbra, S.; Santos-Silva, A.; Costa, E.; Bronze-da-Rocha, E. DNA Damage in End-Stage Renal Disease Patients. Assessment by In Vitro Comet Assay and by Cell-Free DNA Quantification. In Genotoxicity—A Predictable Risk to Our Actual World; Larramendy, L.M., Soloneski, S., Eds.; Intech, Open Access Publisher: London, UK, 2017. [Google Scholar] [CrossRef] [Green Version]
- Chang, C.C.; Chiu, P.F.; Wu, C.L.; Kuo, C.L.; Huang, C.S.; Liu, C.S.; Huang, C.H. Urinary cell-free mitochondrial and nuclear deoxyribonucleic acid correlates with the prognosis of chronic kidney diseases. BMC Nephrol. 2019, 20, 391. [Google Scholar] [CrossRef] [PubMed]
- Li, X.; Hu, R.; Luo, T.; Peng, C.; Gong, L.; Hu, J.; Yang, S.; Li, Q. Serum cell-free DNA and progression of diabetic kidney disease: A prospective study. BMJ Open Diabetes Res. Care 2020, 8. [Google Scholar] [CrossRef] [PubMed] [Green Version]
- Watson, D.; Yang, J.Y.C.; Sarwal, R.D.; Sigdel, T.K.; Liberto, J.M.; Damm, I.; Louie, V.; Sigdel, S.; Livingstone, D.; Soh, K.; et al. A Novel Multi-Biomarker Assay for Non-Invasive Quantitative Monitoring of Kidney Injury. J. Clin. Med. 2019, 8, 499. [Google Scholar] [CrossRef] [PubMed] [Green Version]
- Lee, R.; Shin, M.H.; Kim, H.N.; Lee, Y.H.; Choi, S.W.; Ahn, H.R.; Kweon, S.S. Relationship between plasma pentraxin 3 level and risk of chronic kidney disease in the Korean elderly: The Dong-gu study. Int. Urol. Nephrol. 2017, 49, 2027–2033. [Google Scholar] [CrossRef]
- Frimodt-Møller, M.; von Scholten, B.J.; Reinhard, H.; Jacobsen, P.K.; Hansen, T.W.; Persson, F.I.; Parving, H.H.; Rossing, P. Growth differentiation factor-15 and fibroblast growth factor-23 are associated with mortality in type 2 diabetes—An observational follow-up study. PLoS ONE 2018, 13, e0196634. [Google Scholar] [CrossRef] [Green Version]
- Anderson, C.E.; Hamm, L.L.; Batuman, G.; Kumbala, D.R.; Chen, C.S.; Kallu, S.G.; Siriki, R.; Gadde, S.; Kleinpeter, M.A.; Krane, N.K.; et al. The association of angiogenic factors and chronic kidney disease. BMC Nephrol. 2018, 19, 117. [Google Scholar] [CrossRef] [Green Version]
- Lee, J.; Choi, J.Y.; Kwon, Y.K.; Lee, D.; Jung, H.Y.; Ryu, H.M.; Cho, J.H.; Ryu, D.H.; Kim, Y.L.; Hwang, G.S. Changes in serum metabolites with the stage of chronic kidney disease: Comparison of diabetes and non-diabetes. Clin. Chim. Acta 2016, 459, 123–131. [Google Scholar] [CrossRef]
- McMahon, G.M.; Hwang, S.J.; Clish, C.B.; Tin, A.; Yang, Q.; Larson, M.G.; Rhee, E.P.; Li, M.; Levy, D.; O’Donnell, C.J.; et al. Urinary metabolites along with common and rare genetic variations are associated with incident chronic kidney disease. Kidney Int. 2017, 91, 1426–1435. [Google Scholar] [CrossRef]
- Guo, Y.; Yu, H.; Chen, D.; Zhao, Y.Y. Machine learning distilled metabolite biomarkers for early stage renal injury. Metabolomics 2019, 16, 4. [Google Scholar] [CrossRef]
- Lee, H.; Jang, H.B.; Yoo, M.G.; Park, S.I.; Lee, H.J. Amino Acid Metabolites Associated with Chronic Kidney Disease: An Eight-Year Follow-Up Korean Epidemiology Study. Biomedicines 2020, 8, 222. [Google Scholar] [CrossRef]
- Konje, V.C.; Rajendiran, T.M.; Bellovich, K.; Gadegbeku, C.A.; Gipson, D.S.; Afshinnia, F.; Mathew, A.V.; Michigan Kidney Translational Core CPROBE Investigator Group. Tryptophan levels associate with incident cardiovascular disease in chronic kidney disease. Clin. Kidney J. 2020. [Google Scholar] [CrossRef]
- Debnath, S.; Velagapudi, C.; Redus, L.; Thameem, F.; Kasinath, B.; Hura, C.E.; Lorenzo, C.; Abboud, H.E.; O’Connor, J.C. Tryptophan Metabolism in Patients With Chronic Kidney Disease Secondary to Type 2 Diabetes: Relationship to Inflammatory Markers. Int. J. Tryptophan Res. 2017, 10, 1178646917694600. [Google Scholar] [CrossRef] [PubMed]
- Ma, J.; Karnovsky, A.; Afshinnia, F.; Wigginton, J.; Rader, D.J.; Natarajan, L.; Sharma, K.; Porter, A.C.; Rahman, M.; He, J.; et al. Differential network enrichment analysis reveals novel lipid pathways in chronic kidney disease. Bioinformatics 2019, 35, 3441–3452. [Google Scholar] [CrossRef] [PubMed]
- Hu, J.-R.; Coresh, J.; Inker, L.A.; Levey, A.S.; Zheng, Z.; Rebholz, C.M.; Tin, A.; Appel, L.J.; Chen, J.; Sarnak, M.J.; et al. Serum metabolites are associated with all-cause mortality in chronic kidney disease. Kidney Int. 2018, 94, 381–389. [Google Scholar] [CrossRef] [PubMed]
- Grams, M.E.; Tin, A.; Rebholz, C.M.; Shafi, T.; Köttgen, A.; Perrone, R.D.; Sarnak, M.J.; Inker, L.A.; Levey, A.S.; Coresh, J. Metabolomic Alterations Associated with Cause of CKD. Clin. J. Am. Soc. Nephrol. 2017, 12, 1787–1794. [Google Scholar] [CrossRef] [PubMed]
- Tavares, G.; Venturini, G.; Padilha, K.; Zatz, R.; Pereira, A.C.; Thadhani, R.I.; Rhee, E.P.; Titan, S.M.O. 1,5-Anhydroglucitol predicts CKD progression in macroalbuminuric diabetic kidney disease: Results from non-targeted metabolomics. Metabolomics 2018, 14, 39. [Google Scholar] [CrossRef] [PubMed]
- Luo, S.; Coresh, J.; Tin, A.; Rebholz, C.M.; Appel, L.J.; Chen, J.; Vasan, R.S.; Anderson, A.H.; Feldman, H.I.; Kimmel, P.L.; et al. Serum Metabolomic Alterations Associated with Proteinuria in CKD. Clin. J. Am. Soc. Nephrol. 2019, 14, 342–353. [Google Scholar] [CrossRef] [Green Version]
- Hallan, S.; Afkarian, M.; Zelnick, L.R.; Kestenbaum, B.; Sharma, S.; Saito, R.; Darshi, M.; Barding, G.; Raftery, D.; Ju, W.; et al. Metabolomics and Gene Expression Analysis Reveal Down-regulation of the Citric Acid (TCA) Cycle in Non-diabetic CKD Patients. EBioMedicine 2017, 26, 68–77. [Google Scholar] [CrossRef] [Green Version]
- Hocher, B.; Adamski, J. Metabolomics for clinical use and research in chronic kidney disease. Nat. Rev. Nephrol. 2017, 13, 269–284. [Google Scholar] [CrossRef]
- Cañadas-Garre, M.; Anderson, K.; McGoldrick, J.; Maxwell, A.P.; McKnight, A.J. Proteomic and metabolomic approaches in the search for biomarkers in chronic kidney disease. J. Proteom. 2019, 193, 93–122. [Google Scholar] [CrossRef] [Green Version]
- Good, D.M.; Zürbig, P.; Argilés, A.; Bauer, H.W.; Behrens, G.; Coon, J.J.; Dakna, M.; Decramer, S.; Delles, C.; Dominiczak, A.F.; et al. Naturally occurring human urinary peptides for use in diagnosis of chronic kidney disease. Mol. Cell Proteom. 2010, 9, 2424–2437. [Google Scholar] [CrossRef] [PubMed] [Green Version]
- Pontillo, C.; Mischak, H. Urinary peptide-based classifier CKD273: Towards clinical application in chronic kidney disease. Clin. Kidney J. 2017, 10, 192–201. [Google Scholar] [CrossRef] [PubMed]
- Tofte, N.; Lindhardt, M.; Adamova, K.; Bakker, S.J.L.; Beige, J.; Beulens, J.W.J.; Birkenfeld, A.L.; Currie, G.; Delles, C.; Dimos, I.; et al. Early detection of diabetic kidney disease by urinary proteomics and subsequent intervention with spironolactone to delay progression (PRIORITY): A prospective observational study and embedded randomised placebo-controlled trial. Lancet Diabetes Endocrinol. 2020, 8, 301–312. [Google Scholar] [CrossRef]
- Karu, N.; McKercher, C.; Nichols, D.S.; Davies, N.; Shellie, R.A.; Hilder, E.F.; Jose, M.D. Tryptophan metabolism, its relation to inflammation and stress markers and association with psychological and cognitive functioning: Tasmanian Chronic Kidney Disease pilot study. BMC Nephrol. 2016, 17, 171. [Google Scholar] [CrossRef] [PubMed] [Green Version]
- Kimura, T.; Yasuda, K.; Yamamoto, R.; Soga, T.; Rakugi, H.; Hayashi, T.; Isaka, Y. Identification of biomarkers for development of end-stage kidney disease in chronic kidney disease by metabolomic profiling. Sci. Rep. 2016, 6, 26138. [Google Scholar] [CrossRef]
- Rhee, E.P.; Clish, C.B.; Wenger, J.; Roy, J.; Elmariah, S.; Pierce, K.A.; Bullock, K.; Anderson, A.H.; Gerszten, R.E.; Feldman, H.I. Metabolomics of Chronic Kidney Disease Progression: A Case-Control Analysis in the Chronic Renal Insufficiency Cohort Study. Am. J. Nephrol. 2016, 43, 366–374. [Google Scholar] [CrossRef] [PubMed] [Green Version]
- Sekula, P.; Goek, O.N.; Quaye, L.; Barrios, C.; Levey, A.S.; Römisch-Margl, W.; Menni, C.; Yet, I.; Gieger, C.; Inker, L.A.; et al. A Metabolome-Wide Association Study of Kidney Function and Disease in the General Population. J. Am. Soc. Nephrol. 2016, 27, 1175–1188. [Google Scholar] [CrossRef]
- Boelaert, J.; Lynen, F.; Glorieux, G.; Schepers, E.; Neirynck, N.; Vanholder, R. Metabolic profiling of human plasma and urine in chronic kidney disease by hydrophilic interaction liquid chromatography coupled with time-of-flight mass spectrometry: A pilot study. Anal. Bioanal. Chem. 2017, 409, 2201–2211. [Google Scholar] [CrossRef] [Green Version]
- Gil, R.B.; Ortiz, A.; Sanchez-Niño, M.D.; Markoska, K.; Schepers, E.; Vanholder, R.; Glorieux, G.; Schmitt-Kopplin, P.; Heinzmann, S.S. Increased urinary osmolyte excretion indicates chronic kidney disease severity and progression rate. Nephrol. Dial. Transplant. 2018, 33, 2156–2164. [Google Scholar] [CrossRef]
- Wang, F.; Sun, L.; Sun, Q.; Liang, L.; Gao, X.; Li, R.; Pan, A.; Li, H.; Deng, Y.; Hu, F.B.; et al. Associations of Plasma Amino Acid and Acylcarnitine Profiles with Incident Reduced Glomerular Filtration Rate. Clin. J. Am. Soc. Nephrol. 2018, 13, 560–568. [Google Scholar] [CrossRef] [Green Version]
- Kordalewska, M.; Macioszek, S.; Wawrzyniak, R.; Sikorska-Wiśniewska, M.; Śledziński, T.; Chmielewski, M.; Mika, A.; Markuszewski, M.J. Multiplatform metabolomics provides insight into the molecular basis of chronic kidney disease. J. Chromatogr. B Analyt. Technol. Biomed. Life Sci. 2019, 1117, 49–57. [Google Scholar] [CrossRef] [PubMed]
- Nierenberg, J.L.; He, J.; Li, C.; Gu, X.; Shi, M.; Razavi, A.C.; Mi, X.; Li, S.; Bazzano, L.A.; Anderson, A.H.; et al. Novel associations between blood metabolites and kidney function among Bogalusa Heart Study and Multi-Ethnic Study of Atherosclerosis participants. Metabolomics 2019, 15, 149. [Google Scholar] [CrossRef] [PubMed]
- Titan, S.M.; Venturini, G.; Padilha, K.; Goulart, A.C.; Lotufo, P.A.; Bensenor, I.J.; Krieger, J.E.; Thadhani, R.I.; Rhee, E.P.; Pereira, A.C. Metabolomics biomarkers and the risk of overall mortality and ESRD in CKD: Results from the Progredir Cohort. PLoS ONE 2019, 14, e0213764. [Google Scholar] [CrossRef] [PubMed] [Green Version]
- Sun, C.Y.; Lin, C.J.; Pan, H.C.; Lee, C.C.; Lu, S.C.; Hsieh, Y.T.; Huang, S.Y.; Huang, H.Y. Clinical association between the metabolite of healthy gut microbiota, 3-indolepropionic acid and chronic kidney disease. Clin. Nutr. 2019, 38, 2945–2948. [Google Scholar] [CrossRef]
- Dekker, S.E.I.; Verhoeven, A.; Soonawala, D.; Peters, D.J.M.; de Fijter, J.W.; Mayboroda, O.A. Urinary metabolites associate with the rate of kidney function decline in patients with autosomal dominant polycystic kidney disease. PLoS ONE 2020, 15, e0233213. [Google Scholar] [CrossRef]
- Levey, A.S.; Perrone, R.D.; Madias, N.E. Serum Creatinine and Renal Function. Annu. Rev. Med. 1988, 39, 465–490. [Google Scholar] [CrossRef]
- Ichii, O.; Horino, T. MicroRNAs associated with the development of kidney diseases in humans and animals. J. Toxicol. Pathol. 2018, 31, 23–34. [Google Scholar] [CrossRef] [Green Version]
- Metzinger-Le Meuth, V.; Burtey, S.; Maitrias, P.; Massy, Z.A.; Metzinger, L. microRNAs in the pathophysiology of CKD-MBD: Biomarkers and innovative drugs. Biochim. Biophys. Acta Mol. Basis Dis. 2017, 1863, 337–345. [Google Scholar] [CrossRef]
- Shang, F.; Wang, S.C.; Hsu, C.Y.; Miao, Y.; Martin, M.; Yin, Y.; Wu, C.C.; Wang, Y.T.; Wu, G.; Chien, S.; et al. MicroRNA-92a Mediates Endothelial Dysfunction in CKD. J. Am. Soc. Nephrol. 2017, 28, 3251–3261. [Google Scholar] [CrossRef] [Green Version]
- Lv, W.; Fan, F.; Wang, Y.; Gonzalez-Fernandez, E.; Wang, C.; Yang, L.; Booz, G.W.; Roman, R.J. Therapeutic potential of microRNAs for the treatment of renal fibrosis and CKD. Physiol. Genom. 2018, 50, 20–34. [Google Scholar] [CrossRef]
- Peters, L.J.F.; Floege, J.; Biessen, E.A.L.; Jankowski, J.; van der Vorst, E.P.C. MicroRNAs in Chronic Kidney Disease: Four Candidates for Clinical Application. Int. J. Mol. Sci. 2020, 21, 6547. [Google Scholar] [CrossRef] [PubMed]
- Hsu, C.Y.; Ballard, S.; Batlle, D.; Bonventre, J.V.; Bottinger, E.P.; Feldman, H.I.; Klein, J.B.; Coresh, J.; Eckfeldt, J.H.; Inker, L.A.; et al. Cross-Disciplinary Biomarkers Research: Lessons Learned by the CKD Biomarkers Consortium. Clin. J. Am. Soc. Nephrol. 2015, 10, 894–902. [Google Scholar] [CrossRef] [PubMed]


| Year | Study Type | Study Population | Biomarker (s) | Study Outcomes | Reference |
|---|---|---|---|---|---|
| 2015 | Prospective cohort | 9703 participants from the ARIC | serum B2M | Greater than 30% decline in B2M may be less common, but appears to be more specific for ESRD than equivalent changes in eGFR based on serum creatinine | [24] |
| 2015 | Prospective cohort | 250 Pima Indians with T2D | serum BTP, B2M | BTP and to a lesser extent B2M were associated with ESRD; only higher serum concentrations of B2M were associated with increased mortality risk in this population | [22] |
| 2015 | Cross-sectional | 93 CKD patients at stages 1–5 | urinary klotho | Decreased tubular phosphate reabsorption was associated with decreased eGFR, but it was not associated with urinary klotho levels | [39] |
| 2016 | Cross-sectional | 355 CKD patients, classified in the different stages of CKD | urinary BTP | BTP is present in the urine of patients with normal GFR, and its urinary excretion progressively increases along with the reduction of GFR; clearance of BTP progressively increases with the reduction of GFR | [16] |
| 2016 | Cross-sectional | 109 CKD patients with T2D and 32 healthy controls | serum klotho | Serum klotho levels were significantly elevated in diabetic patients; klotho levels decreased with increasing albumin excretion | [33] |
| 2016 | Retrospective cohort | 3551 participants with CKD from MDRD, AASK and CRIC studies | serum BTP, B2M | BTP and B2M are less influenced by age, sex and race than creatinine and less influenced by race than cystatin C, but provide less accurate GFR estimates | [10] |
| 2016 | Prospective cohort | 3613 adults from the CRIC study | serum BTP, B2M | BTP and B2M were independent predictors of ESRD and all-cause mortality, but only B2M was an independent predictor cardiovascular events | [40] |
| 2017 | Prospective cohort | 2496 participants from the Health Aging and Body Composition study | serum klotho | Higher klotho levels were associated with lower odds of kidney function decline, but not with incident CKD | [41] |
| 2017 | Cross-sectional | 50 individuals with type 2 diabetes and 25 healthy controls | serum BTP | BTP level was significantly higher in T2Dwith the microalbuminuria group than T2DM with normoalbuminuria and control groups | [18] |
| 2017 | Cross-sectional | 566 individuals aged 70+ from the Berlin Initiative Study | serum BTP | Combination of creatinine, cystatin C and BTP showed the best prediction of GFR; single usage of BTP showed the worst prediction within models with only one biomarker | [42] |
| 2017 | Prospective cohort | 317 participants from MDRD and 373 from AASK | serum BTP, B2M | Declines in eGFR based on the average of four filtration markers (creatinine, cystatin C, BTP, and B2M) were consistently associated with progression to ESRD; only the decline in eGFR-BTP was significantly more strongly associated with ESRD risk | [23] |
| 2017 | Meta-analysis | 23,318 individuals from six different studies | serum BTP, B2M | eGFR-BTP, eGFR-B2M, and their average showed stronger risk associations with ESRD and all-cause mortality when compared with eGFRcr | [27] |
| 2017 | Cross-sectional | Elderly participants from the AGES-Kidney study (683) and the MESA-Kidney (273) | serum BTP, B2M | eGFR-cys, eGFR-B2M and eGFR-BTP had significantly less strong residual associations with age and sex than eGFRcr | [11] |
| 2018 | Cross-sectional | 125 maintenance hemodialysis patients | serum klotho | Klotho levels were associated with the degree of bone mineral density; osteoporosis groups presented lower levels than the normal bone mass group | [37] |
| 2018 | Prospective cohort | 112 adults with stages 1–5 CKD | serum klotho | Klotho levels were positively associated with baseline eGFR; reduction in klotho levels was associated with renal function decline | [31] |
| 2018 | Cross-sectional | 150 patients with CKD at stages 1–4 and 50 healthy controls | serum BTP | Increased BTP concentrations in CKD patients are highly significantly correlated with the concentrations of Cr and Cys; BTP had a higher value of correlation with mGFR | [17] |
| 2018 | Systematic review and meta-analysis | 9 publications, comprising 1457 CKD patients | serum klotho | There was a positive correlation between serum klotho levels and eGFR; no significant correlations were found between serum klotho levels and calcium and phosphorus circulating levels | [32] |
| 2018 | Cross-sectional | 566 individuals aged 70+ from the Berlin Initiative Study | serum BTP | The addition of BTP to serum creatinine-based eGFR equations does not result in the same improvement as the addition of Cys | [25] |
| 2018 | Cross-sectional | 50 healthy term neonates | serum BTP | BTP concentrations were positively associated with the concentrations of serum Cr level; inverse serum BTP is associated with estimated GFR level among neonates | [43] |
| 2019 | Prospective cohort | 86 adults with stable CKD | serum BTP, B2M | The addition of BTP/B2M eGFR to Cr/cysC eGFR equations did not improve GFR estimation | [26] |
| 2019 | Systematic Review and Meta-analysis | 8 cohort studies with 3586 participants | serum klotho | Klotho levels were positively correlated with the eGFR; lower klotho levels were significantly associated with an increased risk of poor kidney outcomes | [44] |
| 2019 | Prospective cohort | 107 diabetic patients with CKD at stages 2 and 3 | serum klotho | Lower levels of klotho were associated with cardiac pathological changes and higher CVD risk | [34] |
| 2019 | Prospective cohort | 79 CKD patients on hemodialysis | serum klotho | Lower klotho levels were associated with the risk of CVD, independently from factors associated with mineral bone disease | [35] |
| 2019 | Cross-sectional | 286 CKD patients at stages 2–5 | serum klotho | The serum levels of inflammatory markers were negatively associated with klotho levels | [36] |
| 2019 | Cross-sectional | 152 patients with CKD at stages 3–5 and 30 healthy controls | serum klotho | eGFR reduction was associated with decreased klotho levels; serum phosphate levels were negatively associated with klotho levels | [38] |
| 2020 | Cross-sectional | 1066 participants with Cr and Cys and 666 with all 4 markers | serum BTP, B2M | eGFR-B2M and eGFR-BTP were not more accurate than eGFR-cr and eGFR-cys; accuracy was significantly better for the eGFR equation considering the four markers when compared to eGFRcr-cys equation | [15] |
| 2020 | Prospective cohort | 830 Chinese CKD patients | serum B2M | The B2M equation had smaller bias in the subgroup of GFR 60–89 mL/min/1.73 m2, but a larger bias and worse precision and accuracy in the subgroup of GFR > 90 mL/min/1.73 m2 when compared to the CKD-EPI equation | [45] |
| 2020 | Cross-sectional | 1793 patients from the KNOW-CKD study | serum klotho | Decreased klotho levels correlated negatively with phosphate levels and with the degree of proteinuria | [46] |
| Year | Study Type | Study Population | Biomarker (s) | Study Outcomes | Reference |
|---|---|---|---|---|---|
| 2015 | Prospective cohort | 1245 women aged ≥ 70 from the general population | plasma NGAL | NGAL is of modest clinical utility in predicting renal function decline and acute or chronic renal disease-related events in individuals with mild-to-moderate CKD | [71] |
| 2015 | Cross-sectional | 276 type 2 diabetic patients with CKD at stage 1 and 2 | urinary L-FABP | Urinary L-FABP was significantly correlated with UACR in the early stages of CKD | [66] |
| 2015 | Prospective cohort | 138 patients with CHF | urinary KIM-1, NGAL, NAG | In patients with CKD progression, KIM-1 and NAG were elevated in contrast to NGAL; KIM-1 and NAG were negatively correlated with ejection fraction and eGFR | [58] |
| 2016 | Cross-sectional | 355 patients with CKD at stages 1–5 and 71 patients without CKD | plasma and urinary UMOD | UMOD allowed the identification of patients without CKD and patients at any stage of CKD; Plasma UMOD appears to outperform urinary uromodulin as a CKD marker | [69] |
| 2016 | Prospective cohort | 244 adult patients with CKD | urinary NAG, L-FABP | Elevated urinary L-FABP and low eGFR were associated with the development of ESRD and CVD, irrespective of diabetes | [65] |
| 2016 | Cross-sectional | 170 patients with CKD at stages 1 to 5 and 30 healthy individuals | serum UMOD | Serum UMOD concentrations in CKD patients were lower than in healthy subjects, and the lower concentrations were associated with more advanced stages | [68] |
| 2017 | Case–control | 74 adult CKD patients (stages 3–5) and 25 healthy subjects | urinary L-FABP | L-FABP shows a negative correlation with GFR and a positive correlation with UAC; in patients without albuminuria, L-FABP was associated with renal function decline | [64] |
| 2017 | Prospective cohort | 250 patients with CKD at stages 1–5, including 111 on hemodialysis | urinary KIM-1, NGAL, NAG | NGAL was moderately correlated with the 5 stages of CKD, while KIM-1 and NAG were also correlated, but weakly | [59] |
| 2018 | Cross-sectional | 80 patients with T2D without significant decrease in eGFR and albuminuria | urinary NGAL, KIM-1, UMOD | Urinary NGAL and KIM-1 correlated positively with albuminuria; all markers differed significantly between patients with moderately increased albuminuria compared to those with normal to mildly increased albuminuria | [55] |
| 2018 | Prospective cohort | 2813 patients from C-STRIDE study | serum UMOD | Higher incidence rates of ESRD, CVD and death were associated with decreased UMOD levels | [72] |
| 2018 | Cross-sectional | 132 patients with CKD at stages 1–5 and 33 patients without CKD | serum UMOD | UMOD levels inversely correlated with creatinine and creatinine/cystatin C-based eGFR | [70] |
| 2018 | Case–control | 324 participants from the SPRINT trial (162 who developed CKD during the follow-up and 162 matched controls) | urinary KIM-1, NGAL, UMOD | Only baseline concentrations of KIM-1 were associated with the development of incident CKD during the follow-up | [54] |
| 2018 | Prospective cohort | 527 adults with type 1 diabetes from the CACTI study | plasma KIM-1, NGAL, UMOD | NGAL and UMOD were associated with UACR and incident impaired GFR over the 12-year follow-up period | [56] |
| 2018 | Prospective cohort | 143 patients with stable CKD with diverse etiologies | urinary NGAL, KIM-1 | Neither NGAL nor KIM-1 provided robust prognostic information on the loss or renal function in a heterogeneous CKD population | [73] |
| 2018 | Cross-sectional | 109 biopsy-proven lupus nephritis patients and 50 healthy individuals | urinary NGAL, KIM-1 | Patients with active lupus nephritis exhibited elevated urinary levels of KIM-1 and NGAL compared with patients in remission and controls; KIM-1 levels correlated with tubular atrophy and interstitial inflammatory lesions | [74] |
| 2019 | Prospective cohort | 230 CKD patients stages 1 to 5 | urinary UMOD | UMOD concentrations were positively associated with eGFR and inversely associated with proteinuria; UMOD levels were independently associated with ESRD or rapid loss of eGFR | [75] |
| 2019 | Prospective cohort | 933 individuals aged ≥65 years from the CHS study | serum UMOD | Lower UMOD was associated with the development of ESRD independently of eGFR, UACR, and cardiovascular and CKD risk factors | [76] |
| 2019 | Cross-sectional | 39 children with kidney cysts, including 20 subjects with ADPKD, and 20 controls | urinary and serum L-FABP | Higher concentration of L-FABP in serum and urine indicated early damage to the renal parenchyma, detectable before the onset of hypertension and other organ damage | [77] |
| 2019 | Cross-sectional | 165 biopsy-proven CKD patients and 64 healthy controls | urinary NAG, KIM-1, NGAL | All biomarkers were significantly increased in patients, but their values were similar for patients with moderate and severe tubular injury | [78] |
| 2019 | Systematic review and meta-analysis | 22 studies involving 683 healthy individuals and 3249 diabetic patients | serum and urinary NGAL | Both urinary and serum NGAL showed an increasing trend, in parallel with albuminuria and progression of the disease, estimated by eGFR; the highest concentrations were achieved in patients with the highest severity of diabetic nephropathy | [52] |
| 2019 | Cross-sectional | 209 T2D normoalbuminuric patients with or without CKD | urinary NGAL | Levels of urinary NGAL were elevated in patients with renal insufficiency and negatively related to eGFR in T2D patients with normoalbuminuria | [79] |
| 2019 | Prospective cohort | 2377 participants from SPRINT trial with non-diabetic CKD | urinary UMOD | Lower uromodulin levels were associated with higher risk of CVD events and mortality, independently of eGFR, UACR, and other risk factors | [80] |
| 2019 | Cross-sectional | 287 T2D patients and 42 healthy controls | urinary NGAL | Urinary NGAL was significantly correlated with the UACR in patients with T2D | [81] |
| 2020 | Cross-sectional | 133 patients with diabetes and 39 healthy controls | urinary NGAL | Patients with severely increased albuminuria had higher levels of NGAL compared to patients with normal albuminuria and controls | [51] |
| 2020 | Prospective cohort | 4739 participants of the population-based Malmö Diet and Cancer Study | plasma KIM-1 | Plasma KIM-1 was able to predict the future decline of eGFR and the risk of CKD in healthy participants | [82] |
| Year | Study Type | Study Population | Biomarker (s) | Study Outcomes | Reference |
|---|---|---|---|---|---|
| 2015 | Cross-sectional | 201 patients with CKD and 201 controls | plasma ADMA | Plasma ADMA levels were associated with CKD severity measured by eGFR and/or albuminuria | [104] |
| 2016 | Prospective cohort | 259 patients with CKD at stages 1–5 | serum ADMA | Patients with ADMA levels above the median value had an increased risk of all-cause mortality and CVE | [105] |
| 2016 | Cross-sectional | 35 pre-dialysis CKD patients, 40 on hemodialysis, and 15 healthy subjects | plasma ADMA | Plasma ADMA concentration was associated with disadvantageous changes in left ventricular structure and function | [93] |
| 2016 | Prospective cohort | 463 individuals with CKD at stages 3–5 from the CRISIS Study | plasma fetuin-A | There was no clear association between fetuin-A and risk for RRT, CVE, and death | [106] |
| 2018 | Prospective cohort | 528 adult CKD patients at stages 2–4 | plasma ADMA | eGFR was inversely correlated with plasma levels of ADMA | [107] |
| 2018 | Systematic review and meta-analysis | 6 articles, involving 616 CKD patients | plasma ADMA | Levels of circulating ADMA were positively related to CIMT in CKD patients | [92] |
| 2018 | Prospective cohort | 162 hypertensive CKD patients, free from albuminuria | plasma ADMA | High ADMA levels were associated with the progression of albuminuria in hypertensive patients, with and without type 2 diabetes | [85] |
| 2019 | Cross-sectional | 651 elderly subjects from KSHAP cohort study | plasma ADMA | eGFR levels were inversely associated with ADMA concentrations | [91] |
| 2019 | Cross-sectional | 176 CKD patients and 64 control subjects | plasma ADMA | Plasma ADMA levels were similar in the control group and stage 1 CKD patients; in other stages, ADMA levels were significantly higher in comparison to the control subjects | [84] |
| 2019 | Systematic review and meta-analysis | 13 studies comprising 5169 CKD patients | serum fetuin-A | CKD patients with the lowest fetuin-A levels had a 92% greater risk of all-cause mortality compared with those with the highest levels | [98] |
| 2019 | Cross-sectional | 238 CKD patients (stages 3–5) | serum fetuin-A | Fetuin-A levels in ESRD patients were significantly lower than those from patients at stages 3 and 4 CKD; fetuin-A was negatively correlated with vascular calcification score and CIMT | [97] |
| 2020 | Cross-sectional | 43 adult patients with CKD and 43 healthy controls | plasma ADMA | Levels of ADMA positively correlate with CKD severity; FMD was significantly decreased in CKD patients, and negatively correlated with ADMA levels | [86] |
| Year | Study Type | Study Population | Biomarker (s) | Study Outcomes | Reference |
|---|---|---|---|---|---|
| 2016 | Prospective cohort | 746 individuals with GFR > 60mL/min/1.73 m2 | serum PTX3 | Higher PTX3 levels are associated with lower GFR and independently predict incident CKD in the elderly | [121] |
| 2016 | Prospective cohort | 3430 patients with reduced eGFR from the CRIC study | plasma IL-6, TNF-α | Elevated plasma levels of TNF-α were associated with rapid loss of kidney function in CKD patients | [108] |
| 2016 | Prospective cohort | 543 patients with stage 5 CKD | plasma IL-6, TNF- α | IL-6 and TNF-a could predict all-cause mortality risk; only IL-6 could classify clinical CVD | [112] |
| 2017 | Prospective cohort | 521 adults with CKD from the C-PROBE and the SKS studies | plasma or serum GDF-15 | Circulating GDF-15 levels were strongly correlated with intrarenal expression of GDF15 and significantly associated with increased risk of CKD progression | [124] |
| 2017 | Prospective cohort | 984 CKD patients stages 1–5 | serum TNFR1, TNFR2 | TNFR1 and 2 were associated with CVD and other risk factors in CKD, independently of eGFR | [117] |
| 2017 | Cross-sectional | 1816 community residents randomly selected from the Dong-gu study | plasma PTX3 | A significantly higher risk of CKD was found in the group with the highest plasma levels of PTX3 when compared to the group with the lowest levels | [136] |
| 2017 | Prospective cohort | 78 stage 5 CKD patients (51 on hemodialysis and 27 on pre-dialysis) | serum PTX3, IL-6, CRP | In contrast to CRP levels, baseline PTX3 levels predicted CV mortality independently of classic CV risk factors; PTX3 levels also significantly predicted mortality | [123] |
| 2017 | Prospective cohort | 39 ESRD patients under HD and 15 healthy controls | serum cfDNA | ESRD patients had a significantly higher value when compared to controls; cfDNA correlated positively with CRP levels in ESRD patients | [132] |
| 2018 | Prospective cohort | 883 adults at any stage CKD from the SKS or the C-PROBE studies | serum GDF-15 | Adults with CKD and higher circulating levels of GDF-15 presented greater mortality; elevated GDF-15 was also associated with an increased rate of HF | [126] |
| 2018 | Prospective cohort | 200 patients with T2D | plasma GDF-15 | Higher GDF-15 improved risk prediction of decline in kidney function; in patients with T2D and microalbuminuria, higher GDF-15 was independently associated with all-cause mortality | [137] |
| 2018 | Cross-sectional | 201 patients with CKD and 201 controls | plasma PTX3 | Plasma PTX3 levels were increased in patients with CKD when compared to controls | [138] |
| 2019 | Prospective cohort | 3664 participants with CKD from the CRIC study | plasma GDF-15 | GDF-15 was significantly associated with an increased risk of CKD progression | [125] |
| 2019 | Prospective cohort | 57 CKD patients at stages 3–5 and 19 healthy controls | serum IL-6, TNF- α | TNF and IL-6 were significantly higher in more advanced CKD stages; IL-6, but not TNF- α, was associated with 5-year risk of all-cause mortality in CKD patients | [114] |
| 2019 | Prospective cohort | 318 ESRD patients, undergoing HD and 22 healthy controls | plasma PTX3, IL-6, TNF- α, CRP | When comparing inflammatory mediators, the increase in PTX3 levels was the only predictor of all-cause mortality in dialysis patients | [122] |
| 2019 | Prospective cohort | 124 patients with CKD (stages 1–5) | plasma and urinary cfDNA | No correlations were found between cfDNA levels and CKD staging; higher urinary levels of cfDNA were associated with worse renal outcomes at 6 months | [133] |
| 2020 | Cross-sectional | 219 adult CKD patients (stages 2–5) from the GCKD study | plasma GDF-15 | GDF-15 was significantly elevated in CKD patients and showed a significant inverse correlation with eGFR | [127] |
| 2020 | Cross-sectional | 117 T2D patients and 11 healthy controls | serum and urinary IL-8, IL-18 | Serum and urinary levels of IL-8 and IL-18 were positively correlated with podocyte damage, peritubular dysfunction, and albuminuria, and negatively correlated with eGFR | [115] |
| 2020 | Prospective cohort | 2428 SPRINT participants with CKD | urinary IL-18 | Urinary IL-18 was associated with eGFR decline and may help to detect subtle changes in eGFR | [116] |
| 2020 | Prospective cohort | 160 patients with DN | serum cfDNA | Serum cfDNA levels were significantly negatively associated with the eGFR changes during the follow-up | [134] |
| Year | Study Type | Study Population | Study Outcomes | Reference |
|---|---|---|---|---|
| 2016 | Cross-sectional | 27 patients with CKD at stages 3–5 | Kidney function decline was associated with an increase in the inflammation marker neopterin and the metabolism of tryptophan via the kynurenine pathway | [156] |
| 2016 | Prospective cohort | 118 patients with CKD at stages 3–5 | Sixteen metabolites, from variable metabolic pathways, were related to higher risk of kidney function deterioration in advanced CKD patients | [157] |
| 2016 | Case–control | 200 patients with rapid renal disease progression and 200 stable controls | Ten metabolites were associated with CKD progression; six (uric acid, glucuronate, 4-hydroxymandelate, 3-methyladipate/pimelate, cytosine, and homogentisate) were higher in cases than controls, whereas four (threonine, methionine, phenylalanine, and arginine) were lower | [158] |
| 2016 | Prospective cohort | 1735 participants in the KORA F4 study | Six metabolites (N-acetylalanine, N-acetylcarnosine, C-mannosyltryptophan, erythronate, pseudouridine, and O-sulfo-L-tyrosine) were associated with eGFR and CKD in both studies and showed high correlation with established kidney function markers | [159] |
| 1164 individuals in the TwinsUK registry | ||||
| 2016 | Cross-sectional | 291 pre-dialysis CKD patients and 56 healthy controls | The presence of diabetes affects the metabolic phenotypes of CKD patients at an early stage, and those differences are attenuated with CKD progression | [139] |
| 2017 | Case–control | 193 patients with incident CKD from the Framingham Study and 193 matched controls | Lower urinary levels of glycine and histidine were associated with a higher risk of incident CKD; moreover, the authors identified several novel associations with urinary metabolites and genetic variations | [140] |
| 2017 | Cross-sectional | 60 T2D patients with all stages of CKD from the FIND study | Tryptophan levels were inversely correlated with CKD staging, while its metabolites were positively associated with the severity of kidney disease; kynurenine was positively correlated with TNF-a levels | [144] |
| 2017 | Cross-sectional | 589 CKD patients from the MDRD study | Five metabolite associations (kynurenate, homovanillate sulfate, hippurate, N2,N2-dimethylguanosine, and 16-hydroxypalmitate) showed consistently higher levels in ADPKD compared with glomerular disease and CKD of other causes | [147] |
| 2017 | Cross-sectional | 22 non-diabetic CKD stage 3–4 patients and 10 healthy controls | Urinary levels of 27 metabolites and plasma concentration of 33 metabolites differed significantly in CKD patients compared to controls; the citric acid cycle pathway was the most affected, with reduced urinary excretion of citrate, cis-aconitate, isocitrate, 2-oxoglutarate and succinate | [150] |
| 2017 | Cross-sectional | 20 CKD patients at stage 3 and 20 at stage 5, and 20 healthy controls | Glycoursodeoxycholic acid and 2-hydroxyethane sulfonate were downregulated in the urine of patients, and pregnenolone sulfate was also found to be decreased in plasma when compared to controls | [160] |
| 2018 | Prospective cohort | 56 Brazilian macroalbuminuric CKD patients | Lower levels of 1,5-AG, norvaline and l-aspartic acid were significantly associated with the risk of a combined outcome of mortality, dialysis need or creatinine doubling | [148] |
| 2018 | Retrospective cohort | 227 patients with CKD and a nested subgroup of 57 for follow up | Eleven metabolites from various metabolic pathways were associated with reduced eGFR; increased urinary concentrations of betaine and myo-inositol were found to be prognostic markers of CKD progression | [161] |
| 2018 | Prospective cohort | 299 CKD patients from the MDRD study and 963 from the AASK cohort | Serum metabolites fumarate, allantoin, and ribonate were associated with a higher risk of mortality in two cohorts of patients with CKD | [146] |
| 2018 | Prospective cohort | 1765 Chinese adults with eGFR ≥ 60 mL/min per 1.73 m2 | Elevated plasma levels of cysteine and several acylcarnitines were associated with eGFR reduction, independent of baseline eGFR and other conventional risk factors | [162] |
| 2019 | Cross-sectional | 587 adults with all stages of CKD and 116 healthy controls | Five serum metabolites (5-MTP, canavaninosuccinate, acetylcarnitine, tiglylcarnitine and taurine) were identified to estimate kidney filtration and enhance earlier CKD prediction | [141] |
| 2019 | Prospective cohort | 1582 participants from the AASK and MDRD studies | The serum metabolites 4-hydroxychlorthalonil and 1,5-AG and the phosphatidylethanolamine metabolic pathway were strongly associated with proteinuria in CKD | [149] |
| 2019 | Cross-sectional | 30 patients with CKD at stages 3 and 4 and 30 healthy volunteers | More significant changes in acylcarnitines, carbohydrates (such as glucose and myo-inositol), and glycerophospholipid metabolism pathways were found in CKD patients than in controls | [163] |
| 2019 | Retrospective cohort | 214 CKD patients from the CPROBE and 200 from the CRIC studies | In CKD patients, changes in the triacylglycerols and cardiolipins-phosphatidylethanolamines preceded the clinical outcomes of ESRD by several years | [145] |
| 2019 | Cross-sectional | 1243 participants from the BHS and 260 from the MESA studies | This study identified 39 novel metabolites in sub-pathways previously associated with kidney function, and 12 novel metabolites in sub-pathways with novel associations | [164] |
| 2019 | Retrospective cohort | 454 patients with CKD at stages 3 and 4 from the Progredir Cohort Study | D-malic acid, acetohydroxamic acid, butanoic acid, ribose, glutamine, trans-aconitic acid, lactose and an unidentified molecule (m/z 273) were positively related to the risk of overall mortality, while docosahexaenoic acid was inversely related to this risk; lactose, 2-O-glycerol-α-d-galactopyranoside, and tyrosine were associated with ESRD progression | [165] |
| 2019 | Cross-sectional | 140 CKD patients and 144 healthy subjects | CKD patients presented significantly lower serum levels of 3-indolepropionic acid and higher serum levels of indoxyl sulfate and p-cresol sulfate when compared to controls | [166] |
| 2020 | Prospective cohort | 1741 subjects from the Ansan-Ansung population study | Researchers found 22 metabolites associated with eGFR and CKD prevalence; citrulline, kynurenine, and the kynurenine/tryptophan ratio were associated with incident CKD | [142] |
| 2020 | Prospective cohort | 184 patients with CKD at stages 1–5 from the CPROBE study | Kynurenic acid, 3-hydroxykynurenine and kynurenine were increased with CKD stage progression; higher tryptophan levels at baseline were associated with lower odds of incident CVD | [143] |
| 2020 | Prospective cohort | 501 patients with ADPKD, with different stages of CKD | Four urinary metabolites (myo-inositol, 3-hydroxyisovalerate, ADMA and creatinine) were strongly associated with baseline eGFR; the urinary alanine/citrate ratio showed the best association with eGFR decline | [167] |
Publisher’s Note: MDPI stays neutral with regard to jurisdictional claims in published maps and institutional affiliations. |
© 2020 by the authors. Licensee MDPI, Basel, Switzerland. This article is an open access article distributed under the terms and conditions of the Creative Commons Attribution (CC BY) license (http://creativecommons.org/licenses/by/4.0/).
Share and Cite
Lousa, I.; Reis, F.; Beirão, I.; Alves, R.; Belo, L.; Santos-Silva, A. New Potential Biomarkers for Chronic Kidney Disease Management—A Review of the Literature. Int. J. Mol. Sci. 2021, 22, 43. https://0-doi-org.brum.beds.ac.uk/10.3390/ijms22010043
Lousa I, Reis F, Beirão I, Alves R, Belo L, Santos-Silva A. New Potential Biomarkers for Chronic Kidney Disease Management—A Review of the Literature. International Journal of Molecular Sciences. 2021; 22(1):43. https://0-doi-org.brum.beds.ac.uk/10.3390/ijms22010043
Chicago/Turabian StyleLousa, Irina, Flávio Reis, Idalina Beirão, Rui Alves, Luís Belo, and Alice Santos-Silva. 2021. "New Potential Biomarkers for Chronic Kidney Disease Management—A Review of the Literature" International Journal of Molecular Sciences 22, no. 1: 43. https://0-doi-org.brum.beds.ac.uk/10.3390/ijms22010043