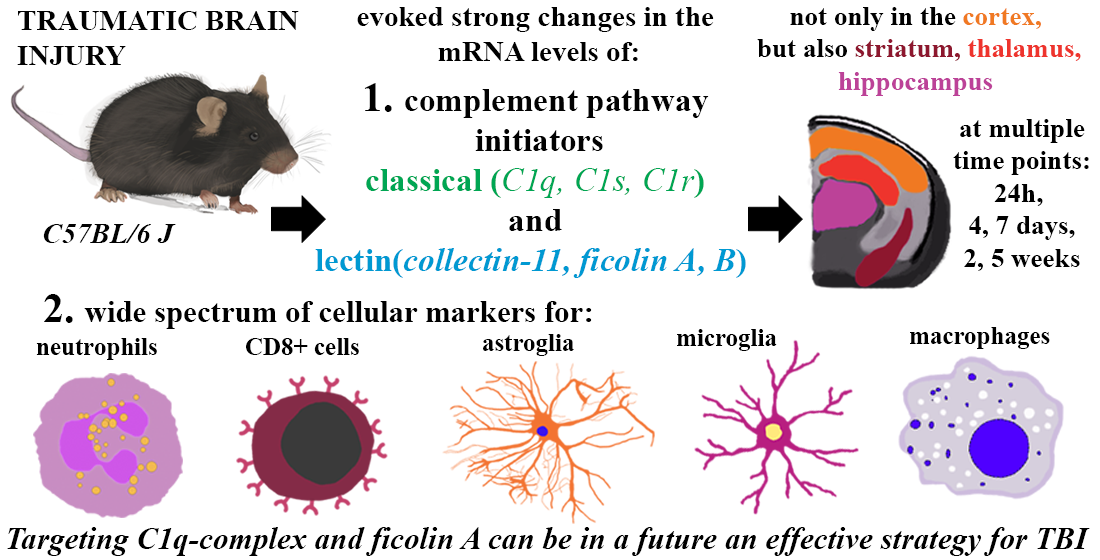
Initiators of Classical and Lectin Complement Pathways Are Differently Engaged after Traumatic Brain Injury—Time-Dependent Changes in the Cortex, Striatum, Thalamus and Hippocampus in a Mouse Model

 , ,
, ,
Abstract
: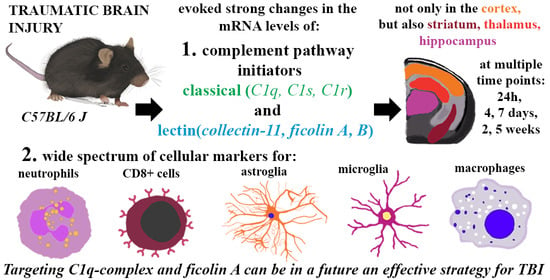
1. Introduction
2. Results
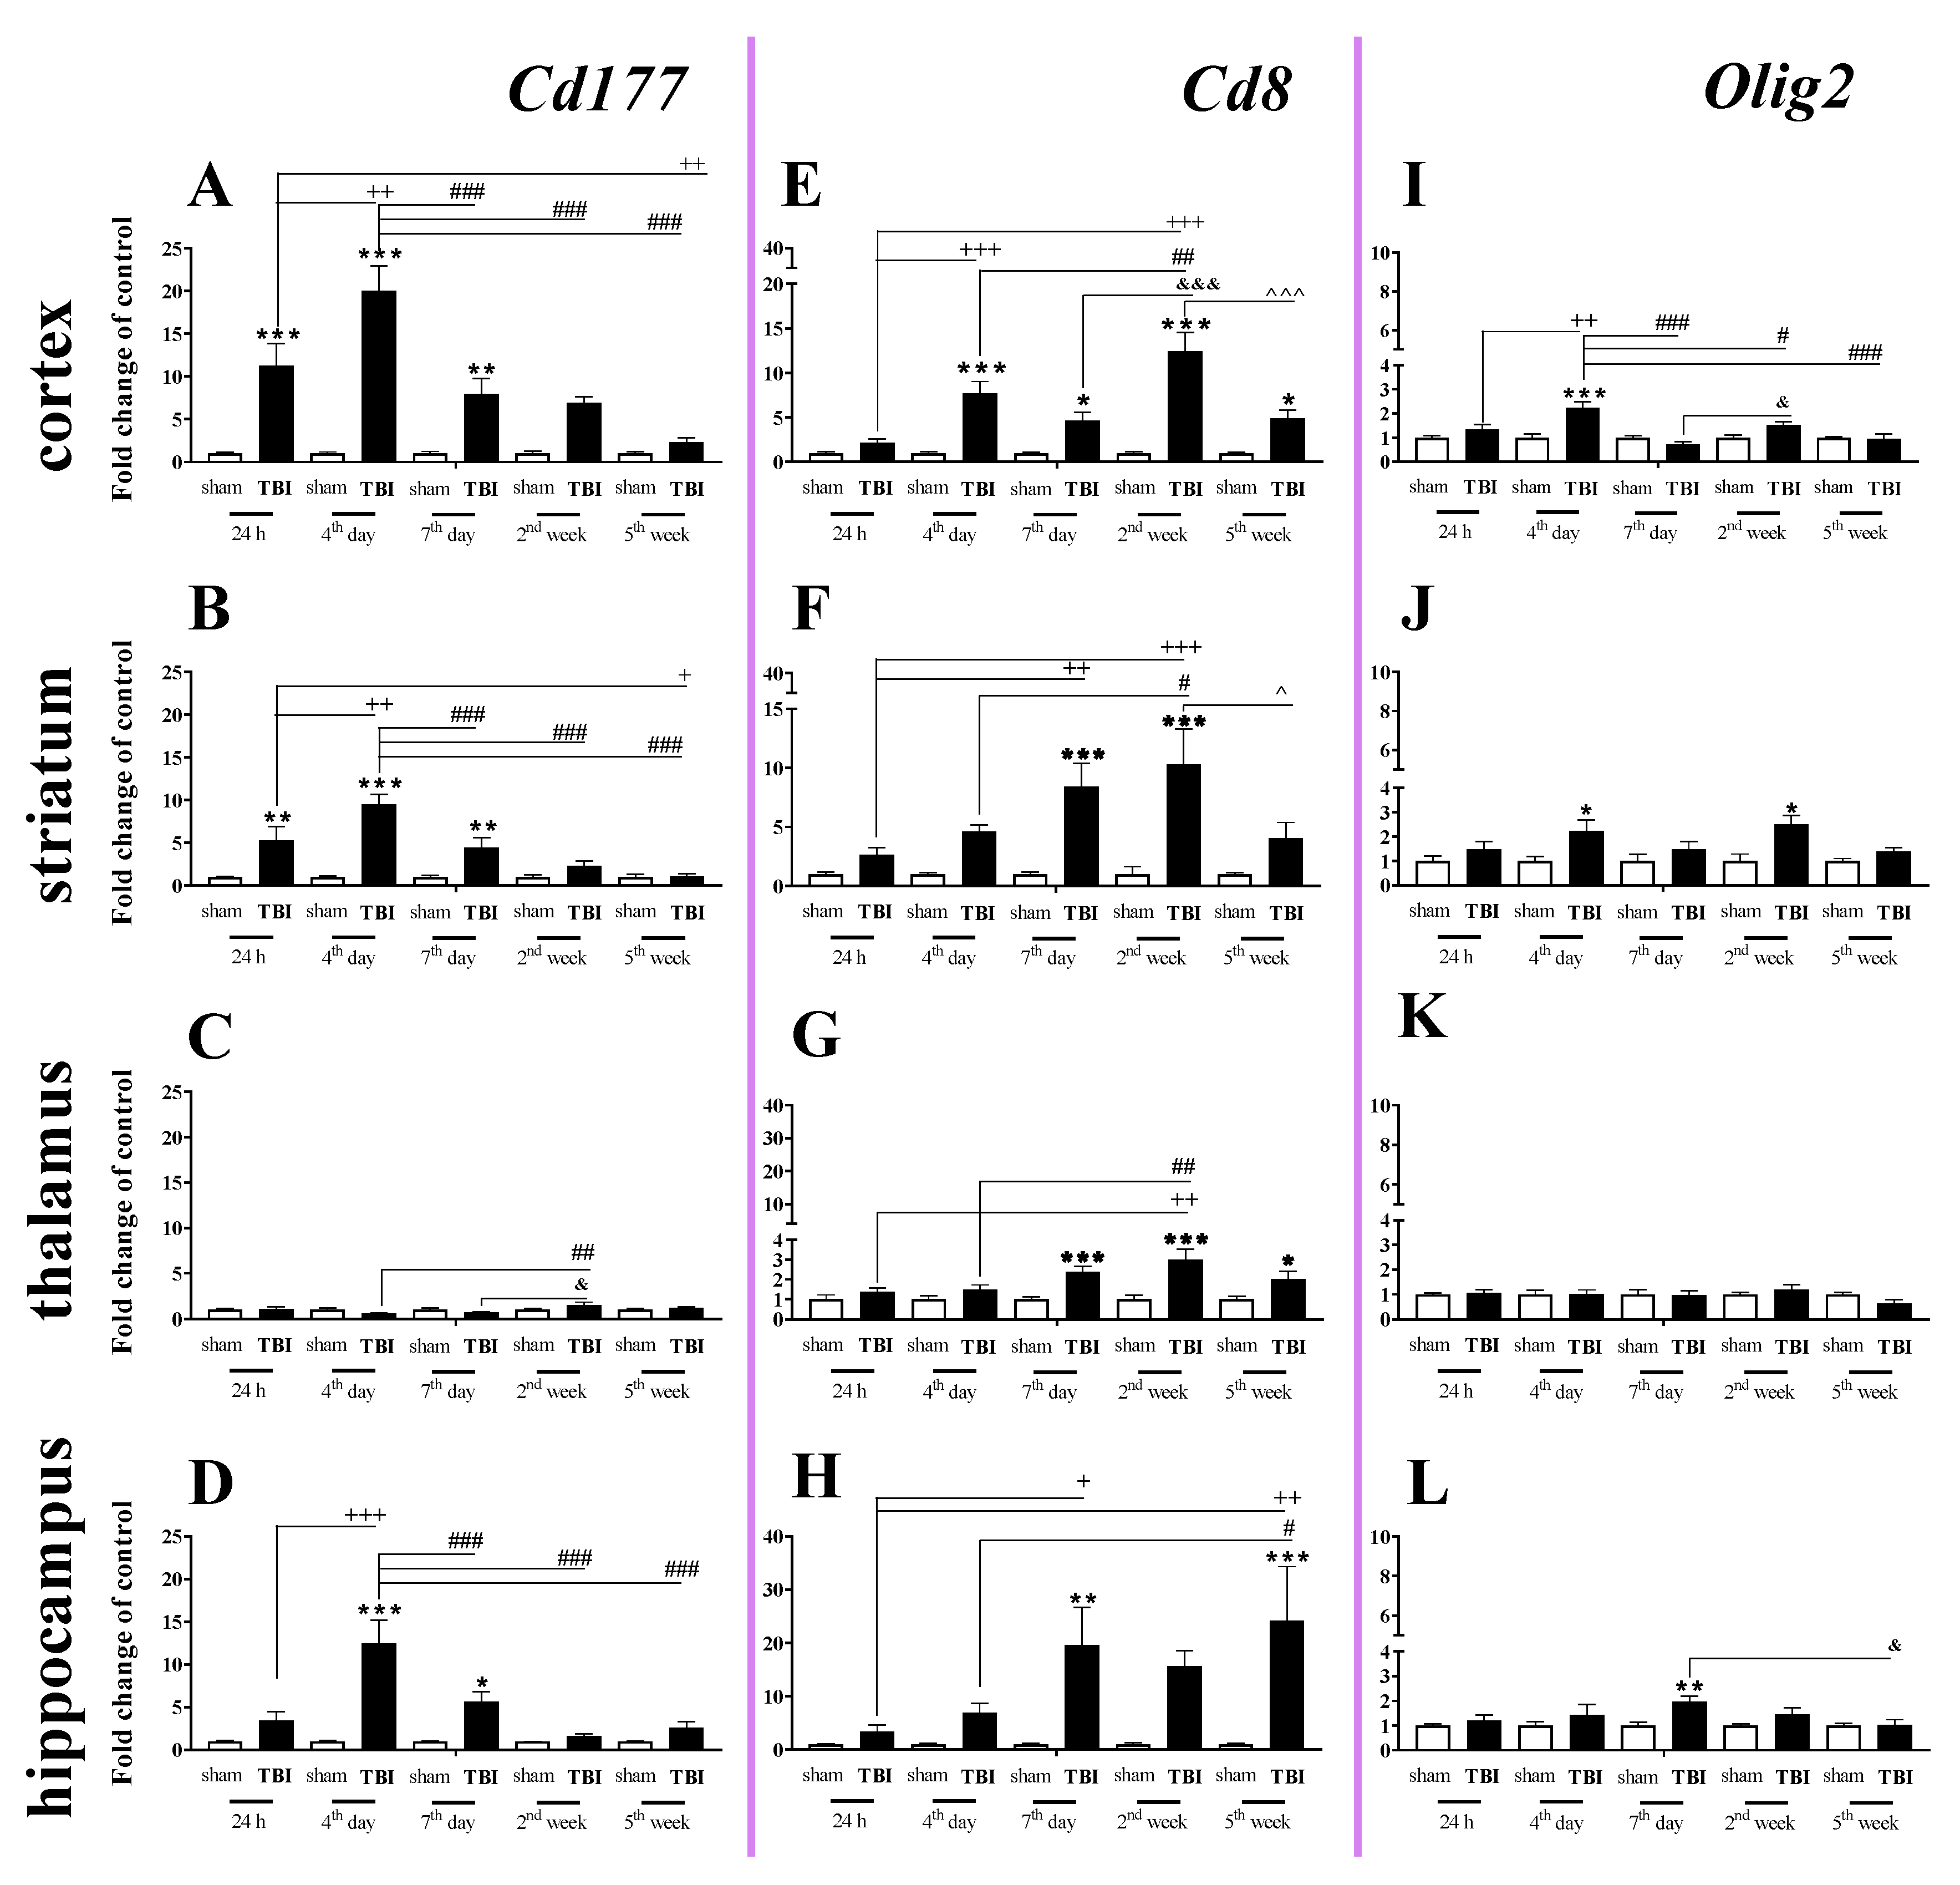
2.1. Time-Dependent Study of Cd177, Cd8 and Olig2 mRNA Expression in the Cortex, Striatum, Thalamus, and Hippocampus after TBI in Mice
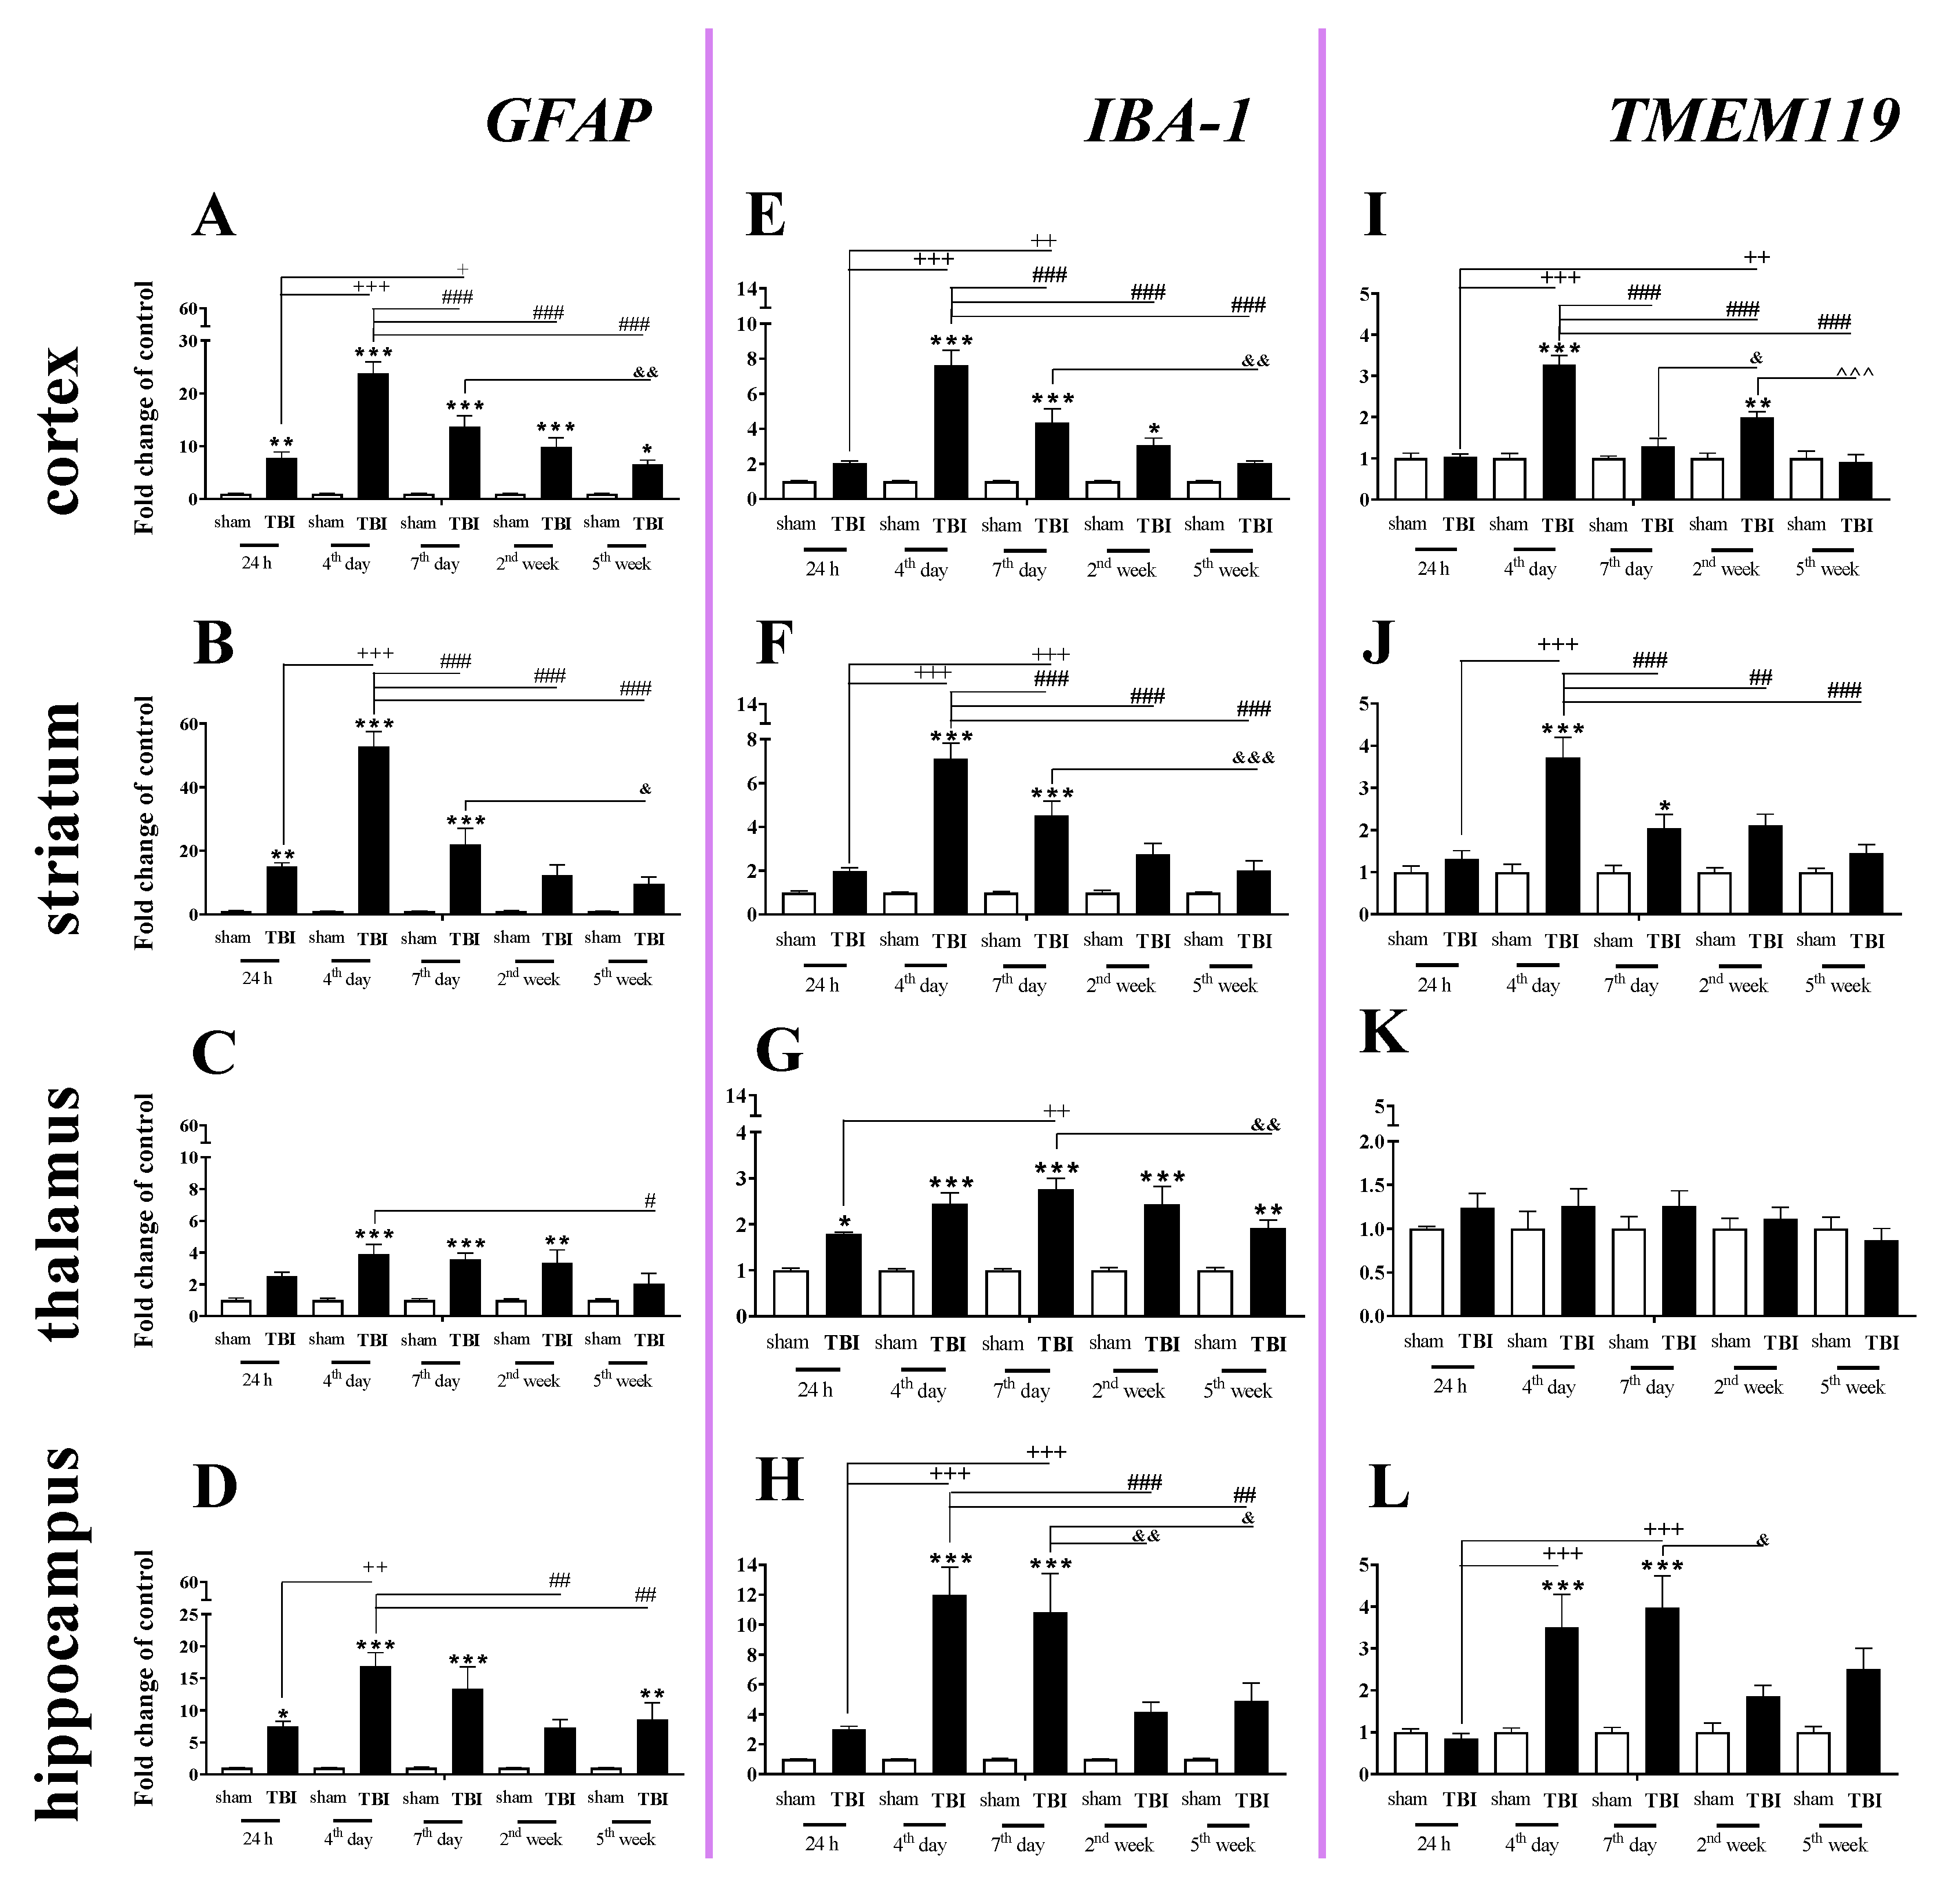
2.2. Time-Dependent Study of GFAP, IBA-1 and TMEM119 mRNA Expression in the Cortex, Striatum, Thalamus, and Hippocampus after TBI in Mice
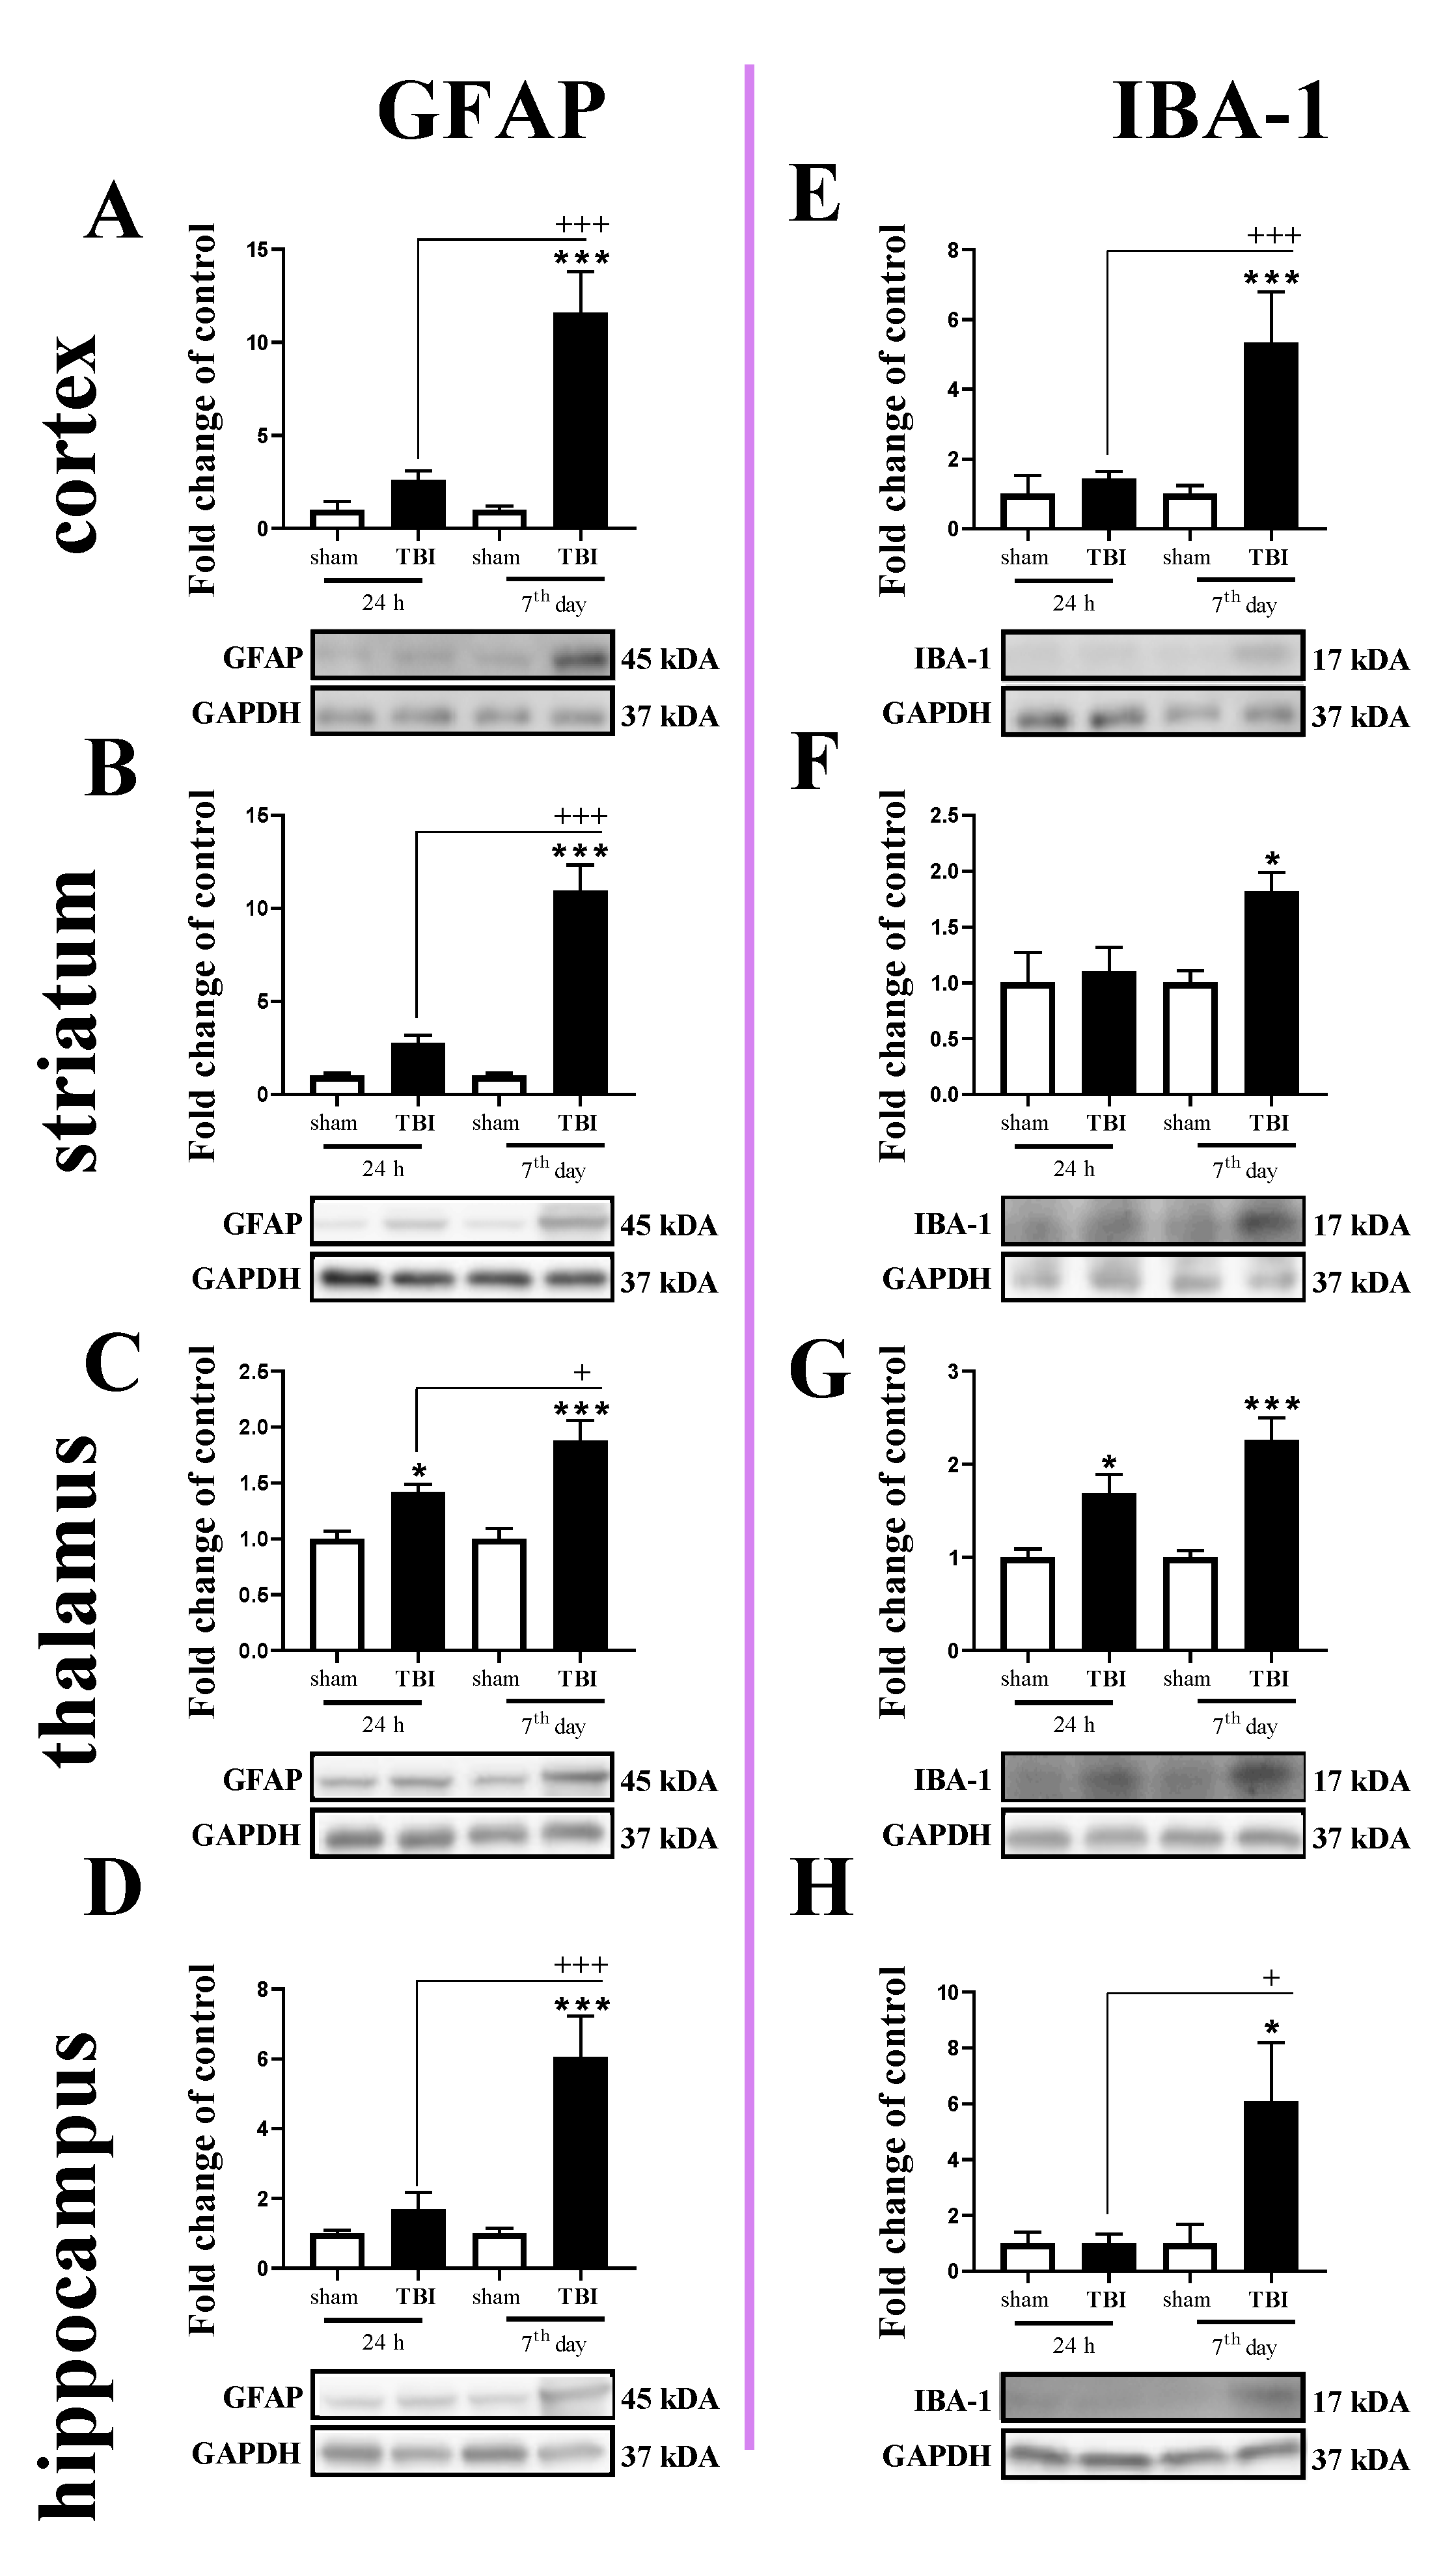
2.3. Study of GFAP and IBA-1 Protein Levels in the Cortex, Striatum, Thalamus, and Hippocampus of TBI or Sham-Injured Mice at Selected Time Points
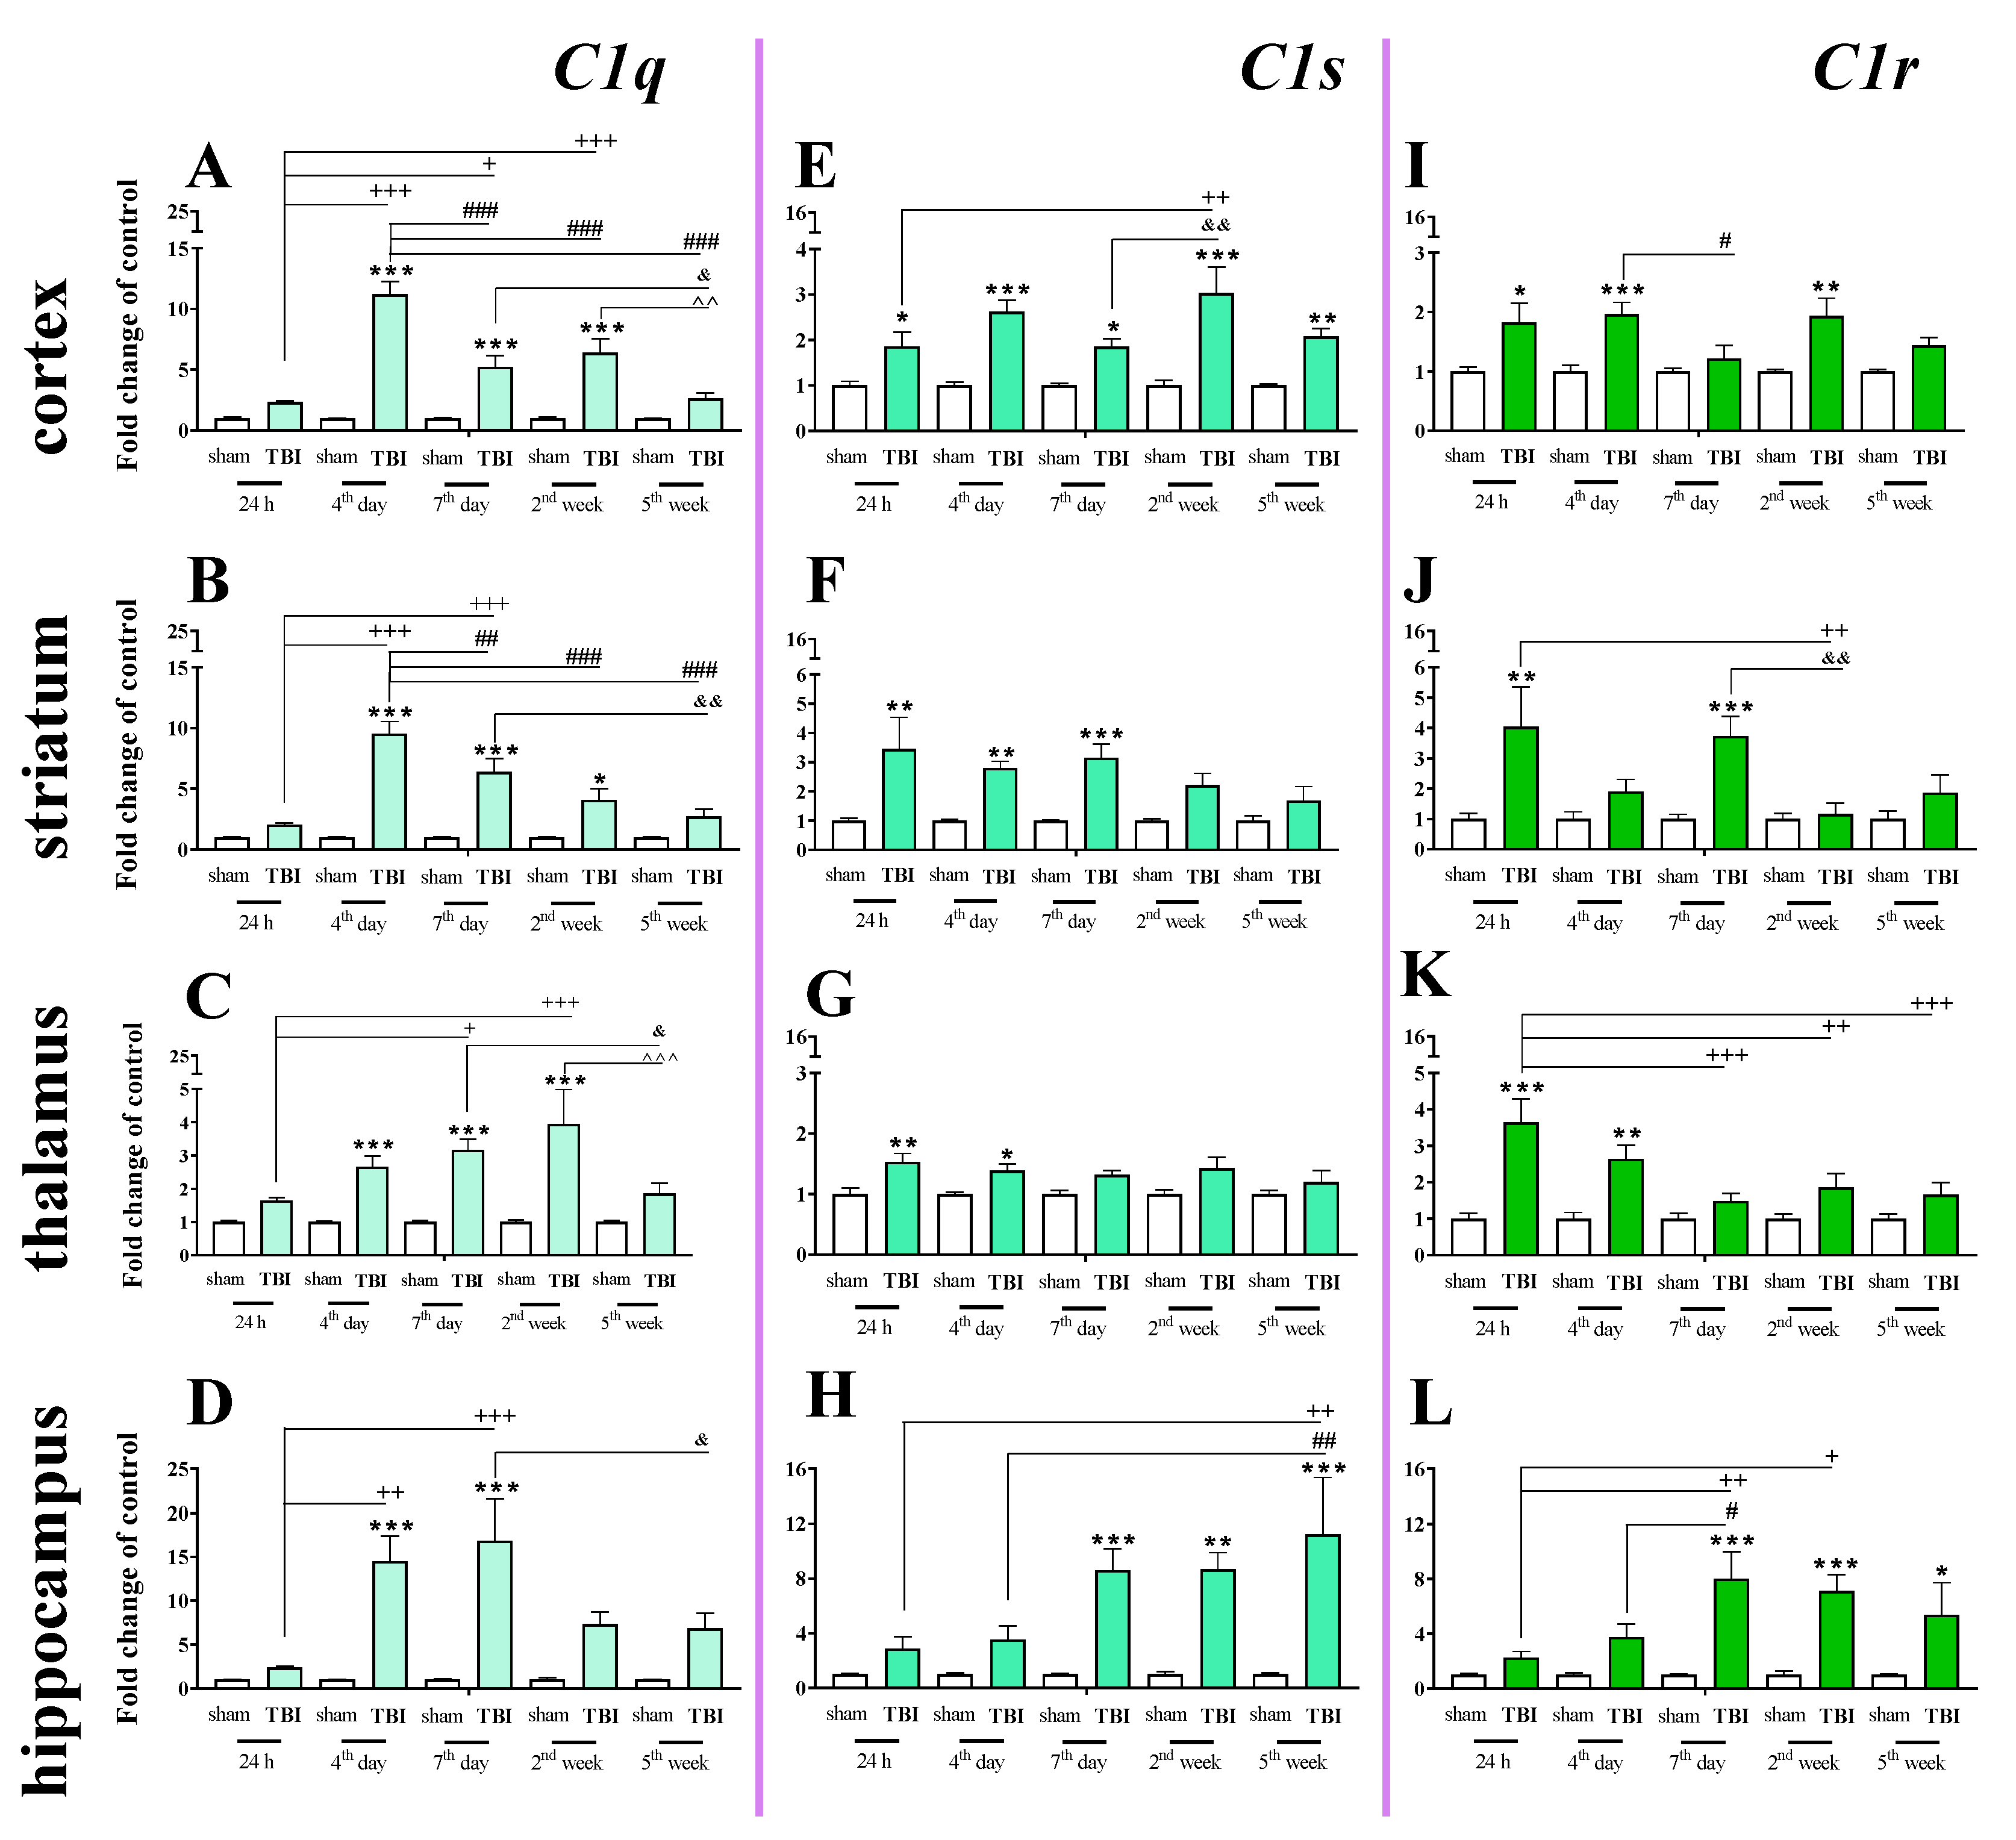
2.4. Time-Dependent Study of C1q, C1s, and C1r mRNA Expression in the Cortex, Striatum, Thalamus, and Hippocampus After TBI in Mice
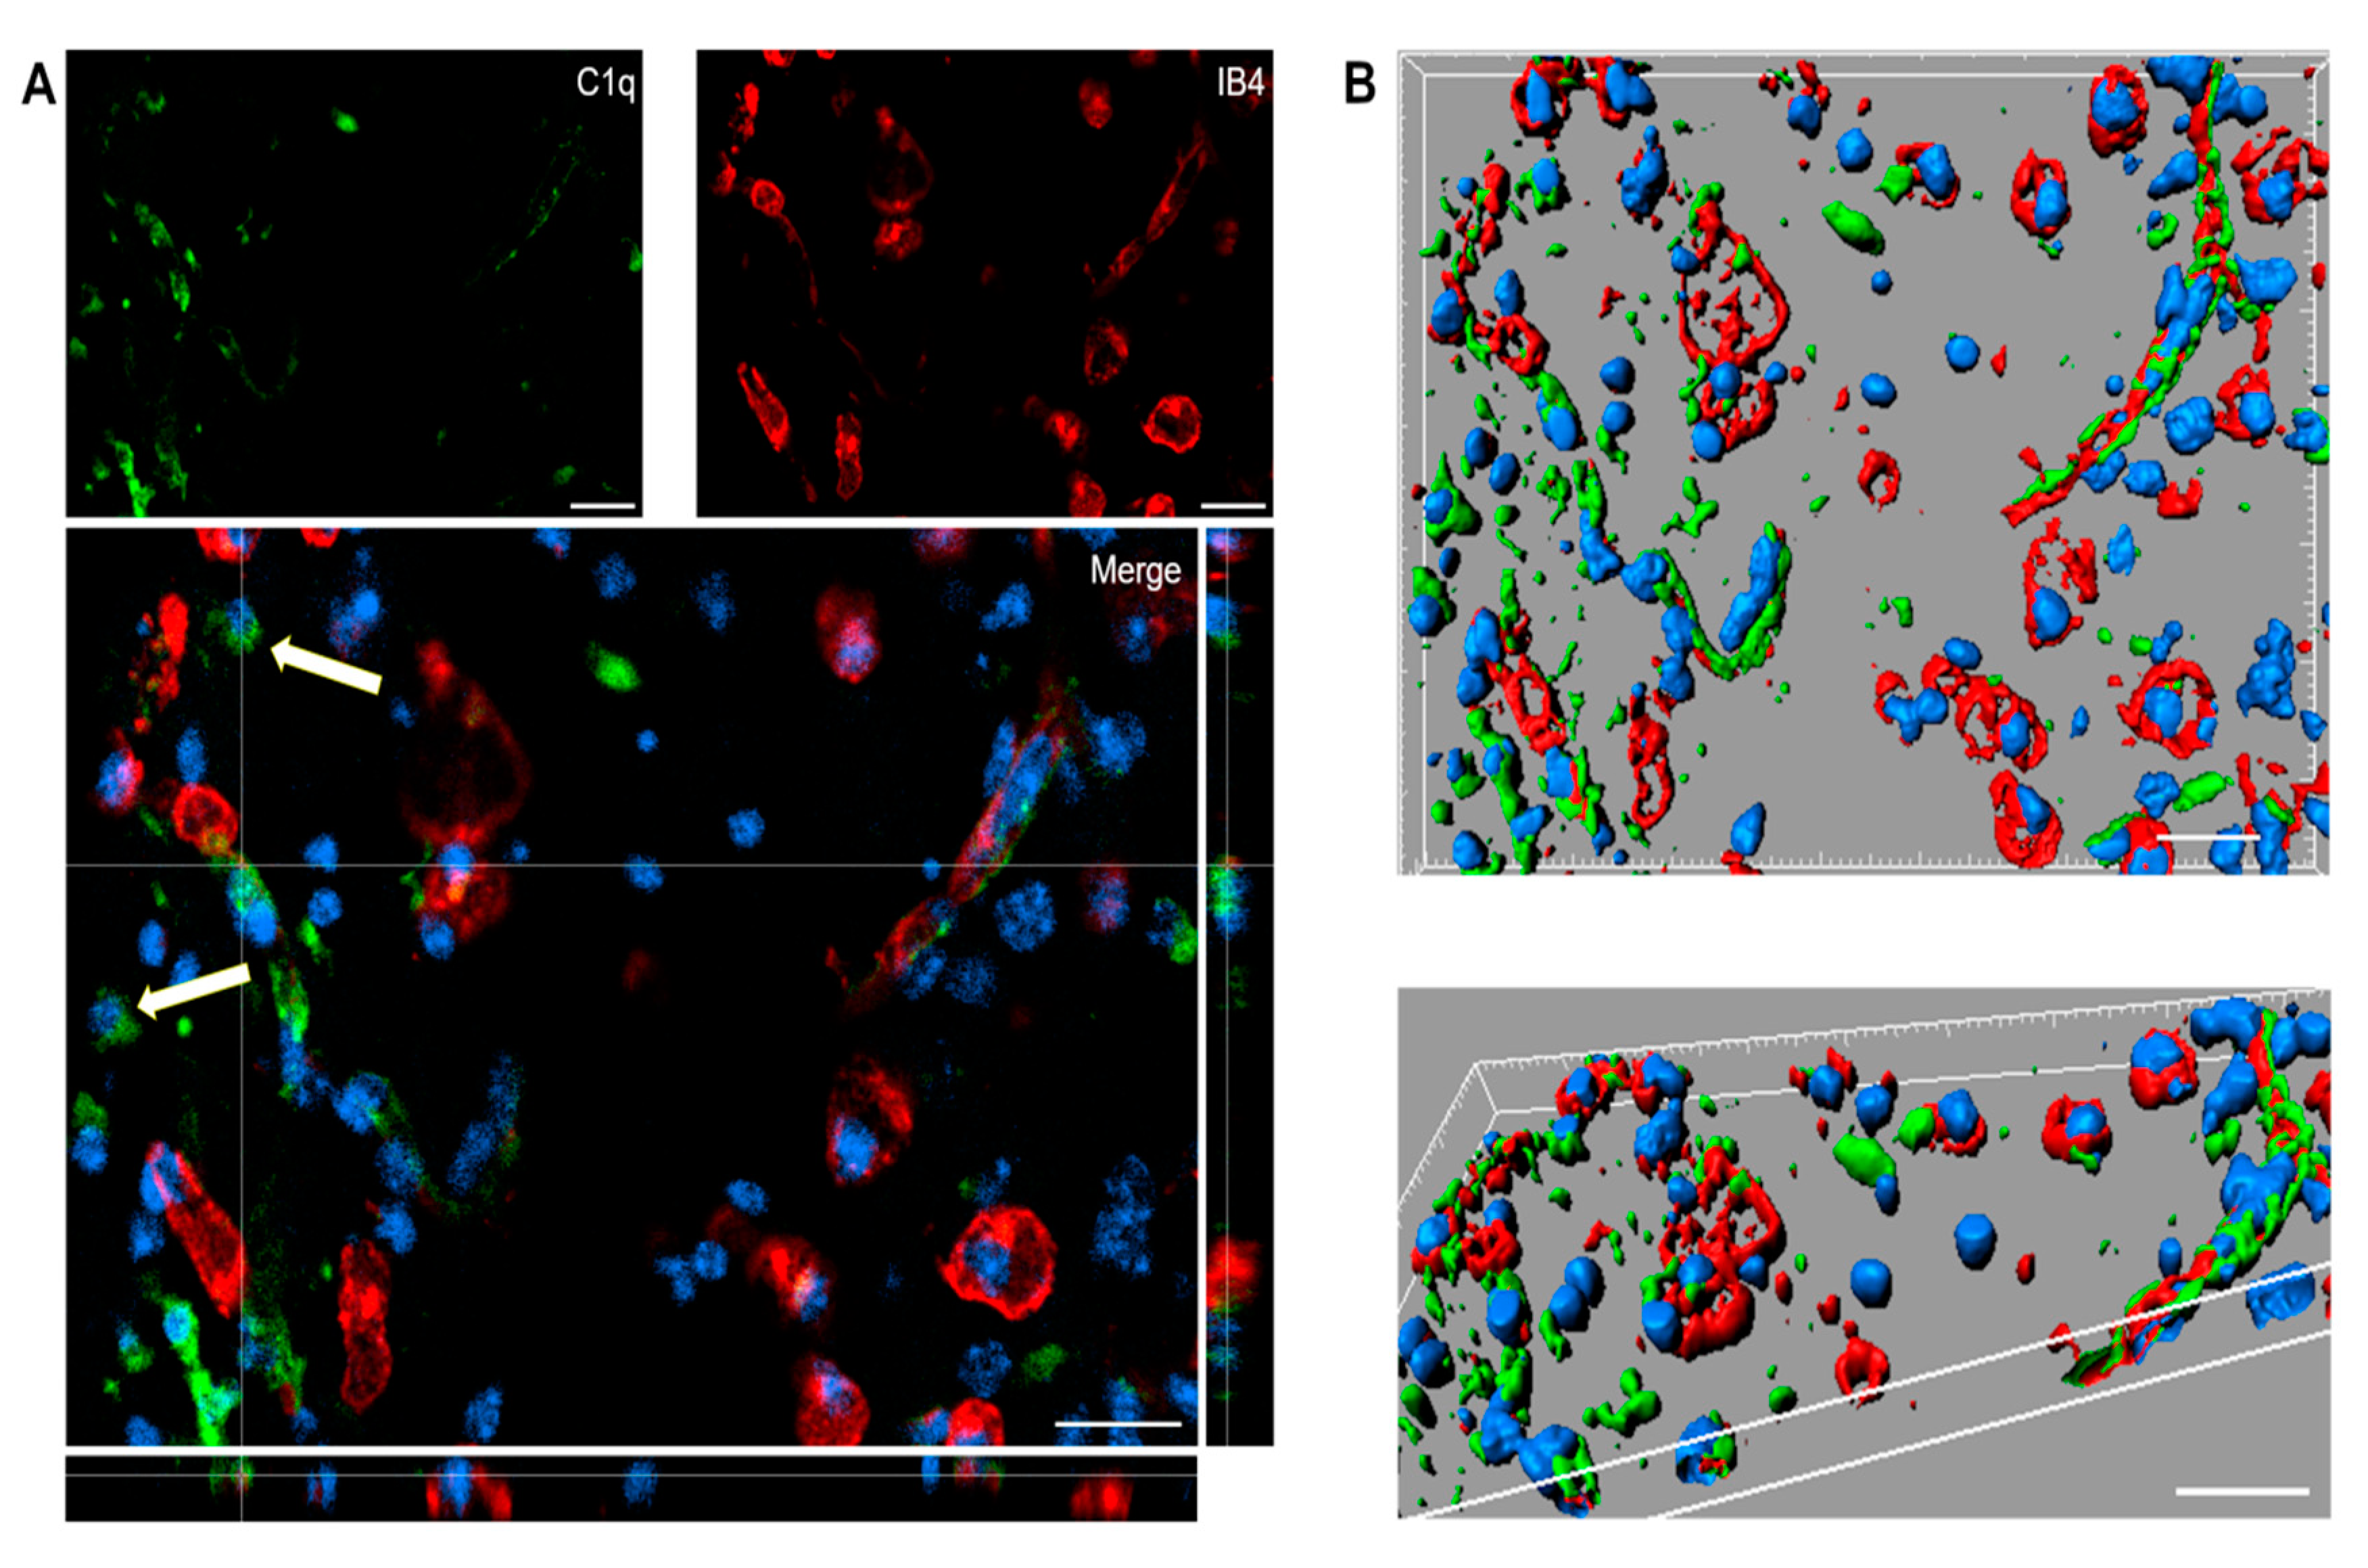
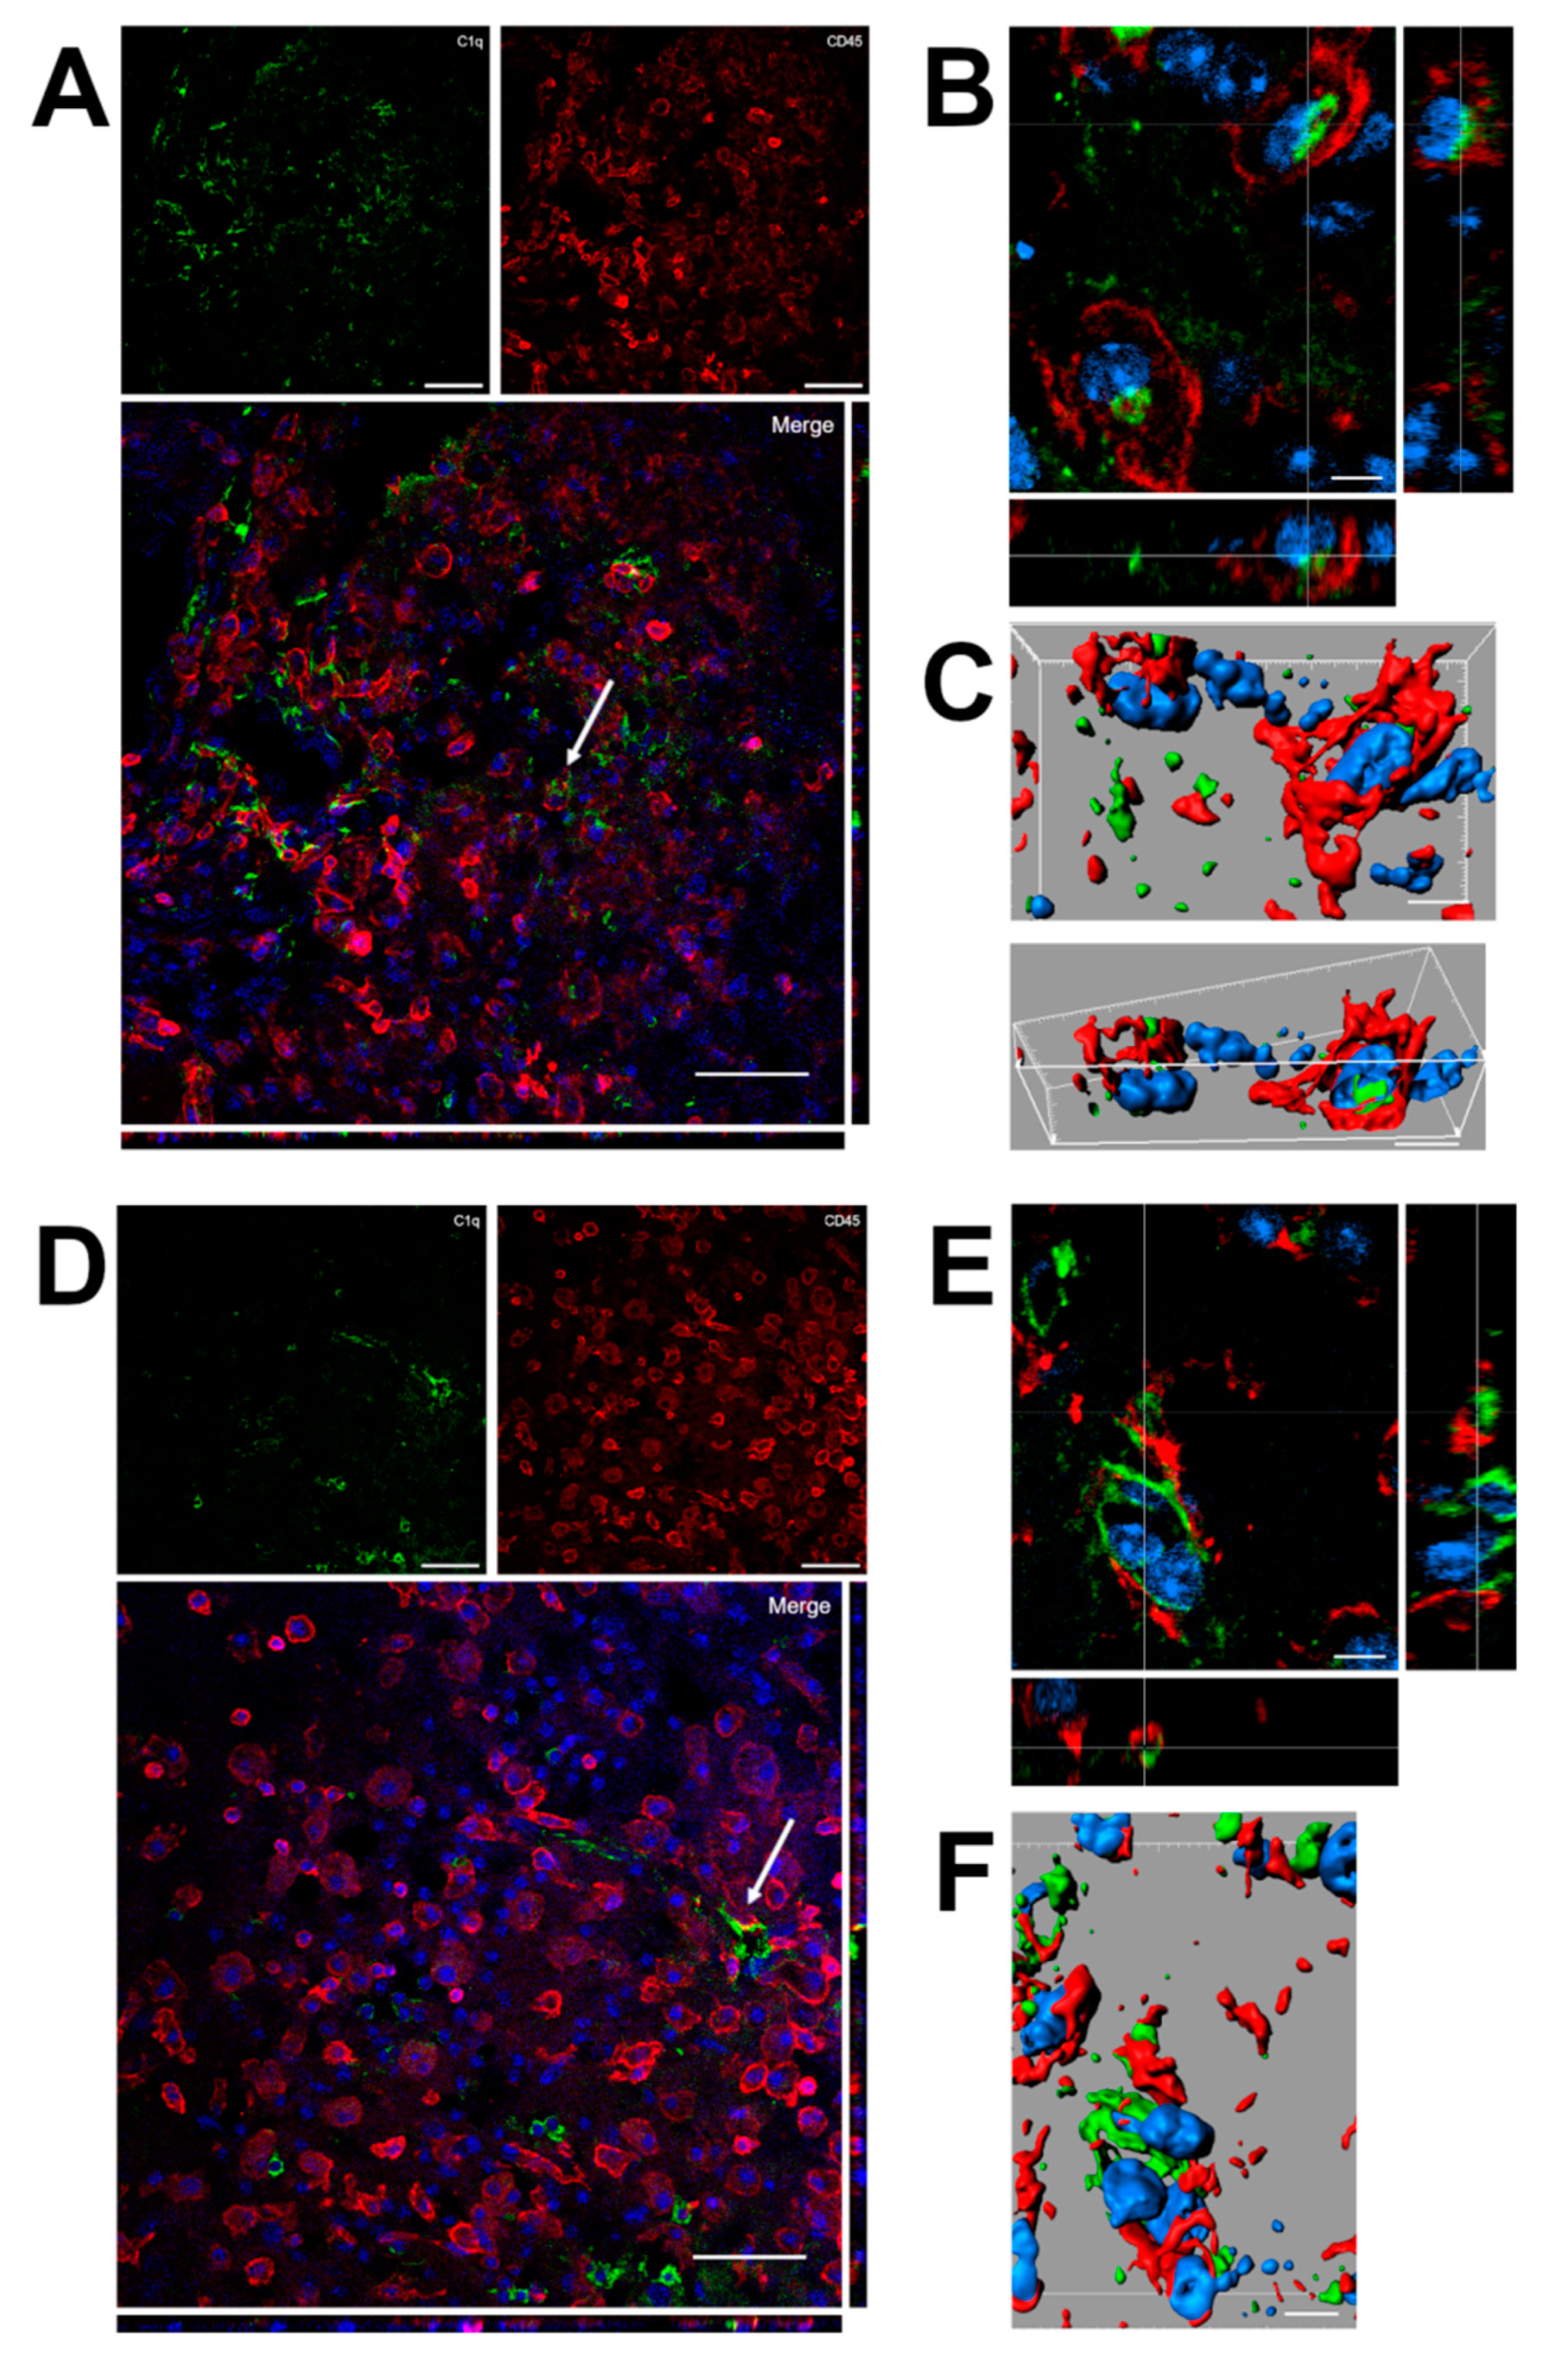
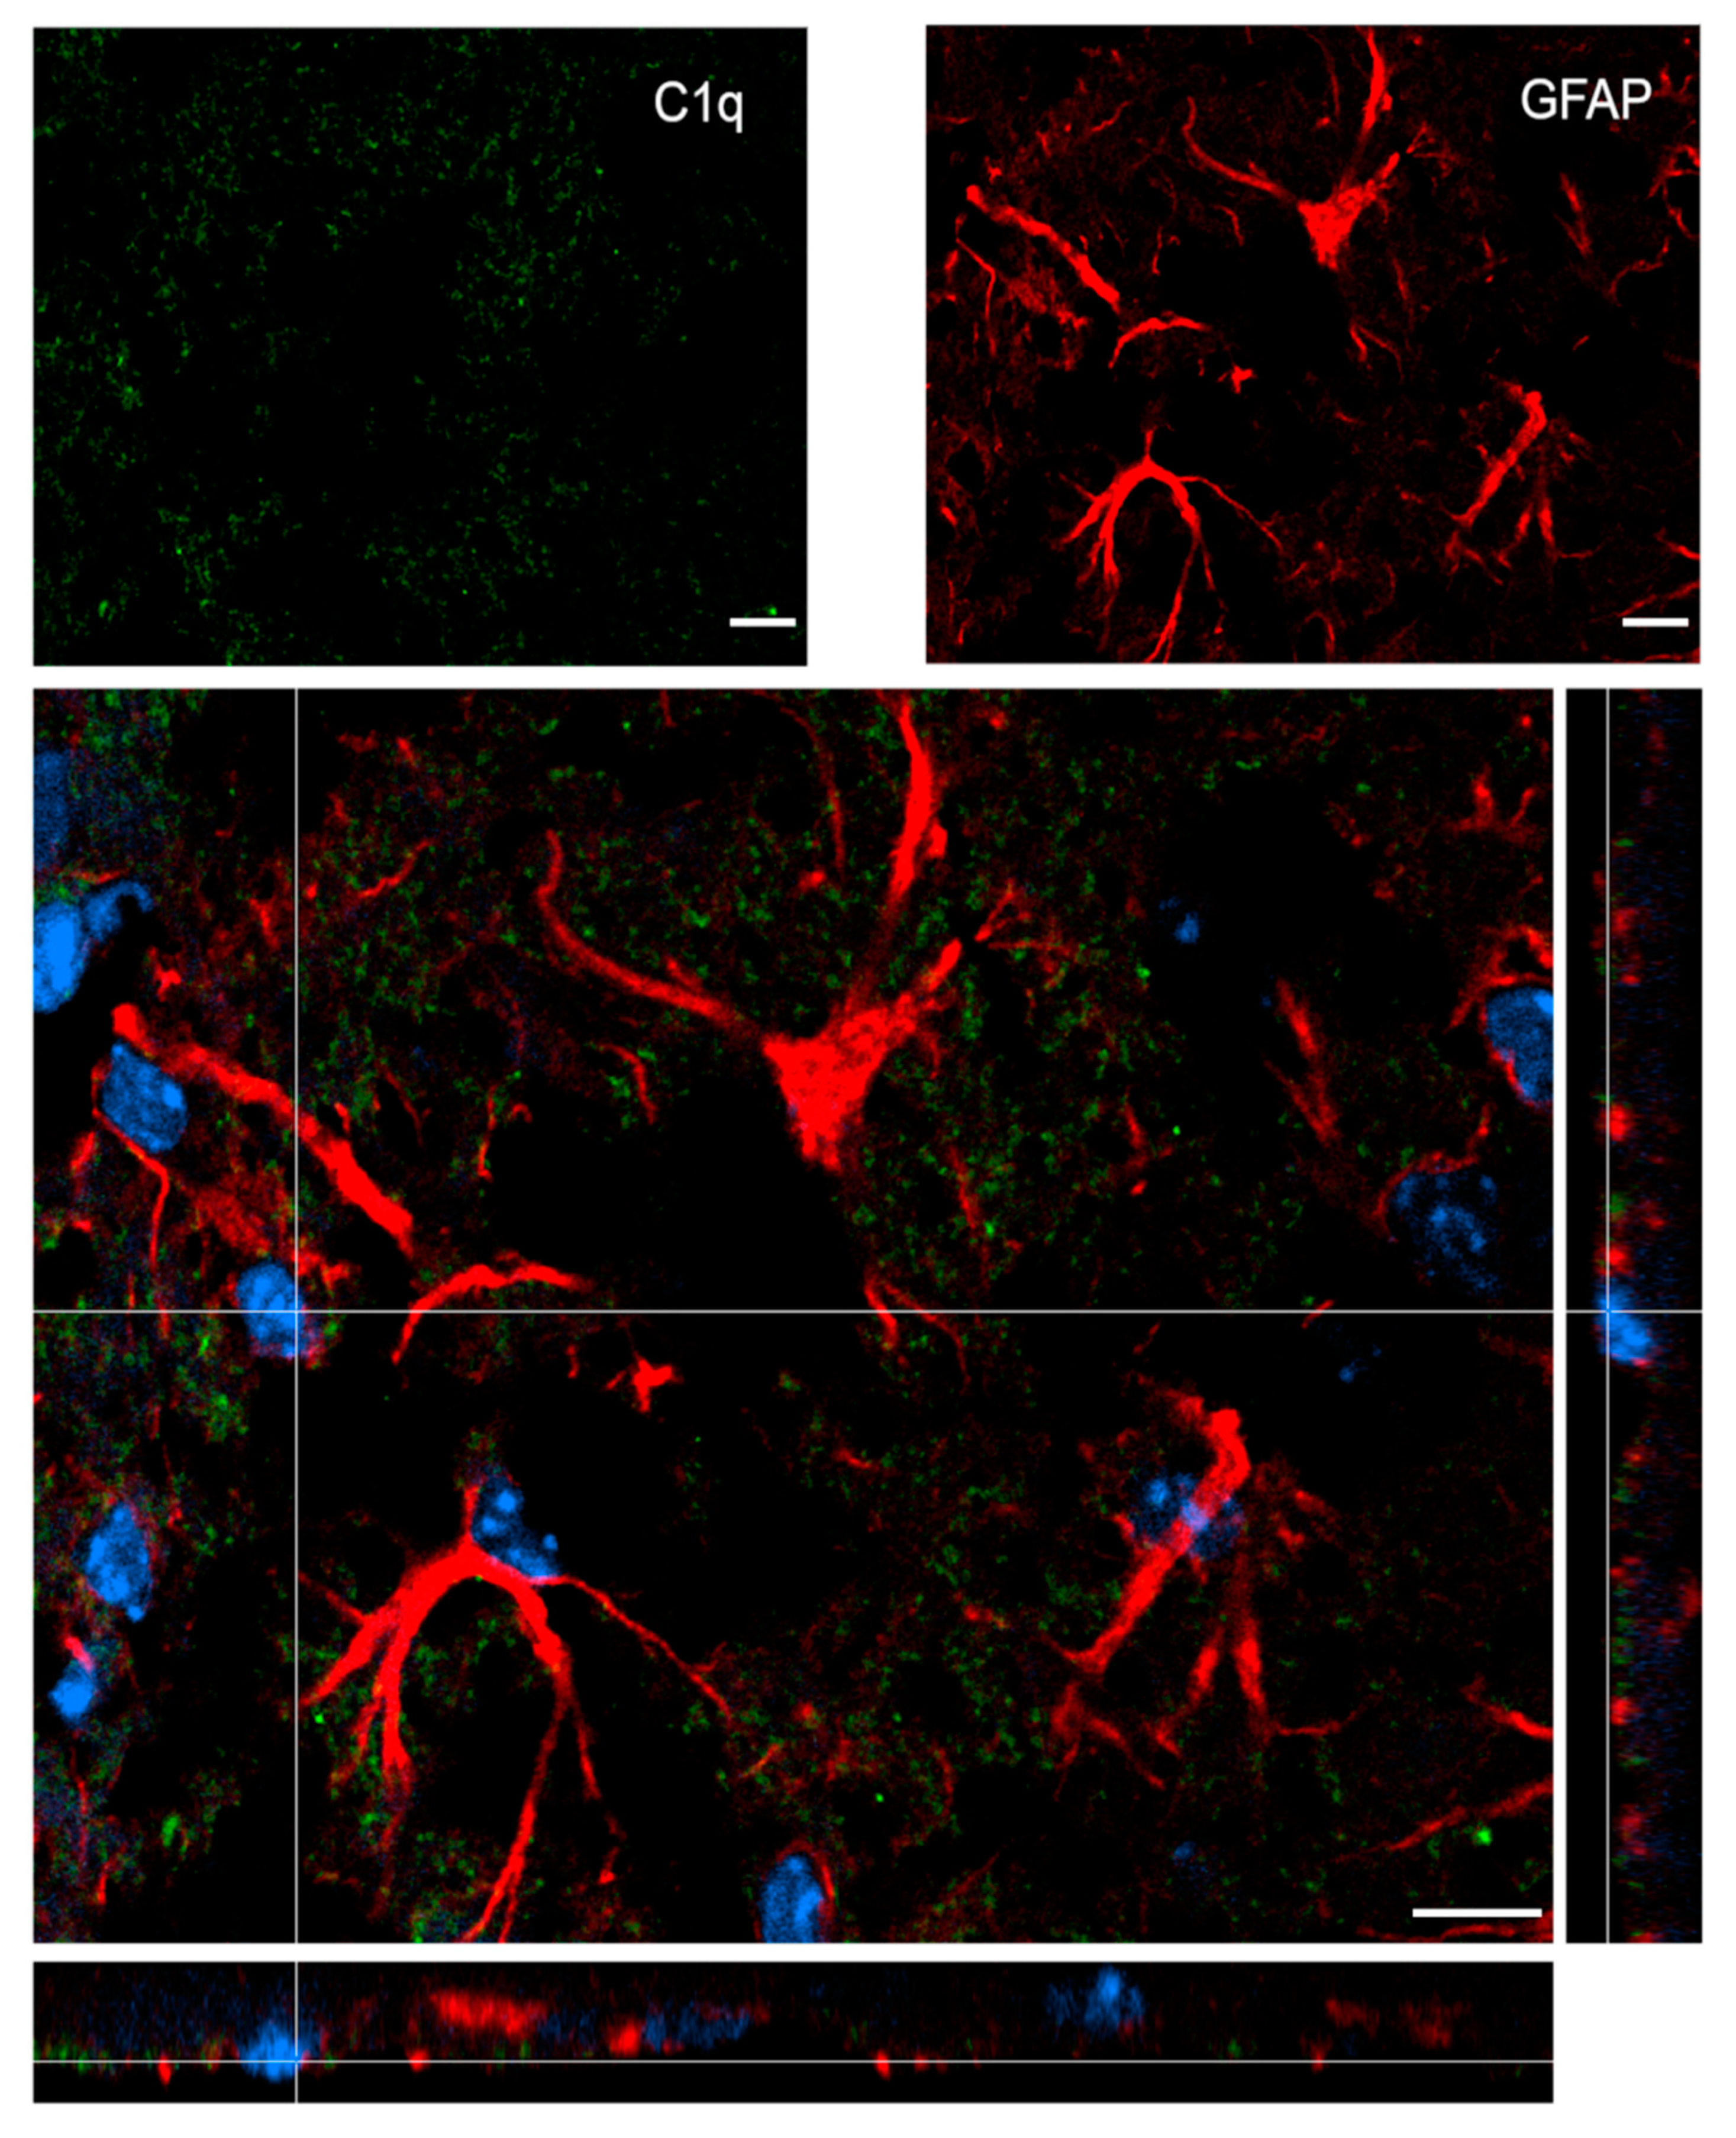
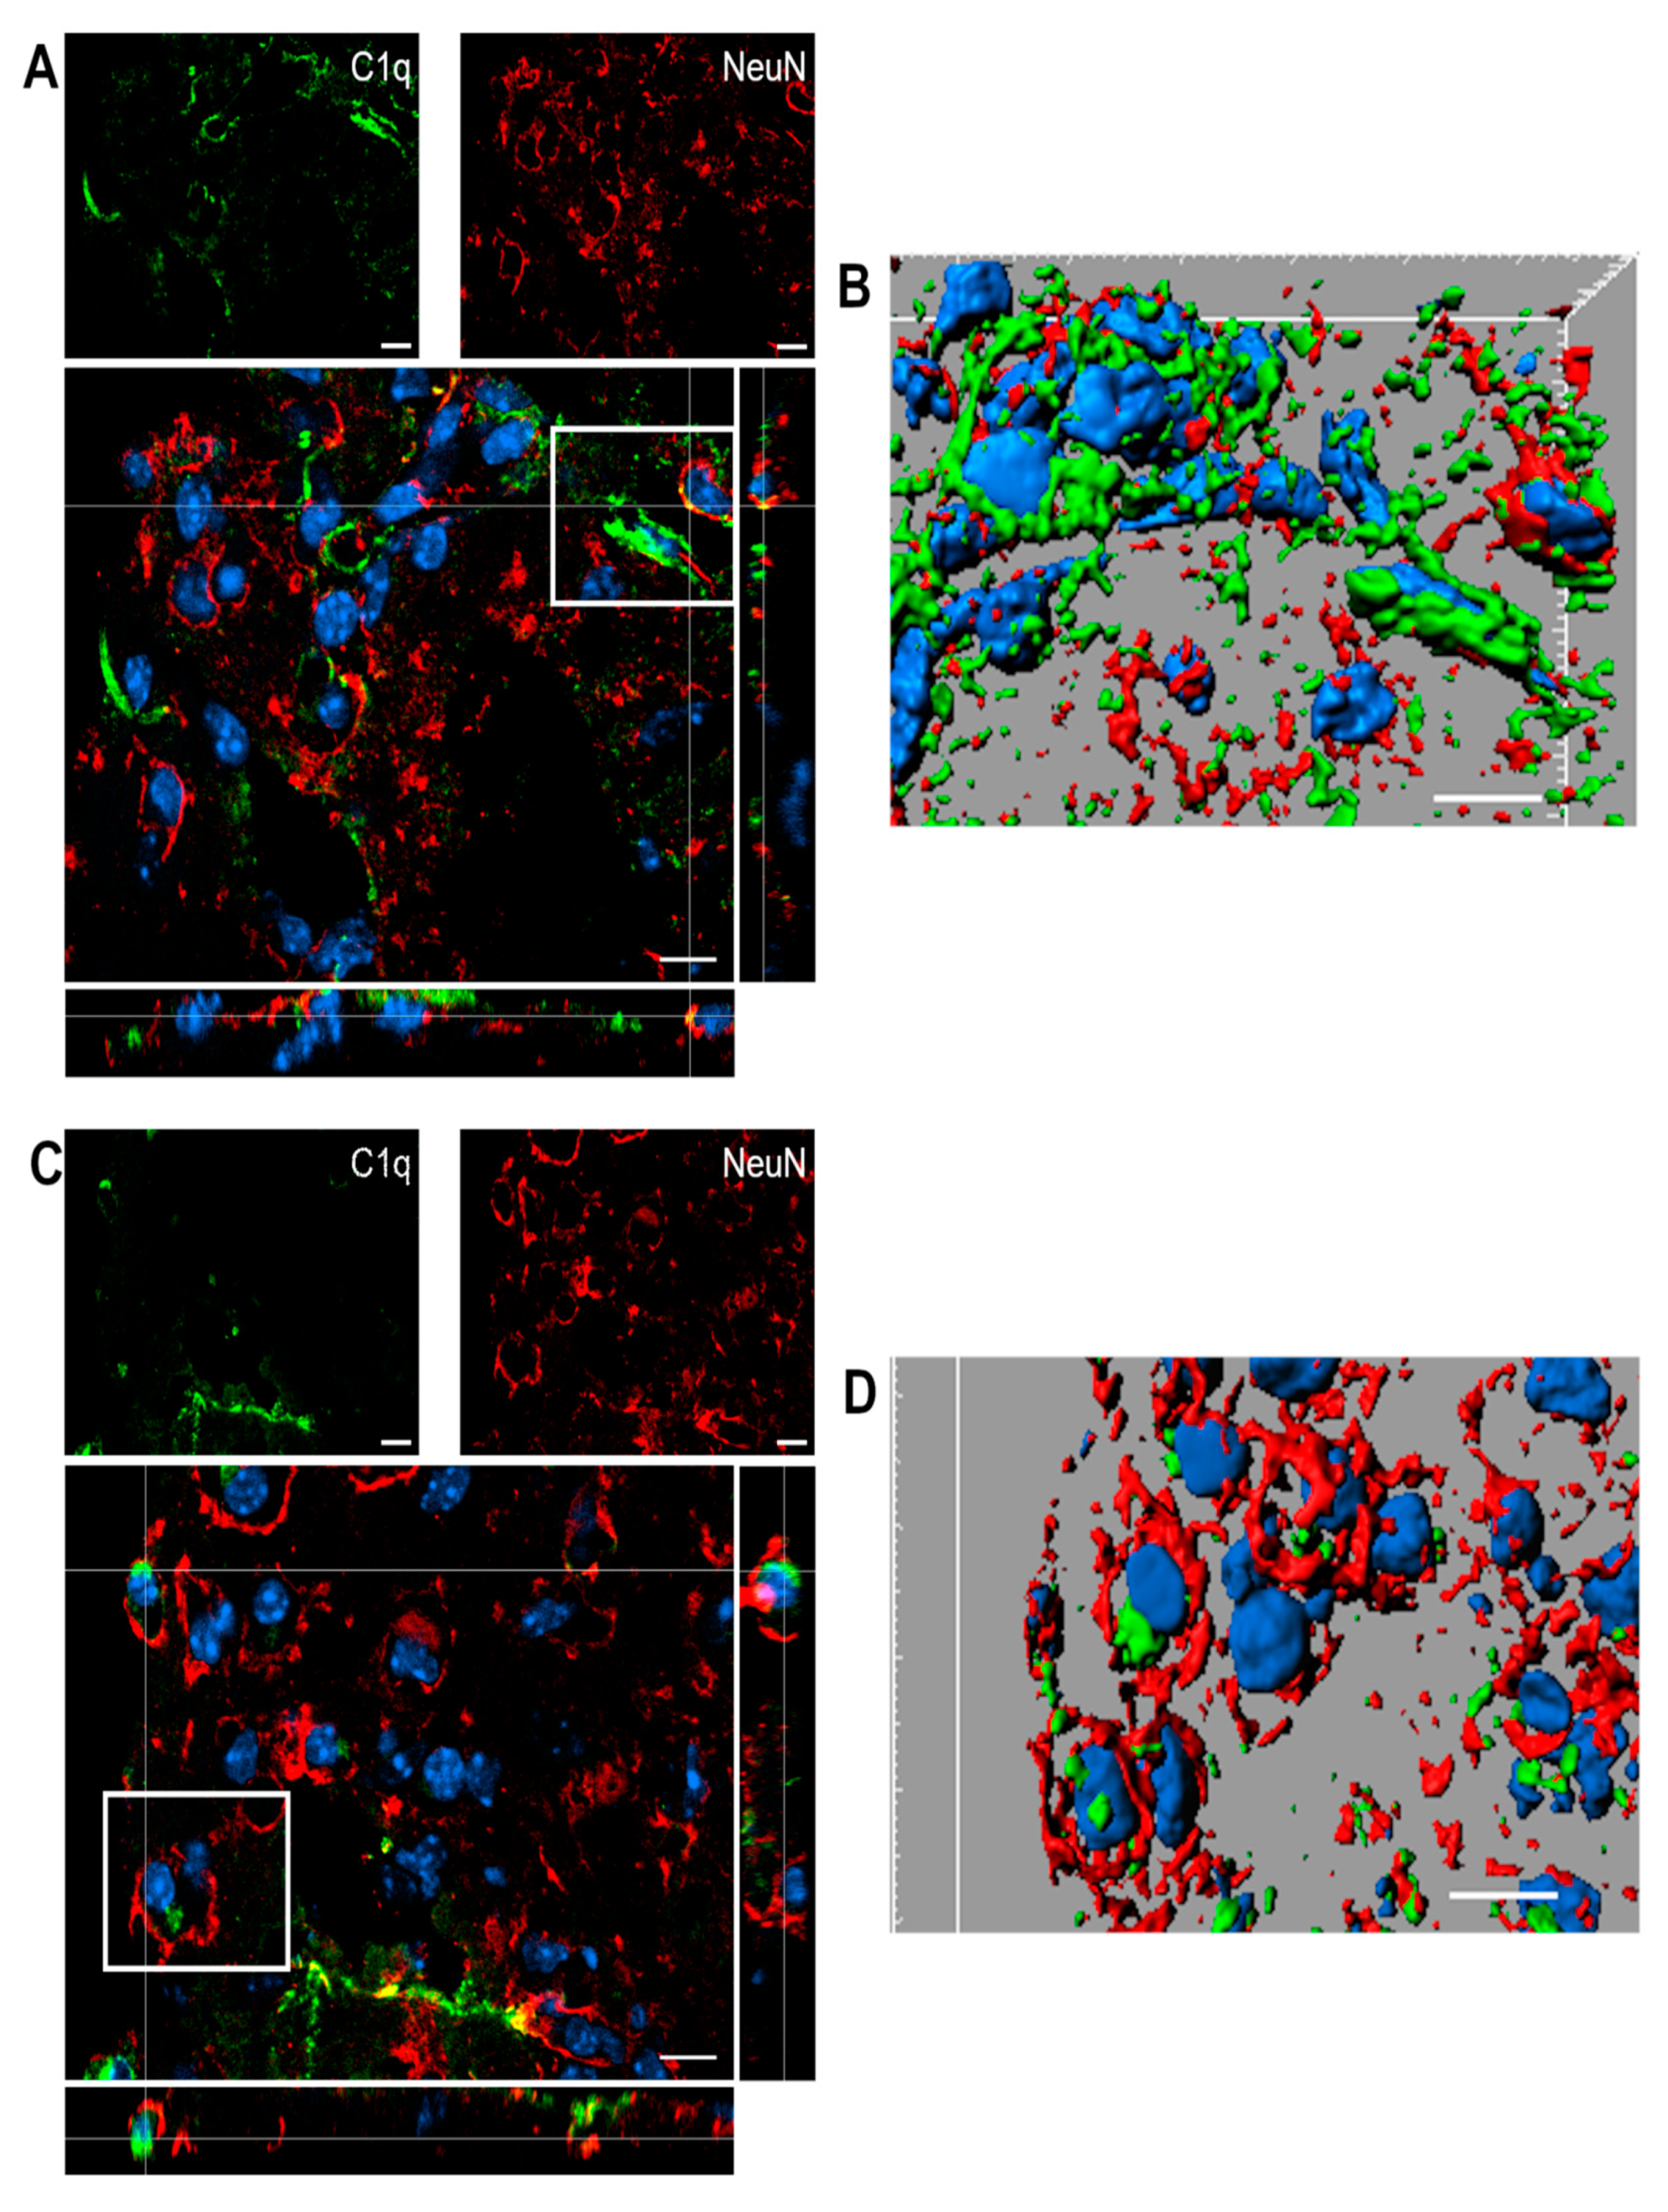
2.5. C1q Localization in the Contused Tissue
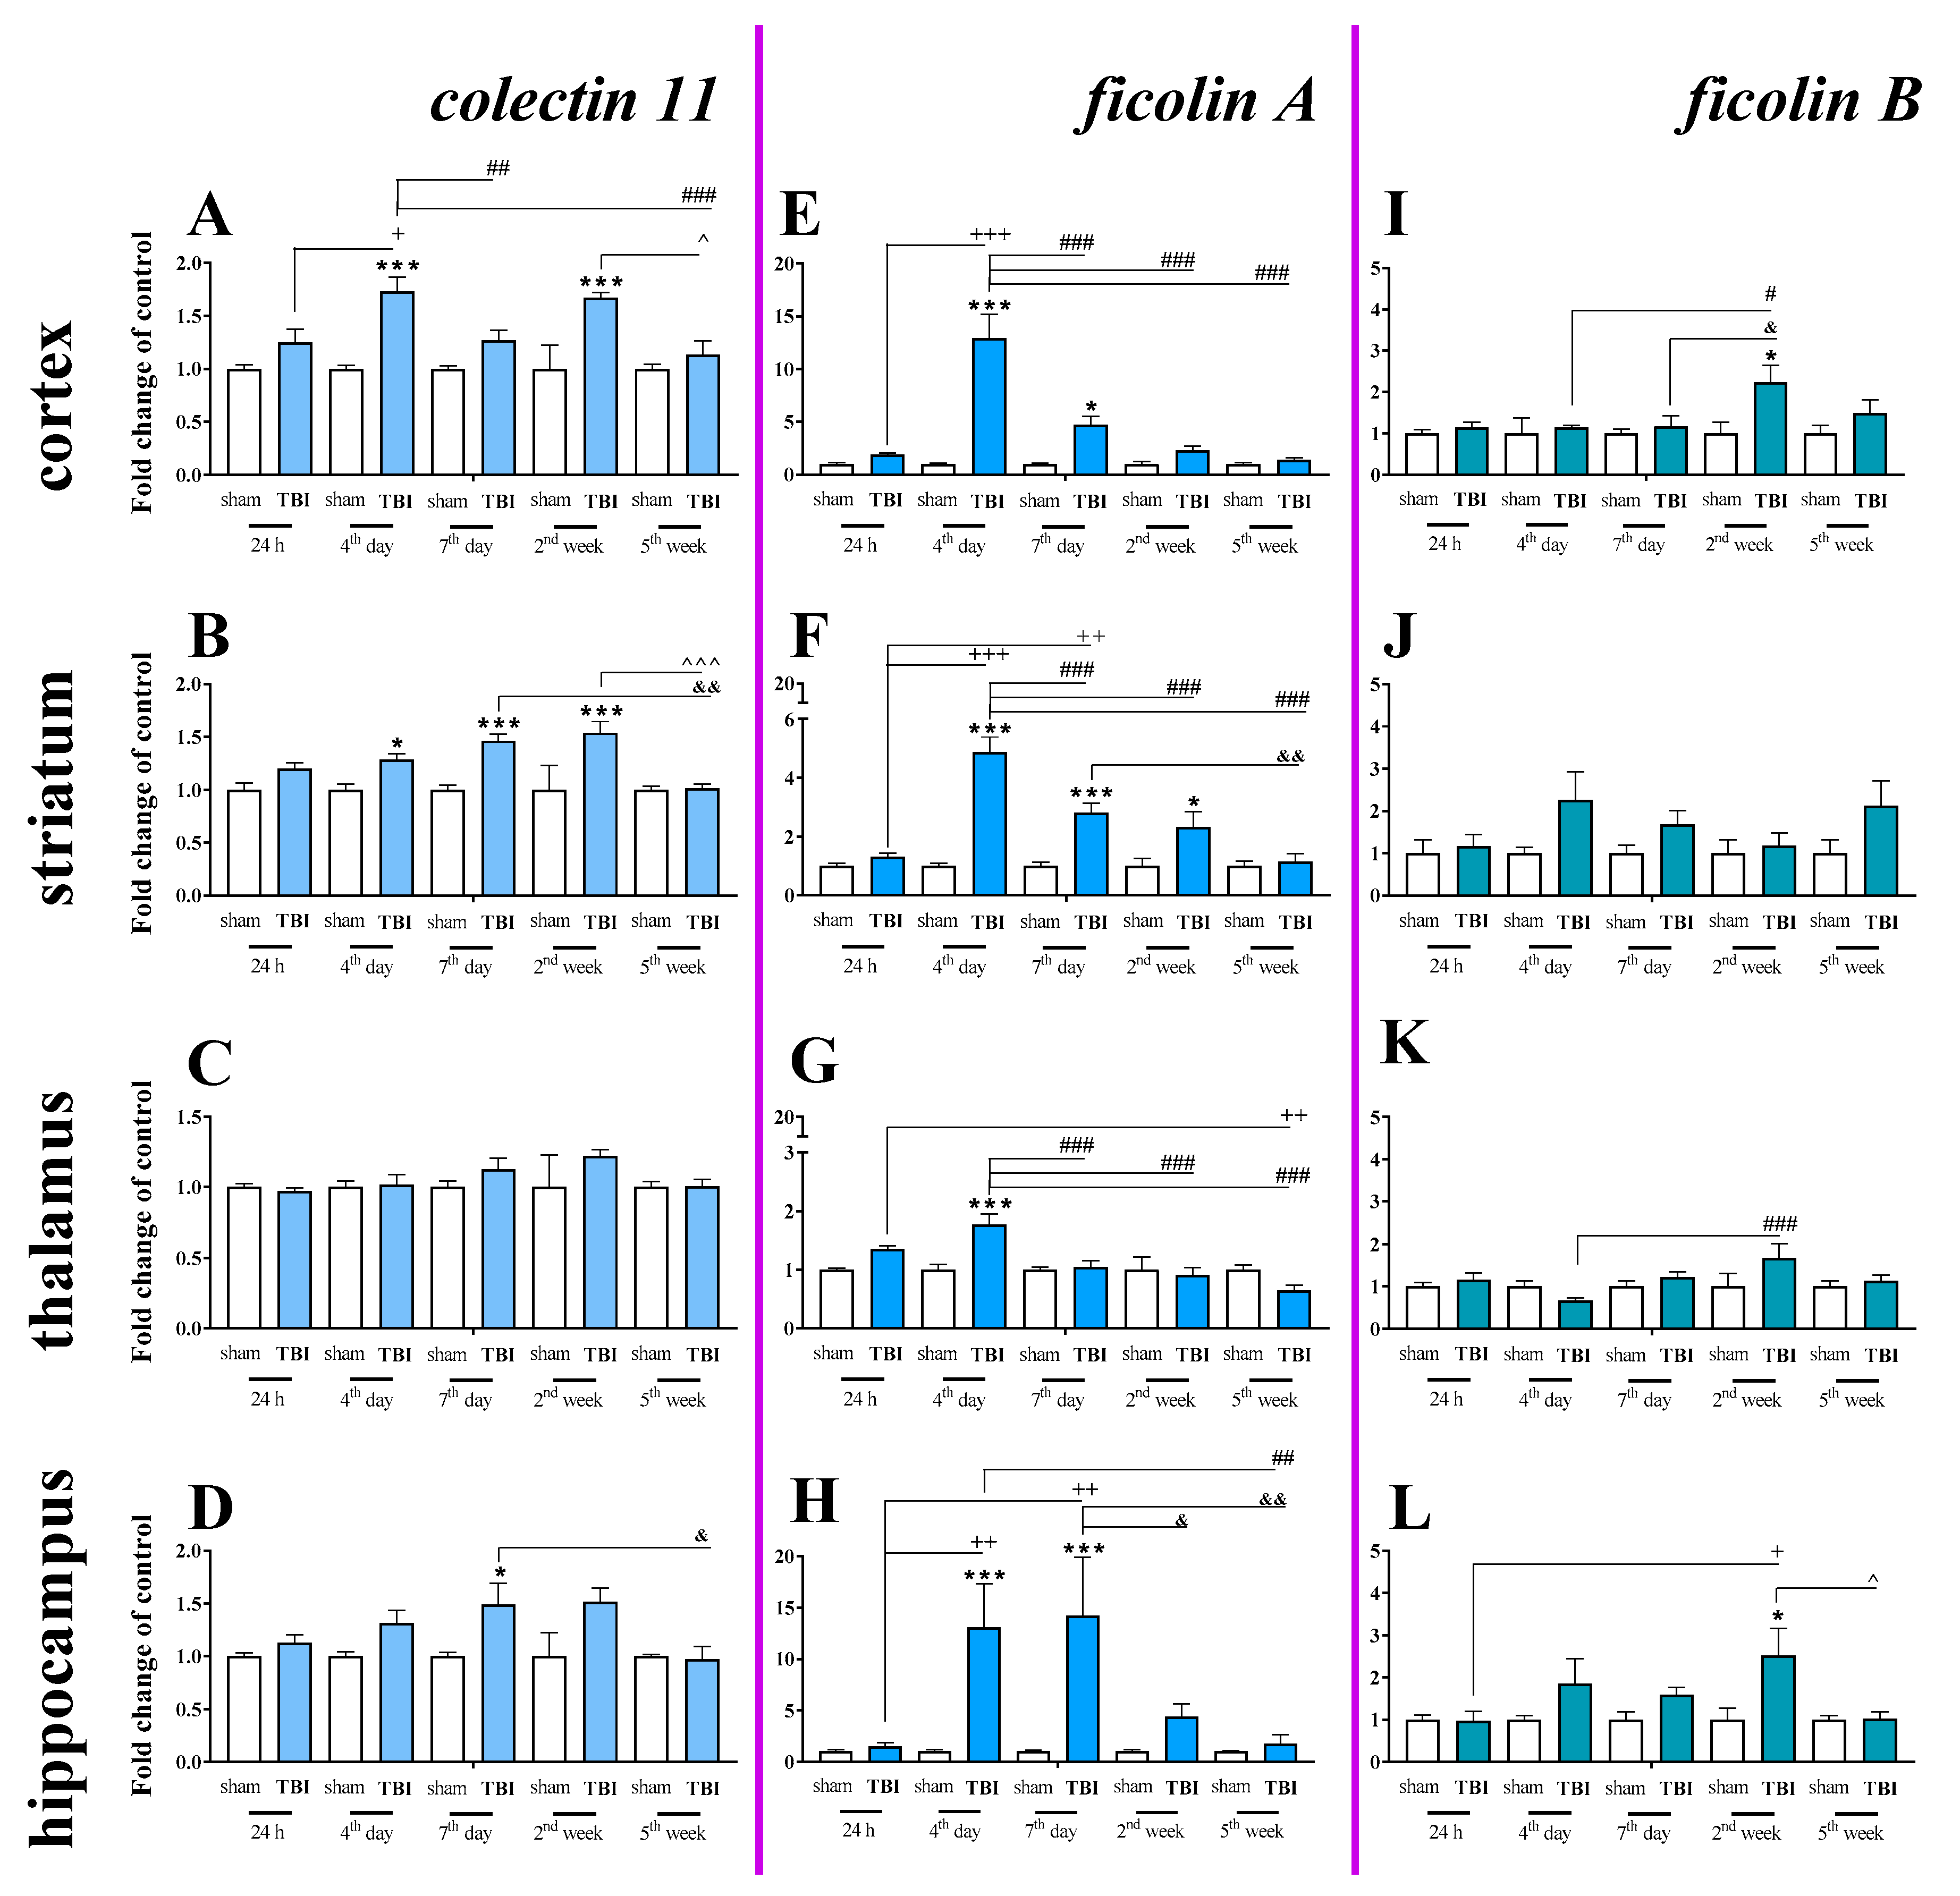
2.6. Time-Dependent Study of Mannose Binding Lectin A and C, Collectin 11, Ficolin A and Ficolin B mRNA Expression in the Cortex, Striatum, Thalamus, and Hippocampus After TBI in Mice
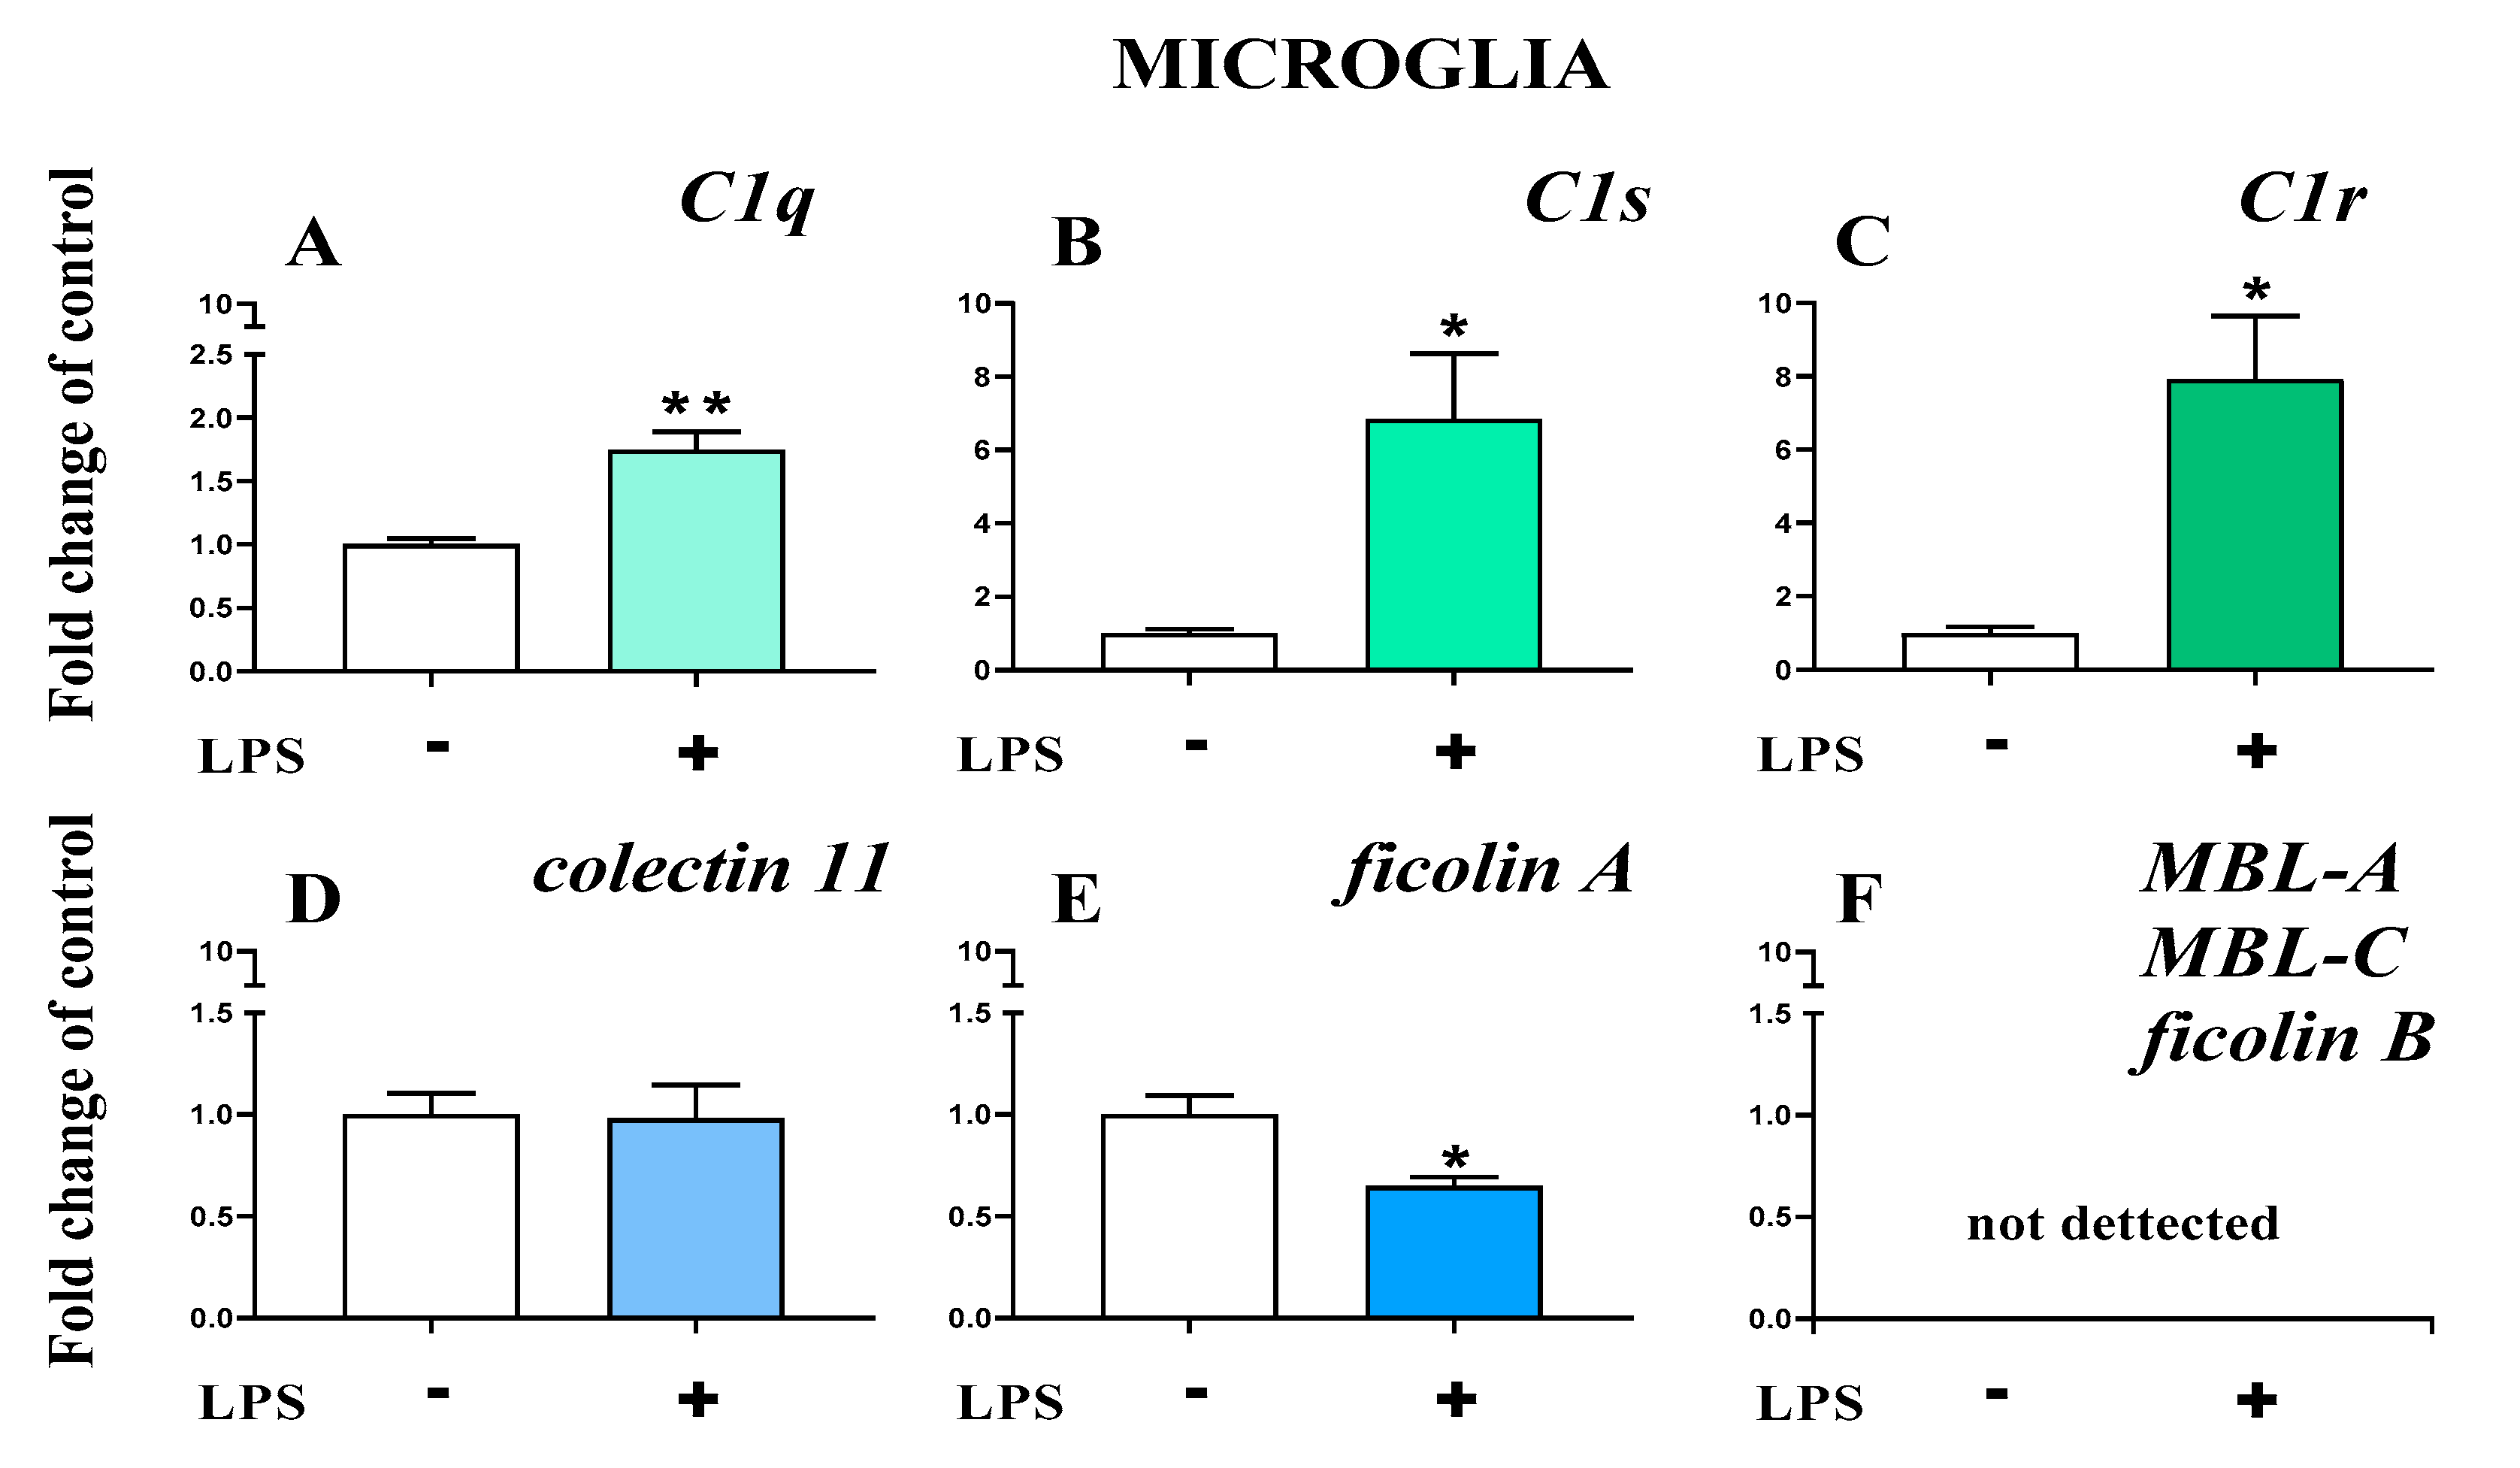
2.7. Study of C1q, C1s, C1r, Mannose Binding Lectin A, Mannose Binding Lectin C, Collectin 11, Ficolin A, and Ficolin B mRNA Expression in Primary Microglial Cultures After LPS Treatment
3. Discussion
4. Materials and Methods
4.1. Animals
4.2. Experimental Traumatic Brain Injury (TBI Model)
4.3. Primary Microglial Cell Cultures
4.4. Biochemical Analysis
4.4.1. RT-qPCR
4.4.2. Western Blotting
4.4.3. Immunofluorescence and Confocal Analysis
4.5. Statistical Analysis
5. Conclusions
Supplementary Materials
Author Contributions
Funding
Institutional Review Board Statement
Informed Consent Statement
Data Availability Statement
Ethics Statement
Acknowledgments
Conflicts of Interest
Abbreviations
| Aβ | Amyloid beta |
| BBB | Blood-brain barrier |
| C1qa | Complement component 1, q subcomponent, alpha polypeptide |
| C1ra | Complement component 1, r subcomponent A |
| C1s1 | Complement component 1, s subcomponent 1 |
| C3, C5b-9, C3b, C4b, C5b, C3a, C5a | Complement components |
| CC-1+ | The oligodendrocyte-specific antibody |
| cC1qR | The collagen-like tail of C1q |
| CCI | Controlled cortical impact |
| CCL2 | C-C motif chemokine 2 |
| CCL3 | C-C motif chemokine 3 |
| Cd177 | Cluster of Differentiation 177 |
| Cd45 | Cluster of differentiation 45 |
| Cd8 | Cluster of differentiation 8 |
| cDNA | Complementary DNA |
| CNS | Central nervous system |
| DNA | Deoxyribonucleic acid |
| ECL | Enhanced chemiluminescence |
| gC1qR | Globular head of the C1q |
| GFAP | Glial fibrillary acidic protein |
| GIMP | GNU Image Manipulation Program |
| Hprt | Hypoxanthine guanine phosphoribosyl transferase |
| IBA-1 | Allograft inflammatory factor 1 |
| IL-6 | Interleukin 6 |
| IL-beta | Interleukin 1 beta |
| LPS | Lipopolysaccharide |
| MBL | Mannose-binding lectin |
| MBL-A | Mannose binding lectin A |
| MBL-C | Mannose binding lectin C |
| MMPs | Matrix metalloproteinases |
| mRNA | Messenger RNA |
| NGF | Nerve growth factor |
| NGS | Normal goat serum |
| Olig2 | Oligodendrocyte transcription factor 2 |
| PBS | Phosphate-buffered saline |
| PVDF | Polyvinylidene fluoride |
| RIPA | Radioimmunoprecipitation assay buffer |
| ROS | Reactive oxygen species |
| RPM | Revolutions per minute |
| RT | Room temperature |
| RT-qPCR | Real-time quantitative polymerase chain reaction |
| SEM | Standard error of the mean |
| TBI | Traumatic brain injury |
| TBST | Tris-buffered saline with 0.1% Tween 20 |
| TGF-β | Transforming growth factor β |
| TMEM119 | Transmembrane protein 119 |
| TNF-α | Tumor Necrosis Factor alpha |
| UV | Ultraviolet |
References
- Galgano, M.; Toshkezi, G.; Qiu, X.; Russell, T.; Chin, L.; Zhao, L.R. Traumatic brain injury: Current treatment strategies and future endeavors. Cell Transplant. 2017, 26, 1118–1130. [Google Scholar] [CrossRef] [PubMed] [Green Version]
- Bellander, B.-M.; Singhrao, S.K.; Ohlsson, M.; Mattsson, P.; Svensson, M. Complement Activation in the Human Brain after Traumatic Head Injury. J. Neurotrauma 2001, 18, 1295–1311. [Google Scholar] [CrossRef] [PubMed]
- De Blasio, D.; Fumagalli, S.; Longhi, L.; Orsini, F.; Palmioli, A.; Stravalaci, M.; Vegliante, G.; Zanier, E.R.; Bernardi, A.; Gobbi, M.; et al. Pharmacological inhibition of mannose-binding lectin ameliorates neurobehavioral dysfunction following experimental traumatic brain injury. J. Cereb. Blood Flow Metab. 2017, 37, 938–950. [Google Scholar] [CrossRef] [PubMed] [Green Version]
- Ng, S.Y.; Lee, A.Y.W. Traumatic Brain Injuries: Pathophysiology and Potential Therapeutic Targets. Front. Cell. Neurosci. 2019, 13. [Google Scholar] [CrossRef] [PubMed]
- Hammad, A.; Westacott, L.; Zaben, M. The role of the complement system in traumatic brain injury: A review. J. Neuroinflam. 2018, 15. [Google Scholar] [CrossRef] [Green Version]
- Liu, Y.-W.; Li, S.; Dai, S.-S. Neutrophils in traumatic brain injury (TBI): Friend or foe? J. Neuroinflam. 2018, 15, 146. [Google Scholar] [CrossRef] [Green Version]
- Ciechanowska, A.; Popiolek-Barczyk, K.; Pawlik, K.; Ciapała, K.; Oggioni, M.; Mercurio, D.; De Simoni, M.G.; Mika, J. Changes in macrophage inflammatory protein-1 (MIP-1) family members expression induced by traumatic brain injury in mice. Immunobiology 2020, 225, 1–11. [Google Scholar] [CrossRef]
- Zanier, E.R.; Marchesi, F.; Ortolano, F.; Perego, C.; Arabian, M.; Zoerle, T.; Sammali, E.; Pischiutta, F.; De Simoni, M.G. Fractalkine receptor deficiency is associated with early protection but late worsening of outcome following brain trauma in mice. J. Neurotrauma 2016, 33, 1060–1072. [Google Scholar] [CrossRef] [Green Version]
- Gao, H.; Han, Z.; Bai, R.; Huang, S.; Ge, X.; Chen, F.; Lei, P. The accumulation of brain injury leads to severe neuropathological and neurobehavioral changes after repetitive mild traumatic brain injury. Brain Res. 2017, 1657, 1–8. [Google Scholar] [CrossRef]
- Ramlackhansingh, A.F.; Brooks, D.J.; Greenwood, R.J.; Bose, S.K.; Turkheimer, F.E.; Kinnunen, K.M.; Gentleman, S.; Heckemann, R.A.; Gunanayagam, K.; Gelosa, G.; et al. Inflammation after trauma: Microglial activation and traumatic brain injury. Ann. Neurol. 2011, 70, 374–383. [Google Scholar] [CrossRef]
- Johnson, V.E.; Stewart, J.E.; Begbie, F.D.; Trojanowski, J.Q.; Smith, D.H.; Stewart, W. Inflammation and white matter degeneration persist for years after a single traumatic brain injury. Brain 2013, 136, 28–42. [Google Scholar] [CrossRef] [PubMed] [Green Version]
- Färber, K.; Cheung, G.; Mitchell, D.; Wallis, R.; Weibe, E.; Schwaeble, W.; Kettenmann, H. C1q, the recognition subcomponent of the classical pathway of complement, drives microglial activation. J. Neurosci. Res. 2009, 87, 644–652. [Google Scholar] [CrossRef] [PubMed] [Green Version]
- Zanier, E.R.; Montinaro, M.; Vigano, M.; Villa, P.; Fumagalli, S.; Pischiutta, F.; Longhi, L.; Leoni, M.L.; Rebulla, P.; Stocchetti, N.; et al. Human umbilical cord blood mesenchymal stem cells protect mice brain after trauma. Crit. Care Med. 2011, 39, 2501–2510. [Google Scholar] [CrossRef] [PubMed]
- Osier, N.; Dixon, C.E. The Controlled Cortical Impact Model of Experimental Brain Trauma: Overview, Research Applications, and Protocol. Methods Mol. Biol. 2016, 1462, 177–192. [Google Scholar] [CrossRef] [Green Version]
- Albert-Weissenberger, C.; Mencl, S.; Schuhmann, M.K.; Salur, I.; Göb, E.; Langhauser, F.; Hopp, S.; Hennig, N.; Meuth, S.G.; Nolte, M.W.; et al. C1-Inhibitor protects from focal brain trauma in a cortical cryolesion mice model by reducing Thrombo-Inflammation. Front. Cell. Neurosci. 2014, 8. [Google Scholar] [CrossRef] [Green Version]
- Shaw, M.; Piper, I.; Daley, M. Relationship of a cerebral autoregulatory index with outcome in head injured patients. Acta Neurochir. Suppl. 2008, 102, 33–36. [Google Scholar] [CrossRef]
- Longhi, L.; Perego, C.; Ortolano, F.; Zanier, E.R.; Bianchi, P.; Stocchetti, N.; McIntosh, T.K.; De Simoni, M.G. C1-inhibitor attenuates neurobehavioral deficits and reduces contusion volume after controlled cortical impact brain injury in mice. Crit. Care Med. 2009, 37, 659–665. [Google Scholar] [CrossRef]
- Gyoneva, S.; Ransohoff, R.M. Inflammatory reaction after traumatic brain injury: Therapeutic potential of targeting cell-cell communication by chemokines. Trends Pharmacol. Sci. 2015, 36, 471–480. [Google Scholar] [CrossRef] [Green Version]
- Simon, D.W.; McGeachy, M.J.; Baylr, H.; Clark, R.S.B.; Loane, D.J.; Kochanek, P.M. The far-reaching scope of neuroinflammation after traumatic brain injury. Nat. Rev. Neurol. 2017, 13, 171–191. [Google Scholar] [CrossRef] [Green Version]
- Xiong, Y.; Mahmood, A.; Chopp, M. Animal models of traumatic brain injury. Nat. Rev. Neurosci. 2013, 14, 128–142. [Google Scholar] [CrossRef] [Green Version]
- Pischiutta, F.; D’Amico, G.; Dander, E.; Biondi, A.; Biagi, E.; Citerio, G.; De Simoni, M.G.; Zanier, E.R. Immunosuppression does not affect human bone marrow mesenchymal stromal cell efficacy after transplantation in traumatized mice brain. Neuropharmacology 2014, 79, 119–126. [Google Scholar] [CrossRef] [PubMed]
- Zanier, E.R.; Pischiutta, F.; Riganti, L.; Marchesi, F.; Turola, E.; Fumagalli, S.; Perego, C.; Parotto, E.; Vinci, P.; Veglianese, P.; et al. Bone marrow mesenchymal stromal cells drive protective M2 microglia polarization after brain trauma. Neurotherapeutics 2014, 11, 679–695. [Google Scholar] [CrossRef] [PubMed] [Green Version]
- Mao, H.; Lu, L.; Bian, K.; Clausen, F.; Colgan, N.; Gilchrist, M. Biomechanical analysis of fluid percussion model of brain injury. J. Biomech. 2018, 77, 228–232. [Google Scholar] [CrossRef] [PubMed]
- Hellewell, S.C.; Ziebell, J.M.; Lifshitz, J.; Morganti-kossmann, M.C. Impact Acceleration Model of Diffuse Traumatic Brain Injury. Methods Mol. Biol. 2016, 1462, 253–266. [Google Scholar] [CrossRef]
- Bao, F.; Shultz, S.R.; Hepburn, J.D.; Omana, V.; Weaver, L.C.; Cain, D.P.; Brown, A. A CD11d monoclonal antibody treatment reduces tissue injury and improves neurological outcome after fluid percussion brain injury in rats. J. Neurotrauma 2012, 29, 2375–2392. [Google Scholar] [CrossRef] [Green Version]
- Aleem, M.; Goswami, N.; Kumar, M.; Manda, K. Low-pressure fluid percussion minimally adds to the sham craniectomy-induced neurobehavioral changes: Implication for experimental traumatic brain injury model. Exp. Neurol. 2020, 329. [Google Scholar] [CrossRef]
- Smith, D.; Brooks, D.; Wohlgehagen, E.; Rau, T.; Poulsen, D. Temporal and Spatial Changes in the Pattern of Iba1 and CD68 Staining in the Rat Brain Following Severe Traumatic Brain Injury. Mod. Res. Inflamm. 2015, 4, 9–23. [Google Scholar] [CrossRef]
- Dyhrfort, P.; Shen, Q.; Clausen, F.; Thulin, M.; Enblad, P.; Kamali-Moghaddam, M.; Lewén, A.; Hillered, L. Monitoring of Protein Biomarkers of Inflammation in Human Traumatic Brain Injury Using Microdialysis and Proximity Extension Assay Technology in Neurointensive Care. J. Neurotrauma 2019. [Google Scholar] [CrossRef] [Green Version]
- De Blasio, D.; Fumagalli, S.; Orsini, F.; Neglia, L.; Perego, C.; Ortolano, F.; Zanier, E.R.; Picetti, E.; Locatelli, M.; Stocchetti, N.; et al. Human brain trauma severity is associated with lectin complement pathway activation. J. Cereb. Blood Flow Metab. 2019, 39, 794–807. [Google Scholar] [CrossRef]
- Colicos, M.A.; Dixon, C.E. Delayed, selective neuronal death following experimental cortical impact injury in rats: Possible role in memory deficits. Brain Res. 1996, 739, 111–119. [Google Scholar] [CrossRef]
- Geddes, D.M.; LaPlaca, M.C.; Cargill, R.S. Susceptibility of hippocampal neurons to mechanically induced injury. Exp. Neurol. 2003, 184, 420–427. [Google Scholar] [CrossRef]
- Sato, M.; Chang, E.; Igarashi, T.; Noble, L.J. Neuronal injury and loss after traumatic brain injury: Time course and regional variability. Brain Res. 2001, 917, 45–54. [Google Scholar] [CrossRef]
- Mohamed, A.Z.; Corrigan, F.; Collins-Praino, L.E.; Plummer, S.L.; Soni, N.; Nasrallah, F.A. Evaluating spatiotemporal microstructural alterations following diffuse traumatic brain injury. NeuroImage Clin. 2020, 25, 1–15. [Google Scholar] [CrossRef] [PubMed]
- Kolaczkowska, E.; Kubes, P. Neutrophil recruitment and function in health and inflammation. Nat. Rev. Immunol. 2013, 13, 159–175. [Google Scholar] [CrossRef] [PubMed]
- Zhang, X.; Cheng, R.; Rowe, D.; Sethu, P.; Daugherty, A.; Yu, G.; Shin, H.Y. Shear-sensitive regulation of neutrophil flow behavior and its potential impact on microvascular blood flow dysregulation in hypercholesterolemia. Arterioscler. Thromb. Vasc. Biol. 2014, 34, 587–593. [Google Scholar] [CrossRef] [PubMed] [Green Version]
- Pliyev, B.K.; Menshikov, M. Differential effects of the autophagy inhibitors 3-methyladenine and chloroquine on spontaneous and TNF-α-induced neutrophil apoptosis. Apoptosis 2012, 17, 1050–1065. [Google Scholar] [CrossRef]
- Flygt, J.; Djupsjö, A.; Lenne, F.; Marklund, N. Myelin loss and oligodendrocyte pathology in white matter tracts following traumatic brain injury in the rat. Eur. J. Neurosci. 2013, 38, 2153–2165. [Google Scholar] [CrossRef]
- West, E.E.; Kolev, M.; Kemper, C. Complement and the Regulation of T Cell Responses. Annu. Rev. Immunol. 2018, 36, 309–338. [Google Scholar] [CrossRef]
- Kolev, M.; Dimeloe, S.; Le Friec, G.; Navarini, A.; Arbore, G.; Povoleri, G.A.; Fischer, M.; Belle, R.; Loeliger, J.; Develioglu, L.; et al. Complement Regulates Nutrient Influx and Metabolic Reprogramming during Th1 Cell Responses. Immunity 2015, 42, 1033–1047. [Google Scholar] [CrossRef] [Green Version]
- West, E.E.; Kunz, N.; Kemper, C. Complement and human T cell metabolism: Location, location, location. Immunol. Rev. 2020, 295, 68–81. [Google Scholar] [CrossRef]
- Daglas, M.; Draxler, D.F.; Ho, H.; McCutcheon, F.; Galle, A.; Au, A.E.; Larsson, P.; Gregory, J.; Alderuccio, F.; Sashindranath, M.; et al. Activated CD8+ T Cells Cause Long-Term Neurological Impairment after Traumatic Brain Injury in Mice. Cell Rep. 2019, 29, 1178–1191.e6. [Google Scholar] [CrossRef] [PubMed] [Green Version]
- Mracsko, E.; Liesz, A.; Stojanovic, A.; Lou, W.P.K.; Osswald, M.; Zhou, W.; Karcher, S.; Winkler, F.; Martin-Villalba, A.; Cerwenka, A.; et al. Antigen dependently activated cluster of differentiation 8-positive T cells cause perforin-mediated neurotoxicity in experimental stroke. J. Neurosci. 2014, 34, 16784–16795. [Google Scholar] [CrossRef] [PubMed] [Green Version]
- Dent, K.A.; Christie, K.J.; Bye, N.; Basrai, H.S.; Turbic, A.; Habgood, M.; Cate, H.S.; Turnley, A.M. Oligodendrocyte birth and death following traumatic brain injury in adult mice. PLoS ONE 2015, 10. [Google Scholar] [CrossRef] [Green Version]
- Mayer, C.A.; Brunkhorst, R.; Niessner, M.; Pfeilschifter, W.; Steinmetz, H.; Foerch, C. Blood Levels of Glial Fibrillary Acidic Protein (GFAP) in Patients with Neurological Diseases. PLoS ONE 2013, 8. [Google Scholar] [CrossRef] [PubMed]
- Yang, Z.; Wang, K.K.W. Glial fibrillary acidic protein: From intermediate filament assembly and gliosis to neurobiomarker. Trends Neurosci. 2015, 38, 364–374. [Google Scholar] [CrossRef] [PubMed] [Green Version]
- Honda, M.; Tsuruta, R.; Kaneko, T.; Kasaoka, S.; Yagi, T.; Todani, M.; Fujita, M.; Izumi, T.; Maekawa, T. Serum glial fibrillary acidic protein is a highly specific biomarker for traumatic brain injury in humans compared with S-100B and neuron-specific enolase. J. Trauma Inj. Infect. Crit. Care 2010, 69, 104–109. [Google Scholar] [CrossRef]
- Kumar, A.; Loane, D.J. Neuroinflammation after traumatic brain injury: Opportunities for therapeutic intervention. Brain. Behav. Immun. 2012, 26, 1191–1201. [Google Scholar] [CrossRef]
- Shlosberg, D.; Benifla, M.; Kaufer, D.; Friedman, A. Blood-brain barrier breakdown as a therapeutic target in traumatic brain injury. Nat. Rev. Neurol. 2010, 6, 393–403. [Google Scholar] [CrossRef] [Green Version]
- Herndon, J.M.; Tome, M.E.; Davis, T.P. Development and Maintenance of the Blood-Brain Barrier. In Primer on Cerebrovascular Diseases: Second Edition; Elsevier Inc.: New York, NY, USA, 2017; pp. 51–56. ISBN 9780128030585. [Google Scholar]
- Pearn, M.L.; Niesman, I.R.; Egawa, J.; Sawada, A.; Almenar-Queralt, A.; Shah, S.B.; Duckworth, J.L.; Head, B.P. Pathophysiology Associated with Traumatic Brain Injury: Current Treatments and Potential Novel Therapeutics. Cell. Mol. Neurobiol. 2017, 37, 571–585. [Google Scholar] [CrossRef]
- Lafrenaye, A.D.; Mondello, S.; Wang, K.K.; Yang, Z.; Povlishock, J.T.; Gorse, K.; Walker, S.; Hayes, R.L.; Kochanek, P.M. Circulating GFAP and Iba-1 levels are associated with pathophysiological sequelae in the thalamus in a pig model of mild TBI. Sci. Rep. 2020, 10. [Google Scholar] [CrossRef]
- Makinde, H.M.; Cuda, C.M.; Just, T.B.; Perlman, H.R.; Schwulst, S.J. Nonclassical Monocytes Mediate Secondary Injury, Neurocognitive Outcome, and Neutrophil Infiltration after Traumatic Brain Injury. J. Immunol. 2017, 199, 3583–3591. [Google Scholar] [CrossRef] [PubMed] [Green Version]
- Ziegler-Heitbrock, L.; Ancuta, P.; Crowe, S.; Dalod, M.; Grau, V.; Hart, D.N.; Leenen, P.J.M.; Liu, Y.J.; MacPherson, G.; Randolph, G.J.; et al. Nomenclature of monocytes and dendritic cells in blood. Blood 2010, 116. [Google Scholar] [CrossRef] [PubMed]
- Li, Q.; Barres, B.A. Microglia and macrophages in brain homeostasis and disease. Nat. Rev. Immunol. 2018, 18, 225–242. [Google Scholar] [CrossRef] [PubMed]
- Yin, J.; Valin, K.L.; Dixon, M.L.; Leavenworth, J.W. The Role of Microglia and Macrophages in CNS Homeostasis, Autoimmunity, and Cancer. J. Immunol. Res. 2017, 2017. [Google Scholar] [CrossRef] [PubMed] [Green Version]
- Donat, C.K.; Scott, G.; Gentleman, S.M.; Sastre, M. Microglial activation in traumatic brain injury. Front. Aging Neurosci. 2017, 9, 1–20. [Google Scholar] [CrossRef] [PubMed] [Green Version]
- Loane, D.J.; Kumar, A. Microglia in the TBI brain: The good, the bad, and the dysregulated. Exp. Neurol. 2016, 275, 316–327. [Google Scholar] [CrossRef] [Green Version]
- Bennett, M.L.; Bennett, F.C.; Liddelow, S.A.; Ajami, B.; Zamanian, J.L.; Fernhoff, N.B.; Mulinyawe, S.B.; Bohlen, C.J.; Adil, A.; Tucker, A.; et al. New tools for studying microglia in the mouse and human CNS. Proc. Natl. Acad. Sci. USA 2016, 113, E1738–E1746. [Google Scholar] [CrossRef] [Green Version]
- Van Wageningen, T.A.; Vlaar, E.; Kooij, G.; Jongenelen, C.A.M.; Geurts, J.J.G.; Van Dam, A.M. Regulation of microglial TMEM119 and P2RY12 immunoreactivity in multiple sclerosis white and grey matter lesions is dependent on their inflammatory environment. Acta Neuropathol. Commun. 2019, 7, 1–16. [Google Scholar] [CrossRef] [Green Version]
- Satoh, J.I.; Kino, Y.; Asahina, N.; Takitani, M.; Miyoshi, J.; Ishida, T.; Saito, Y. TMEM119 marks a subset of microglia in the human brain. Neuropathology 2016, 36, 39–49. [Google Scholar] [CrossRef]
- Mulder, S.D.; Nielsen, H.M.; Blankenstein, M.A.; Eikelenboom, P.; Veerhuis, R. Apolipoproteins E and J interfere with amyloid-beta uptake by primary human astrocytes and microglia in vitro. Glia 2014, 62, 493–503. [Google Scholar] [CrossRef]
- Morgan, T.E.; Rozovsky, I.; Sarkar, D.K.; Young-Chan, C.S.; Nichols, N.R.; Laping, N.J.; Finch, C.E. Transforming growth factor-β1 induces transforming growth factor-β1 and transforming growth factor-β receptor messenger RNAs and reduces complement C1qB messenger RNA in rat brain microglia. Neuroscience 2000, 101, 313–321. [Google Scholar] [CrossRef]
- Neglia, L.; Fumagalli, S.; Orsini, F.; Zanetti, A.; Perego, C.; De Simoni, M.G. Mannose-binding lectin has a direct deleterious effect on ischemic brain microvascular endothelial cells. J. Cereb. Blood Flow Metab. 2019, 40, 1608–1620. [Google Scholar] [CrossRef]
- Lynch, N.J.; Willis, C.L.; Nolan, C.C.; Roscher, S.; Fowler, M.J.; Weihe, E.; Ray, D.E.; Schwaeble, W.J. Microglial activation and increased synthesis of complement component C1q precedes blood-brain barrier dysfunction in rats. Mol. Immunol. 2004, 40, 709–716. [Google Scholar] [CrossRef] [PubMed]
- Schäfer, M.K.; Schwaeble, W.J.; Post, C.; Salvati, P.; Calabresi, M.; Sim, R.B.; Petry, F.; Loos, M.; Weihe, E. Complement C1q Is Dramatically Up-Regulated in Brain Microglia in Response to Transient Global Cerebral Ischemia. J. Immunol. 2000, 164, 5446–5452. [Google Scholar] [CrossRef] [Green Version]
- Fonseca, M.I.; Chu, S.H.; Hernandez, M.X.; Fang, M.J.; Modarresi, L.; Selvan, P.; MacGregor, G.R.; Tenner, A.J. Cell-specific deletion of C1qa identifies microglia as the dominant source of C1q in mouse brain. J. Neuroinflam. 2017, 14, 1–15. [Google Scholar] [CrossRef] [PubMed] [Green Version]
- Depboylu, C.; Schäfer, M.K.H.; Schwaeble, W.J.; Reinhart, T.A.; Maeda, H.; Mitsuya, H.; Damadzic, R.; Rausch, D.M.; Eiden, L.E.; Weihe, E. Increase of C1q biosynthesis in brain microglia and macrophages during lentivirus infection in the rhesus macaque is sensitive to antiretroviral treatment with 6-chloro-2′,3′-dideoxyguanosine. Neurobiol. Dis. 2005, 20, 12–26. [Google Scholar] [CrossRef] [PubMed]
- Peterson, S.L.; Nguyen, H.X.; Mendez, O.A.; Anderson, A.J. Complement protein C1q modulates neurite outgrowth in vitro and spinal cord axon regeneration in vivo. J. Neurosci. 2015, 35, 4332–4349. [Google Scholar] [CrossRef] [Green Version]
- Lui, H.; Zhang, J.; Makinson, S.R.; Cahill, M.K.; Kelley, K.W.; Huang, H.Y.; Shang, Y.; Oldham, M.C.; Martens, L.H.; Gao, F.; et al. Progranulin Deficiency Promotes Circuit-Specific Synaptic Pruning by Microglia via Complement Activation. Cell 2016, 165, 921–935. [Google Scholar] [CrossRef] [Green Version]
- Sekar, A.; Bialas, A.R.; De Rivera, H.; Davis, A.; Hammond, T.R.; Kamitaki, N.; Tooley, K.; Presumey, J.; Baum, M.; Van Doren, V.; et al. Schizophrenia risk from complex variation of complement component 4. Nature 2016, 530, 177–183. [Google Scholar] [CrossRef] [Green Version]
- Vasek, M.J.; Garber, C.; Dorsey, D.; Durrant, D.M.; Bollman, B.; Soung, A.; Yu, J.; Perez-Torres, C.; Frouin, A.; Wilton, D.K.; et al. A complement-microglial axis drives synapse loss during virus-induced memory impairment. Nature 2016, 534, 538–543. [Google Scholar] [CrossRef] [Green Version]
- Hong, S.; Beja-Glasser, V.F.; Nfonoyim, B.M.; Frouin, A.; Li, S.; Ramakrishnan, S.; Merry, K.M.; Shi, Q.; Rosenthal, A.; Barres, B.A.; et al. Complement and microglia mediate early synapse loss in Alzheimer mouse models. Science 2016, 352. [Google Scholar] [CrossRef] [Green Version]
- Fonseca, M.I.; Kawas, C.H.; Troncoso, J.C.; Tenner, A.J. Neuronal localization of C1q in preclinical Alzheimer’s disease. Neurobiol. Dis. 2004, 15, 40–46. [Google Scholar] [CrossRef] [Green Version]
- Klein, M.A.; Kaeser, P.S.; Schwarz, P.; Weyd, H.; Xenarios, I.; Zinkernagel, R.M.; Carroll, M.C.; Verbeek, J.S.; Botto, M.; Walport, M.J.; et al. Complement facilitates early prion pathogenesis. Nat. Med. 2001, 7, 488–492. [Google Scholar] [CrossRef]
- Galvan, M.D.; Luchetti, S.; Burgos, A.M.; Nguyen, H.X.; Hooshmand, M.J.; Hamers, F.P.T.; Anderson, A.J. Deficiency in complement C1q improves histological and functional locomotor outcome after spinal cord injury. J. Neurosci. 2008, 28, 13876–13888. [Google Scholar] [CrossRef] [PubMed] [Green Version]
- You, Z.; Yang, J.; Takahashi, K.; Yager, P.H.; Kim, H.H.; Qin, T.; Stahl, G.L.; Ezekowitz, R.A.B.; Carroll, M.C.; Whalen, M.J. Reduced tissue damage and improved recovery of motor function after traumatic brain injury in mice deficient in complement component C4. J. Cereb. Blood Flow Metab. 2007, 27, 1954–1964. [Google Scholar] [CrossRef] [Green Version]
- Krukowski, K.; Chou, A.; Feng, X.; Tiret, B.; Paladini, M.S.; Riparip, L.K.; Chaumeil, M.M.; Lemere, C.; Rosi, S. Traumatic brain injury in aged mice induces chronic microglia activation, synapse loss, and complement-dependent memory deficits. Int. J. Mol. Sci. 2018, 19, 3753. [Google Scholar] [CrossRef] [PubMed] [Green Version]
- Ten, V.S.; Sosunov, S.A.; Mazer, S.P.; Stark, R.I.; Caspersen, C.; Sughrue, M.E.; Botto, M.; Connolly, E.S.; Pinsky, D.J. C1q-deficiency is neuroprotective against hypoxic-ischemic brain injury in neonatal mice. Stroke 2005, 36, 2244–2250. [Google Scholar] [CrossRef] [Green Version]
- Benoit, M.E.; Hernandez, M.X.; Dinh, M.L.; Benavente, F.; Vasquez, O.; Tenner, A.J. C1q-induced LRP1B and GPR6 proteins expressed early in Alzheimer disease mouse models, are essential for the C1q-mediated protection against amyloid- β neurotoxicity. J. Biol. Chem. 2013, 288, 654–665. [Google Scholar] [CrossRef] [PubMed] [Green Version]
- Thielens, N.M.; Tedesco, F.; Bohlson, S.S.; Gaboriaud, C.; Tenner, A.J. C1q: A fresh look upon an old molecule. Mol. Immunol. 2017, 89, 73–83. [Google Scholar] [CrossRef] [Green Version]
- Bossi, F.; Tripodo, C.; Rizzi, L.; Bulla, R.; Agostinis, C.; Guarnotta, C.; Munaut, C.; Baldassarre, G.; Papa, G.; Zorzet, S.; et al. C1q as a unique player in angiogenesis with therapeutic implication in wound healing. Proc. Natl. Acad. Sci. USA 2014, 111, 4209–4214. [Google Scholar] [CrossRef] [Green Version]
- Feng, X.; Tonnesen, M.G.; Peerschke, E.I.B.; Ghebrehiwet, B. Cooperation of C1q Receptors and Integrins in C1q-Mediated Endothelial Cell Adhesion and Spreading. J. Immunol. 2002, 168, 2441–2448. [Google Scholar] [CrossRef] [PubMed]
- Van Den Berg, R.H.; Faber-Krol, M.C.; Sim, R.B.; Dana, M.R. The first subcomponent of complement, C1q, triggers the production of IL-8, IL-6, and monocyte chemoattractant peptide-1 by human umbilical vein endothelial cells. J. Immunol. 1998, 161, 6924–6930. [Google Scholar] [PubMed]
- Navratil, J.S.; Watkins, S.C.; Wisnieski, J.J.; Ahearn, J.M. The Globular Heads of C1q Specifically Recognize Surface Blebs of Apoptotic Vascular Endothelial Cells. J. Immunol. 2001, 166, 3231–3239. [Google Scholar] [CrossRef] [PubMed] [Green Version]
- Benoit, M.E.; Tenner, A.J. Complement protein C1q-mediated neuroprotection is correlated with regulation of neuronal gene and microRNA expression. J. Neurosci. 2011, 31, 3459–3469. [Google Scholar] [CrossRef] [Green Version]
- Fraser, D.A.; Pisalyaput, K.; Tenner, A.J. C1q enhances microglial clearance of apoptotic neurons and neuronal blebs, and modulates subsequent inflammatory cytokine production. J. Neurochem. 2010, 112, 733–743. [Google Scholar] [CrossRef] [Green Version]
- Pisalyaput, K.; Tenner, A.J. Complement component C1q inhibits β-amyloid- and serum amyloid P-induced neurotoxicity via caspase- and calpain-independent mechanisms. J. Neurochem. 2008, 104, 696–707. [Google Scholar] [CrossRef]
- Boone, D.R.; Weisz, H.A.; Willey, H.E.; Torres, K.E.O.; Falduto, M.T.; Sinha, M.; Spratt, H.; Bolding, I.J.; Johnson, K.M.; Parsley, M.A.; et al. Traumatic brain injury induces long-lasting changes in immune and regenerative signaling. PLoS ONE 2019, 14, 1–27. [Google Scholar] [CrossRef] [Green Version]
- Munivenkatappa, A.; Agrawal, A. Role of thalamus in recovery of traumatic brain injury. J. Neurosci. Rural Pract. 2016, 7, S76–S79. [Google Scholar] [CrossRef] [Green Version]
- Gesuete, R.; Storini, C.; Fantin, A.; Stravalaci, M.; Zanier, E.R.; Orsini, F.; Vietsch, H.; Mannesse, M.L.M.; Ziere, B.; Gobbi, M.; et al. Recombinant C1 inhibitor in brain ischemic injury. Ann. Neurol. 2009, 66, 332–342. [Google Scholar] [CrossRef]
- Wagner, S.; Lynch, N.J.; Walter, W.; Schwaeble, W.J.; Loos, M. Differential Expression of the Murine Mannose-Binding Lectins A and C in Lymphoid and Nonlymphoid Organs and Tissues. J. Immunol. 2003, 170, 1462–1465. [Google Scholar] [CrossRef] [Green Version]
- Lu, J.; Wu, X.; Teh, B.K. The regulatory roles of C1q. Immunobiology 2007, 212, 245–252. [Google Scholar] [CrossRef] [PubMed]
- Vegh, Z.; Kew, R.R.; Gruber, B.L.; Ghebrehiwet, B. Chemotaxis of human monocyte-derived dendritic cells to complement component C1q is mediated by the receptors gC1qR and cC1qR. Mol. Immunol. 2006, 43, 1402–1407. [Google Scholar] [CrossRef] [PubMed]
- Longhi, L.; Orsini, F.; De Blasio, D.; Fumagalli, S.; Ortolano, F.; Locatelli, M.; Stocchetti, N.; De Simoni, M.G. Mannose-binding lectin is expressed after clinical and experimental traumatic brain injury and its deletion is protective. Crit. Care Med. 2014, 42, 1910–1918. [Google Scholar] [CrossRef] [PubMed]
- Farrar, C.A.; Tran, D.; Li, K.; Wu, W.; Peng, Q.; Schwaeble, W.; Zhou, W.; Sacks, S.H. Collectin-11 detects stress-induced L-fucose pattern to trigger renal epithelial injury. J. Clin. Investig. 2016, 126. [Google Scholar] [CrossRef] [Green Version]
- Mercurio, D.; Oggioni, M.; Fumagalli, S.; Lynch, N.J.; Roscher, S.; Minuta, D.; Perego, C.; Ippati, S.; Wallis, R.; Schwaeble, W.J.; et al. Targeted deletions of complement lectin pathway genes improve outcome in traumatic brain injury, with MASP-2 playing a major role. Acta Neuropathol. Commun. 2020, 8, 1–13. [Google Scholar] [CrossRef]
- Endo, Y.; Liu, Y.; Kanno, K.; Takahashi, M.; Matsushita, M.; Fujita, T. Identification of the mouse H-ficolin gene as a pseudogene and orthology between mouse ficolins A/B and human L-/M-ficolins. Genomics 2004, 84, 737–744. [Google Scholar] [CrossRef]
- Kwon, S.; Kim, M.S.; Kim, D.; Lee, K.W.; Choi, S.Y.; Park, J.; Yeon, H.K.; Lee, Y.; Kwon, H.J. Identification of a functionally relevant signal peptide of mouse ficolin A. J. Biochem. Mol. Biol. 2007, 40, 532–538. [Google Scholar] [CrossRef] [Green Version]
- Zhang, Y.; Chen, K.; Sloan, S.A.; Bennett, M.L.; Scholze, A.R.; O’Keeffe, S.; Phatnani, H.P.; Guarnieri, P.; Caneda, C.; Ruderisch, N.; et al. An RNA-sequencing transcriptome and splicing database of glia, neurons, and vascular cells of the cerebral cortex. J. Neurosci. 2014, 34, 11929–11947. [Google Scholar] [CrossRef]
- Hunold, K.; Weber-Steffens, D.; Runza, V.L.; Jensenius, J.C.; Männel, D.N. Functional analysis of mouse ficolin-B and detection in neutrophils. Immunobiology 2012, 217, 982–985. [Google Scholar] [CrossRef]
- Riedl, M.A.; Grivcheva-Panovska, V.; Moldovan, D.; Baker, J.; Yang, W.H.; Giannetti, B.M.; Reshef, A.; Andrejevic, S.; Lockey, R.F.; Hakl, R.; et al. Recombinant human C1 esterase inhibitor for prophylaxis of hereditary angio-oedema: A phase 2, multicentre, randomised, double-blind, placebo-controlled crossover trial. Lancet 2017, 390, 1595–1602. [Google Scholar] [CrossRef]
- Llull, L.; Thiel, S.; Amaro, S.; Cervera, Á.; Planas, A.M.; Chamorro, Á. Ficolin-1 Levels in Patients Developing Vasospasm and Cerebral Ischemia After Spontaneous Subarachnoid Hemorrhage. Mol. Neurobiol. 2017, 54, 6572–6580. [Google Scholar] [CrossRef] [PubMed]
- Katayama, M.; Ota, K.; Nagi-Miura, N.; Ohno, N.; Yabuta, N.; Nojima, H.; Kumanogoh, A.; Hirano, T. Ficolin-1 is a promising therapeutic target for autoimmune diseases. Int Immunol. 2019, 31, 23–32. [Google Scholar] [CrossRef] [PubMed] [Green Version]
- Rojewska, E.; Zychowska, M.; Piotrowska, A.; Kreiner, G.; Nalepa, I.; Mika, J. Involvement of Macrophage Inflammatory Protein-1 Family Members in the Development of Diabetic Neuropathy and Their Contribution to Effectiveness of Morphine. Front. Immunol. 2018, 9. [Google Scholar] [CrossRef] [PubMed] [Green Version]
- Piotrowska, A.; Kwiatkowski, K.; Rojewska, E.; Makuch, W.; Mika, J. Maraviroc reduces neuropathic pain through polarization of microglia and astroglia—Evidence from in vivo and in vitro studies. Neuropharmacology 2016, 108, 207–219. [Google Scholar] [CrossRef] [PubMed]
- Morganti, J.M.; Riparip, L.K.; Chou, A.; Liu, S.; Gupta, N.; Rosi, S. Age exacerbates the CCR2/5-mediated neuroinflammatory response to traumatic brain injury. J. Neuroinflam. 2016, 13. [Google Scholar] [CrossRef] [Green Version]
- Lively, S.; Schlichter, L.C. Microglia responses to pro-inflammatory stimuli (LPS, IFNγ+TNFα) and reprogramming by resolving cytokines (IL-4, IL-10). Front. Cell. Neurosci. 2018, 12. [Google Scholar] [CrossRef] [Green Version]
- Chomczynski, P.; Sacchi, N. Single-step method of RNA isolation by acid guanidinium thiocyanate-phenol-chloroform extraction. Anal. Biochem. 1987, 162, 156–159. [Google Scholar] [CrossRef]
- Kwiatkowski, K.; Piotrowska, A.; Rojewska, E.; Makuch, W.; Mika, J. The RS504393 Influences the Level of Nociceptive Factors and Enhances Opioid Analgesic Potency in Neuropathic Rats. J. Neuroimmune Pharmacol. 2017, 12, 402–419. [Google Scholar] [CrossRef] [Green Version]


| Brain Areas | MBL-A | MBL-C |
|---|---|---|
| cortex | not detected | not detected |
| striatum | not detected | not detected |
| thalamus | not detected | not detected |
| hippocampus | not detected | not detected |
Publisher’s Note: MDPI stays neutral with regard to jurisdictional claims in published maps and institutional affiliations. |
© 2020 by the authors. Licensee MDPI, Basel, Switzerland. This article is an open access article distributed under the terms and conditions of the Creative Commons Attribution (CC BY) license (http://creativecommons.org/licenses/by/4.0/).
Share and Cite
Ciechanowska, A.; Ciapała, K.; Pawlik, K.; Oggioni, M.; Mercurio, D.; De Simoni, M.-G.; Mika, J. Initiators of Classical and Lectin Complement Pathways Are Differently Engaged after Traumatic Brain Injury—Time-Dependent Changes in the Cortex, Striatum, Thalamus and Hippocampus in a Mouse Model. Int. J. Mol. Sci. 2021, 22, 45. https://0-doi-org.brum.beds.ac.uk/10.3390/ijms22010045
Ciechanowska A, Ciapała K, Pawlik K, Oggioni M, Mercurio D, De Simoni M-G, Mika J. Initiators of Classical and Lectin Complement Pathways Are Differently Engaged after Traumatic Brain Injury—Time-Dependent Changes in the Cortex, Striatum, Thalamus and Hippocampus in a Mouse Model. International Journal of Molecular Sciences. 2021; 22(1):45. https://0-doi-org.brum.beds.ac.uk/10.3390/ijms22010045
Chicago/Turabian StyleCiechanowska, Agata, Katarzyna Ciapała, Katarzyna Pawlik, Marco Oggioni, Domenico Mercurio, Maria-Grazia De Simoni, and Joanna Mika. 2021. "Initiators of Classical and Lectin Complement Pathways Are Differently Engaged after Traumatic Brain Injury—Time-Dependent Changes in the Cortex, Striatum, Thalamus and Hippocampus in a Mouse Model" International Journal of Molecular Sciences 22, no. 1: 45. https://0-doi-org.brum.beds.ac.uk/10.3390/ijms22010045