
The TRPA1 Agonist Cinnamaldehyde Induces the Secretion of HCO3− by the Porcine Colon

 ,
,
Abstract
:1. Introduction
2. Results
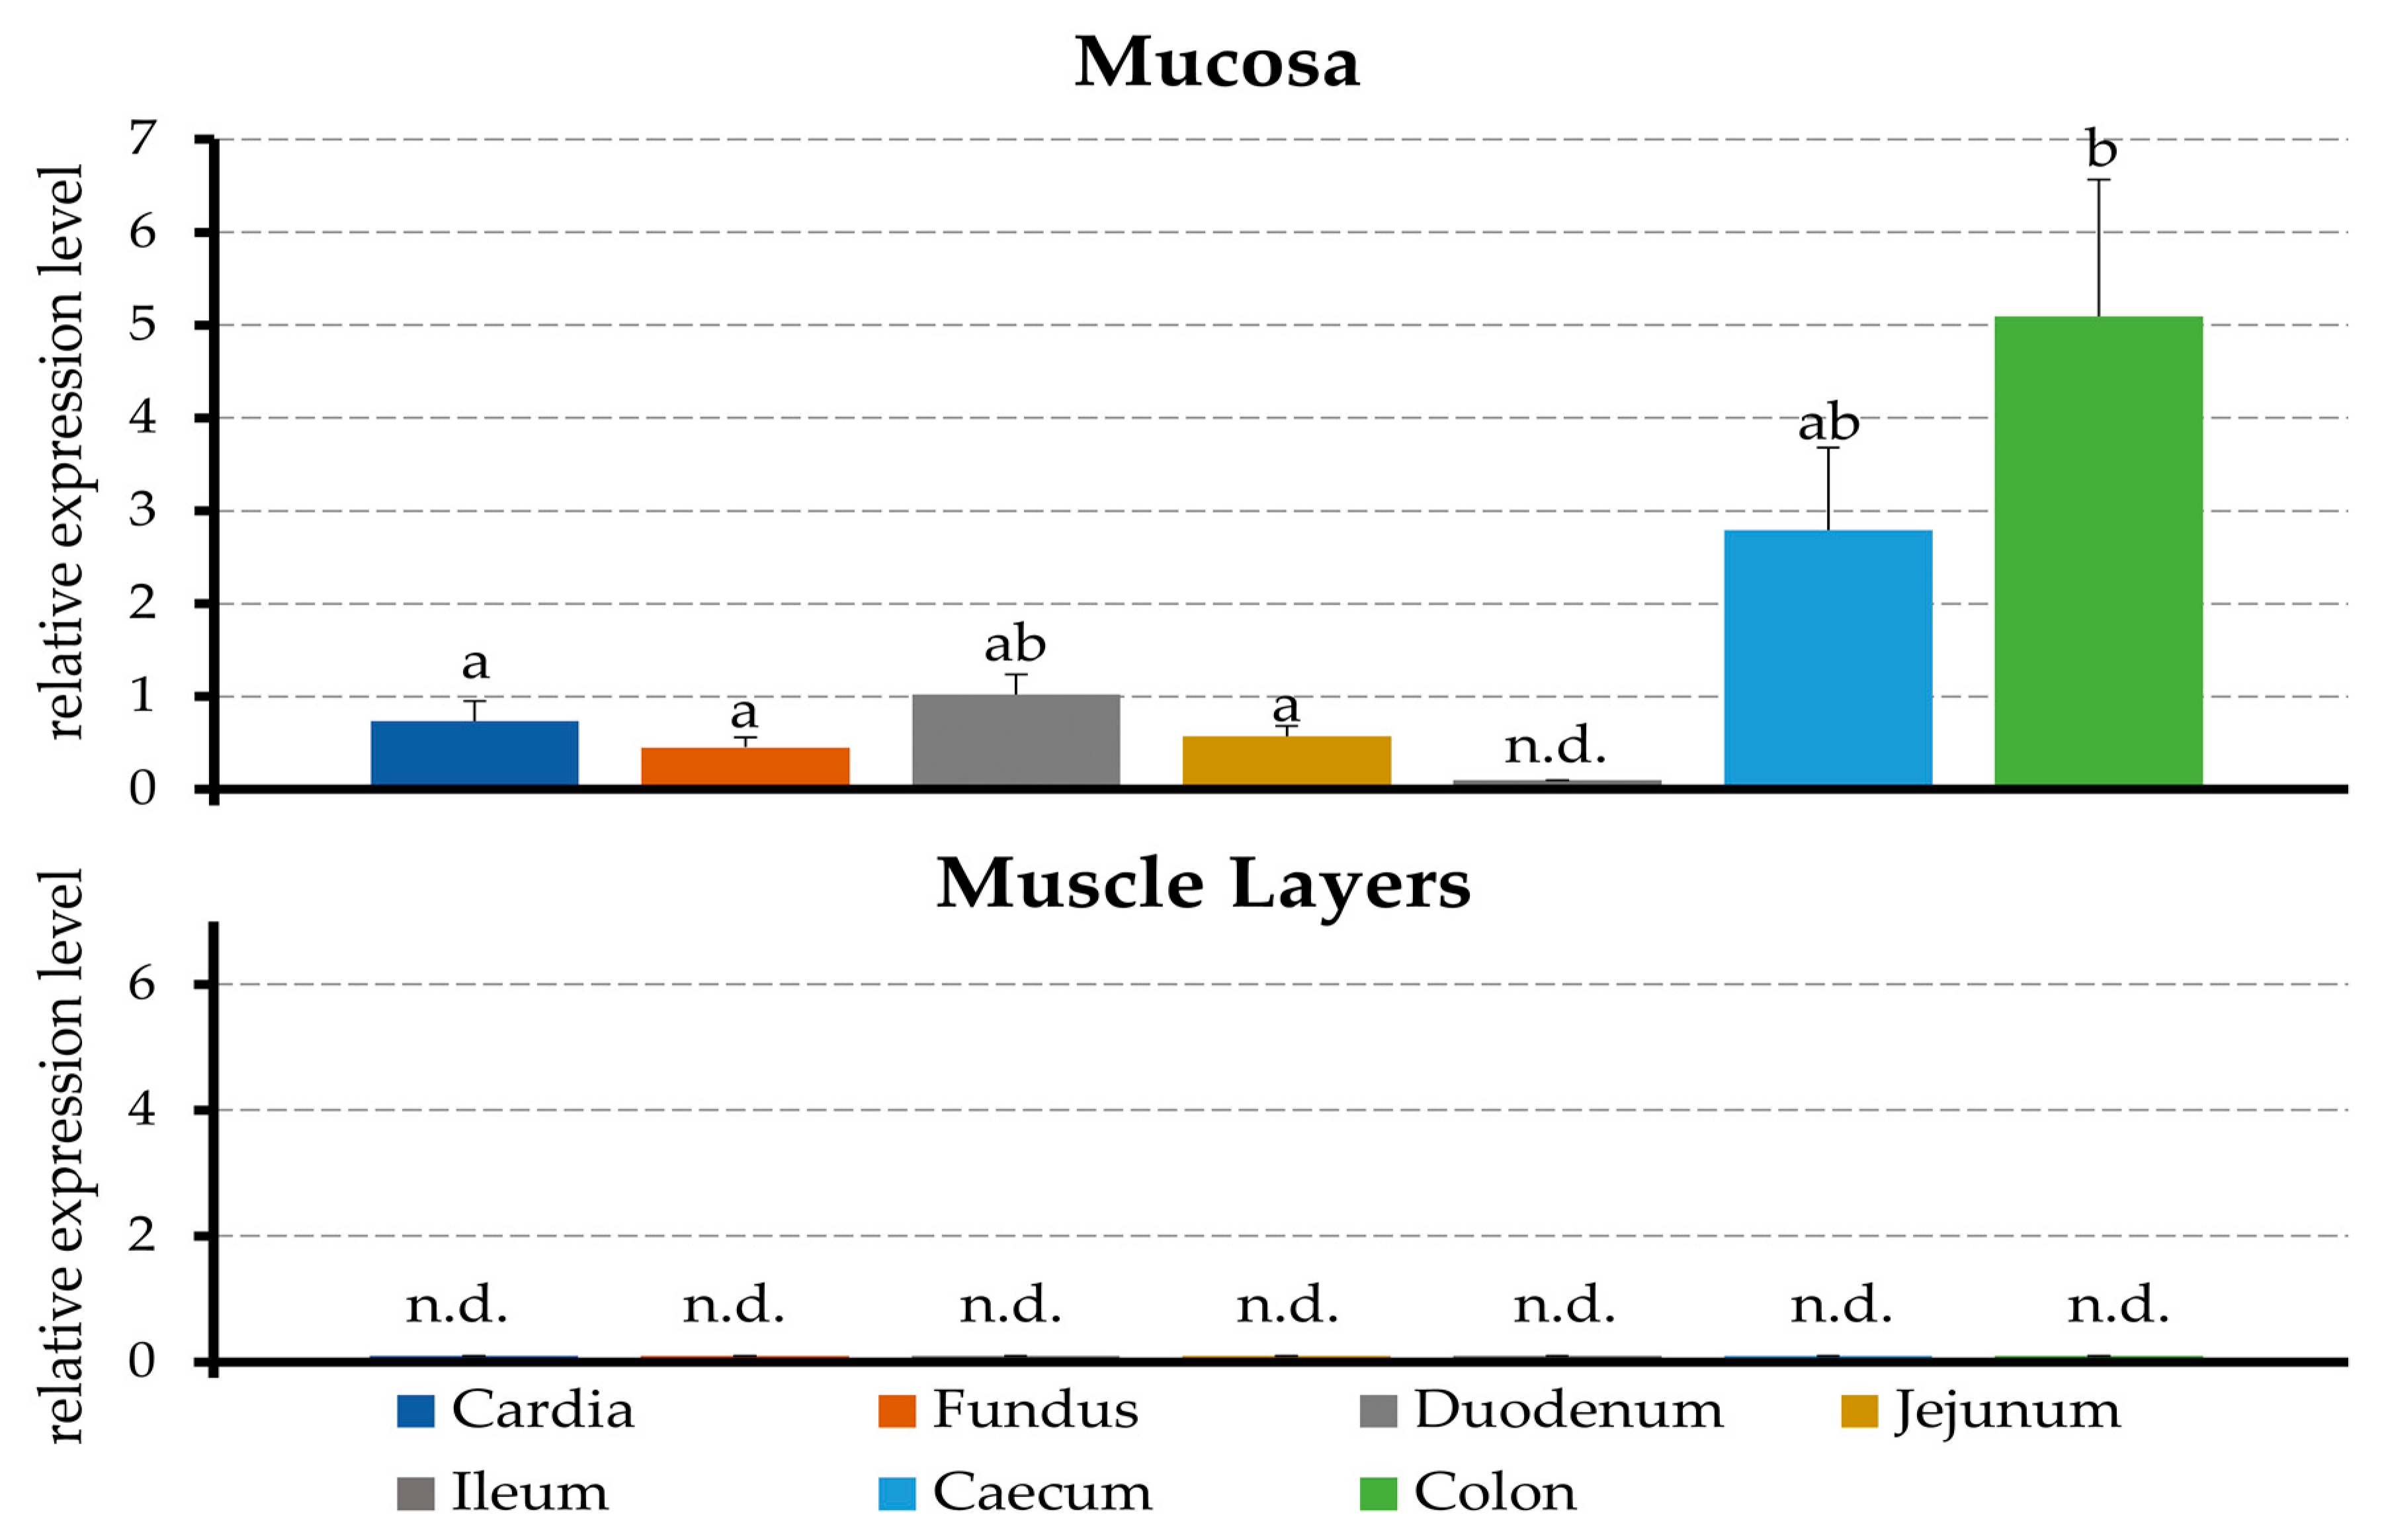
2.1. PCR
2.2. Ussing Chamber Studies
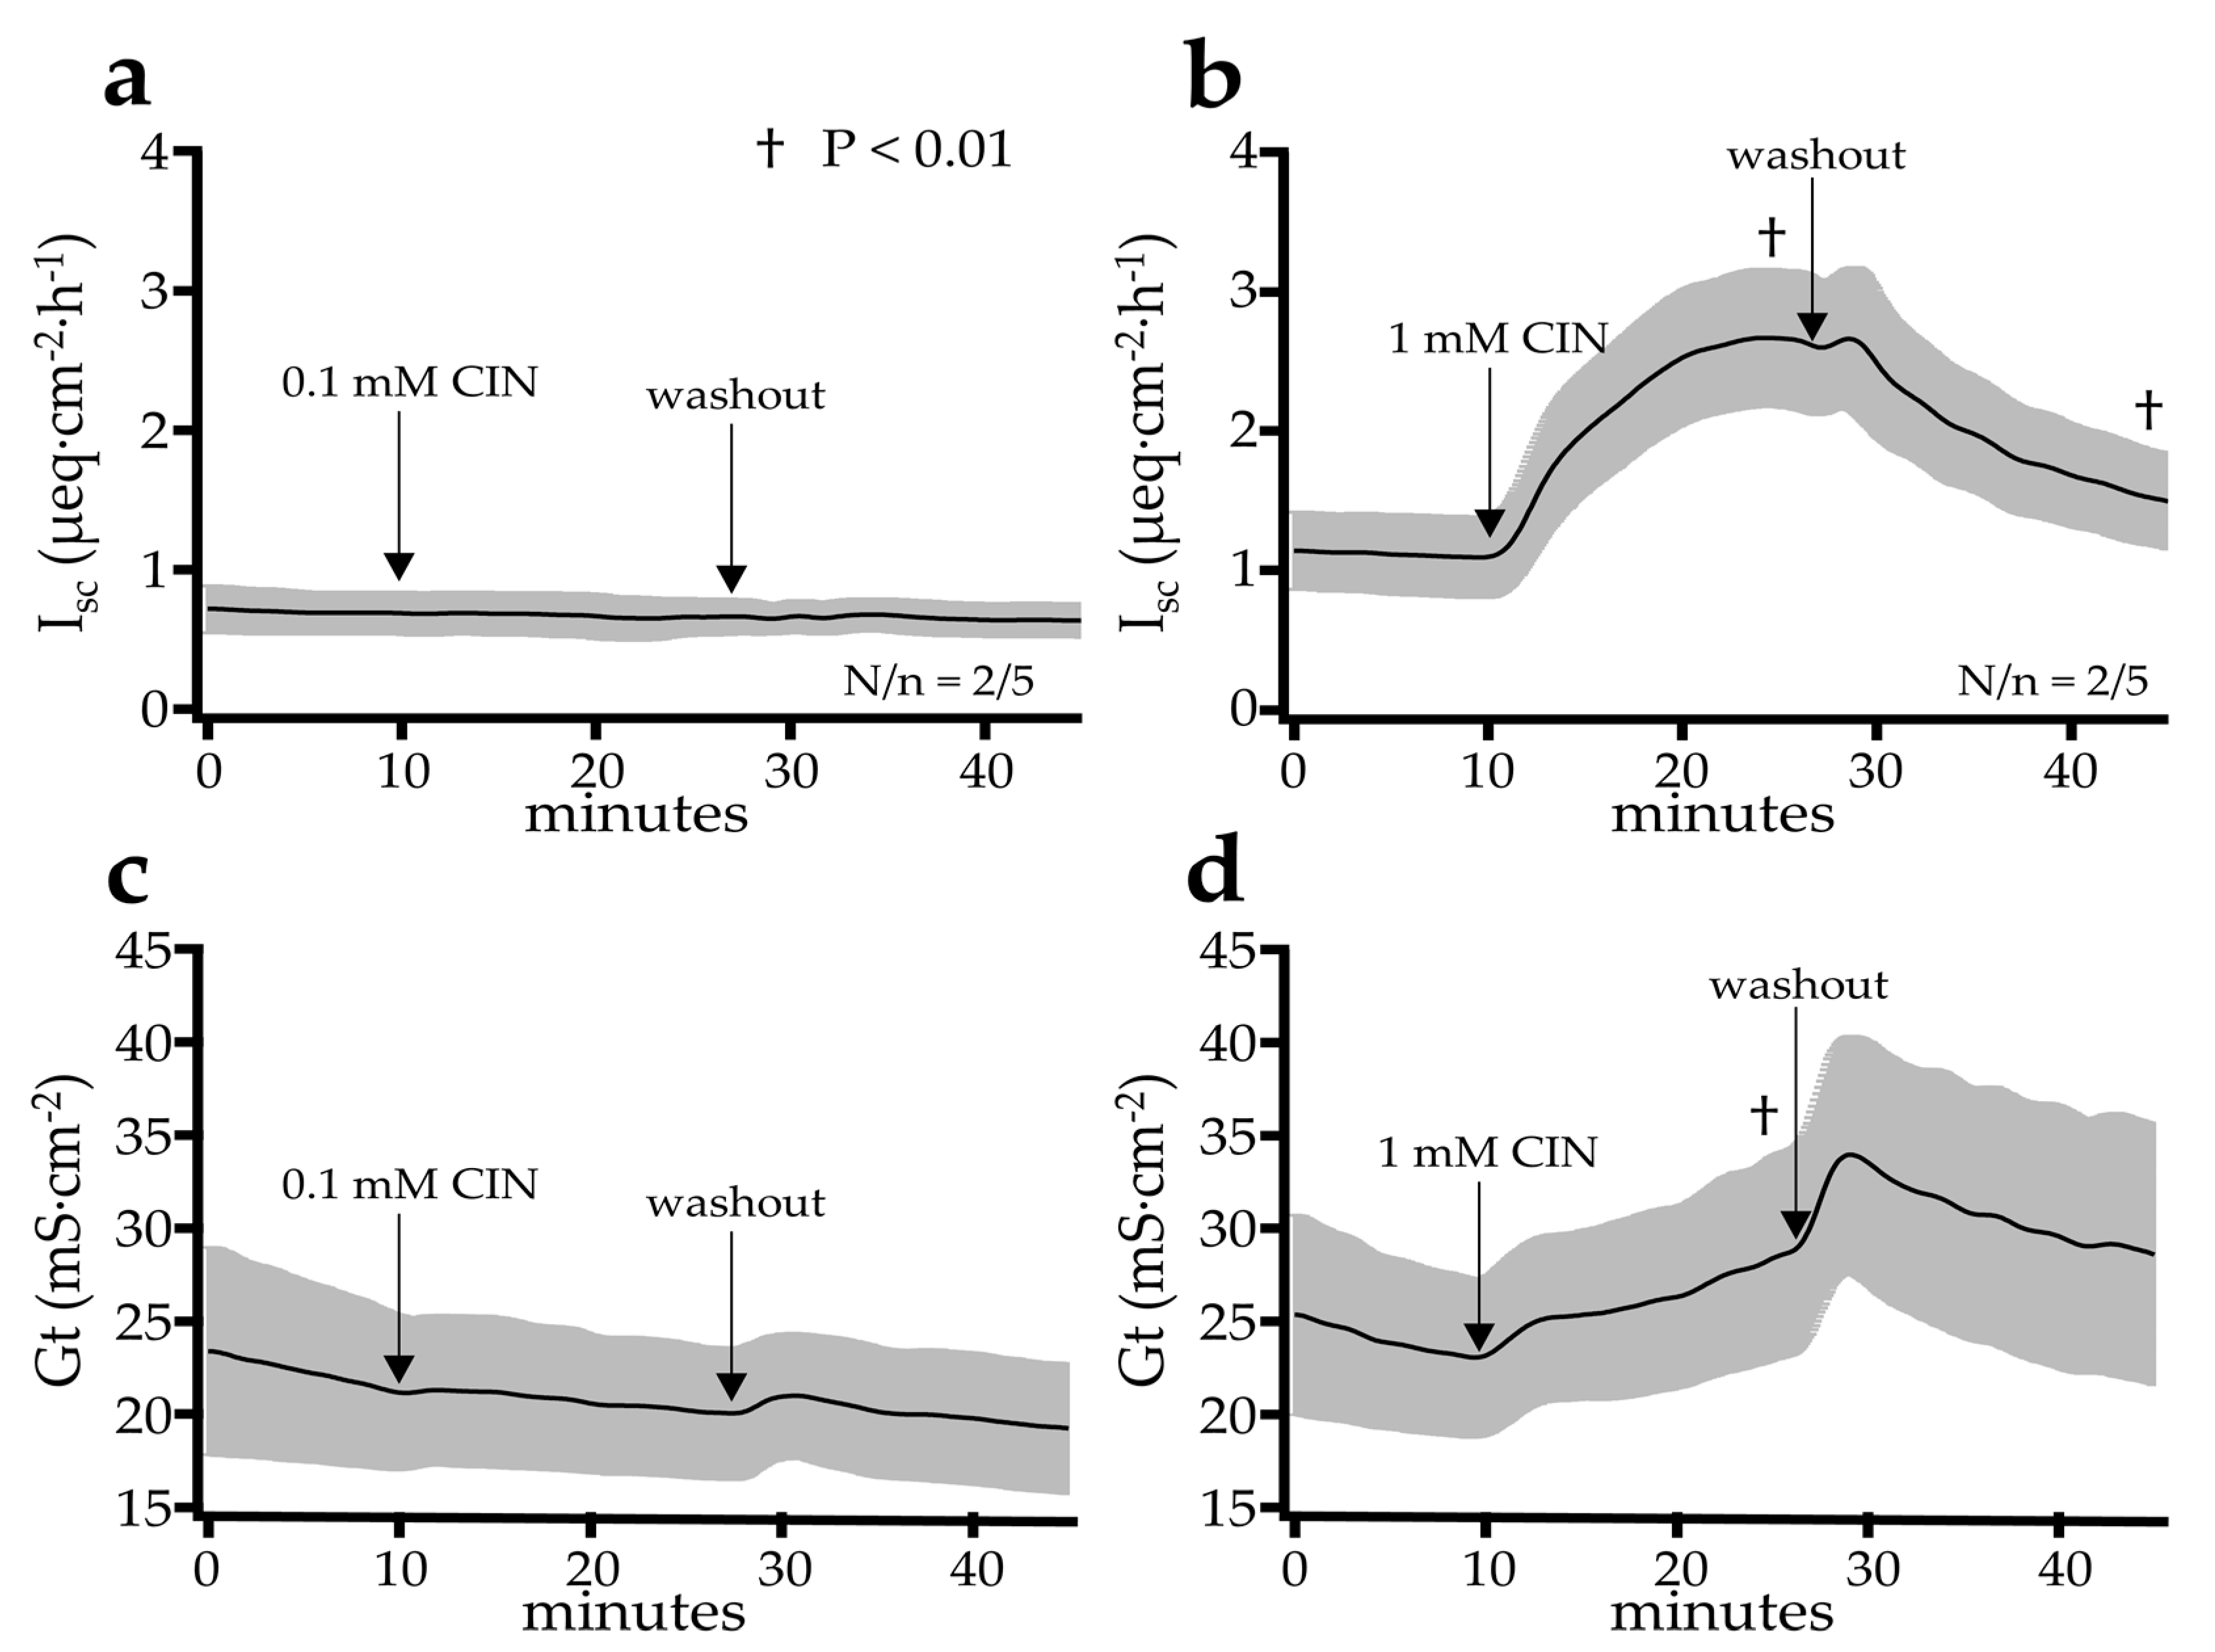
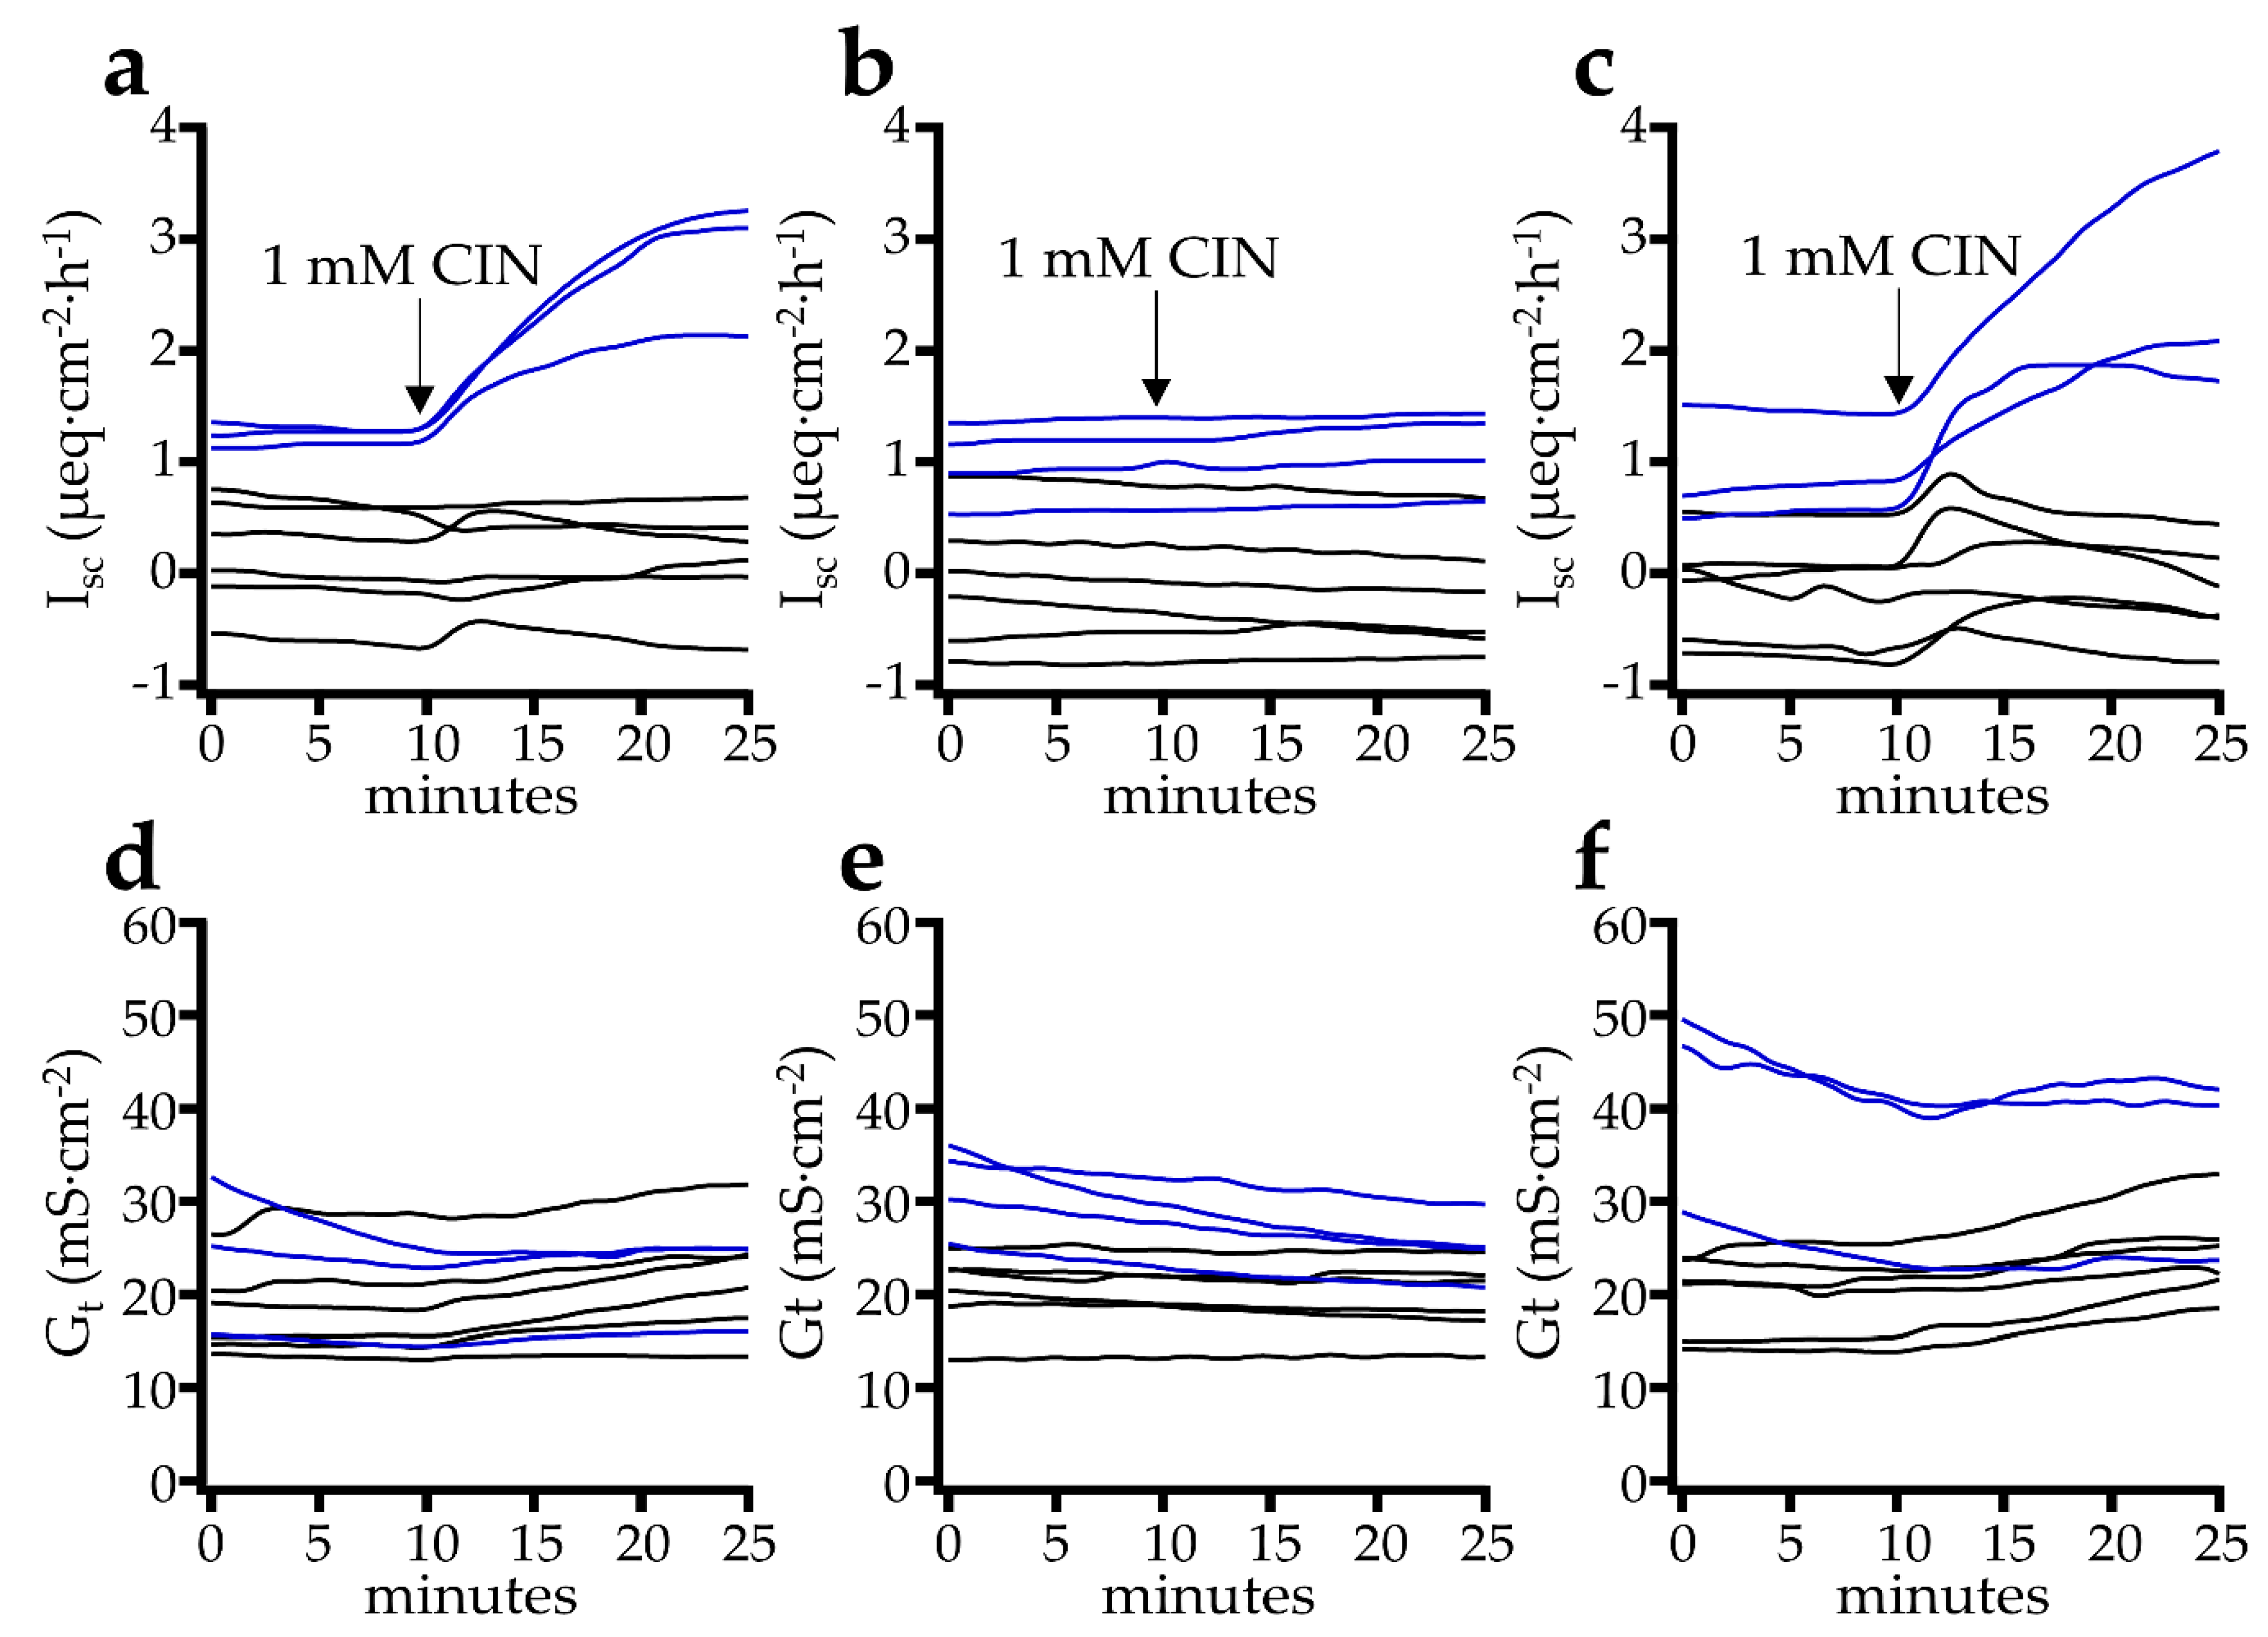
2.2.1. Effect of Cinnamaldehyde
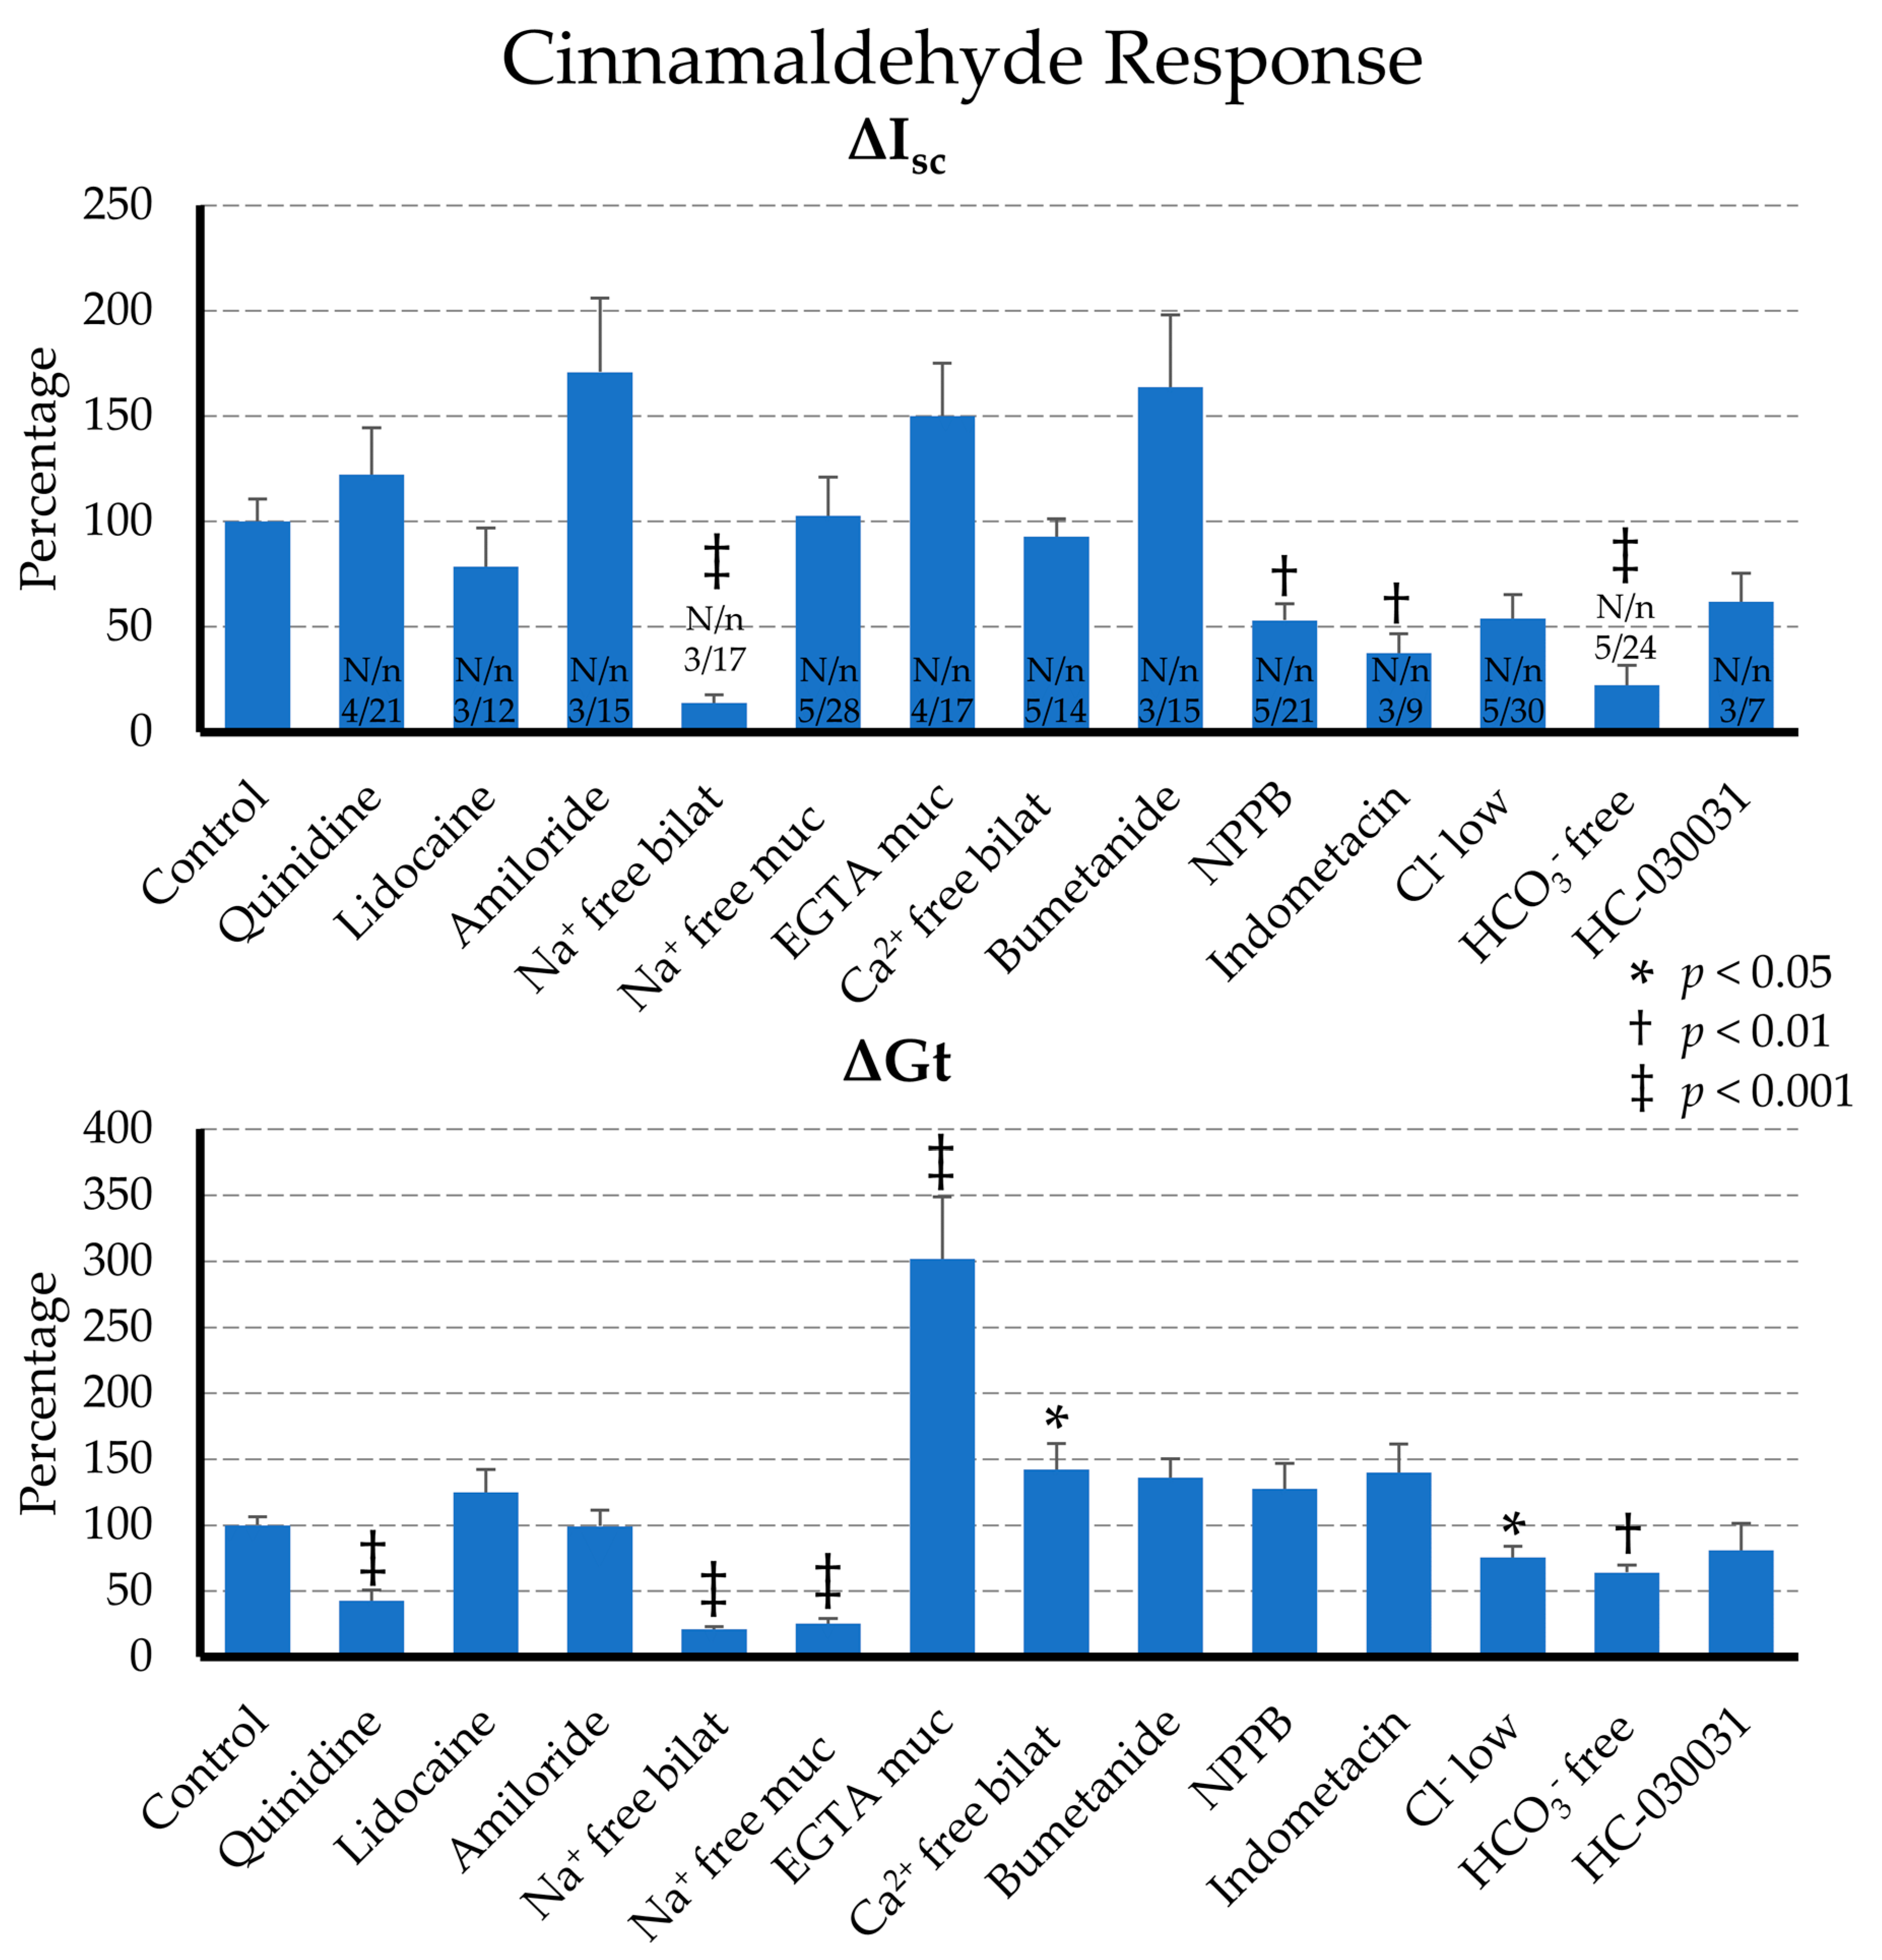
2.2.2. Effect of Blockers on the Cinnamaldehyde Response
2.2.3. Effect of Ion Replacement on the Cinnamaldehyde Response
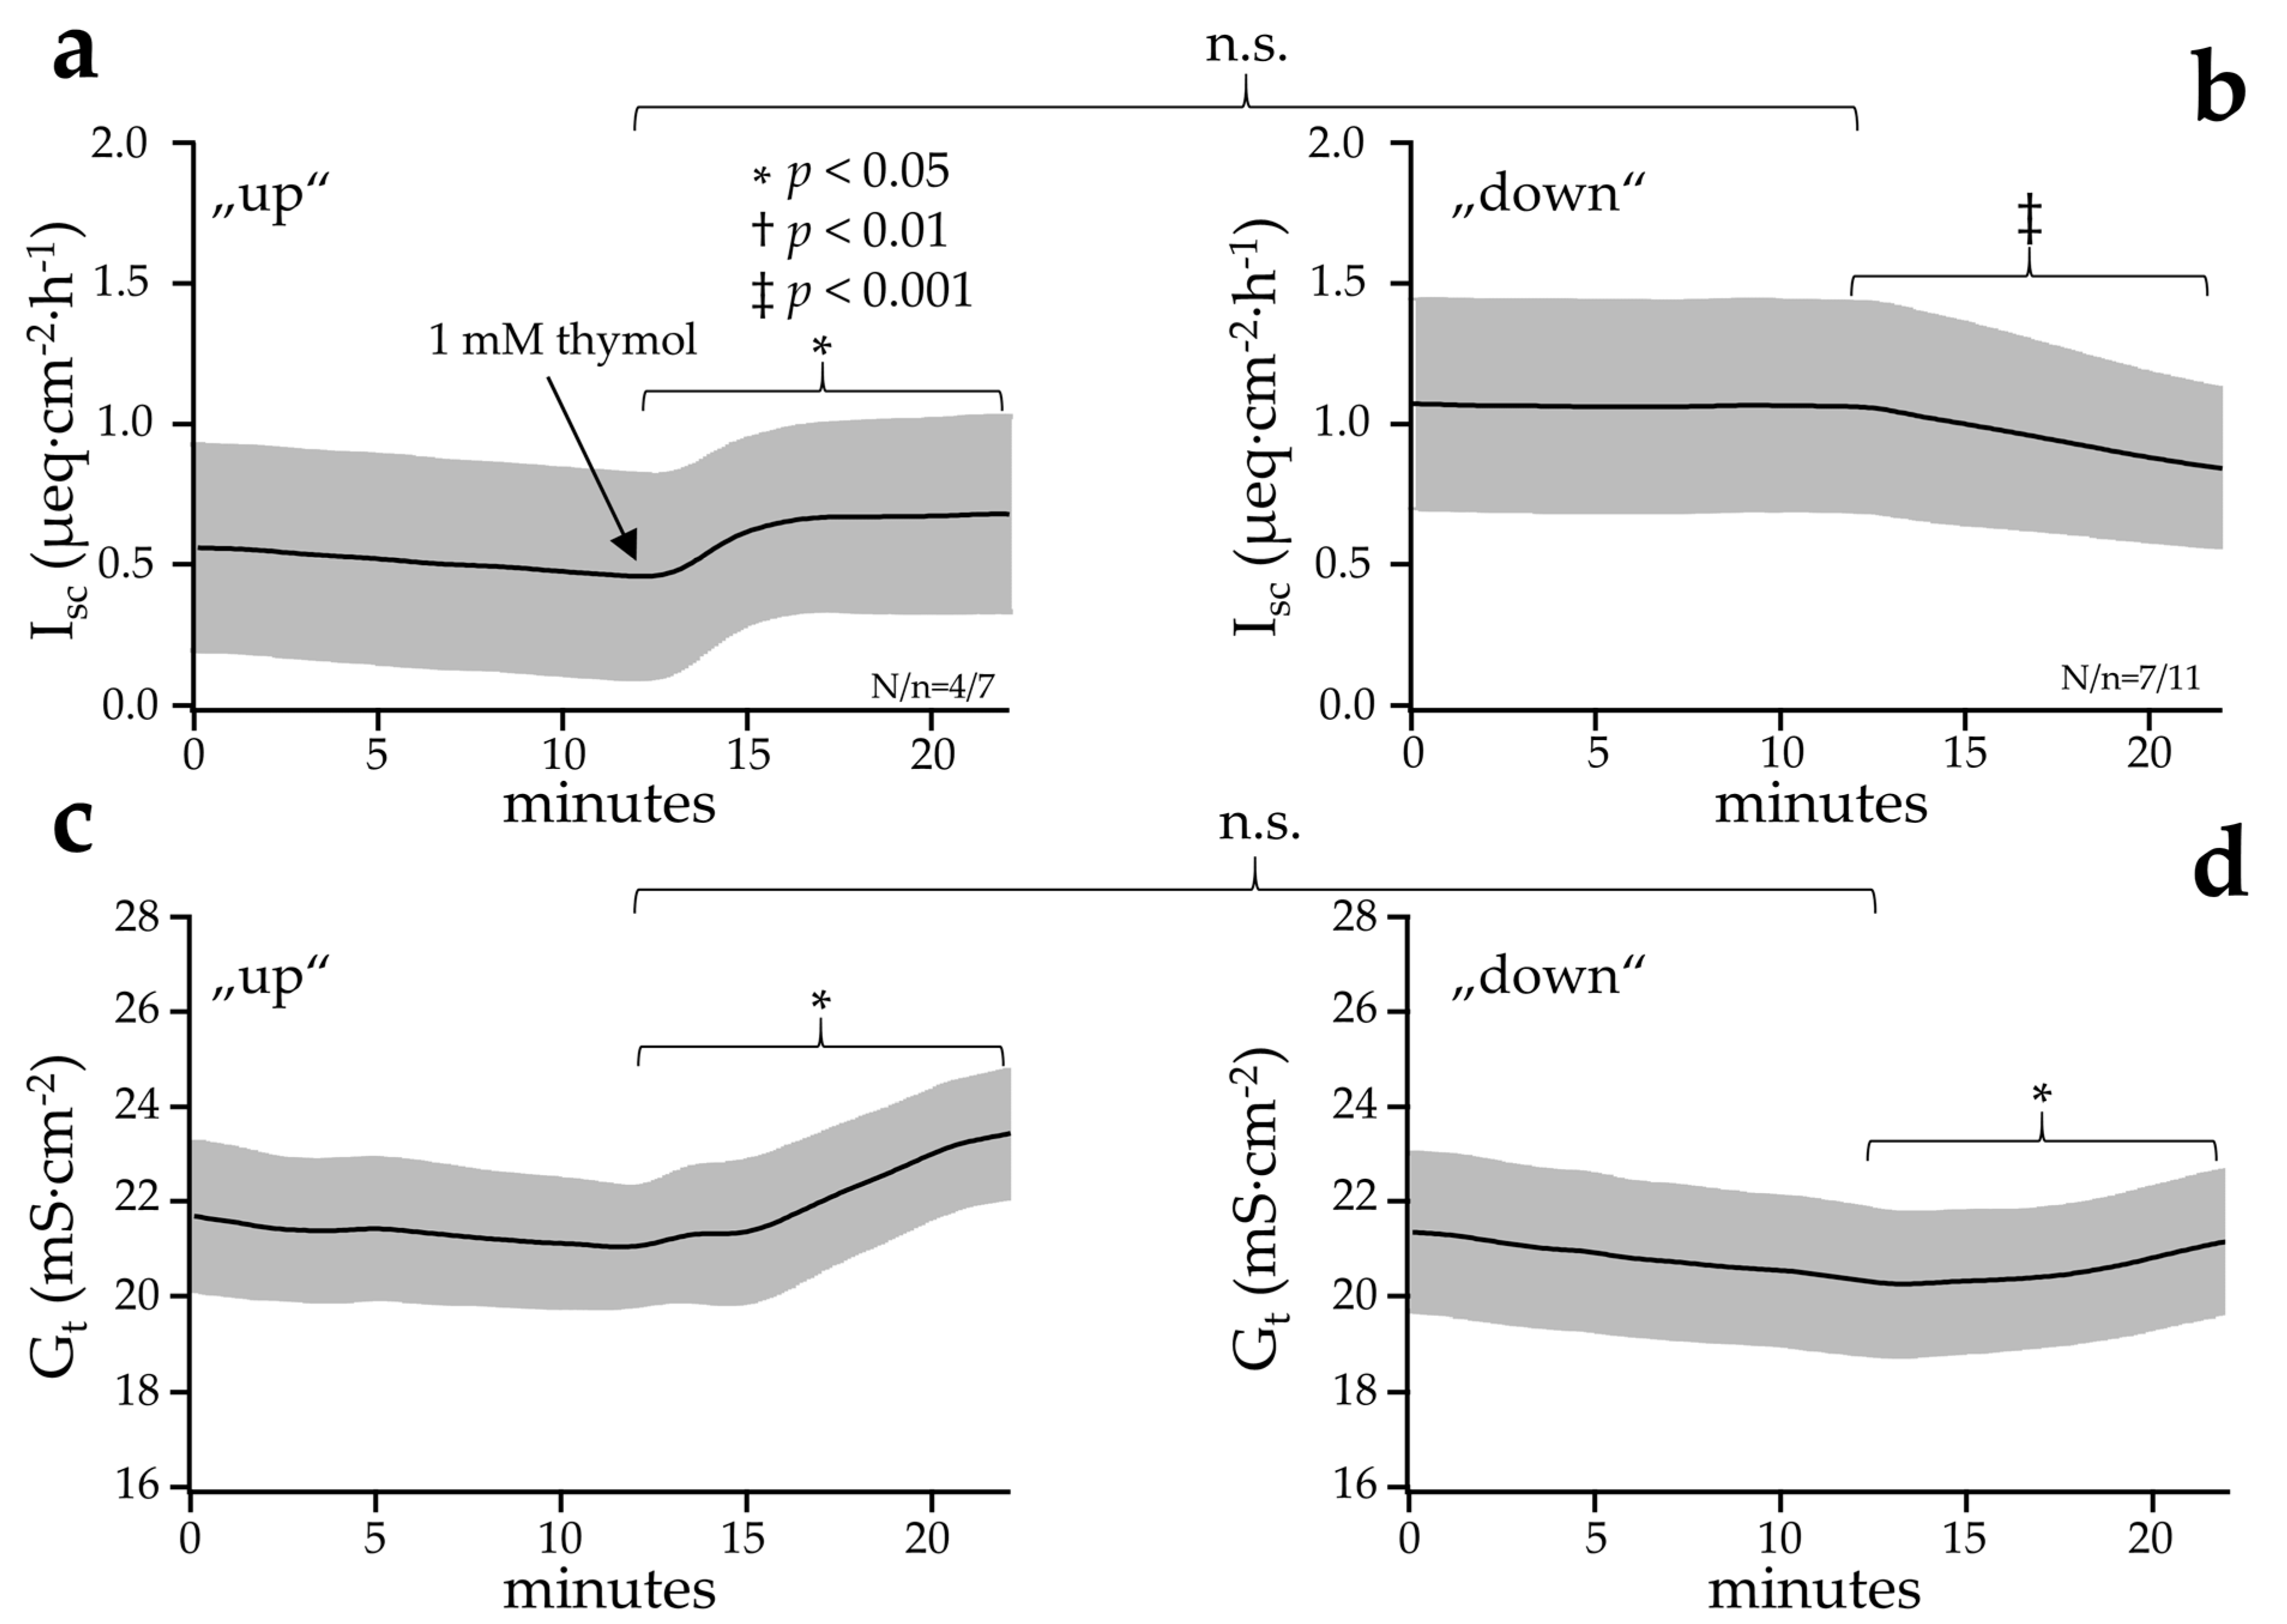
2.2.4. Effect of Thymol
2.3. Patch Clamp Studies
3. Discussion
3.1. Expression of mRNA for TRPA1 by the Tissues of the Porcine Gastrointestinal Tract
3.2. Effect of Blockers on Isc and Gt in Ringer
3.3. Mucosal Cinnamaldehyde Induces an Increase in Isc and Gt
3.4. Does Cinnamaldehyde Activate TRPV3?
3.5. Gt Is Sensitive to Quinidine
3.6. Isc and ΔGt Can Be Inhibited by Indometacin
3.7. Bicarbonate Is a Bigger Player Than Chloride in ΔIsc and ΔGt
3.8. Gt Requires the Presence of Mucosal Na+
3.9. Removal of Ca2+ Enhances ΔGt
3.10. Does the Opening of TRPA1 Inhibit the Uptake and Degradation of Prostaglandins?
3.11. Barrier Effects
3.12. Cinnamaldehyde, Bicarbonate and the Buffering of Fermentational Acids in the Colon
4. Materials and Methods
4.1. Gastrointestinal Tissue
4.2. Molecular Detection of the TRPA1 Channel in the Gastrointestinal Tissue
4.3. Ussing Chamber Studies
4.4. Patch Clamp Studies
4.5. Data and Statistics
Supplementary Materials
Author Contributions
Funding
Institutional Review Board Statement
Data Availability Statement
Acknowledgments
Conflicts of Interest
References
- Talavera, K.; Startek, J.B.; Alvarez-Collazo, J.; Boonen, B.; Alpizar, Y.A.; Sanchez, A.; Naert, R.; Nilius, B. Mammalian Transient Receptor Potential TRPA1 Channels: From Structure to Disease. Physiol. Rev. 2020, 100, 725–803. [Google Scholar] [CrossRef]
- Nilius, B.; Appendino, G.; Owsianik, G. The Transient Receptor Potential Channel TRPA1: From Gene to Pathophysiology. Pflugers. Arch. 2012, 464, 425–458. [Google Scholar] [CrossRef] [PubMed]
- Bobkov, Y.V.; Corey, E.A.; Ache, B.W. The pore properties of human nociceptor channel TRPA1 evaluated in single channel recordings. Biochim. Biophys. Acta 2011, 1808, 1120–1128. [Google Scholar] [CrossRef] [PubMed] [Green Version]
- Owsianik, G.; Talavera, K.; Voets, T.; Nilius, B. Permeation and selectivity of TRP channels. Annu. Rev. Physiol. 2006, 68, 685–717. [Google Scholar] [CrossRef]
- Kremeyer, B.; Lopera, F.; Cox, J.J.; Momin, A.; Rugiero, F.; Marsh, S.; Woods, C.G.; Jones, N.G.; Paterson, K.J.; Fricker, F.R.; et al. A gain-of-function mutation in TRPA1 causes familial episodic pain syndrome. Neuron 2010, 66, 671–680. [Google Scholar] [CrossRef] [PubMed] [Green Version]
- Taylor-Clark, T.E.; Undem, B.J.; Macglashan, D.W., Jr.; Ghatta, S.; Carr, M.J.; McAlexander, M.A. Prostaglandin-induced activation of nociceptive neurons via direct interaction with transient receptor potential A1 (TRPA1). Mol. Pharmacol. 2008, 73, 274–281. [Google Scholar] [CrossRef] [Green Version]
- Cruz-Orengo, L.; Dhaka, A.; Heuermann, R.J.; Young, T.J.; Montana, M.C.; Cavanaugh, E.J.; Kim, D.; Story, G.M. Cutaneous nociception evoked by 15-delta PGJ2 via activation of ion channel TRPA1. Mol. Pain 2008, 4, 30. [Google Scholar] [CrossRef] [PubMed] [Green Version]
- Andersson, D.A.; Gentry, C.; Moss, S.; Bevan, S. Transient receptor potential A1 is a sensory receptor for multiple products of oxidative stress. J. Neurosci. 2008, 28, 2485–2494. [Google Scholar] [CrossRef] [Green Version]
- Yilmaz, M.S.; Goktalay, G.; Millington, W.R.; Myer, B.S.; Cutrera, R.A.; Feleder, C. Lipopolysaccharide-induced hypotension is mediated by a neural pathway involving the vagus nerve, the nucleus tractus solitarius and alpha-adrenergic receptors in the preoptic anterior hypothalamic area. J. Neuroimmunol. 2008, 203, 39–49. [Google Scholar] [CrossRef]
- Alaimo, A.; Rubert, J. The Pivotal Role of TRP Channels in Homeostasis and Diseases throughout the Gastrointestinal Tract. Int. J. Mol. Sci. 2019, 20, 5277. [Google Scholar] [CrossRef] [Green Version]
- Holzer, P. Transient receptor potential (TRP) channels as drug targets for diseases of the digestive system. Pharmacol. Ther. 2011, 131, 142–170. [Google Scholar] [CrossRef] [PubMed] [Green Version]
- Yang, Y.; Wang, S.; Kobayashi, K.; Hao, Y.; Kanda, H.; Kondo, T.; Kogure, Y.; Yamanaka, H.; Yamamoto, S.; Li, J.; et al. TRPA1-expressing lamina propria mesenchymal cells regulate colonic motility. JCI Insight 2019, 4. [Google Scholar] [CrossRef] [PubMed]
- Brierley, S.M.; Hughes, P.A.; Page, A.J.; Kwan, K.Y.; Martin, C.M.; O’Donnell, T.A.; Cooper, N.J.; Harrington, A.M.; Adam, B.; Liebregts, T.; et al. The ion channel TRPA1 is required for normal mechanosensation and is modulated by algesic stimuli. Gastroenterology 2009, 137, 2084–2095 e2083. [Google Scholar] [CrossRef] [PubMed] [Green Version]
- Kaji, I.; Karaki, S.; Kuwahara, A. Effects of luminal thymol on epithelial transport in human and rat colon. Am. J. Physiol. Gastrointest. Liver Physiol. 2011, 300, G1132–G1143. [Google Scholar] [CrossRef] [Green Version]
- Kun, J.; Szitter, I.; Kemeny, A.; Perkecz, A.; Kereskai, L.; Pohoczky, K.; Vincze, A.; Godi, S.; Szabo, I.; Szolcsanyi, J.; et al. Upregulation of the transient receptor potential ankyrin 1 ion channel in the inflamed human and mouse colon and its protective roles. PLoS ONE 2014, 9, e108164. [Google Scholar] [CrossRef]
- Fothergill, L.J.; Callaghan, B.; Rivera, L.R.; Lieu, T.; Poole, D.P.; Cho, H.J.; Bravo, D.M.; Furness, J.B. Effects of Food Components That Activate TRPA1 Receptors on Mucosal Ion Transport in the Mouse Intestine. Nutrients 2016, 8, 623. [Google Scholar] [CrossRef] [Green Version]
- Balemans, D.; Boeckxstaens, G.E.; Talavera, K.; Wouters, M.M. Transient receptor potential ion channel function in sensory transduction and cellular signaling cascades underlying visceral hypersensitivity. Am. J. Physiol. Gastrointest. Liver Physiol. 2017, 312, G635–G648. [Google Scholar] [CrossRef]
- Meseguer, V.; Alpizar, Y.A.; Luis, E.; Tajada, S.; Denlinger, B.; Fajardo, O.; Manenschijn, J.A.; Fernandez-Pena, C.; Talavera, A.; Kichko, T.; et al. TRPA1 channels mediate acute neurogenic inflammation and pain produced by bacterial endotoxins. Nat. Commun. 2014, 5, 3125. [Google Scholar] [CrossRef] [PubMed] [Green Version]
- Startek, J.B.; Voets, T.; Talavera, K. To flourish or perish: Evolutionary TRiPs into the sensory biology of plant-herbivore interactions. Pflugers Arch. 2019, 471, 213–236. [Google Scholar] [CrossRef]
- Spisni, E.; Petrocelli, G.; Imbesi, V.; Spigarelli, R.; Azzinnari, D.; Donati Sarti, M.; Campieri, M.; Valerii, M.C. Antioxidant, Anti-Inflammatory, and Microbial-Modulating Activities of Essential Oils: Implications in Colonic Pathophysiology. Int. J. Mol. Sci. 2020, 21, 4152. [Google Scholar] [CrossRef]
- Bandell, M.; Story, G.M.; Hwang, S.W.; Viswanath, V.; Eid, S.R.; Petrus, M.J.; Earley, T.J.; Patapoutian, A. Noxious cold ion channel TRPA1 is activated by pungent compounds and bradykinin. Neuron 2004, 41, 849–857. [Google Scholar] [CrossRef] [Green Version]
- Macpherson, L.J.; Dubin, A.E.; Evans, M.J.; Marr, F.; Schultz, P.G.; Cravatt, B.F.; Patapoutian, A. Noxious compounds activate TRPA1 ion channels through covalent modification of cysteines. Nature 2007, 445, 541–545. [Google Scholar] [CrossRef]
- Macpherson, L.J.; Geierstanger, B.H.; Viswanath, V.; Bandell, M.; Eid, S.R.; Hwang, S.; Patapoutian, A. The Pungency of Garlic: Activation of TRPA1 and TRPV1 in Response to Allicin. Curr. Biol. 2005, 15, 929–934. [Google Scholar] [CrossRef] [PubMed] [Green Version]
- Karashima, Y.; Damann, N.; Prenen, J.; Talavera, K.; Segal, A.; Voets, T.; Nilius, B. Bimodal action of menthol on the transient receptor potential channel TRPA1. J. Neurosci. 2007, 27, 9874–9884. [Google Scholar] [CrossRef] [PubMed]
- Ortar, G.; Morera, L.; Moriello, A.S.; Morera, E.; Nalli, M.; Di Marzo, V.; De Petrocellis, L. Modulation of thermo-transient receptor potential (thermo-TRP) channels by thymol-based compounds. Bioorg. Med. Chem. Lett. 2012, 22, 3535–3539. [Google Scholar] [CrossRef]
- Cho, H.J.; Callaghan, B.; Bron, R.; Bravo, D.M.; Furness, J.B. Identification of enteroendocrine cells that express TRPA1 channels in the mouse intestine. Cell Tissue Res. 2014, 356, 77–82. [Google Scholar] [CrossRef]
- Purhonen, A.K.; Louhivuori, L.M.; Kiehne, K.; Kerman, K.E.; Herzig, K.H. TRPA1 channel activation induces cholecystokinin release via extracellular calcium. FEBS Lett. 2008, 582, 229–232. [Google Scholar] [CrossRef] [PubMed] [Green Version]
- Qu, S.; Shen, Y.; Wang, M.; Wang, X.; Yang, Y. Suppression of miR-21 and miR-155 of macrophage by cinnamaldehyde ameliorates ulcerative colitis. Int. Immunopharmacol. 2019, 67, 22–34. [Google Scholar] [CrossRef]
- Momtaz, S.; Navabakhsh, M.; Bakouee, N.; Dehnamaki, M.; Rahimifard, M.; Baeeri, M.; Abdollahi, A.; Abdollahi, M.; Farzaei, M.H.; Abdolghaffari, A.H. Cinnamaldehyde targets TLR-4 and inflammatory mediators in acetic-acid induced ulcerative colitis model. Biologia 2021. [Google Scholar] [CrossRef]
- Elhennawy, M.G.; Abdelaleem, E.A.; Zaki, A.A.; Mohamed, W.R. Cinnamaldehyde and hesperetin attenuate TNBS-induced ulcerative colitis in rats through modulation of the JAk2/STAT3/SOCS3 pathway. J. Biochem. Mol. Toxicol. 2021, e22730. [Google Scholar] [CrossRef]
- Jimenez, M.J.; Berrios, R.; Stelzhammer, S.; Bracarense, A. Ingestion of organic acids and cinnamaldehyde improves tissue homeostasis of piglets exposed to enterotoxic Escherichia coli (ETEC). J. Anim. Sci. 2020, 98. [Google Scholar] [CrossRef] [PubMed]
- Bosetti, G.E.; Griebler, L.; Aniecevski, E.; Facchi, C.S.; Baggio, C.; Rossatto, G.; Leite, F.; Valentini, F.D.A.; Santo, A.D.; Pagnussatt, H.; et al. Microencapsulated carvacrol and cinnamaldehyde replace growth-promoting antibiotics: Effect on performance and meat quality in broiler chickens. An. Acad. Bras. Cienc. 2020, 92, e20200343. [Google Scholar] [CrossRef] [PubMed]
- Stumpff, F. A look at the smelly side of physiology: Transport of short chain fatty acids. Pflugers. Arch. 2018, 470, 571–598. [Google Scholar] [CrossRef]
- Bergman, E.N. Energy contributions of volatile fatty acids from the gastrointestinal tract in various species. Physiol. Rev. 1990, 70, 567–590. [Google Scholar] [CrossRef] [Green Version]
- Heo, J.M.; Opapeju, F.O.; Pluske, J.R.; Kim, J.C.; Hampson, D.J.; Nyachoti, C.M. Gastrointestinal health and function in weaned pigs: A review of feeding strategies to control post-weaning diarrhoea without using in-feed antimicrobial compounds. J. Anim. Physiol. Anim. Nutr. (Berl.) 2013, 97, 207–237. [Google Scholar] [CrossRef] [PubMed]
- Gresse, R.; Chaucheyras-Durand, F.; Fleury, M.A.; Van de Wiele, T.; Forano, E.; Blanquet-Diot, S. Gut Microbiota Dysbiosis in Postweaning Piglets: Understanding the Keys to Health. Trends Microbiol. 2017, 25, 851–873. [Google Scholar] [CrossRef]
- Macpherson, L.J.; Hwang, S.W.; Miyamoto, T.; Dubin, A.E.; Patapoutian, A.; Story, G.M. More than cool: Promiscuous relationships of menthol and other sensory compounds. Mol. Cell Neurosci. 2006, 32, 335–343. [Google Scholar] [CrossRef]
- Stange, E.F.; Schroeder, B.O. Microbiota and mucosal defense in IBD: An update. Expert Rev. Gastroenterol. Hepatol. 2019, 13, 963–976. [Google Scholar] [CrossRef] [Green Version]
- Kaji, I.; Yasuoka, Y.; Karaki, S.; Kuwahara, A. Activation of TRPA1 by luminal stimuli induces EP4-mediated anion secretion in human and rat colon. Am. J. Physiol. Gastrointest. Liver Physiol. 2012, 302, G690–G701. [Google Scholar] [CrossRef] [Green Version]
- Liebe, F.; Liebe, H.; Kaessmeyer, S.; Sponder, G.; Stumpff, F. The TRPV3 channel of the bovine rumen: Localization and functional characterization of a protein relevant for ruminal ammonia transport. Pflugers Arch. 2020, 472, 693–710. [Google Scholar] [CrossRef] [PubMed]
- Schrapers, K.T.; Sponder, G.; Liebe, F.; Liebe, H.; Stumpff, F. The bovine TRPV3 as a pathway for the uptake of Na+, Ca2+, and NH4+. PLoS ONE 2018, 13, e0193519. [Google Scholar] [CrossRef] [PubMed] [Green Version]
- Peier, A.M.; Reeve, A.J.; Andersson, D.A.; Moqrich, A.; Earley, T.J.; Hergarden, A.C.; Story, G.M.; Colley, S.; Hogenesch, J.B.; McIntyre, P.; et al. A Heat—Sensitive TRP channel expressed in keratinocytes. Science 2002, 296, 2046–2049. [Google Scholar] [CrossRef] [PubMed]
- Xu, H.; Ramsey, I.S.; Kotecha, S.A.; Moran, M.M.; Chong, J.A.; Lawson, D.; Ge, P.; Lilly, J.; Silos-Santiago, I.; Xie, Y.; et al. TRPV3 is a calcium-permeable temperature-sensitive cation channel. Nature 2002, 418, 181–186. [Google Scholar] [CrossRef] [PubMed]
- Smith, G.D.; Gunthorpe, M.J.; Kelsell, R.E.; Hayes, P.D.; Reilly, P.; Facer, P.; Wright, J.E.; Jerman, J.C.; Walhin, J.P.; Ooi, L.; et al. TRPV3 is a temperature-sensitive vanilloid receptor-like protein. Nature 2002, 418, 186–190. [Google Scholar] [CrossRef] [PubMed]
- Boudry, G.; Perrier, C. Thyme and cinnamon extracts induce anion secretion in piglet small intestine via cholinergic pathways. J. Physiol. Pharmacol. 2008, 59, 543–552. [Google Scholar]
- Van Liefferinge, E.; Van Noten, N.; Degroote, J.; Vrolix, G.; Van Poucke, M.; Peelman, L.; Van Ginneken, C.; Roura, E.; Michiels, J. Expression of Transient Receptor Potential Ankyrin 1 and Transient Receptor Potential Vanilloid 1 in the Gut of the Peri-Weaning Pig Is Strongly Dependent on Age and Intestinal Site. Animals 2020, 10, 2417. [Google Scholar] [CrossRef]
- Gonzalez-Mariscal, L.; Contreras, R.G.; Bolivar, J.J.; Ponce, A.; Chavez De Ramirez, B.; Cereijido, M. Role of calcium in tight junction formation between epithelial cells. Am. J. Physiol. 1990, 259, C978–C986. [Google Scholar] [CrossRef]
- Meoli, L.; Gunzel, D. Channel functions of claudins in the organization of biological systems. Biochim. Biophys. Acta Biomembr. 2020, 1862, 183344. [Google Scholar] [CrossRef]
- Barrett, K.E.; Keely, S.J. Chloride secretion by the intestinal epithelium: Molecular basis and regulatory aspects. Annu. Rev. Physiol. 2000, 62, 535–572. [Google Scholar] [CrossRef]
- Ueda, T.; Yamada, T.; Ugawa, S.; Ishida, Y.; Shimada, S. TRPV3, A thermosensitive channel is expressed in mouse distal colon epithelium. Biochem. Biophys. Res. Commun. 2009, 383, 130–134. [Google Scholar] [CrossRef] [PubMed]
- Bischof, M.; Olthoff, S.; Glas, C.; Thorn-Seshold, O.; Schaefer, M.; Hill, K. TRPV3 endogenously expressed in murine colonic epithelial cells is inhibited by the novel TRPV3 blocker 26E01. Cell Calcium 2020, 92, 102310. [Google Scholar] [CrossRef] [PubMed]
- Barry, P.H.; Lynch, J.W. Liquid junction potentials and small cell effects in patch-clamp analysis. J. Membr. Biol. 1991, 121, 101–117. [Google Scholar] [CrossRef] [PubMed]
- May, O.; Yu, H.; Riederer, B.; Manns, M.P.; Seidler, U.; Bachmann, O. Short-term regulation of murine colonic NBCe1-B (electrogenic Na+/HCO3(-) cotransporter) membrane expression and activity by protein kinase C. PLoS ONE 2014, 9, e92275. [Google Scholar] [CrossRef] [Green Version]
- Bachmann, O.; Juric, M.; Seidler, U.; Manns, M.P.; Yu, H. Basolateral ion transporters involved in colonic epithelial electrolyte absorption, anion secretion and cellular homeostasis. Acta Physiol. 2011, 201, 33–46. [Google Scholar] [CrossRef]
- Ballout, J.; Diener, M. The role of HCO3(-) in propionate-induced anion secretion across rat caecal epithelium. Pflugers Arch. 2021. [Google Scholar] [CrossRef] [PubMed]
- Tang, L.; Fatehi, M.; Linsdell, P. Mechanism of direct bicarbonate transport by the CFTR anion channel. J. Cyst. Fibros. 2009, 8, 115–121. [Google Scholar] [CrossRef] [Green Version]
- Seidler, U.; Blumenstein, I.; Kretz, A.; Viellard-Baron, D.; Rossmann, H.; Colledge, W.H.; Evans, M.; Ratcliff, R.; Gregor, M. A functional CFTR protein is required for mouse intestinal cAMP-, cGMP- and Ca(2+)-dependent HCO3- secretion. J. Physiol. 1997, 505(Pt. 2), 411–423. [Google Scholar] [CrossRef]
- Johnstone, T.B.; Agarwal, S.R.; Harvey, R.D.; Ostrom, R.S. cAMP Signaling Compartmentation: Adenylyl Cyclases as Anchors of Dynamic Signaling Complexes. Mol. Pharmacol. 2018, 93, 270–276. [Google Scholar] [CrossRef] [Green Version]
- Nakanishi, T.; Tamai, I. Roles of Organic Anion Transporting Polypeptide 2A1 (OATP2A1/SLCO2A1) in Regulating the Pathophysiological Actions of Prostaglandins. AAPS J. 2017, 20, 13. [Google Scholar] [CrossRef]
- Nakanishi, T.; Nakamura, Y.; Umeno, J. Recent advances in studies of SLCO2A1 as a key regulator of the delivery of prostaglandins to their sites of action. Pharmacol. Ther. 2021, 223, 107803. [Google Scholar] [CrossRef] [PubMed]
- Chan, B.S.; Satriano, J.A.; Pucci, M.; Schuster, V.L. Mechanism of prostaglandin E2 transport across the plasma membrane of HeLa cells and Xenopus oocytes expressing the prostaglandin transporter “PGT”. J. Biol. Chem. 1998, 273, 6689–6697. [Google Scholar] [CrossRef] [PubMed] [Green Version]
- Konya, V.; Marsche, G.; Schuligoi, R.; Heinemann, A. E-type prostanoid receptor 4 (EP4) in disease and therapy. Pharmacol. Ther. 2013, 138, 485–502. [Google Scholar] [CrossRef] [Green Version]
- Takafuji, V.; Cosme, R.; Lublin, D.; Lynch, K.; Roche, J.K. Prostanoid receptors in intestinal epithelium: Selective expression, function, and change with inflammation. Prostaglandins Leukot. Essent. Fatty Acids 2000, 63, 223–235. [Google Scholar] [CrossRef] [PubMed]
- Lejeune, M.; Moreau, F.; Chadee, K. Loss of EP2 receptor subtype in colonic cells compromise epithelial barrier integrity by altering claudin-4. PLoS ONE 2014, 9, e113270. [Google Scholar] [CrossRef] [Green Version]
- Matsumoto, Y.; Nakanishi, Y.; Yoshioka, T.; Yamaga, Y.; Masuda, T.; Fukunaga, Y.; Sono, M.; Yoshikawa, T.; Nagao, M.; Araki, O.; et al. Epithelial EP4 plays an essential role in maintaining homeostasis in colon. Sci. Rep. 2019, 9, 15244. [Google Scholar] [CrossRef] [Green Version]
- Blikslager, A.T.; Pell, S.M.; Young, K.M. PGE2 triggers recovery of transmucosal resistance via EP receptor cross talk in porcine ischemia-injured ileum. Am. J. Physiol. Gastrointest. Liver Physiol. 2001, 281, G375–G381. [Google Scholar] [CrossRef] [Green Version]
- Bjarnason, I.; Scarpignato, C.; Holmgren, E.; Olszewski, M.; Rainsford, K.D.; Lanas, A. Mechanisms of Damage to the Gastrointestinal Tract from Nonsteroidal Anti-Inflammatory Drugs. Gastroenterology 2018, 154, 500–514. [Google Scholar] [CrossRef] [Green Version]
- Ilhan, Z.E.; Marcus, A.K.; Kang, D.W.; Rittmann, B.E.; Krajmalnik-Brown, R. pH-Mediated Microbial and Metabolic Interactions in Fecal Enrichment Cultures. mSphere 2017, 2. [Google Scholar] [CrossRef] [PubMed] [Green Version]
- Louis, P.; Scott, K.P.; Duncan, S.H.; Flint, H.J. Understanding the effects of diet on bacterial metabolism in the large intestine. J. Appl. Microbiol. 2007, 102, 1197–1208. [Google Scholar] [CrossRef] [PubMed]
- Garcia, M.A.; Yang, N.; Quinton, P.M. Normal mouse intestinal mucus release requires cystic fibrosis transmembrane regulator-dependent bicarbonate secretion. J. Clin. Investig. 2009, 119, 2613–2622. [Google Scholar] [CrossRef] [Green Version]
- Nilius, B.; Appendino, G. Tasty and healthy TR(i)Ps. The human quest for culinary pungency. EMBO Rep. 2011, 12, 1094–1101. [Google Scholar] [CrossRef] [PubMed]
- Braun, H.-S.; Sponder, G.; Pieper, R.; Aschenbach, J.R.; Deiner, C. GABA selectively increases mucin-1 expression in isolated pig jejunum. Genes Nutr. 2015, 10, 47. [Google Scholar] [CrossRef] [PubMed]
- Rosendahl, J.; Braun, H.S.; Schrapers, K.T.; Martens, H.; Stumpff, F. Evidence for the functional involvement of members of the TRP channel family in the uptake of Na(+) and NH4 (+) by the ruminal epithelium. Pflugers. Arch. 2016, 468, 1333–1352. [Google Scholar] [CrossRef]
- Abdoun, K.; Stumpff, F.; Wolf, K.; Martens, H. Modulation of electroneutral Na transport in sheep rumen epithelium by luminal ammonia. Am. J. Physiol. Gastrointest. Liver Physiol. 2005, 289, G508–G520. [Google Scholar] [CrossRef] [PubMed]


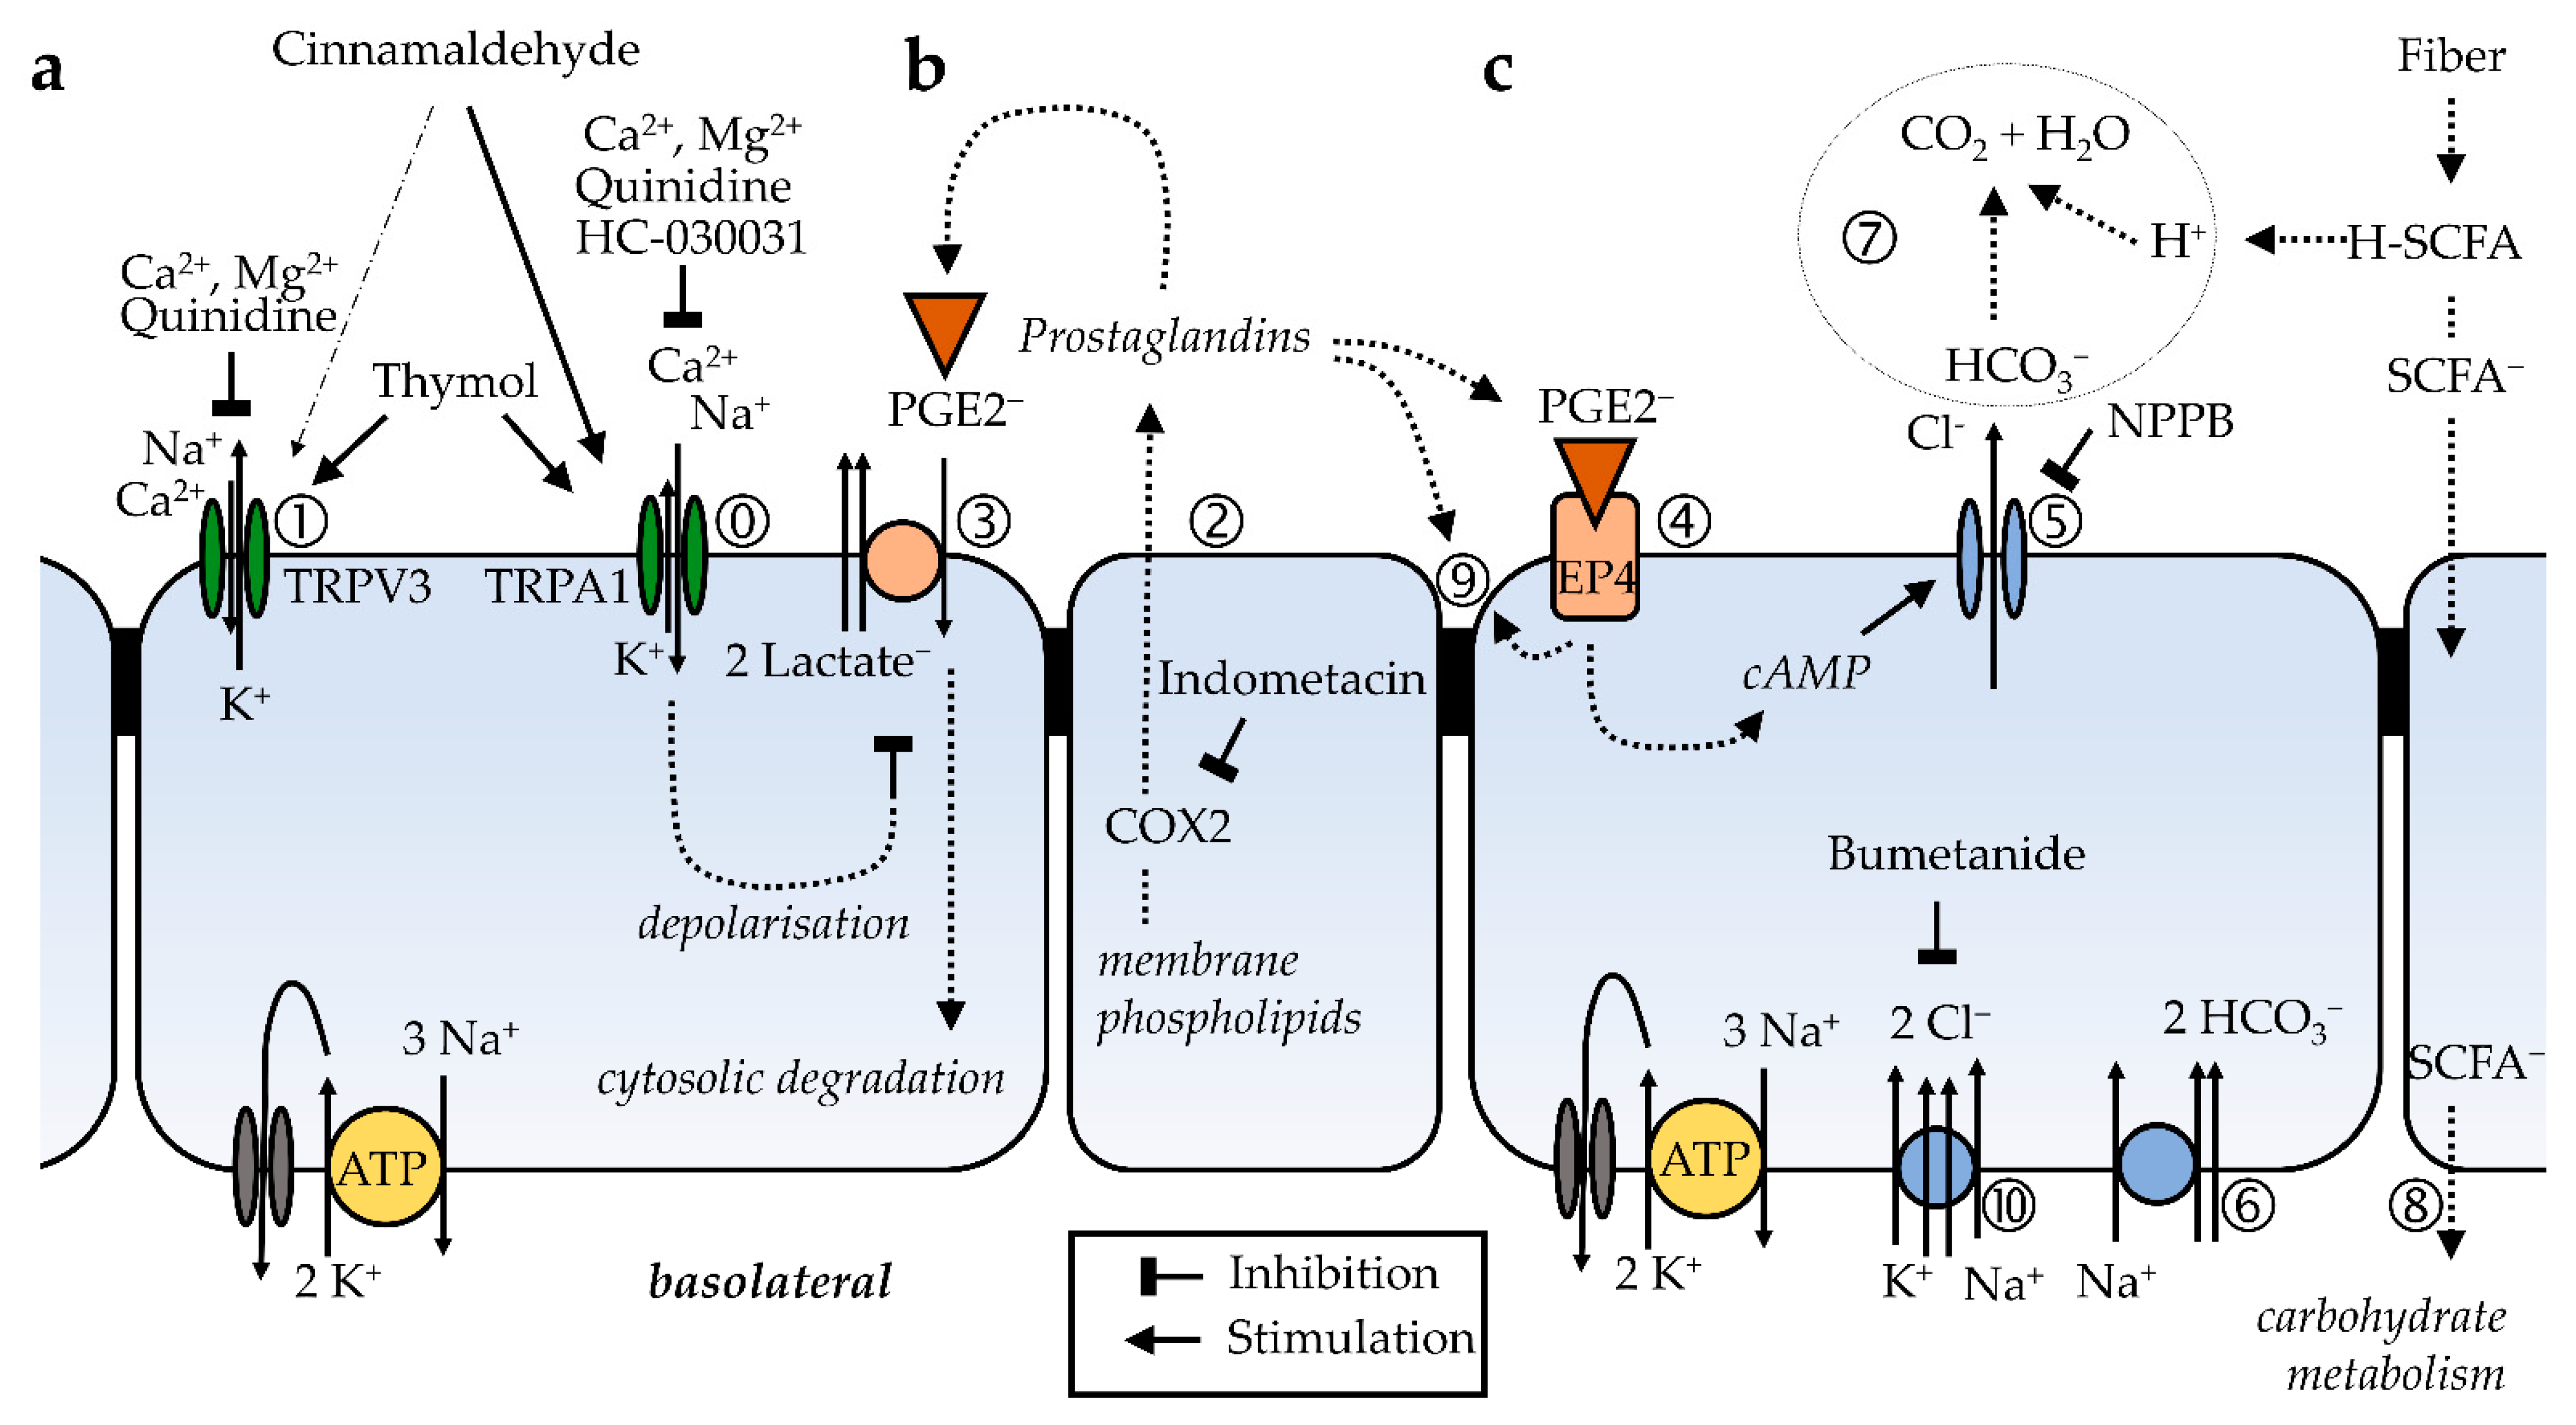
 ). The selectivity filter of the channel allows both the influx of Na+ and Ca2+, and a smaller efflux of K+, so that the effects on Isc are small. However, the cell is depolarised and a significant increase in conductance ΔGt is observed, which is reduced by quinidine and enhanced by the removal of divalent cations. The effects of cinnamaldehyde on TRPV3 (➀), which favors efflux of K+ over influx of Na+ and Ca2+, are discrete. Thymol opens both channels. (b) Prostanoids such as PGE2 are anions that are synthesized from membrane phospholipids via cyclooxygenase-mediated pathways and secreted into the extracellular space via pathways that are being explored (➁). For prostanoid signalling to end, the anionic prostaglandin has to be taken up into the cytosol via an electrogenic anion exchanger, OATP2A1 (SLCOA1) (➂), after which the prostaglandin is degraded by cytosolic enzymes. Due to the electrogenic nature of the cotransporter, the depolarization of the cellular membrane, as occurs after the opening of TRPA1 channels via cinnamaldehyde ( ), decreases the uptake of prostaglandins and thus increases the extracellular prostaglandin concentration. (c) After the binding of the PGE2 to EP4 receptors (➃) expressed by the colonic mucosa, adenylyl cyclase is stimulated, resulting in rising levels of cAMP that open apical CFTR channels (➄). Other anion channels may contribute to the secretion of HCO3−, which is driven by the uptake of Na+ via basolateral NBCn1 (Slc4a7), NBCe1 (SLC4A4), or NBCe2 (Slc4a5) at a ratio of 1, 2 or 3 HCO3− for each Na+ (➅). Most of the NPPB-sensitive rise in Isc that is observed after the activation of TRPA1 via cinnamaldehyde can be explained by this mechanism. The secretion of HCO3− is important for the buffering of protons formed in the fermentational process (➆), and for the unfolding of mucines in the mucus layer, thus protecting the epithelium. Energy-rich short chain fatty acid anions (SCFA−) are absorbed via various transport proteins (➇) without challenging cytosolic pH homeostasis. In physiological concentrations, prostaglandins are also thought to have barrier-enhancing properties through interaction with tight junction proteins (➈). Possibly, the secretion of HCO3− is highest in cells near the surface, while in the crypts, the expression of NKCC1 (SLC12A2) (➉) predominates. The latter pathway leads to the secretion of Cl− via CFTR, which can result in diarrhea when cAMP levels are pathologically high. Because the gradients favor a unilateral efflux of anions, the opening of CFTR will have higher effects on ΔIsc than those after the opening of TRPA1.
). The selectivity filter of the channel allows both the influx of Na+ and Ca2+, and a smaller efflux of K+, so that the effects on Isc are small. However, the cell is depolarised and a significant increase in conductance ΔGt is observed, which is reduced by quinidine and enhanced by the removal of divalent cations. The effects of cinnamaldehyde on TRPV3 (➀), which favors efflux of K+ over influx of Na+ and Ca2+, are discrete. Thymol opens both channels. (b) Prostanoids such as PGE2 are anions that are synthesized from membrane phospholipids via cyclooxygenase-mediated pathways and secreted into the extracellular space via pathways that are being explored (➁). For prostanoid signalling to end, the anionic prostaglandin has to be taken up into the cytosol via an electrogenic anion exchanger, OATP2A1 (SLCOA1) (➂), after which the prostaglandin is degraded by cytosolic enzymes. Due to the electrogenic nature of the cotransporter, the depolarization of the cellular membrane, as occurs after the opening of TRPA1 channels via cinnamaldehyde ( ), decreases the uptake of prostaglandins and thus increases the extracellular prostaglandin concentration. (c) After the binding of the PGE2 to EP4 receptors (➃) expressed by the colonic mucosa, adenylyl cyclase is stimulated, resulting in rising levels of cAMP that open apical CFTR channels (➄). Other anion channels may contribute to the secretion of HCO3−, which is driven by the uptake of Na+ via basolateral NBCn1 (Slc4a7), NBCe1 (SLC4A4), or NBCe2 (Slc4a5) at a ratio of 1, 2 or 3 HCO3− for each Na+ (➅). Most of the NPPB-sensitive rise in Isc that is observed after the activation of TRPA1 via cinnamaldehyde can be explained by this mechanism. The secretion of HCO3− is important for the buffering of protons formed in the fermentational process (➆), and for the unfolding of mucines in the mucus layer, thus protecting the epithelium. Energy-rich short chain fatty acid anions (SCFA−) are absorbed via various transport proteins (➇) without challenging cytosolic pH homeostasis. In physiological concentrations, prostaglandins are also thought to have barrier-enhancing properties through interaction with tight junction proteins (➈). Possibly, the secretion of HCO3− is highest in cells near the surface, while in the crypts, the expression of NKCC1 (SLC12A2) (➉) predominates. The latter pathway leads to the secretion of Cl− via CFTR, which can result in diarrhea when cAMP levels are pathologically high. Because the gradients favor a unilateral efflux of anions, the opening of CFTR will have higher effects on ΔIsc than those after the opening of TRPA1.
). The selectivity filter of the channel allows both the influx of Na+ and Ca2+, and a smaller efflux of K+, so that the effects on Isc are small. However, the cell is depolarised and a significant increase in conductance ΔGt is observed, which is reduced by quinidine and enhanced by the removal of divalent cations. The effects of cinnamaldehyde on TRPV3 (➀), which favors efflux of K+ over influx of Na+ and Ca2+, are discrete. Thymol opens both channels. (b) Prostanoids such as PGE2 are anions that are synthesized from membrane phospholipids via cyclooxygenase-mediated pathways and secreted into the extracellular space via pathways that are being explored (➁). For prostanoid signalling to end, the anionic prostaglandin has to be taken up into the cytosol via an electrogenic anion exchanger, OATP2A1 (SLCOA1) (➂), after which the prostaglandin is degraded by cytosolic enzymes. Due to the electrogenic nature of the cotransporter, the depolarization of the cellular membrane, as occurs after the opening of TRPA1 channels via cinnamaldehyde ( ), decreases the uptake of prostaglandins and thus increases the extracellular prostaglandin concentration. (c) After the binding of the PGE2 to EP4 receptors (➃) expressed by the colonic mucosa, adenylyl cyclase is stimulated, resulting in rising levels of cAMP that open apical CFTR channels (➄). Other anion channels may contribute to the secretion of HCO3−, which is driven by the uptake of Na+ via basolateral NBCn1 (Slc4a7), NBCe1 (SLC4A4), or NBCe2 (Slc4a5) at a ratio of 1, 2 or 3 HCO3− for each Na+ (➅). Most of the NPPB-sensitive rise in Isc that is observed after the activation of TRPA1 via cinnamaldehyde can be explained by this mechanism. The secretion of HCO3− is important for the buffering of protons formed in the fermentational process (➆), and for the unfolding of mucines in the mucus layer, thus protecting the epithelium. Energy-rich short chain fatty acid anions (SCFA−) are absorbed via various transport proteins (➇) without challenging cytosolic pH homeostasis. In physiological concentrations, prostaglandins are also thought to have barrier-enhancing properties through interaction with tight junction proteins (➈). Possibly, the secretion of HCO3− is highest in cells near the surface, while in the crypts, the expression of NKCC1 (SLC12A2) (➉) predominates. The latter pathway leads to the secretion of Cl− via CFTR, which can result in diarrhea when cAMP levels are pathologically high. Because the gradients favor a unilateral efflux of anions, the opening of CFTR will have higher effects on ΔIsc than those after the opening of TRPA1.

| Treatment | N/n 1 | Isc Baseline | Isc Treatment | p-Value | Gt Baseline | Gt Treatment | p-Value |
|---|---|---|---|---|---|---|---|
| Control (all) | 12/70 | 0.38 ± 0.056 | 0.37 ± 0.056 | 0.094 | 20.5 ± 0.62 | 20.3 ± 0.61 | <0.001 |
| Quinidine | 4/21 | 0.39 ± 0.088 | 0.23 ± 0.085 | <0.001 | 22.5 ± 1.02 | 19.9 ± 0.83 | <0.001 |
| Lidocaine | 3/12 | 0.41 ± 0.070 | 0.27 ± 0.069 | <0.001 | 23.6 ± 1.37 | 22.8 ± 1.10 | 0.151 |
| Amiloride | 3/15 | 0.55 ± 0.16 | 0.29 ± 0.15 | <0.001 | 23.0 ± 1.65 | 21.3 ± 1.69 | <0.001 |
| Na+ free bilat 2 | 3/17 | 0.42 ± 0.066 | −0.40 ± 0.052 | <0.001 | 18.2 ± 1.58 | 8.9 ± 0.53 | <0.001 |
| Na+ free muc 3 | 5/28 | 0.34 ± 0.044 | −0.69 ± 0.062 | <0.001 | 17.6 ± 0.95 | 12.2 ± 0.39 | <0.001 |
| EGTA muc 2 | 4/17 | 0.77 ± 0.16 | 0.95 ± 0.21 | 0.01 | 23.8 ± 1.38 | 28.5 ± 1.86 | <0.001 |
| Ca2+ free bilat 3 | 5/14 | 0.98 ± 0.068 | 0.99 ± 0.065 | 0.819 | 19.3 ± 0.96 | 20.3 ± 0.86 | 0.011 |
| Bumetanide | 3/15 | 0.30 ± 0.11 | 0.19 ± 0.10 | <0.001 | 20.1 ± 0.94 | 20.2 ± 0.90 | 0.528 |
| NPPB | 5/21 | 0.46 ± 0.10 | 0.26 ± 0.083 | <0.001 | 21.9 ± 1.45 | 22.8 ± 1.53 | 0.008 |
| Indometacin | 3/9 | 0.24 ± 0.049 | 0.16 ± 0.036 | 0.04 | 22.6 ± 1.29 | 22.9 ± 1.39 | 0.212 |
| Cl− low 4 | 5/30 | 0.29 ± 0.089 | 0.52 ± 0.071 | 0.050 | 21.5 ± 1.08 | 12.7 ± 0.99 | <0.001 |
| HCO3− free 4 | 5/24 | 0.29 ± 0.089 | 0.59 ± 0.073 | 0.014 | 21.5 ± 1.08 | 14.1 ± 0.61 | <0.001 |
| HC-030031 | 3/7 | 0.33 ± 0.038 | 0.27 ± 0.028 | 0.028 | 17.7 ± 1.02 | 17.9 ± 1.15 | 0.813 |
| Treatment | N/n 1 | Isc Treatment | Isc Cinn. | p-Value | Gt Treatment | Gt Cinn. | p-Value |
|---|---|---|---|---|---|---|---|
| Control (all) | 12/70 | 0.38 ± 0.056 | 1.01 ± 0.10 | <0.001 | 20.3 ± 0.61 | 24.4 ± 0.79 | <0.001 |
| Quinidine | 4/21 | 0.23 ± 0.085 | 1.19 ± 0.21 | <0.001 | 19.9 ± 0.83 | 21.7 ± 0.92 | <0.001 |
| Lidocaine | 3/12 | 0.27 ± 0.069 | 1.05 ± 0.22 | <0.001 | 22.8 ± 1.10 | 29.2 ± 1.44 | <0.001 |
| Amiloride | 3/15 | 0.29 ± 0.15 | 1.29 ± 0.28 | <0.001 | 21.3 ± 1.69 | 25.0 ± 1.96 | <0.001 |
| Na+ free bilat 2 | 3/17 | −0.40 ± 0.052 | −0.26 ± 0.060 | 0.002 | 8.90 ± 0.53 | 10.1 ± 0.58 | <0.001 |
| Na+ free muc 3 | 5/28 | −0.69 ± 0.062 | −0.19 ± 0.083 | <0.001 | 12.2 ± 0.39 | 13.3 ± 0.43 | <0.001 |
| EGTA muc 2 | 4/17 | 0.95 ± 0.21 | 2.13 ± 0.26 | <0.001 | 28.5 ± 1.86 | 40.8 ± 3.36 | <0.001 |
| Ca2+ free bilat 3 | 5/14 | 0.99 ± 0.065 | 1.78 ± 0.084 | <0.001 | 20.3 ± 0.86 | 26.7 ± 1.56 | <0.001 |
| Bumetanide | 3/15 | 0.19 ± 0.10 | 1.16 ± 0.27 | <0.001 | 20.2 ± 0.90 | 25.2 ± 1.29 | <0.001 |
| NPPB | 5/21 | 0.26 ± 0.083 | 0.71 ± 0.12 | <0.001 | 22.8 ± 1.53 | 28.6 ± 2.19 | <0.001 |
| Indometacin | 3/9 | 0.16 ± 0.036 | 0.54 ± 0.099 | 0.004 | 22.9 ± 1.39 | 30.6 ± 2.05 | <0.001 |
| Cl− low 3 | 5/30 | 0.52 ± 0.071 | 0.78 ± 0.10 | <0.001 | 12.7 ± 0.99 | 16.1 ± 1.28 | <0.001 |
| HCO3− free 3 | 5/24 | 0.59 ± 0.073 | 0.70 ± 0.11 | 0.054 | 14.1 ± 0.61 | 17.1 ± 0.61 | <0.001 |
| HC-030031 | 3/7 | 0.27 ± 0.028 | 0.91 ± 0.16 | 0.004 | 17.9 ± 1.15 | 22.3 ± 2.15 | 0.007 |
| Gene | Length (bp) | Primer | Gene Acession No. |
|---|---|---|---|
| TRPA1 fwd | 192 | ACAGGAAAGTCAGCCCTCTC | XM_001926115.4 |
| TRPA1 rev | TATCCTGGCTGCCCGAATAG | ||
| TRPA1 probe | TTTGCGGCCACCCAGGGAGC | ||
| ACTB fwd | 127 | GACATCAAGGAGAAGCTGTG | XM_003124280.5 |
| ACTB rev | CGTTGCCGATGGTGATG | ||
| ACTB probe | CTGGACTTCGAGCAGGAGATGGCC | ||
| YWHAZ fwd | 113 | AAGAGTCATACAAAGACAGCAC | XM_021088756.1 |
| YWHAZ rev | ATTTTCCCCTCCTTCTCCTG | ||
| YWHAZ probe | ATCGGATACCCAAGGAGATGAAGCTGAA | ||
| GAPDH fwd | 117 | CAAGAAGGTGGTGAAGCAG | NM_001206359.1 |
| GAPDH rev | GCATCAAAAGTGGAAGAGTGAG | ||
| GAPDH probe | TGAGGACCAGGTTGTGTCCTGTGACTTCAA |
Publisher’s Note: MDPI stays neutral with regard to jurisdictional claims in published maps and institutional affiliations. |
© 2021 by the authors. Licensee MDPI, Basel, Switzerland. This article is an open access article distributed under the terms and conditions of the Creative Commons Attribution (CC BY) license (https://creativecommons.org/licenses/by/4.0/).
Share and Cite
Manneck, D.; Manz, G.; Braun, H.-S.; Rosendahl, J.; Stumpff, F. The TRPA1 Agonist Cinnamaldehyde Induces the Secretion of HCO3− by the Porcine Colon. Int. J. Mol. Sci. 2021, 22, 5198. https://0-doi-org.brum.beds.ac.uk/10.3390/ijms22105198
Manneck D, Manz G, Braun H-S, Rosendahl J, Stumpff F. The TRPA1 Agonist Cinnamaldehyde Induces the Secretion of HCO3− by the Porcine Colon. International Journal of Molecular Sciences. 2021; 22(10):5198. https://0-doi-org.brum.beds.ac.uk/10.3390/ijms22105198
Chicago/Turabian StyleManneck, David, Gisela Manz, Hannah-Sophie Braun, Julia Rosendahl, and Friederike Stumpff. 2021. "The TRPA1 Agonist Cinnamaldehyde Induces the Secretion of HCO3− by the Porcine Colon" International Journal of Molecular Sciences 22, no. 10: 5198. https://0-doi-org.brum.beds.ac.uk/10.3390/ijms22105198