
Dietary Nanoparticles Interact with Gluten Peptides and Alter the Intestinal Homeostasis Increasing the Risk of Celiac Disease

 , , , , , and
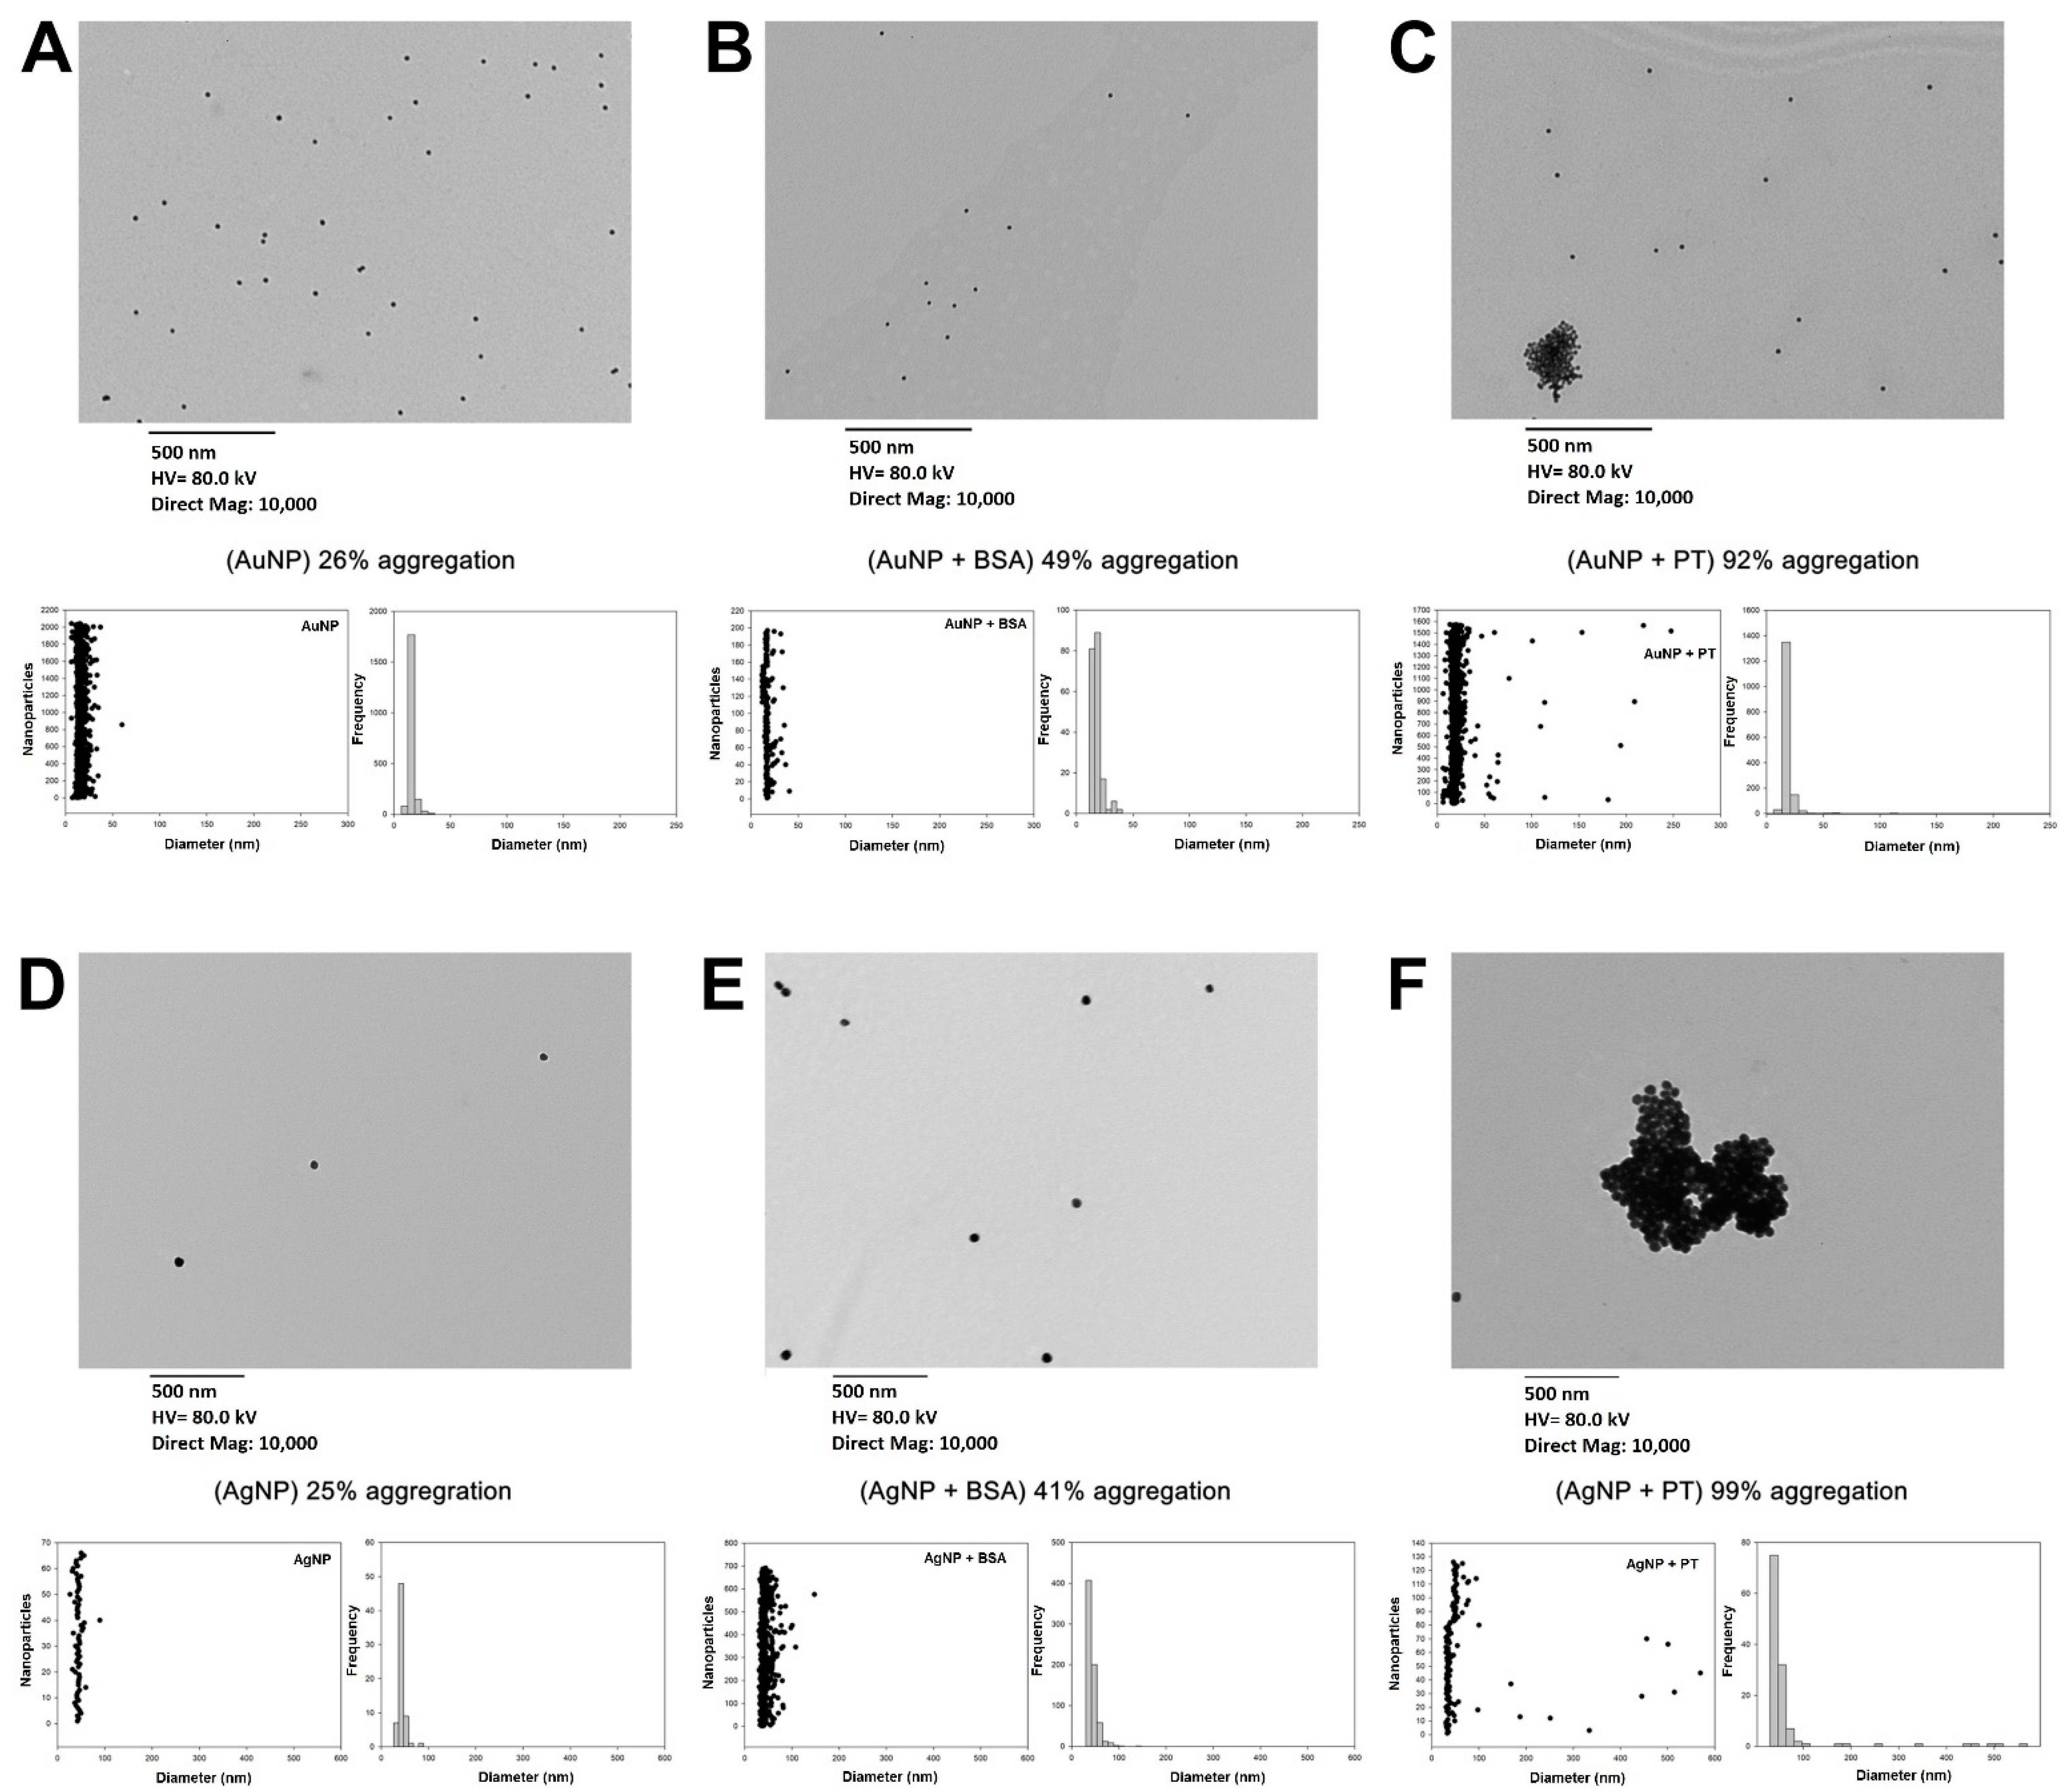
Abstract
:1. Introduction
2. Results
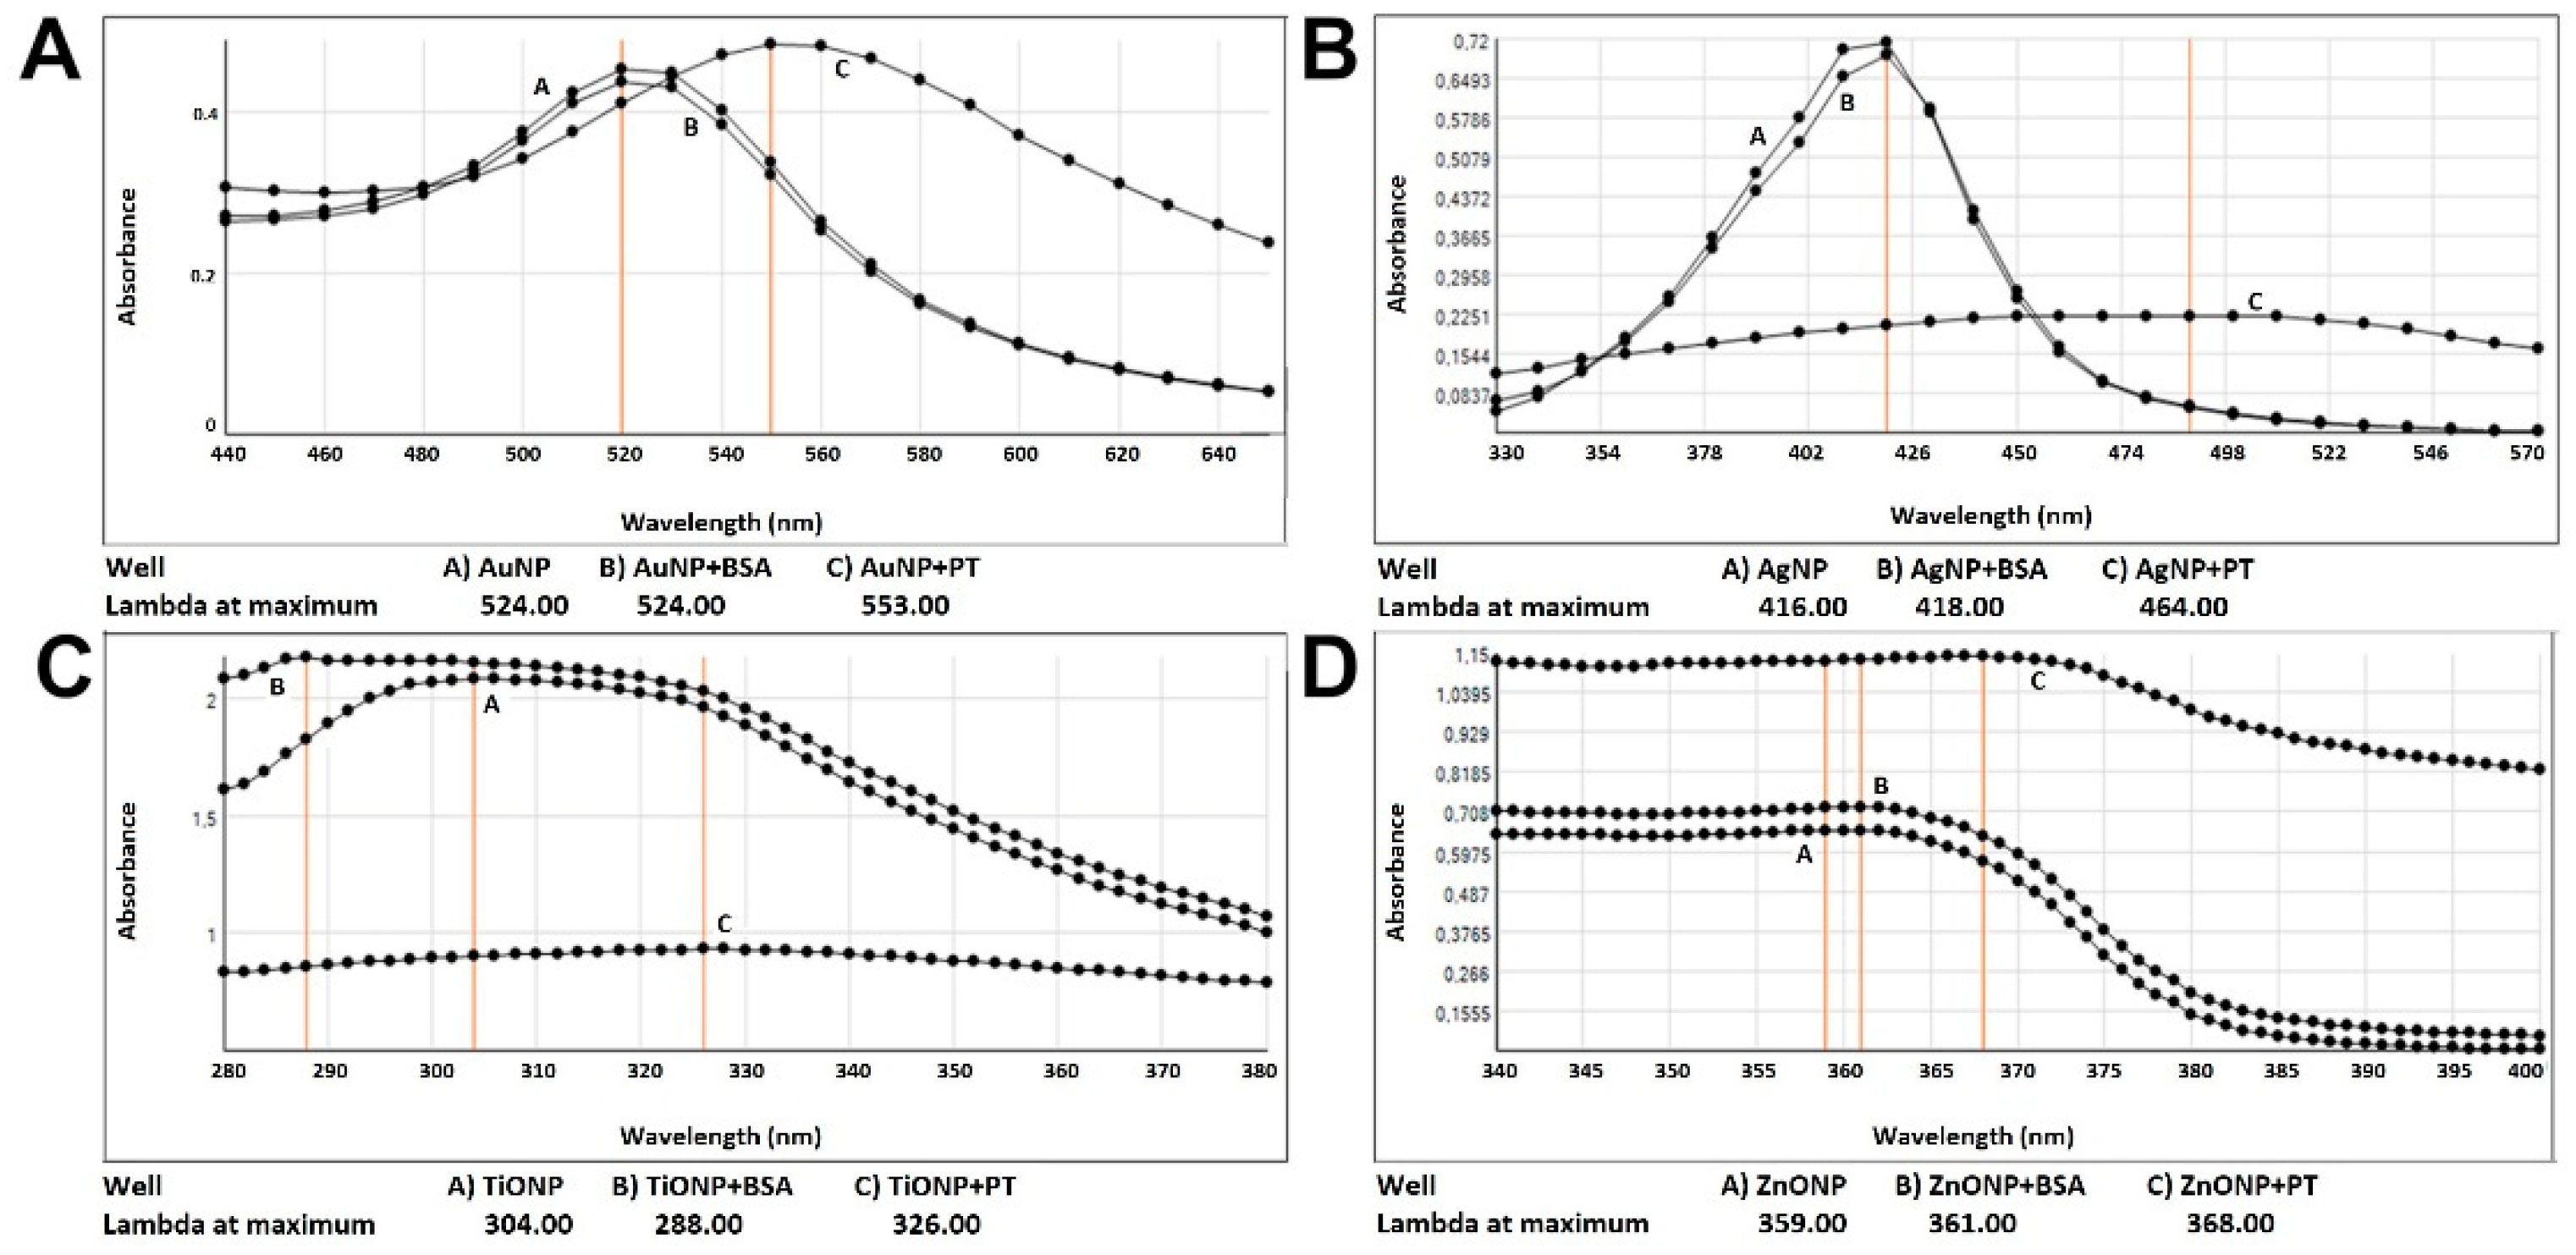
2.1. Food Nanoparticles Interact with Digested PT-Gliadin
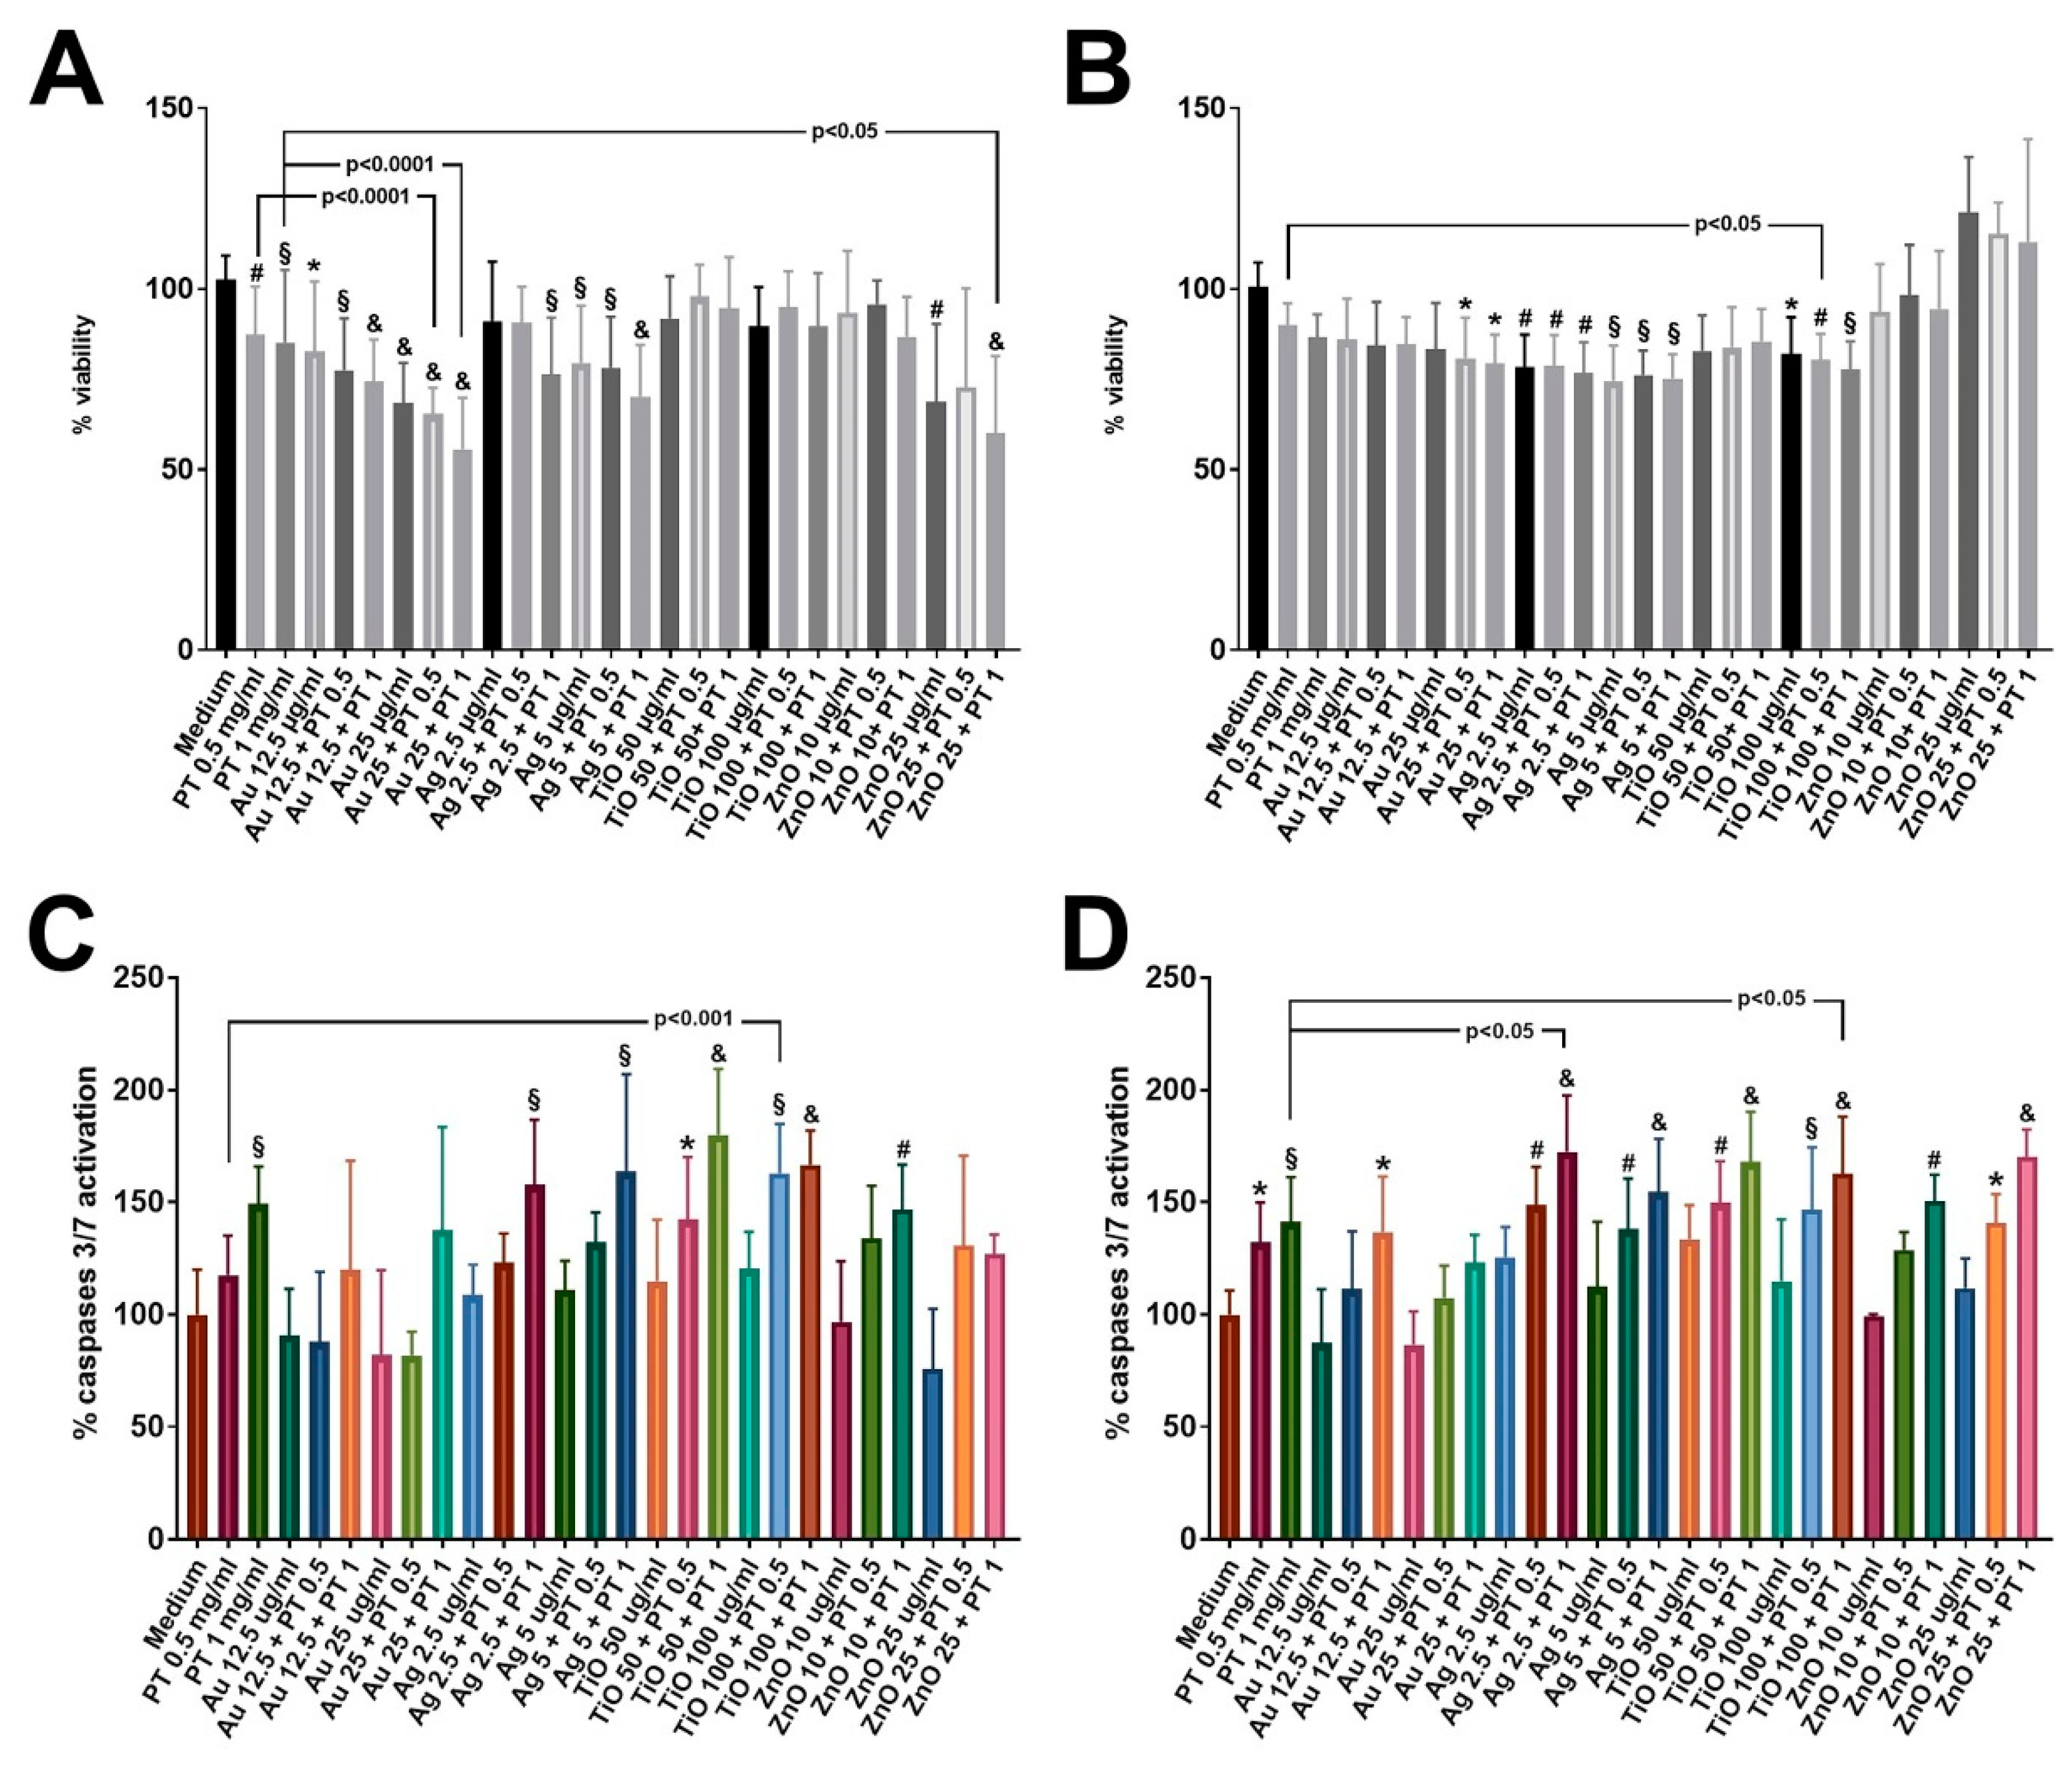
2.2. mNPs +/− PT Affect Cellular Viability
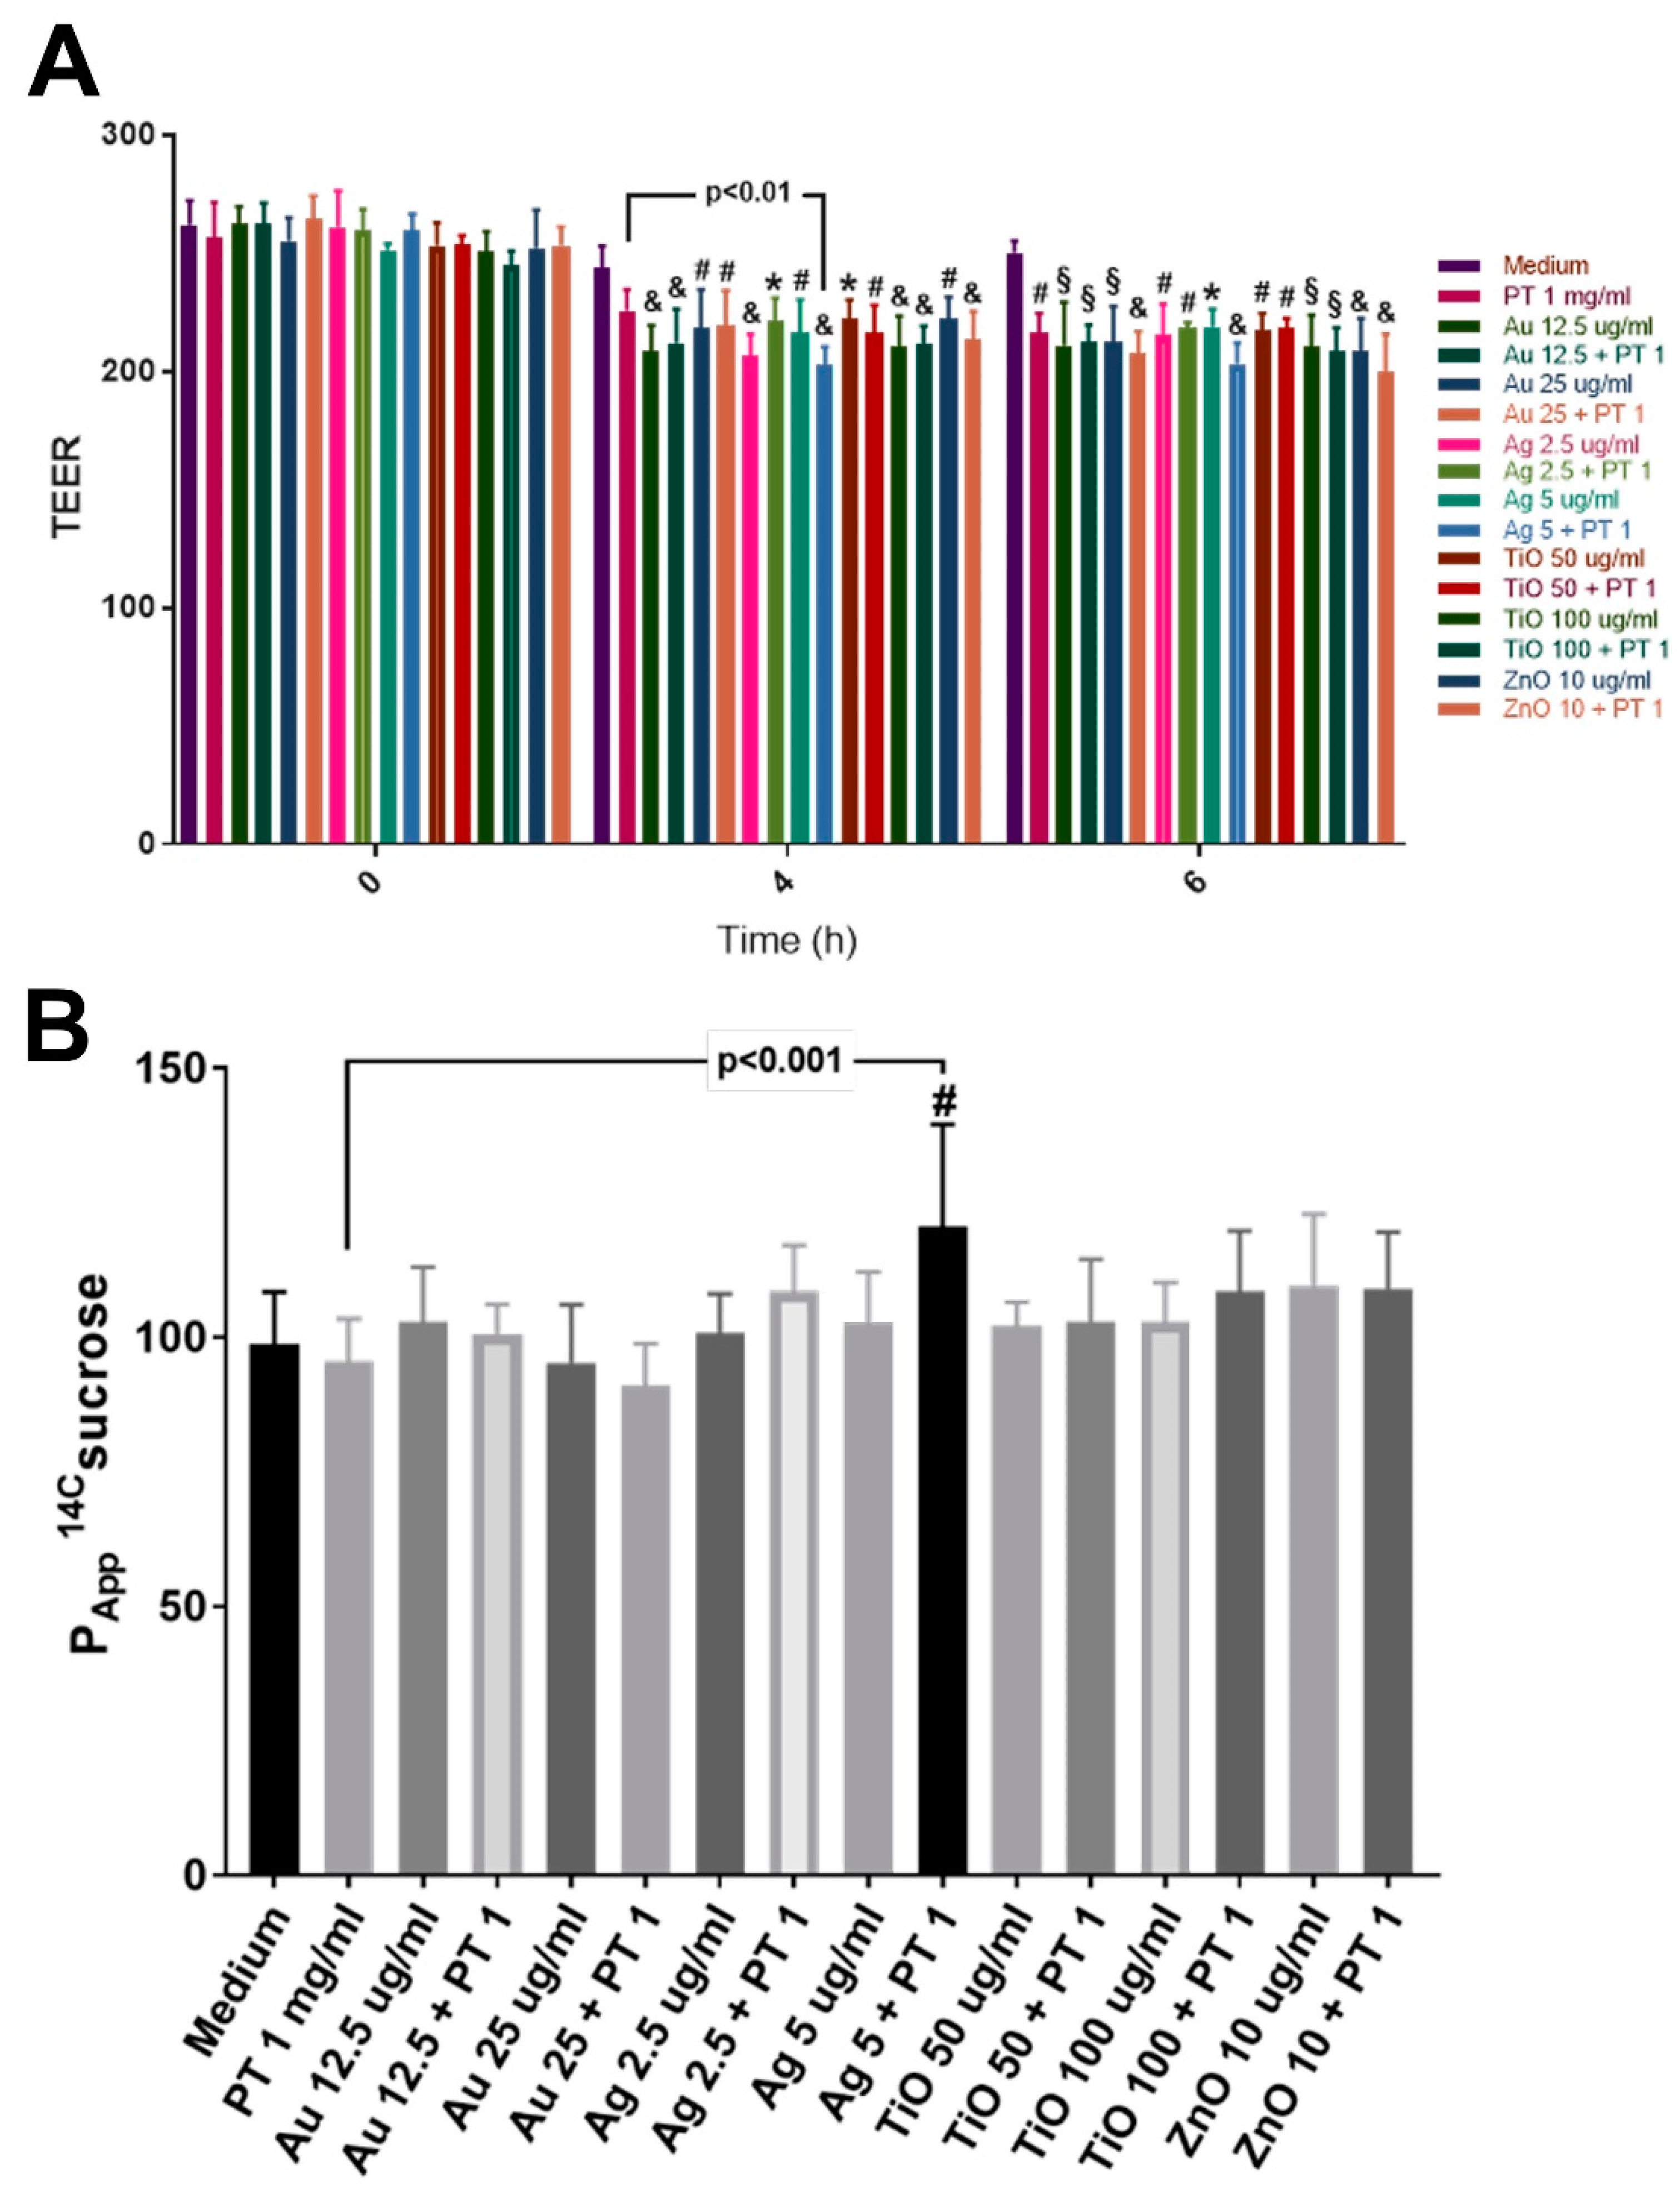
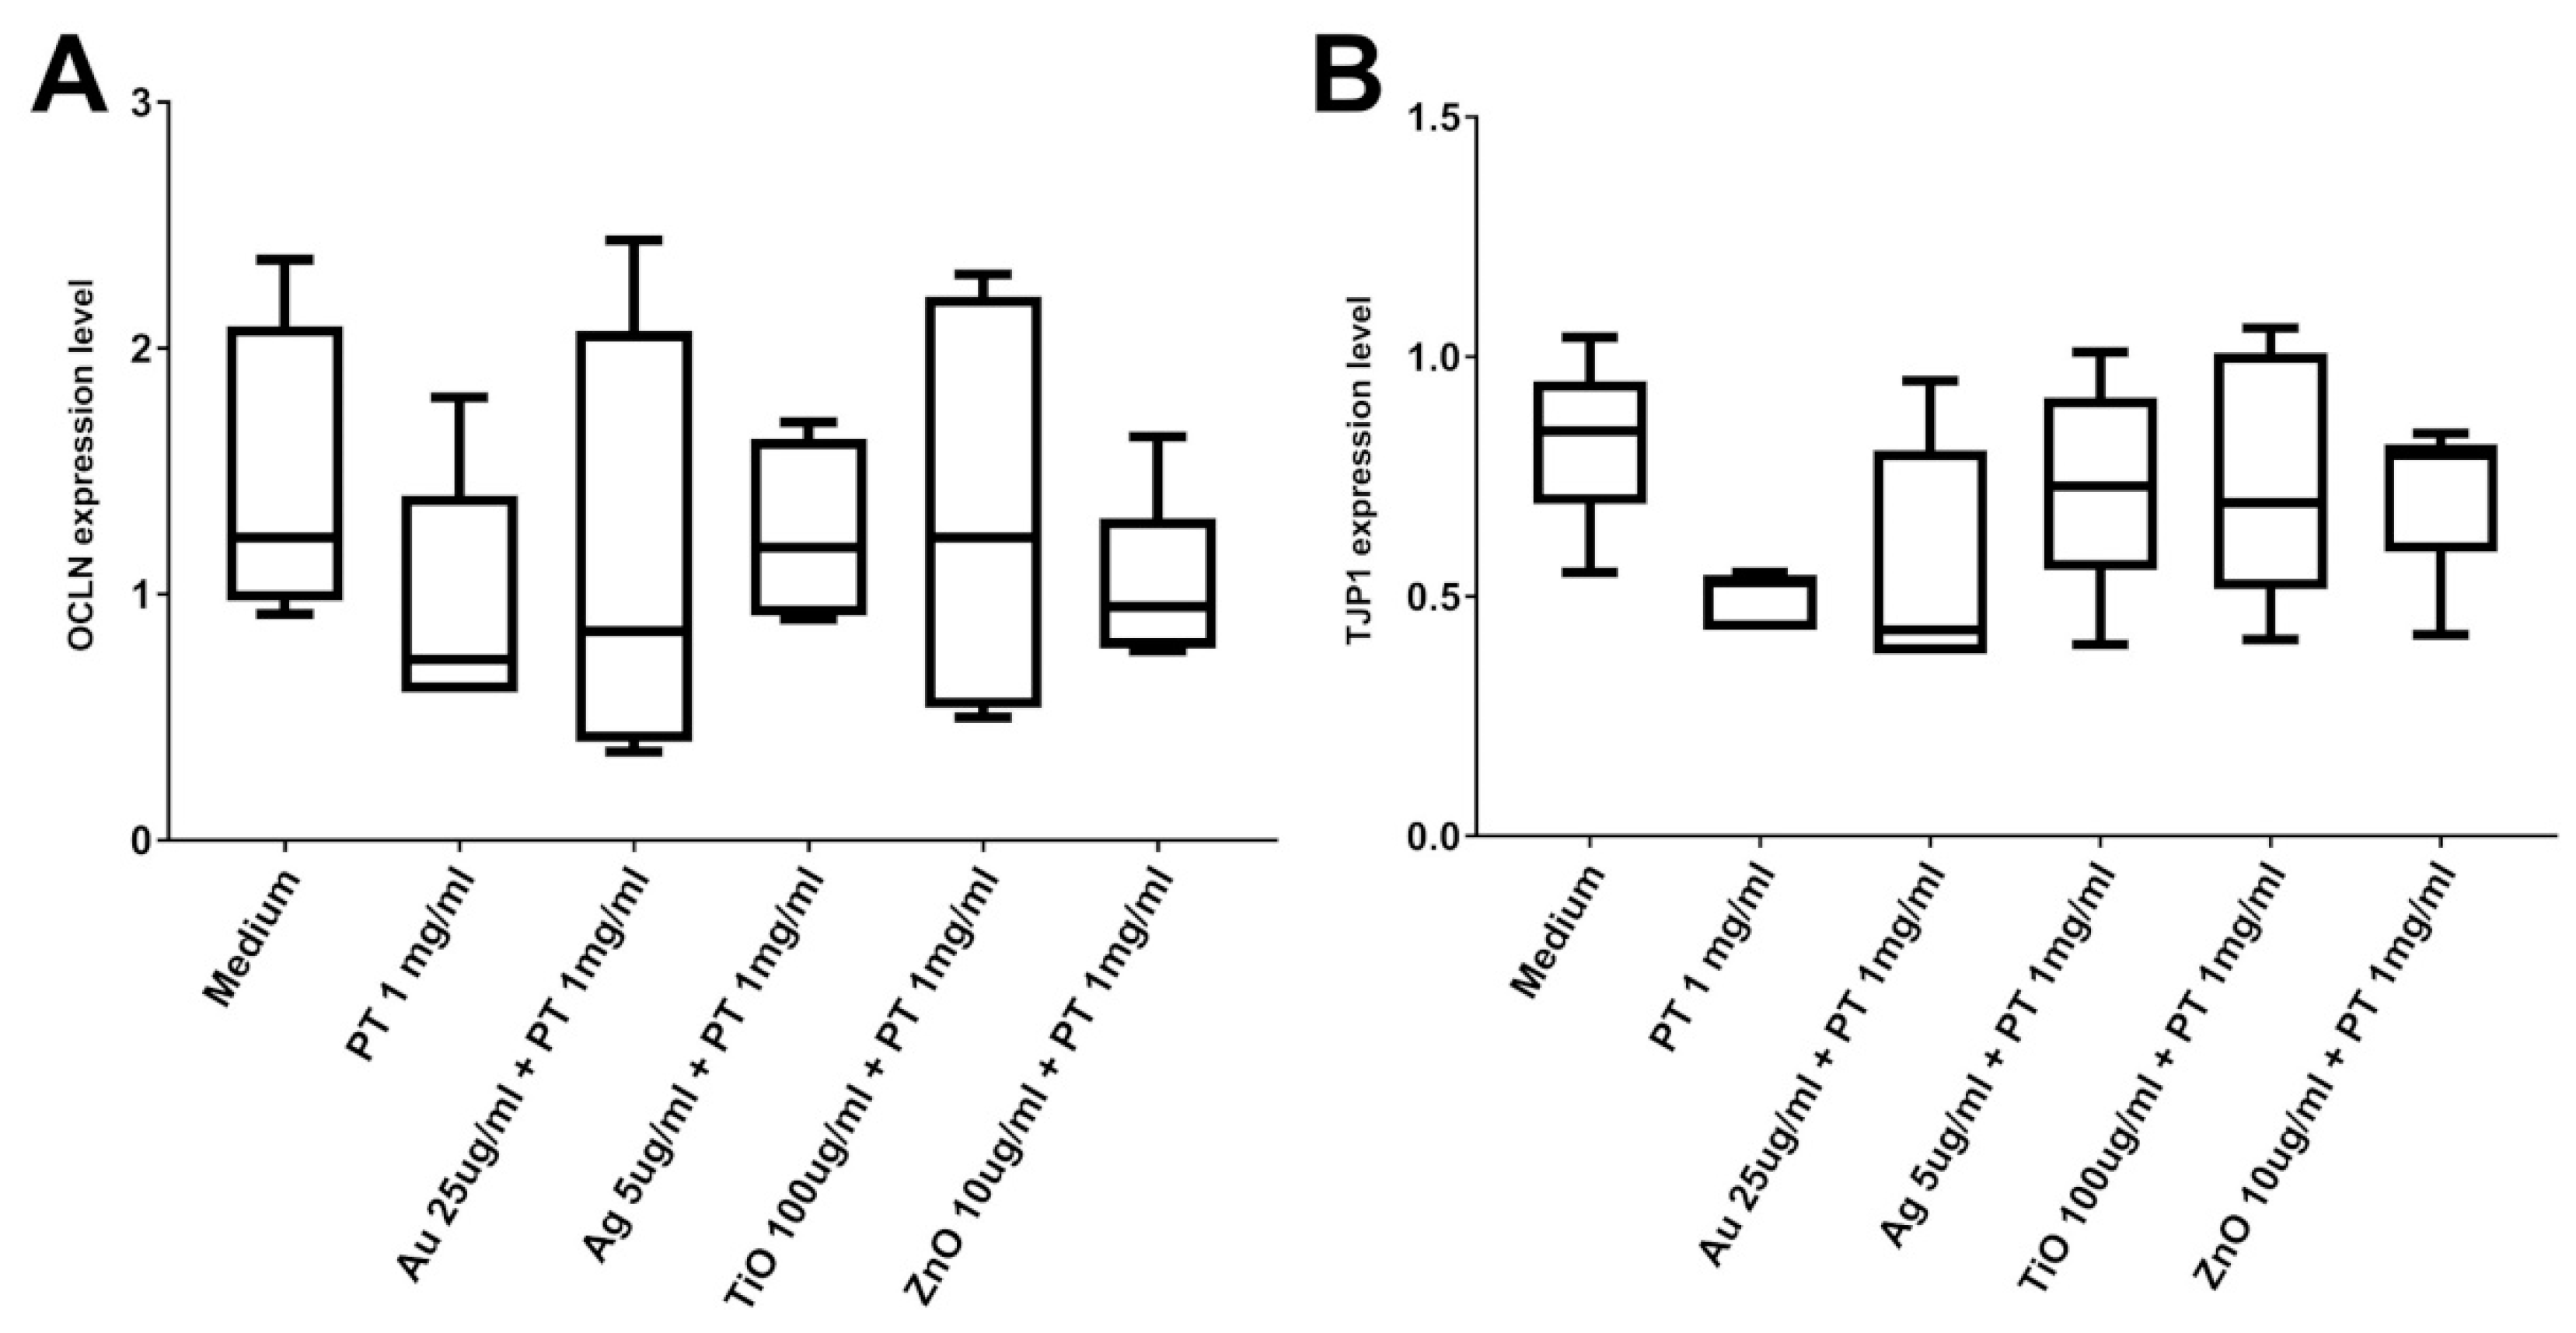
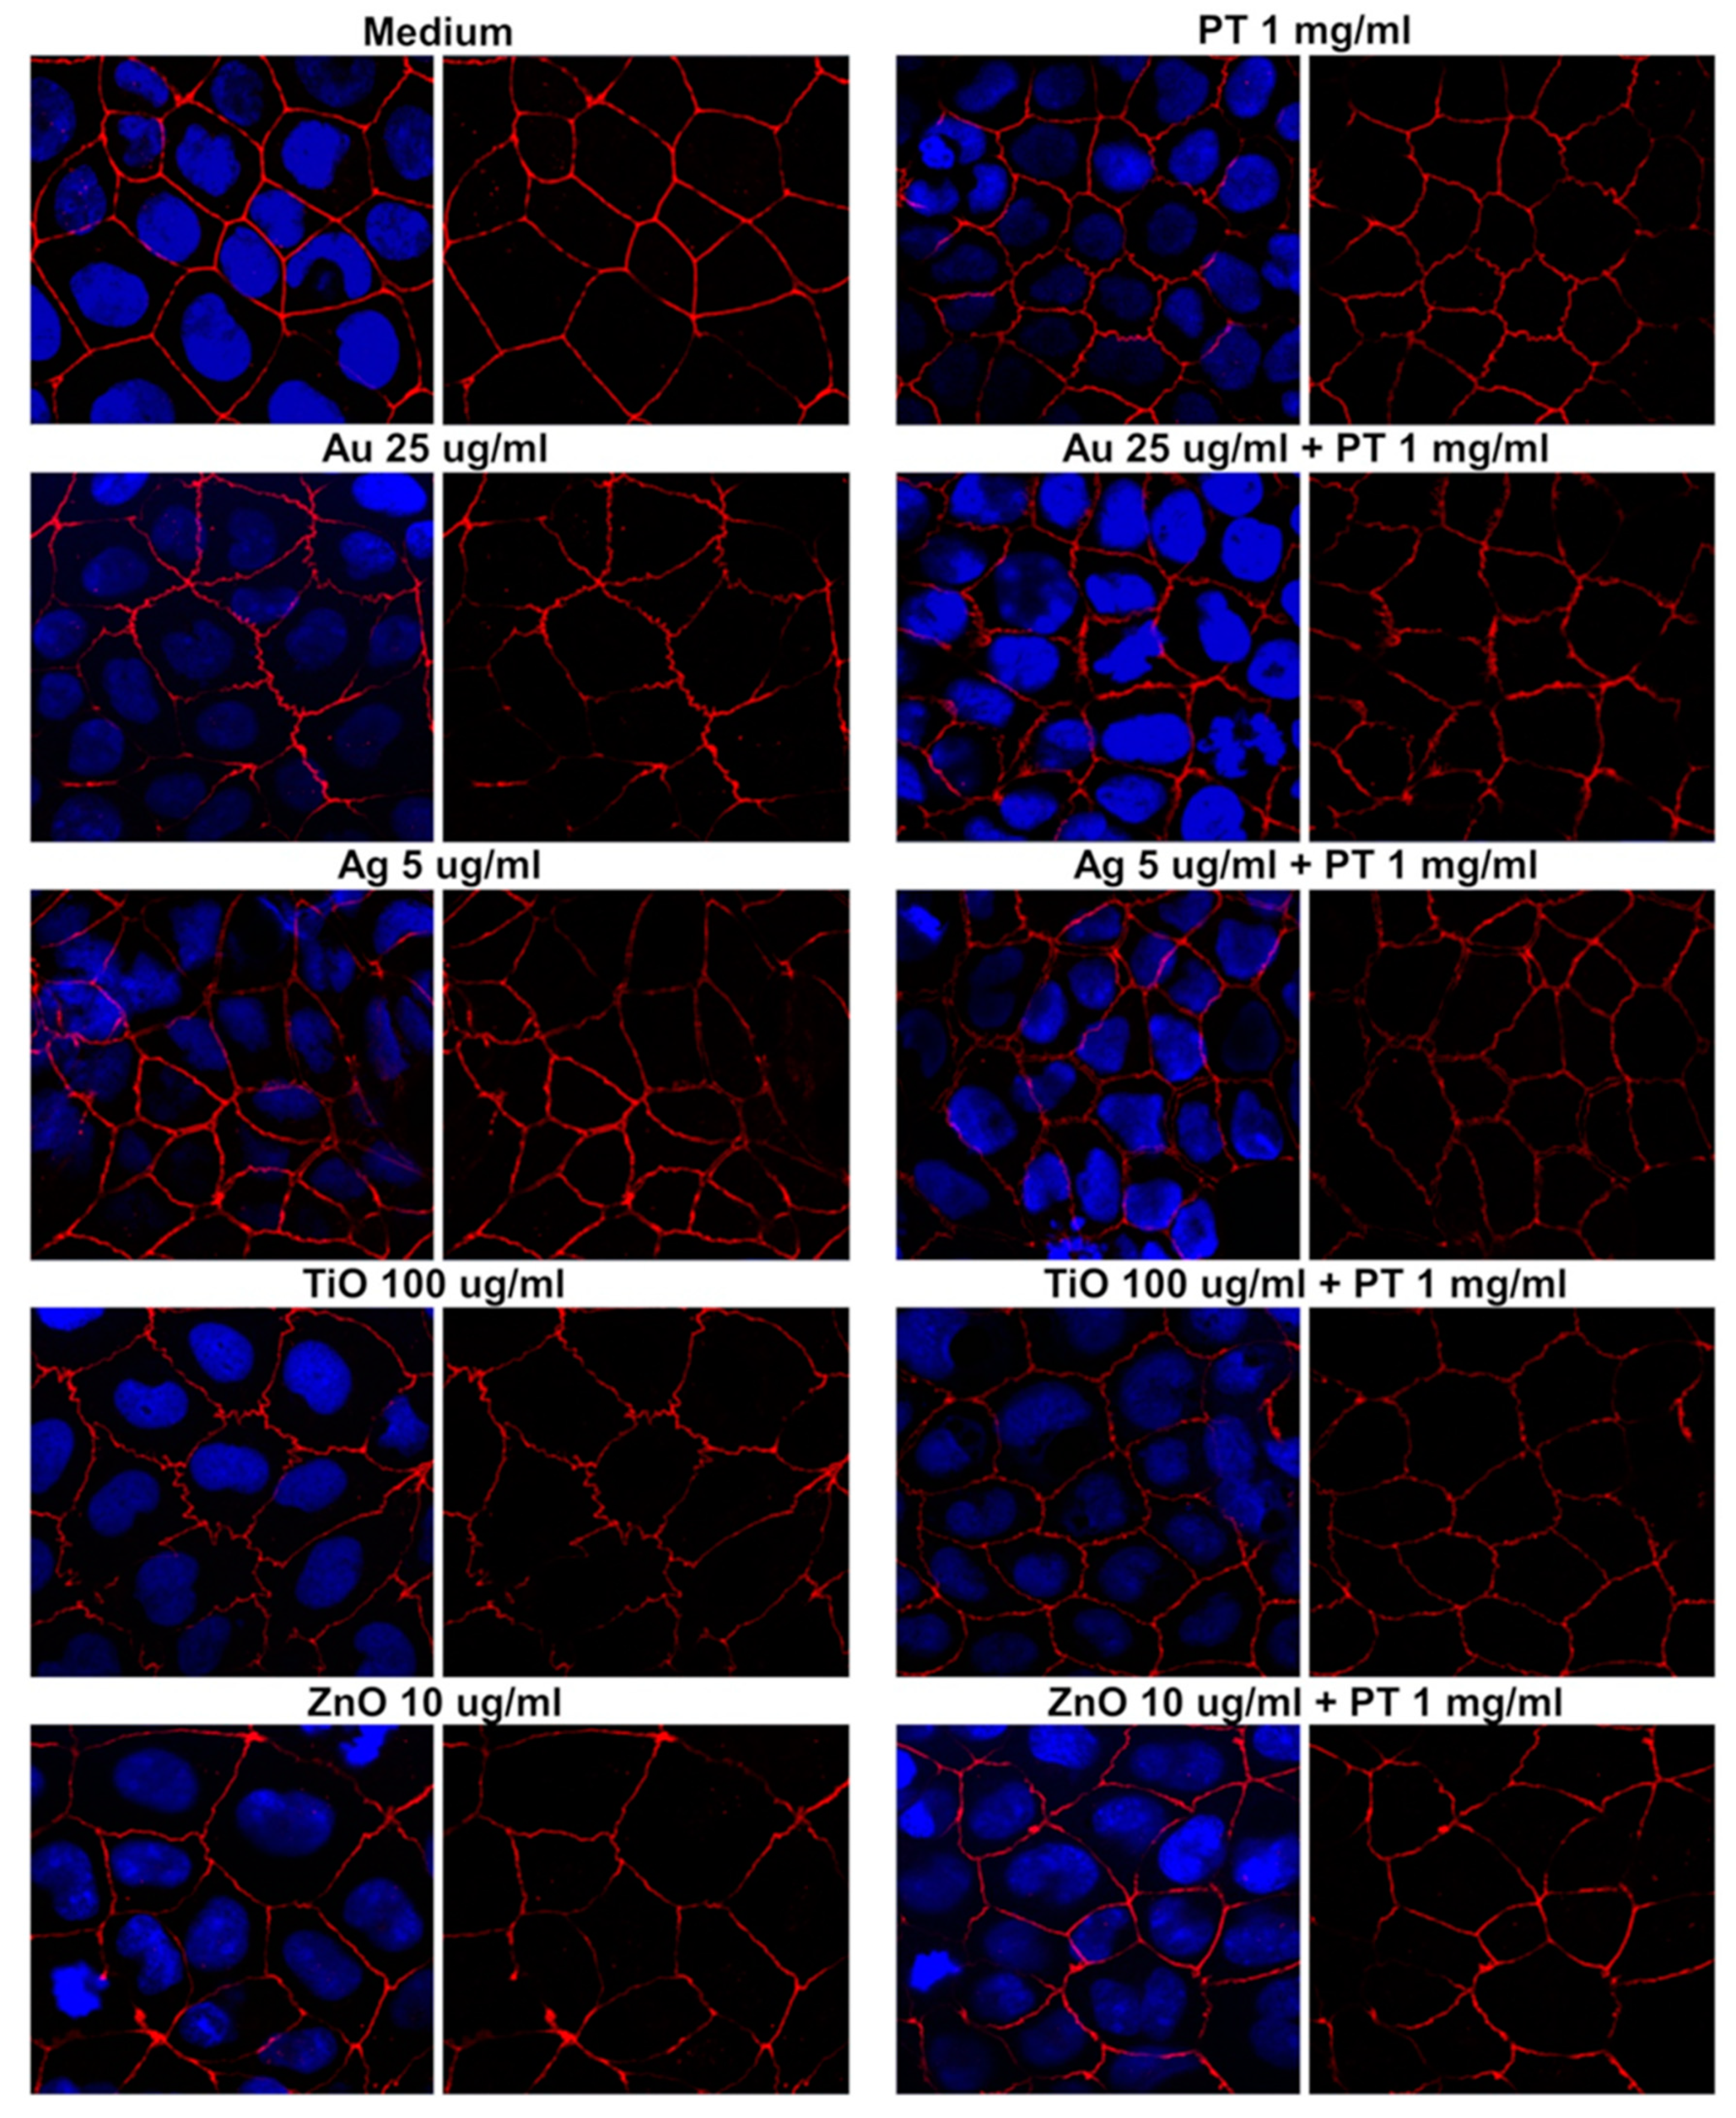
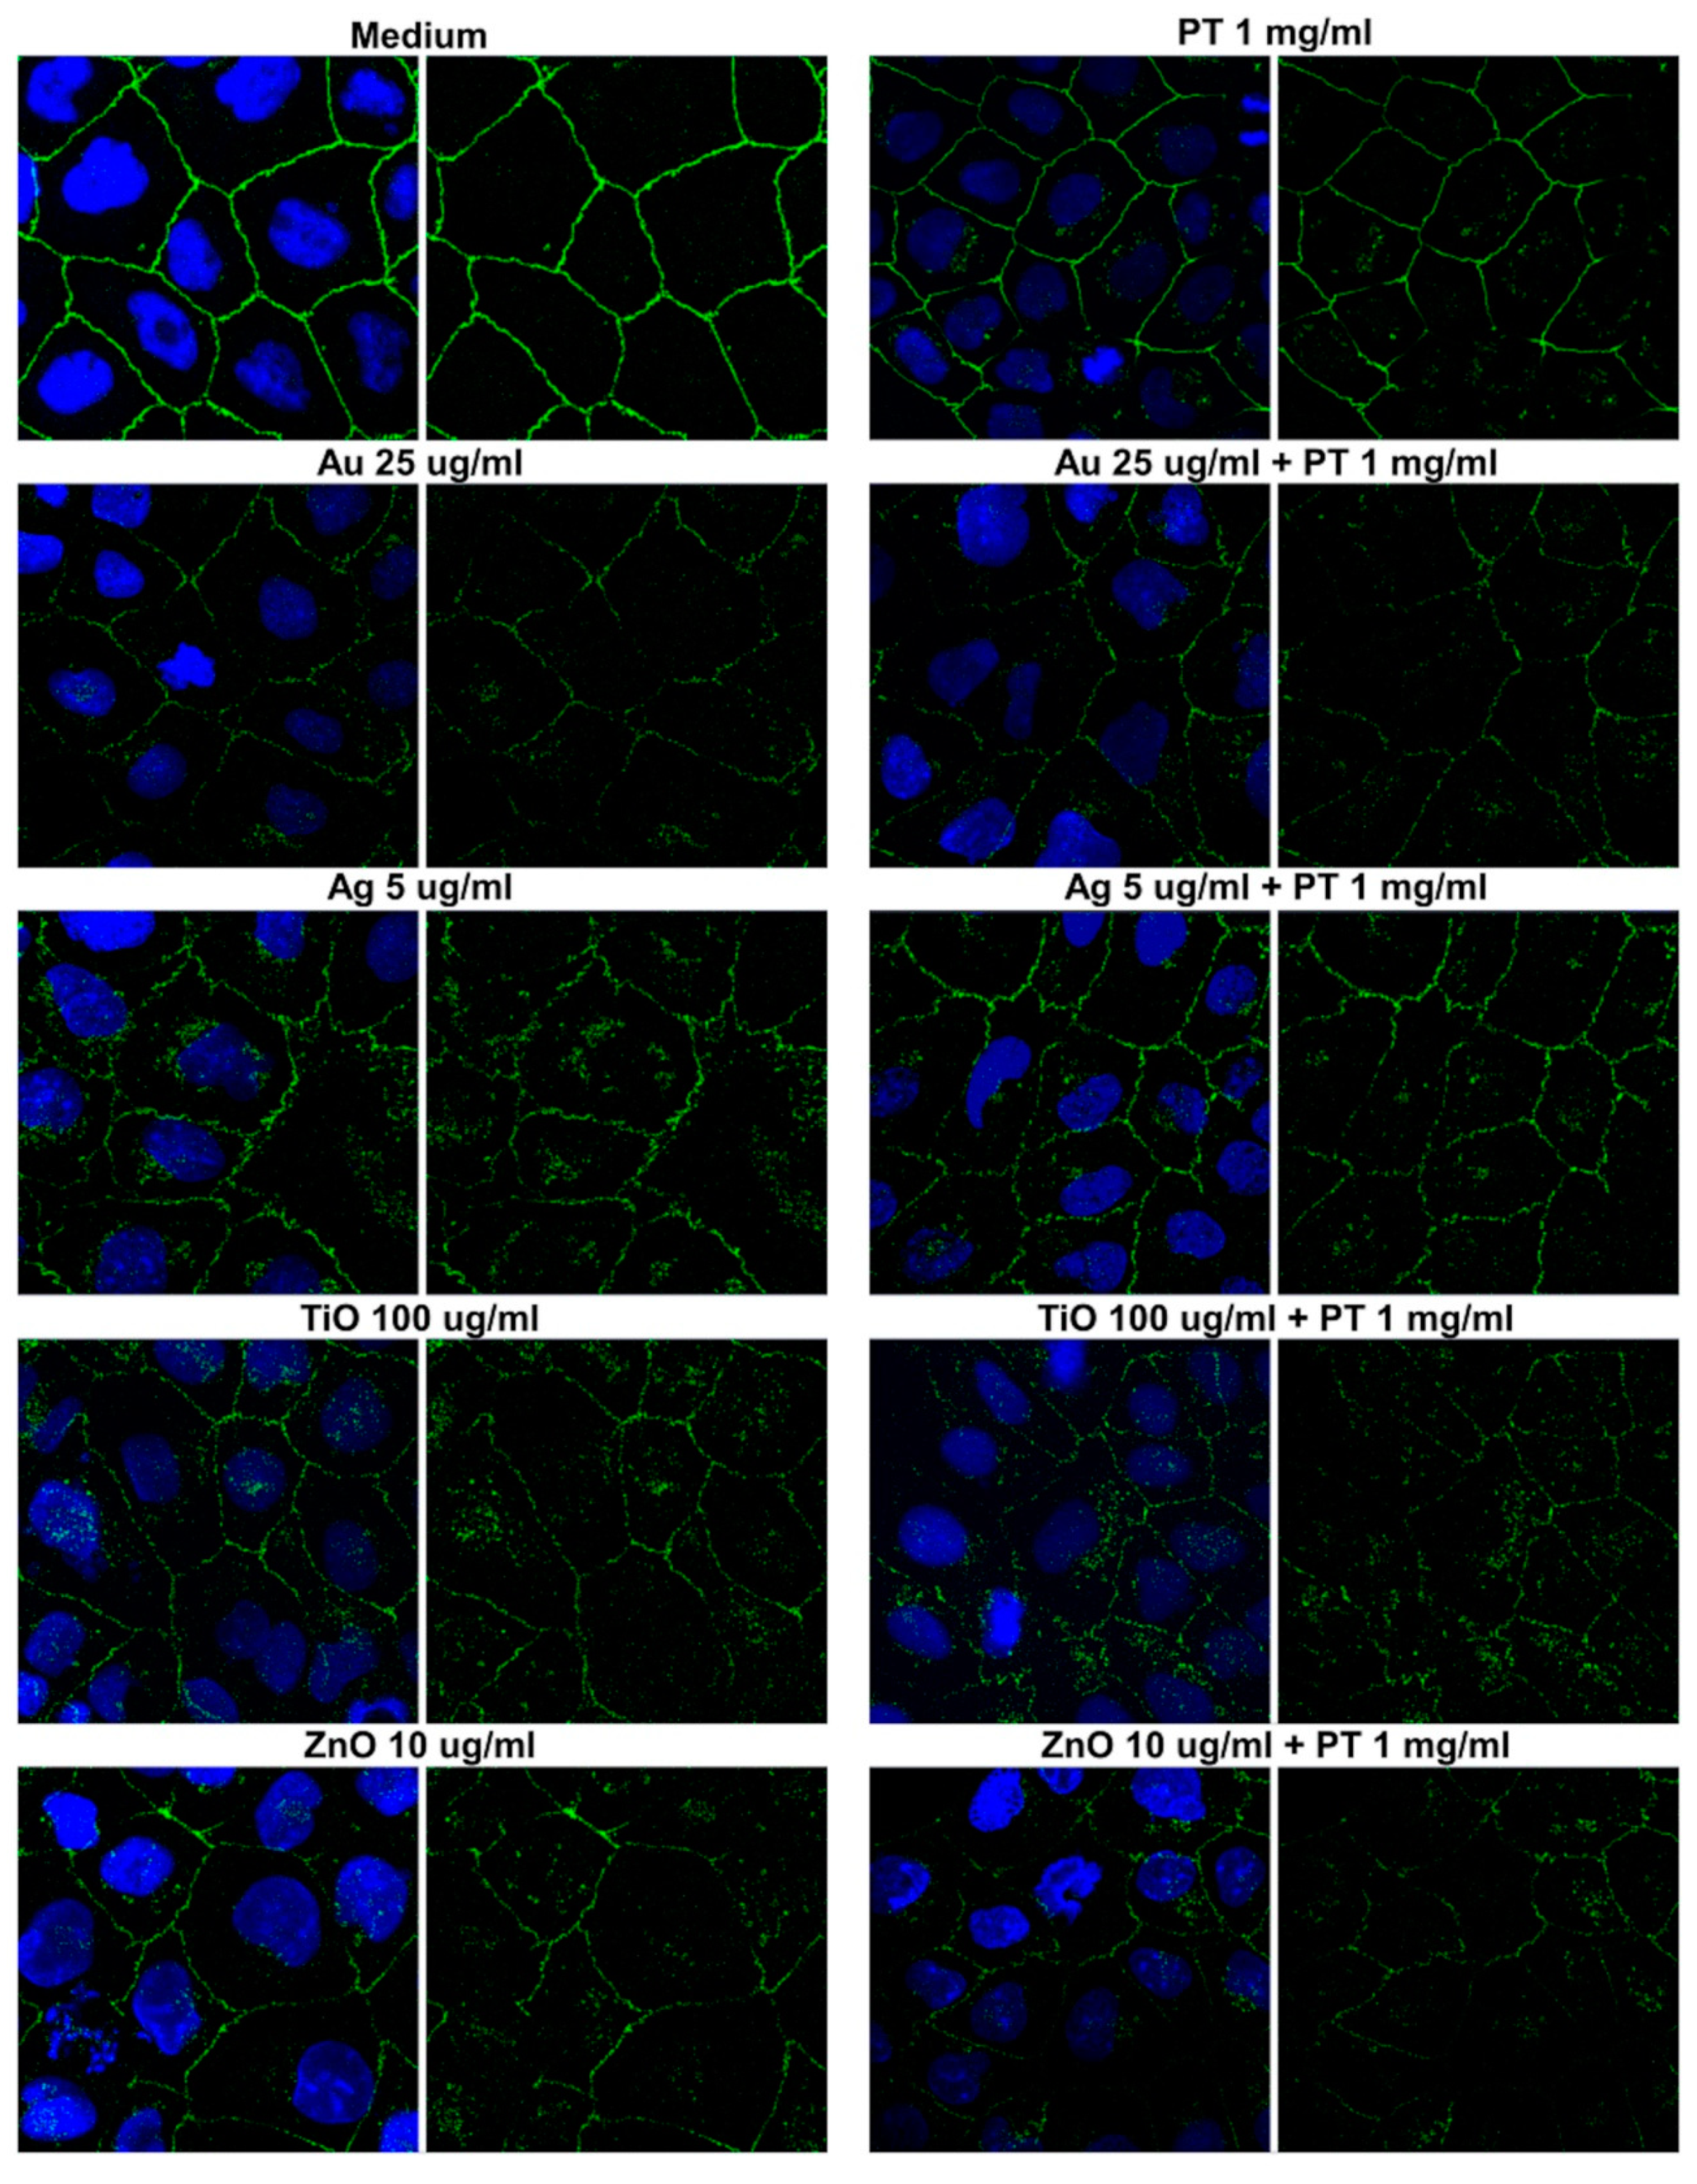
2.3. Gastrointestinal Barrier Impairment
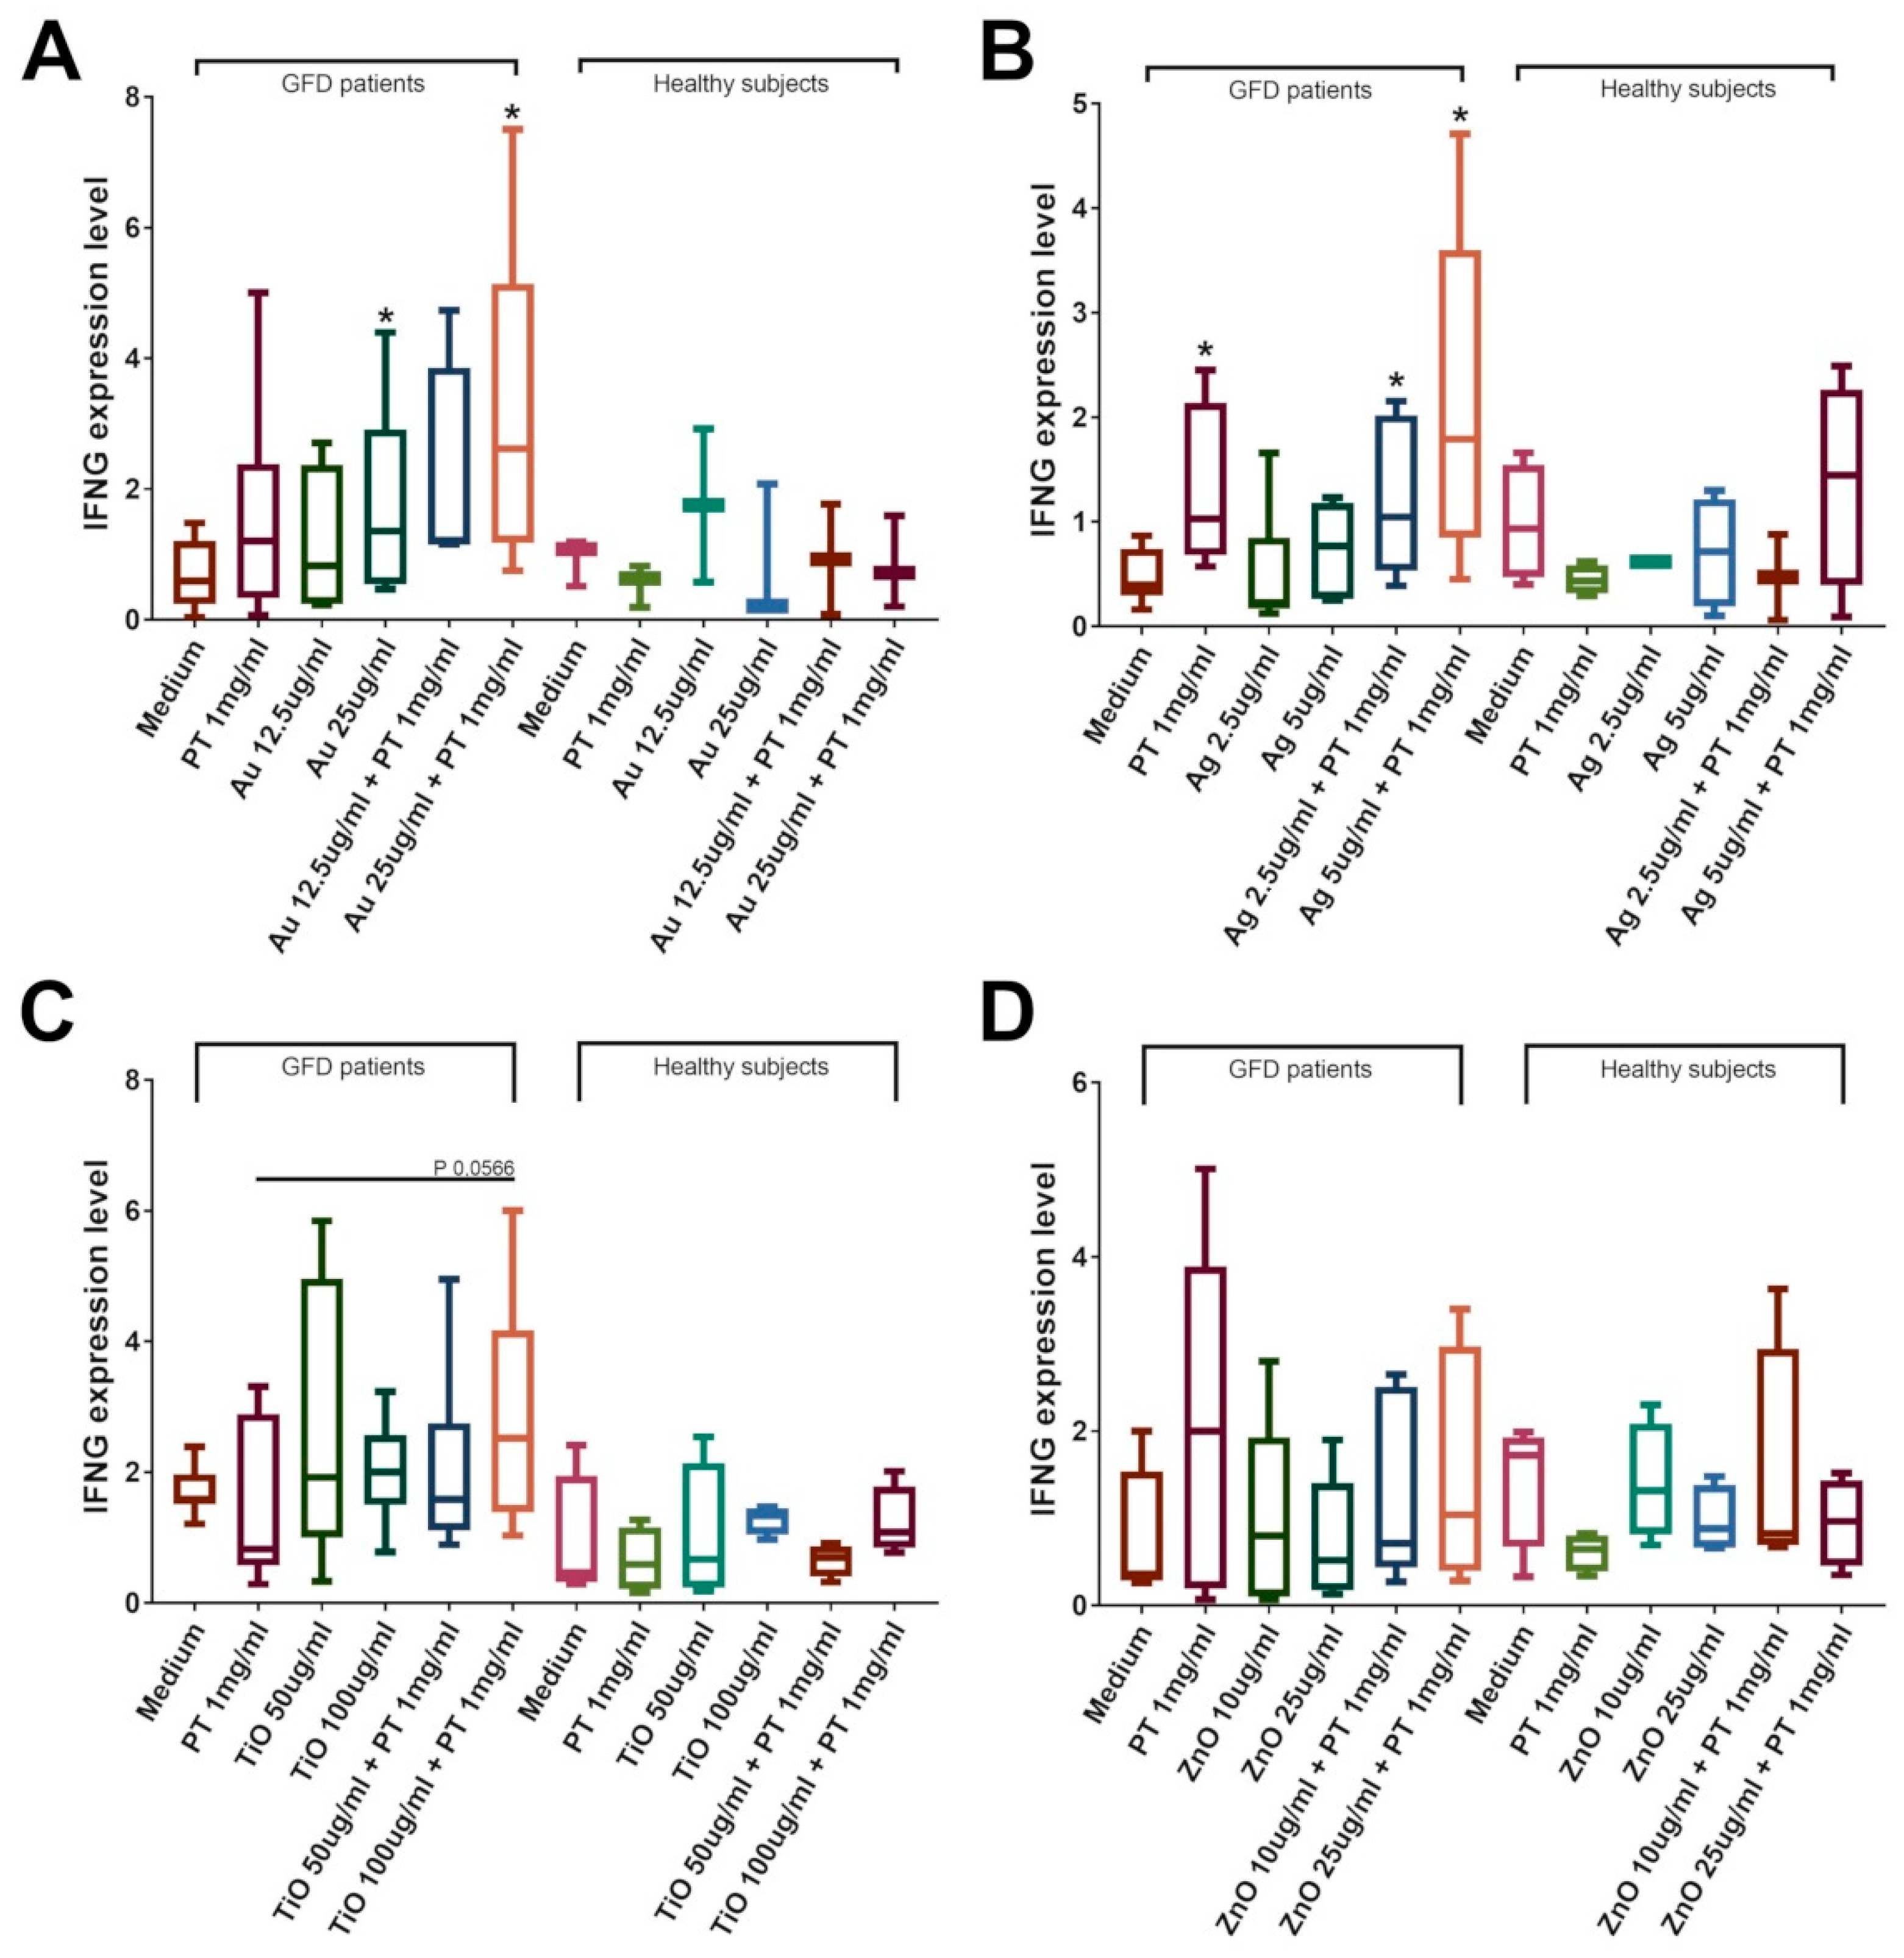
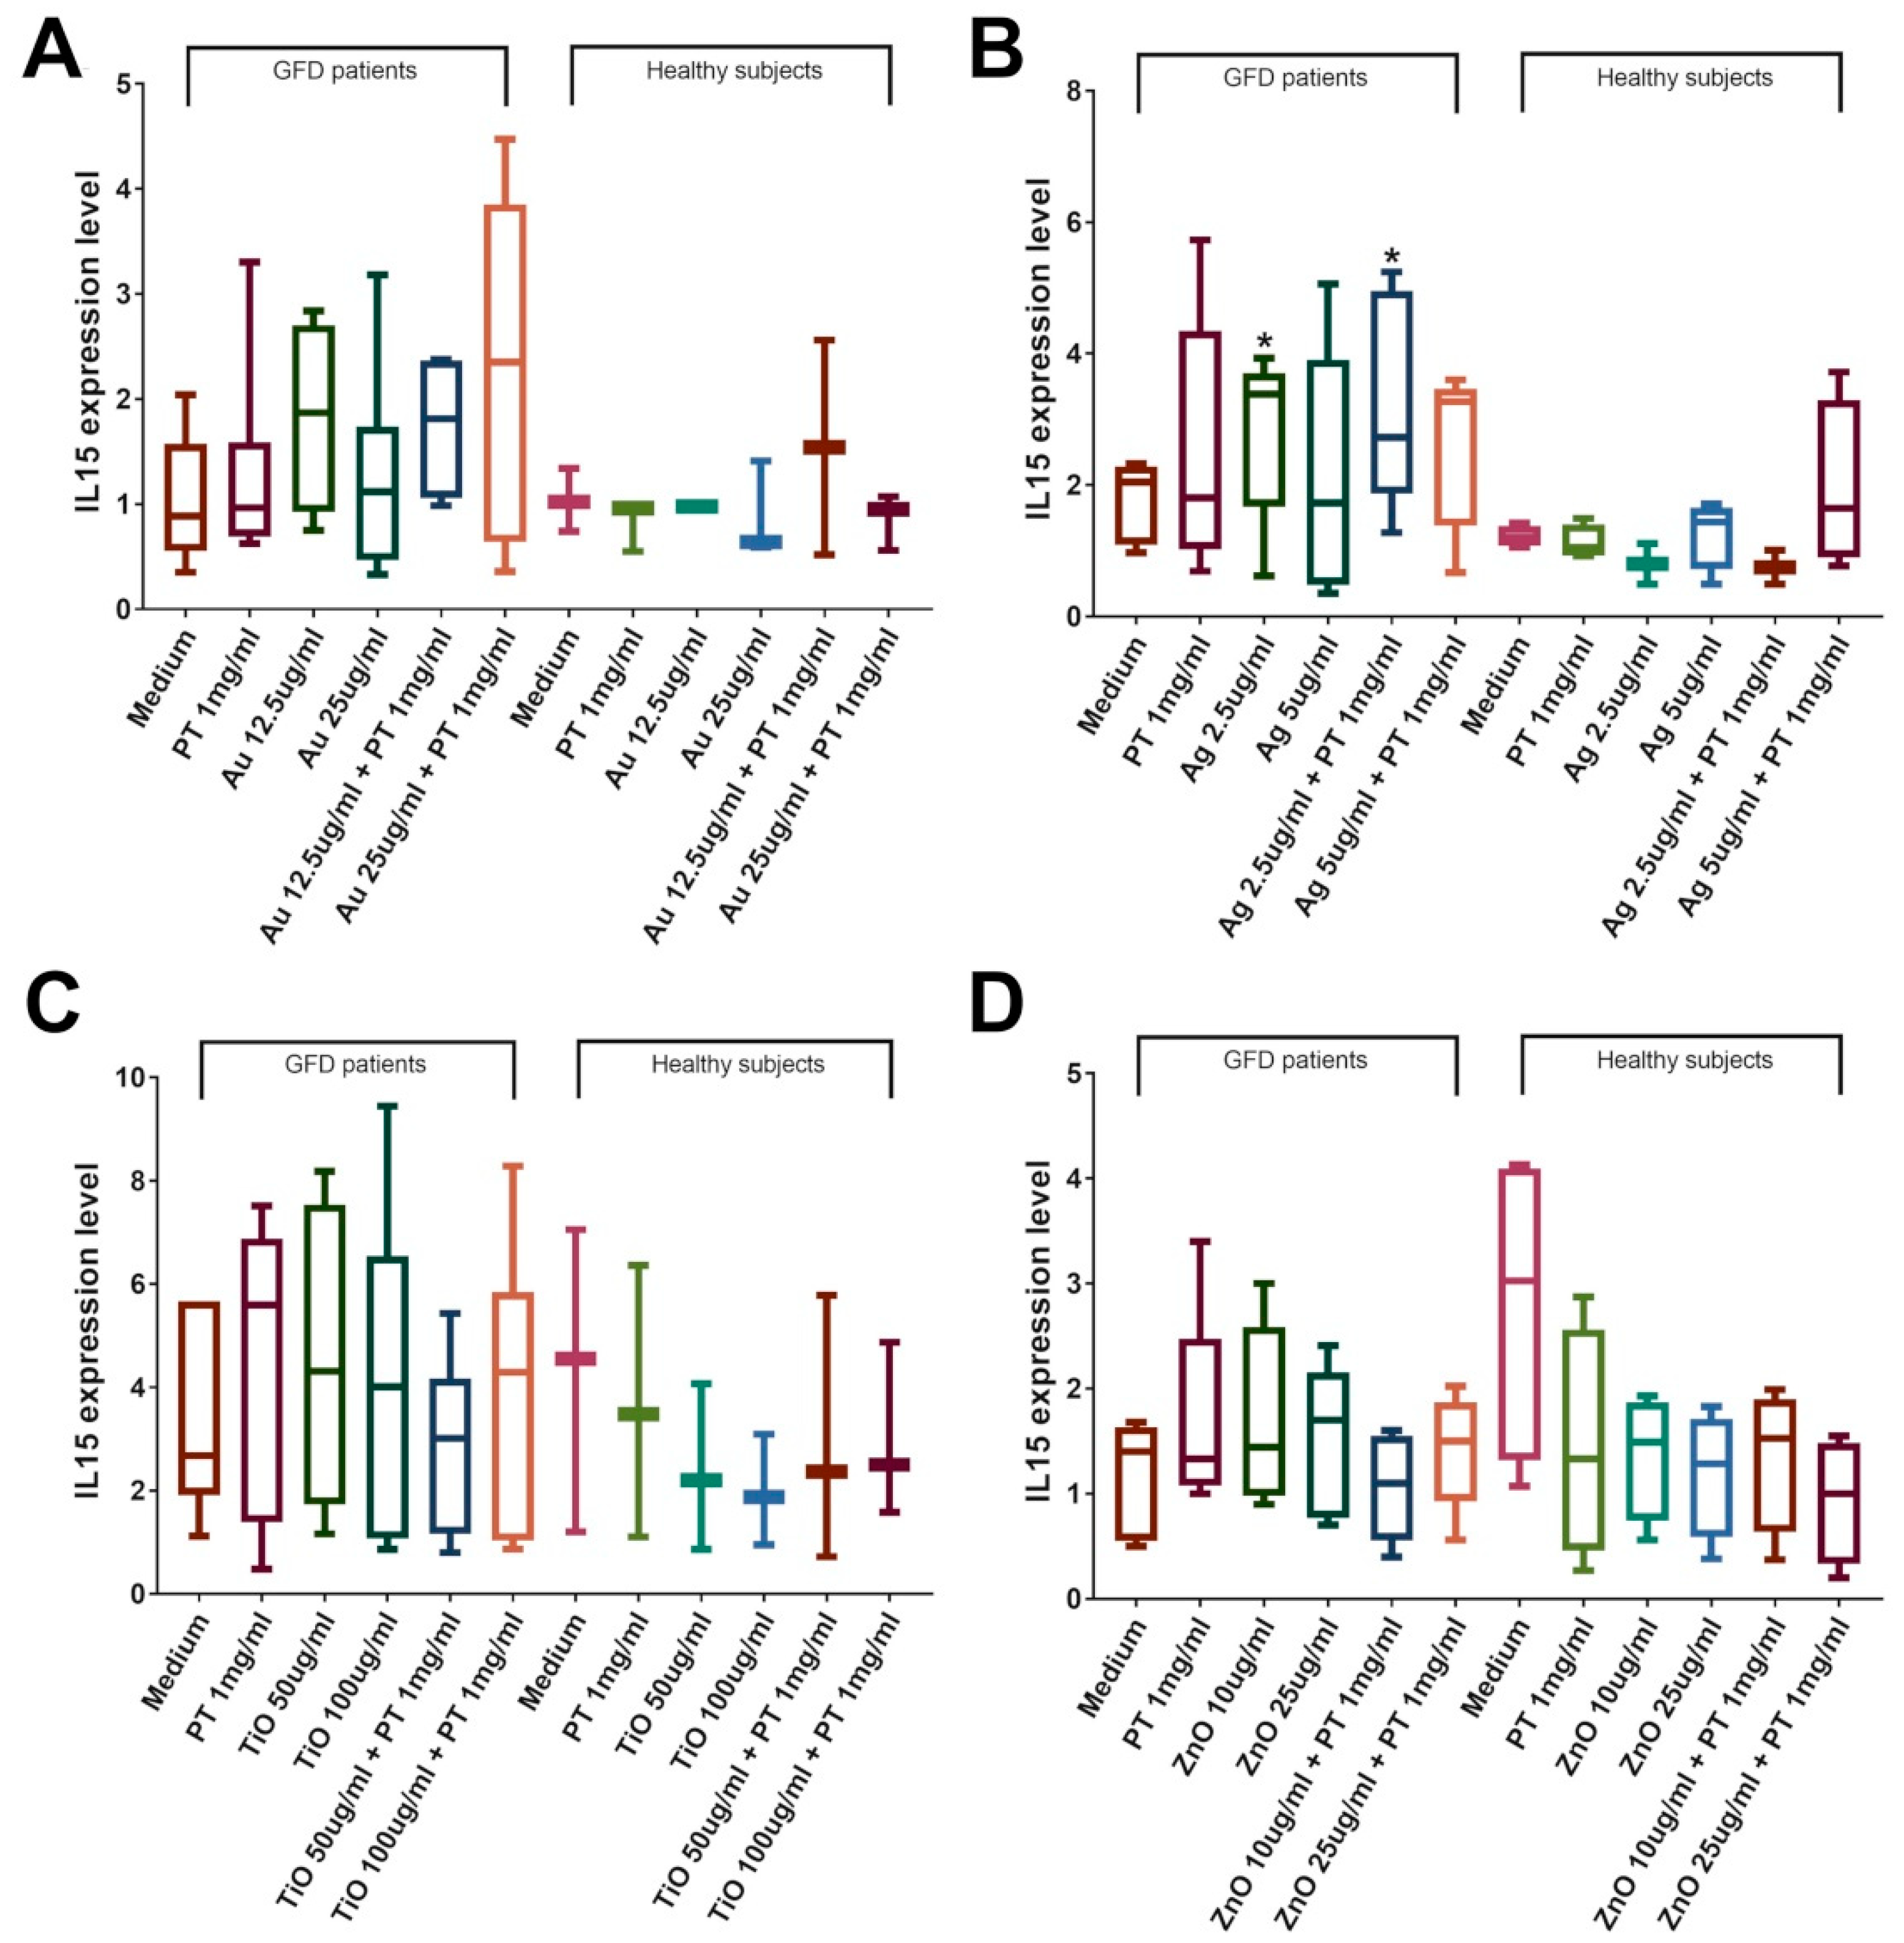
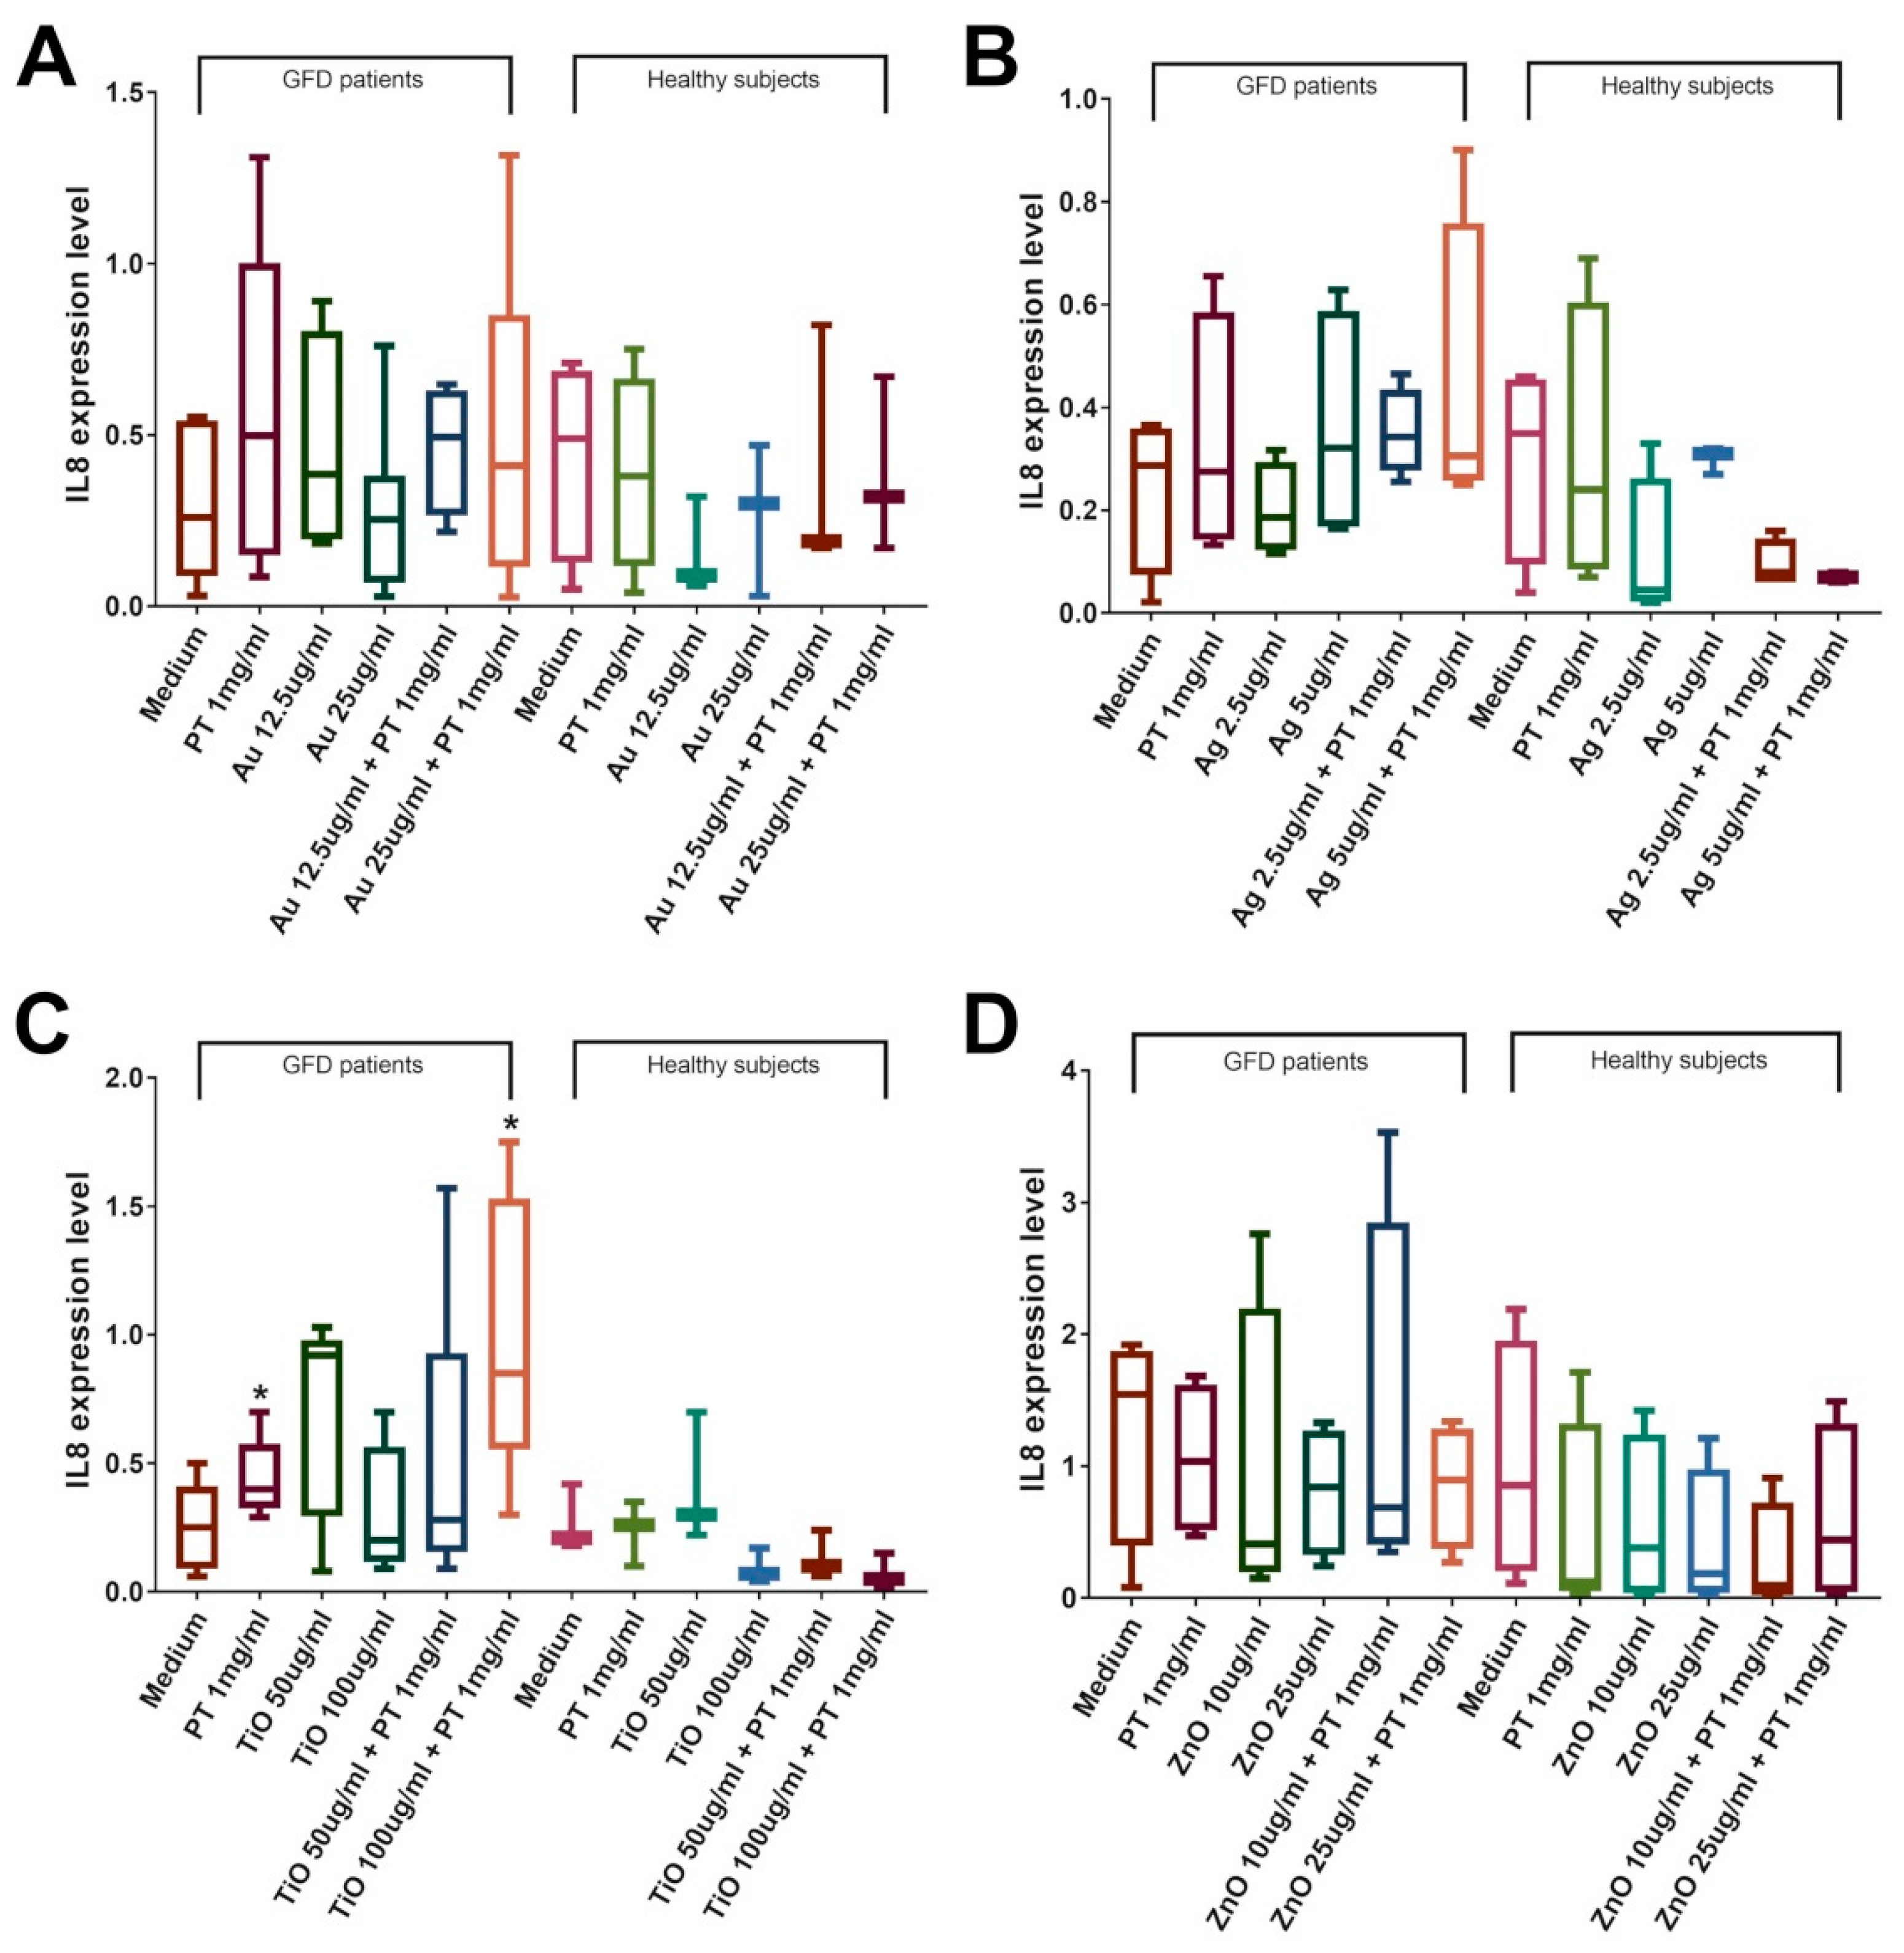
2.4. NPs Induce an Immune Response in the Duodenal Mucosa of CeD Patients
3. Discussion
4. Materials and Methods
4.1. Peptic-Tryptic Digested Gliadin (PT)
4.2. Transmission Electronic Microscope (TEM) and UV-Vis Spectra Analyses
4.3. Cell Viability Assays
4.4. Transepithelial Electrical Resistance (TEER) and Apparent Permeability (Papp)
4.5. Immunofluorescence
4.6. Patients’ Biopsies
4.7. RNA Extraction and RT-qPCR
4.8. Statistical Analyses
5. Conclusions
Supplementary Materials
Author Contributions
Funding
Institutional Review Board Statement
Informed Consent Statement
Data Availability Statement
Acknowledgments
Conflicts of Interest
References
- Peralta-Videa, J.R.; Zhao, L.; Lopez-Moreno, M.L.; de la Rosa, G.; Hong, J.; Gardea-Torresdey, J.L. Nanomaterials and the environment: A review for the biennium 2008–2010. J. Hazard. Mater. 2011, 186, 1–15. [Google Scholar] [CrossRef]
- EFSA. Scientific Committee Guidance on the risk assessment of the application of nanoscience and nanotechnologies in the food and feed chain. EFSA J. 2011, 9, 5327. [Google Scholar] [CrossRef]
- Fogli, S.; Montis, C.; Paccosi, S.; Silvano, A.; Michelucci, E.; Berti, D.; Bosi, A.; Parenti, A.; Romagnoli, P. Inorganic nanoparticles as potential regulators of immune response in dendritic cells. Nanomedicine 2017, 12, 1647–1660. [Google Scholar] [CrossRef]
- Sahani, S.; Sharma, Y.C. Advancements in applications of nanotechnology in global food industry. Food Chem. 2021, 342, 128318. [Google Scholar] [CrossRef]
- Hanley, C.; Thurber, A.; Hanna, C.; Punnoose, A.; Zhang, J.; Wingett, D.G. The Influences of Cell Type and ZnO Nanoparticle Size on Immune Cell Cytotoxicity and Cytokine Induction. Nanoscale Res. Lett. 2009, 4, 1409–1420. [Google Scholar] [CrossRef] [PubMed] [Green Version]
- Bellmann, S.; Carlander, D.; Fasano, A.; Momcilovic, D.; Scimeca, J.A.; Waldman, W.J.; Gombau, L.; Tsytsikova, L.; Canady, R.; Pereira, D.I.A.; et al. Mammalian gastrointestinal tract parameters modulating the integrity, surface properties, and absorption of food-relevant nanomaterials. Wiley Interdiscip. Rev. Nanomed. Nanobiotechnol. 2015, 7, 609–622. [Google Scholar] [CrossRef]
- Lerner, A.; Matthias, T. Changes in intestinal tight junction permeability associated with industrial food additives explain the rising incidence of autoimmune disease. Autoimmun. Rev. 2015, 14, 479–489. [Google Scholar] [CrossRef] [Green Version]
- Medina-Reyes, E.I.; Rodríguez-Ibarra, C.; Déciga-Alcaraz, A.; Díaz-Urbina, D.; Chirino, Y.I.; Pedraza-Chaverri, J. Food additives containing nanoparticles induce gastrotoxicity, hepatotoxicity and alterations in animal behavior: The unknown role of oxidative stress. Food Chem. Toxicol 2020, 146, 111814. [Google Scholar] [CrossRef] [PubMed]
- Vance, M.E.; Kuiken, T.; Vejerano, E.P.; McGinnis, S.P.; Hochella, M.F., Jr.; Rejeski, D.; Hull, M.S. Nanotechnology in the real world: Redeveloping the nanomaterial consumer products inventory. Beilstein J. Nanotechnol. 2015, 6, 1769–1780. [Google Scholar] [CrossRef] [Green Version]
- Evans, S.M.; Ashwood, P.; Warley, A.; Berisha, F.; Thompson, R.P.; Powell, J.J. The role of dietary microparticles and calcium in apoptosis and interleukin-1β release of intestinal macrophages. Gastroenterology 2002, 123, 1543–1553. [Google Scholar] [CrossRef]
- Fasano, A. Leaky Gut and Autoimmune Diseases. Clin. Rev. Allergy Immunol. 2012, 42, 71–78. [Google Scholar] [CrossRef]
- Powell, J.; Harvey, R.; Ashwood, P.; Wolstencroft, R.; Gershwin, M.; Thompson, R. Immune Potentiation of Ultrafine Dietary Particles in Normal Subjects and Patients with Inflammatory Bowel Disease. J. Autoimmun. 2000, 14, 99–105. [Google Scholar] [CrossRef]
- King, J.A.; Jeong, J.; Underwood, F.E.; Quan, J.; Panaccione, N.; Windsor, J.W.; Coward, S.; Debruyn, J.; Ronksley, P.E.; Shaheen, A.-A.; et al. Incidence of Celiac Disease Is Increasing Over Time: A Systematic Review and Meta-analysis. Am. J. Gastroenterol. 2020, 115, 507–525. [Google Scholar] [CrossRef] [PubMed]
- Poddighe, D.; Rebuffi, C.; De Silvestri, A.; Capittini, C. Carrier frequency of HLA-DQB1* 02 allele in patients affected with celiac disease: A systematic review assessing the potential rationale of a targeted allelic genotyping as a first-line screening. World J. Gastroenterol. 2020, 26, 1365–1381. [Google Scholar] [CrossRef] [PubMed]
- Lerner, A.; Arleevskaya, M.; Schmiedl, A.; Matthias, T. Microbes and Viruses Are Bugging the Gut in Celiac Disease. Are They Friends or Foes? Front. Microbiol. 2017, 8, 1392. [Google Scholar] [CrossRef] [PubMed]
- Caminero, A.; Galipeau, H.J.; McCarville, J.L.; Johnston, C.W.; Bernier, S.P.; Russell, A.K.; Jury, J.; Herran, A.R.; Casqueiro, J.; Tye-Din, J.A.; et al. Duodenal Bacteria From Patients With Celiac Disease and Healthy Subjects Distinctly Affect Gluten Breakdown and Immunogenicity. Gastroenterology 2016, 151, 670–683. [Google Scholar] [CrossRef] [Green Version]
- Drago, S.; El Asmar, R.; Di Pierro, M.; Clemente, M.G.; Sapone, A.T.A.; Thakar, M.; Iacono, G.; Carroccio, A.; D’Agate, C.; Not, T.; et al. Gliadin, zonulin and gut permeability: Effects on celiac and non-celiac intestinal mucosa and intestinal cell lines. Scand. J. Gastroenterol. 2006, 41, 408–419. [Google Scholar] [CrossRef] [PubMed]
- Mirsadeghi, S.; Dinarvand, R.; Ghahremani, M.H.; Hormozi-Nezhad, M.R.; Mahmoudi, Z.; Hajipour, M.J.; Atyabi, F.; Ghavami, M.; Mahmoudi, M. Protein corona composition of gold nanoparticles/nanorods affects amyloid beta fibrillation process. Nanoscale 2015, 7, 5004–5013. [Google Scholar] [CrossRef] [PubMed]
- Yang, Y.; Doudrick, K.; Bi, X.; Hristovski, K.; Herckes, P.; Westerhoff, P.; Kaegi, R. Characterization of Food-Grade Titanium Dioxide: The Presence of Nanosized Particles. Environ. Sci. Technol. 2014, 48, 6391–6400. [Google Scholar] [CrossRef]
- Gerloff, K.; Pereira, D.I.; Faria, N.; Boots, A.W.; Kolling, J.; Förster, I.; Albrecht, C.; Powell, J.J.; Schins, R.P. Influence of simulated gastrointestinal conditions on particle-induced cytotoxicity and interleukin-8 regulation in differentiated and undifferentiated Caco-2 cells. Nanotoxicology 2013, 7, 353–366. [Google Scholar] [CrossRef] [Green Version]
- Brun, E.; Barreau, F.; Veronesi, G.; Fayard, B.; Sorieul, S.; Chanéac, C.; Carapito, C.; Rabilloud, T.; Mabondzo, A.; Herlin-Boime, N.; et al. Titanium dioxide nanoparticle impact and translocation through ex vivo, in vivo and in vitro gut epithelia. Part. Fibre Toxicol. 2014, 11, 13. [Google Scholar] [CrossRef] [Green Version]
- Borgognoni, C.F.; Kim, J.H.; Zucolotto, V.; Fuchs, H.; Riehemann, K. Human macrophage responses to metal-oxide nanoparticles: A review. Artif. Cells Nanomed. Biotechnol. 2018, 46, 694–703. [Google Scholar] [CrossRef] [Green Version]
- Ruiz, P.A.; Morón, B.; Becker, H.M.; Lang, S.; Atrott, K.; Spalinger, M.R.; Scharl, M.; Wojtal, K.A.; Fischbeck-Terhalle, A.; Frey-Wagner, I.; et al. Titanium dioxide nanoparticles exacerbate DSS-induced colitis: Role of the NLRP3 inflammasome. Gut 2017, 66, 1216–1224. [Google Scholar] [CrossRef] [PubMed] [Green Version]
- Cao, X.; Ma, C.; Gao, Z.; Zheng, J.; He, L.; McClements, D.J.; Xiao, H. Characterization of the Interactions between Titanium Dioxide Nanoparticles and Polymethoxyflavones Using Surface-Enhanced Raman Spectroscopy. J. Agric. Food Chem. 2016, 64, 9436–9441. [Google Scholar] [CrossRef]
- Fang, X.; Jiang, L.; Gong, Y.; Li, J.; Liu, L.; Cao, Y. The presence of oleate stabilized ZnO nanoparticles (NPs) and reduced the toxicity of aged NPs to Caco-2 and HepG2 cells. Chem. Interact. 2017, 278, 40–47. [Google Scholar] [CrossRef] [PubMed]
- Martirosyan, A.; Grintzalis, K.; Polet, M.; Laloux, L.; Schneider, Y.-J. Tuning the inflammatory response to silver nanoparticles via quercetin in Caco-2 (co-)cultures as model of the human intestinal mucosa. Toxicol. Lett. 2016, 253, 36–45. [Google Scholar] [CrossRef]
- Wang, Y.; Yuan, L.; Yao, C.; Ding, L.; Li, C.; Fang, J.; Sui, K.; Liu, Y.; Wu, M. A combined toxicity study of zinc oxide nanoparticles and vitamin C in food additives. Nanoscale 2014, 6, 15333–15342. [Google Scholar] [CrossRef] [PubMed]
- Mitchell, M.J.; Billingsley, M.M.; Haley, R.M.; Wechsler, M.E.; Peppas, N.A.; Langer, R. Engineering precision nanoparticles for drug delivery. Nat. Rev. Drug Discov. 2021, 20, 101–124. [Google Scholar] [CrossRef]
- Cao, S.-J.; Xu, S.; Wang, H.-M.; Ling, Y.; Dong, J.; Xia, R.-D.; Sun, X.-H. Nanoparticles: Oral Delivery for Protein and Peptide Drugs. AAPS PharmSciTech 2019, 20, 1–11. [Google Scholar] [CrossRef] [PubMed] [Green Version]
- Peters, R.; Kramer, E.; Oomen, A.G.; Rivera, Z.E.H.; Oegema, G.; Tromp, P.C.; Fokkink, R.; Rietveld, A.; Marvin, H.J.P.; Weigel, S.; et al. Presence of Nano-Sized Silica during In Vitro Digestion of Foods Containing Silica as a Food Additive. ACS Nano 2012, 6, 2441–2451. [Google Scholar] [CrossRef]
- Walczak, A.P.; Fokkink, R.; Peters, R.; Tromp, P.; Rivera, Z.E.H.; Rietjens, I.M.; Hendriksen, P.; Bouwmeester, H. Behaviour of silver nanoparticles and silver ions in an in vitro human gastrointestinal digestion model. Nanotoxicology 2012, 7, 1198–1210. [Google Scholar] [CrossRef] [PubMed]
- Sieg, H.; Kästner, C.; Krause, B.; Meyer, T.; Burel, A.; Böhmert, L.; Lichtenstein, D.; Jungnickel, H.; Tentschert, J.; Laux, P.; et al. Impact of an Artificial Digestion Procedure on Aluminum-Containing Nanomaterials. Langmuir 2017, 33, 10726–10735. [Google Scholar] [CrossRef]
- Zhang, Z.; Zhang, R.; Xiao, H.; Bhattacharya, K.; Bitounis, D.; Demokritou, P.; McClements, D.J. Development of a standardized food model for studying the impact of food matrix effects on the gastrointestinal fate and toxicity of ingested nanomaterials. NanoImpact 2019, 13, 13–25. [Google Scholar] [CrossRef]
- Zhou, P.; Guo, M.; Cui, X. Effect of food on orally-ingested titanium dioxide and zinc oxide nanoparticle behaviors in simulated digestive tract. Chemosphere 2021, 268, 128843. [Google Scholar] [CrossRef]
- Cao, X.; Zhang, T.; DeLoid, G.M.; Gaffrey, M.J.; Weitz, K.K.; Thrall, B.D.; Qian, W.-J.; Demokritou, P. Evaluation of the cytotoxic and cellular proteome impacts of food-grade TiO2 (E171) using simulated gastrointestinal digestions and a tri-culture small intestinal epithelial model. NanoImpact 2020, 17, 100202. [Google Scholar] [CrossRef] [PubMed]
- Marucco, A.; Prono, M.; Beal, D.; Alasonati, E.; Fisicaro, P.; Bergamaschi, E.; Carriere, M.; Fenoglio, I. Biotransformation of Food-Grade and Nanometric TiO2 in the Oral–Gastro–Intestinal Tract: Driving Forces and Effect on the Toxicity toward Intestinal Epithelial Cells. Nanomaterials 2020, 10, 2132. [Google Scholar] [CrossRef] [PubMed]
- Albanese, A.; Chan, W.C. Effect of Gold Nanoparticle Aggregation on Cell Uptake and Toxicity. ACS Nano 2011, 5, 5478–5489. [Google Scholar] [CrossRef] [PubMed]
- Mulenos, M.R.; Liu, J.; Lujan, H.; Guo, B.; Lichtfouse, E.; Sharma, V.K.; Sayes, C.M. Copper, silver, and titania nanoparticles do not release ions under anoxic conditions and release only minute ion levels under oxic conditions in water: Evidence for the low toxicity of nanoparticles. Environ. Chem. Lett. 2020, 18, 1319–1328. [Google Scholar] [CrossRef]
- Shalimar, D.M.; Das, P.; Sreenivas, V.; Gupta, S.D.; Panda, S.K.; Makharia, G.K. Mechanism of Villous Atrophy in Celiac Disease: Role of Apoptosis and Epithelial Regeneration. Arch. Pathol. Lab. Med. 2013, 137, 1262–1269. [Google Scholar] [CrossRef]
- Sander, G.R.; Cummins, A.G.; Powell, B.C. Rapid disruption of intestinal barrier function by gliadin involves altered expression of apical junctional proteins. FEBS Lett. 2005, 579, 4851–4855. [Google Scholar] [CrossRef]
- Yao, M.; He, L.; McClements, D.J.; Xiao, H. Uptake of Gold Nanoparticles by Intestinal Epithelial Cells: Impact of Particle Size on Their Absorption, Accumulation, and Toxicity. J. Agric. Food Chem. 2015, 63, 8044–8049. [Google Scholar] [CrossRef]
- Peters, R.J.B.; Van Bemmel, G.; Herrera-Rivera, Z.; Helsper, H.P.F.G.; Marvin, H.J.P.; Weigel, S.; Tromp, P.C.; Oomen, A.G.; Rietveld, A.G.; Bouwmeester, H. Characterization of Titanium Dioxide Nanoparticles in Food Products: Analytical Methods To Define Nanoparticles. J. Agric. Food Chem. 2014, 62, 6285–6293. [Google Scholar] [CrossRef]
- EFSA Panel on Food Additives and Nutrient Sources added to Food (ANS). Re-evaluation of titanium dioxide (E 171) as a food additive. EFSA J. 2016, 14, e04545. [Google Scholar] [CrossRef]
- Coméra, C.; Cartier, C.; Gaultier, E.; Catrice, O.; Panouille, Q.; El Hamdi, S.; Tirez, K.; Nelissen, I.; Théodorou, V.; Houdeau, E. Jejunal villus absorption and paracellular tight junction permeability are major routes for early intestinal uptake of food-grade TiO2 particles: An in vivo and ex vivo study in mice. Part. Fibre Toxicol. 2020, 17, 1–15. [Google Scholar] [CrossRef]
- Luo, Y.-H.; Chang, L.W.; Lin, P. Metal-Based Nanoparticles and the Immune System: Activation, Inflammation, and Potential Applications. BioMed Res. Int. 2015, 2015, 1–12. [Google Scholar] [CrossRef]
- Bettini, S.; Boutet-Robinet, E.; Cartier, C.; Coméra, C.; Gaultier, E.; Dupuy, J.; Naud, N.; Taché, S.; Grysan, P.; Reguer, S.; et al. Food-grade TiO2 impairs intestinal and systemic immune homeostasis, initiates preneoplastic lesions and promotes aberrant crypt development in the rat colon. Sci. Rep. 2017, 7, srep40373. [Google Scholar] [CrossRef] [PubMed]
- Gillois, K.; Lévêque, M.; Théodorou, V.; Robert, H.; Mercier-Bonin, M. Mucus: An Underestimated Gut Target for Environmental Pollutants and Food Additives. Microorganisms 2018, 6, 53. [Google Scholar] [CrossRef] [PubMed] [Green Version]
- Ghebretatios, M.; Schaly, S.; Prakash, S. Nanoparticles in the Food Industry and Their Impact on Human Gut Microbiome and Diseases. Int. J. Mol. Sci. 2021, 22, 1942. [Google Scholar] [CrossRef] [PubMed]
- Gokulan, K.; Williams, K.; Orr, S.; Khare, S. Human Intestinal Tissue Explant Exposure to Silver Nanoparticles Reveals Sex Dependent Alterations in Inflammatory Responses and Epithelial Cell Permeability. Int. J. Mol. Sci. 2020, 22, 9. [Google Scholar] [CrossRef]
- Schanen, B.C.; Karakoti, A.S.; Seal, S.; Iii, D.R.D.; Warren, W.L.; Self, W.T. Exposure to Titanium Dioxide Nanomaterials Provokes Inflammation of an in Vitro Human Immune Construct. ACS Nano 2009, 3, 2523–2532. [Google Scholar] [CrossRef] [PubMed] [Green Version]
- Galbiati, V.; Cornaghi, L.; Gianazza, E.; Potenza, M.A.; Donetti, E.; Marinovich, M.; Corsini, E. In vitro assessment of silver nanoparticles immunotoxicity. Food Chem. Toxicol. 2018, 112, 363–374. [Google Scholar] [CrossRef] [PubMed]
- Yao, L.; Tang, Y.; Chen, B.; Hong, W.; Xu, X.; Liu, Y.; Aguilar, Z.P.; Xu, H. Oral exposure of titanium oxide nanoparticles induce ileum physical barrier dysfunction via Th1/Th2 imbalance. Environ. Toxicol. 2020, 35, 982–990. [Google Scholar] [CrossRef] [PubMed]
- Gross, S.; Van Wanrooij, R.L.; Nijeboer, P.; Gelderman, K.A.; Cillessen, S.A.G.M.; Meijer, G.A.; Mulder, C.J.J.; Bouma, G.; Von Blomberg, B.M.E.; Bontkes, H.J. Differential IL-13 Production by Small Intestinal Leukocytes in Active Coeliac Disease versus Refractory Coeliac Disease. Mediat. Inflamm. 2013, 2013, 1–8. [Google Scholar] [CrossRef]
- Abdukhakimova, D.; Dossybayeva, K.; Poddighe, D. Fecal and Duodenal Microbiota in Pediatric Celiac Disease. Front. Pediatr. 2021, 9. [Google Scholar] [CrossRef] [PubMed]
- Valitutti, F.; Cucchiara, S.; Fasano, A. Celiac Disease and the Microbiome. Nutrients 2019, 11, 2403. [Google Scholar] [CrossRef] [Green Version]
- Lomer, M.C.E.; Thompson, R.P.H.; Powell, J.J. Fine and ultrafine particles of the diet: Influence on the mucosal immune response and association with Crohn’s disease. Proc. Nutr. Soc. 2002, 61, 123–130. [Google Scholar] [CrossRef] [Green Version]
- Lacerda, S.H.D.P.; Park, J.J.; Meuse, C.; Pristinski, D.; Becker, M.L.; Karim, A.; Douglas, J.F. Interaction of Gold Nanoparticles with Common Human Blood Proteins. ACS Nano 2009, 4, 365–379. [Google Scholar] [CrossRef]
- Frazer, A.; Fletcher, R.; Shaw, B.; Ross, C.; Sammons, H.; Schneider, R. Gluten-Induced Enteropathy The Effect Of Partially Digested Gluten. Lancet 1959, 274, 252–255. [Google Scholar] [CrossRef]
- Mancuso, C.; Barisani, D. Food additives can act as triggering factors in celiac disease: Current knowledge based on a critical review of the literature. World J. Clin. Cases 2019, 7, 917–927. [Google Scholar] [CrossRef]


Publisher’s Note: MDPI stays neutral with regard to jurisdictional claims in published maps and institutional affiliations. |
© 2021 by the authors. Licensee MDPI, Basel, Switzerland. This article is an open access article distributed under the terms and conditions of the Creative Commons Attribution (CC BY) license (https://creativecommons.org/licenses/by/4.0/).
Share and Cite
Mancuso, C.; Re, F.; Rivolta, I.; Elli, L.; Gnodi, E.; Beaulieu, J.-F.; Barisani, D. Dietary Nanoparticles Interact with Gluten Peptides and Alter the Intestinal Homeostasis Increasing the Risk of Celiac Disease. Int. J. Mol. Sci. 2021, 22, 6102. https://0-doi-org.brum.beds.ac.uk/10.3390/ijms22116102
Mancuso C, Re F, Rivolta I, Elli L, Gnodi E, Beaulieu J-F, Barisani D. Dietary Nanoparticles Interact with Gluten Peptides and Alter the Intestinal Homeostasis Increasing the Risk of Celiac Disease. International Journal of Molecular Sciences. 2021; 22(11):6102. https://0-doi-org.brum.beds.ac.uk/10.3390/ijms22116102
Chicago/Turabian StyleMancuso, Clara, Francesca Re, Ilaria Rivolta, Luca Elli, Elisa Gnodi, Jean-François Beaulieu, and Donatella Barisani. 2021. "Dietary Nanoparticles Interact with Gluten Peptides and Alter the Intestinal Homeostasis Increasing the Risk of Celiac Disease" International Journal of Molecular Sciences 22, no. 11: 6102. https://0-doi-org.brum.beds.ac.uk/10.3390/ijms22116102