Article

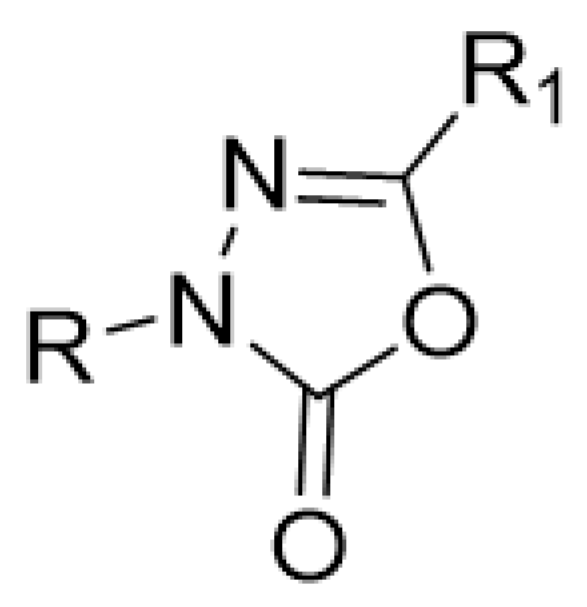
Docking-Based 3D-QSAR Studies for 1,3,4-oxadiazol-2-one Derivatives as FAAH Inhibitors

1
Department of Synthesis and Chemical Technology of Pharmaceutical Substances with Computer Modeling Laboratory, Faculty of Pharmacy, Medical University of Lublin, PL-20059 Lublin, Poland
2
School of Pharmacy, University of Eastern Finland, FI-70211 Kuopio, Finland
3
Division of Pharmaceutical Chemistry and Technology, University of Helsinki, FI-00790 Helsinki, Finland
4
Department of Internal Medicine VIII, University Hospital Tübingen, DE-72076 Tübingen, Germany
*
Authors to whom correspondence should be addressed.
Int. J. Mol. Sci. 2021, 22(11), 6108; https://0-doi-org.brum.beds.ac.uk/10.3390/ijms22116108
Submission received: 26 April 2021 / Revised: 24 May 2021 / Accepted: 3 June 2021 / Published: 6 June 2021
(This article belongs to the Special Issue QSAR and Chemoinformatics in Molecular Modeling and Drug Design 2.0)

Abstract

:
This work aimed to construct 3D-QSAR CoMFA and CoMSIA models for a series of 31 FAAH inhibitors, containing the 1,3,4-oxadiazol-2-one moiety. The obtained models were characterized by good statistical parameters: CoMFA Q2 = 0.61, R2 = 0.98; CoMSIA Q2 = 0.64, R2 = 0.93. The CoMFA model field contributions were 54.1% and 45.9% for steric and electrostatic fields, respectively. In the CoMSIA model, electrostatic, steric, hydrogen bond donor, and hydrogen acceptor properties were equal to 34.6%, 23.9%, 23.4%, and 18.0%, respectively. These models were validated by applying the leave-one-out technique, the seven-element test set (CoMFA r2test-set = 0.91; CoMSIA r2test-set = 0.91), a progressive scrambling test, and external validation criteria developed by Golbraikh and Tropsha (CoMFA r20 = 0.98, k = 0.95; CoMSIA r20 = 0.98, k = 0.89). As the statistical significance of the obtained model was confirmed, the results of the CoMFA and CoMSIA field calculation were mapped onto the enzyme binding site. It gave us the opportunity to discuss the structure–activity relationship based on the ligand–enzyme interactions. In particular, examination of the electrostatic properties of the established CoMFA model revealed fields that correspond to the regions where electropositive substituents are not desired, e.g., in the neighborhood of the 1,3,4-oxadiazol-2-one moiety. This highlights the importance of heterocycle, a highly electronegative moiety in this area of each ligand. Examination of hydrogen bond donor and acceptor properties contour maps revealed several spots where the implementation of another hydrogen-bond-donating moiety will positively impact molecules’ binding affinity, e.g., in the neighborhood of the 1,3,4-oxadiazol-2-one ring. On the other hand, there is a large isopleth that refers to the favorable H-bond properties close to the terminal phenoxy group of a ligand, which means that, generally speaking, H-bond acceptors are desired in this area.

Graphical Abstract

1. Introduction

The fatty acid amide hydrolase enzyme (FAAH) belongs to the serine hydrolase superfamily. It is involved in the degradation of biologically active lipids—endocannabinoids, e.g., anandamide and 2-arachidonoylglycerol—or related-amidated signaling lipids. FAAH activity is considered to play an essential role in the development of multiple pathological conditions [1]. Enzyme inhibitors may exhibit analgesic, anti-inflammatory, anxiolytic, and antidepressant activity. Importantly, blockade of FAAH does not cause undesirable side effects of direct cannabinoid agonists [2]. Due to that fact, its blockade became an emerging strategy in the treatment of several central nervous system (CNS) and peripheral diseases [1,2,3,4]. The development of novel effective FAAH inhibitors became a key focus in drug design [4,5]. Unfortunately, a ligand that recently got into phase 1 of clinical trials resulted in the death of one healthy volunteer and led to some mild-to-severe neurological symptoms in others [6].
Computation resources are widely used in the examination of various properties of medicinal compounds. Quantitative structure–activity relationship methods require building mathematical or computational models to find a significant correlation between the structure and the biological activity of certain groups of substances [7]. These approaches quantitatively correlate the relationships between the chemical structure alterations and respective changes in bioactivity. Their usage enables us to optimize properties of currently used chemicals and predict various parameters that refer to the biological activity of untested and sometimes unavailable compounds [7,8].
The CoMFA (Comparative Molecular Field Analysis) method is considered an advantageous 3D-QSAR approach that has been successfully implemented in many medicinal chemistry studies. This technique stands out from classical QSAR strategies primarily due to its numerous advantages. Significant advantages of this technique include direct applicability in the examination of any structure-dependent biological property. It can be used with almost any set of compounds that can be appropriately aligned and have an activity range spanning over at least three orders of magnitude. Moreover, each CoMFA parameter covers the interaction energy of the whole molecule [7]. In general, it involves statistical methods to correlate both the electrostatic and steric properties of examined molecules with their pharmacological activity. The results of this calculation can be viewed as a 3D-contour map, which presents forces that surround a series of studied, properly aligned molecules. To thoroughly investigate the structure–activity relationship among a set of given compounds, it is also suggested to use the Comparative Molecular Similarity Indices Analysis (CoMSIA). The CoMSIA method, like CoMFA, is based on the structural alignment of compounds but uses atom-centered Gaussian-based fields to describe compounds. In addition, CoMSIA utilizes three additional descriptors (hydrophobic, H-bond donor, H-bond acceptor) [8].
Unfortunately, there is minimal information about the structure–activity relationship studies performed on a series of different types of fatty acid amide hydrolase inhibitors [9]. Käsnänen et al. synthesized a series of meta-substituted phenolic N-alkyl/aryl carbamates. They later submitted these compounds into the 3D-QSAR analysis, which revealed some interesting structure–activity correlations, e.g., presence of a meta-substituted phenyl ring positively influenced the biological activity of these compounds [10]. Zhao et al. constructed a pharmacophore model for FAAH antagonists based on the set of 21 typical compounds available in the literature. It contained four essential features—two H-bond acceptor units, a hydrophobic part, and one aromatic ring unit. This model was successfully applied to the prediction of the activity of 55 compounds [11]. Later, Han et al. decided to evaluate a series of 26 novel oleoylethanolamide derivatives using the CoMFA method [12]. That provided information about the desirable and unfavorable modifications which can be applied to enhance or decrease the biological activity of these molecules, e.g., a long aliphatic carbon chain enables the molecule to reach a green region of desired steric interactions and increases its potency. The most recent paper published by Lorca et al. described a 3D-QSAR study performed on a series of 90 reported FAAH inhibitors that shared a common structural pattern—pyrimidinyl-piperazine-carboxamide moiety. Structure–activity conclusions obtained from the contour map analysis contributed to the designing of new compounds that showed promising predicted activities [13]. However, we would like to emphasize that our study was designed to investigate the structure–activity relationship among a series of FAAH ligands presented in previously published papers [14,15]. Therefore, the study aimed at investigating the contribution of specific chemical moieties in the development of novel biologically active FAAH inhibitors. Thus, the modeling set comprised only compounds containing the 1,3,4-oxadiazol-2-one moiety, synthesized by Patel et al. [14,15]. Among the diverse scaffolds utilized for the development of FAAH inhibitors, 1,3,4-oxadiazol-2-one has gained recent attention in the development of serine hydrolase inhibitors, including FAAH [9,14,16,17,18,19,20,21,22]. The modeling set comprised novel 1,3,4-oxadiazol-2-ones derivatives (Table 1), previously tested for their inhibitory activity against FAAH [14,15,19,20]. Promising results obtained in these experiments became an incentive to examine the structure–activity relationship among these ligands thoroughly. It is noteworthy that, despite the extensive research that has been carried out on the FAAH itself, no single study exists which adequately examines the structure–activity relationship among FAAH ligands that contain the 1,3,4-oxadiazol-2-one moiety (Figure 1) [14,15]. Due to all these reasons, we decided to take advantage of the availability of the FAAH X-ray structure (PDB ID: 3QK5) [23] and correlate structural and biological properties of the FAAH inhibitors using the 3D-QSAR techniques based on the molecular docking alignment. In our opinion, this work constitutes a novel extension to the previously published papers and will contribute to the development of, more potent compounds.

2. Results and Discussion

2.1. The Studied Compounds

The studied compounds (131) possessing inhibitory activity against the FAAH enzyme accompanied by their pIC50 values (experimental, predicted, and residual) are presented in Table 1. Records in that table were ordered and numbered according to the decreasing pIC50 values of the compounds.
The compounds were divided into a training set (24 compounds) and a test set (7 compounds). Moreover, all molecules used in this study showed low residual values, which means the deviation between predicted and experimental values of pIC50 for each molecule was lower than one logarithmic unit.
The CoMFA model contains 12 compounds with negative residual values and 12 molecules with positive deviations, whereas the CoMSIA model is divided into groups of 11 and 13, respectively.

2.2. Molecular Docking and Alignment

Compounds labeled 131 were docked with the Glide module from Schrödinger suite v 2018-2 to the binding site of the fatty acid amide hydrolase. The X-ray structure of FAAH in a complex with a small molecule inhibitor (PDB ID: 3QK5) [23] was used for molecular docking. The RMSD value obtained for the superimposition of the re-docked ligand onto the original RCSB PDB’s complex structure was equal to 0.181 Å.
The molecular alignment is one of the most critical aspects that determines the effectiveness of the 3D-QSAR methods. Appropriate poses selection in the docking-based alignment is a key factor affecting the obtained model’s statistics [24,25]. The most important inhibitory contact comprises a hydrogen bond formed between an inhibitor carbonyl group and Ser 241 from the FAAH enzyme. However, we did not perform a constrained docking in order to preserve the complete flexibility of a ligand and an enzyme, which means we did not consider a covalent bond in this position, as reported earlier [14,15]. Among the obtained poses, those identified with high docking scores and interaction with Ser 241 were taken into the next step of this study. Moreover, a consistent alignment of the 1,3,4-oxadiazol-2-one moiety for all ligands was ensured.

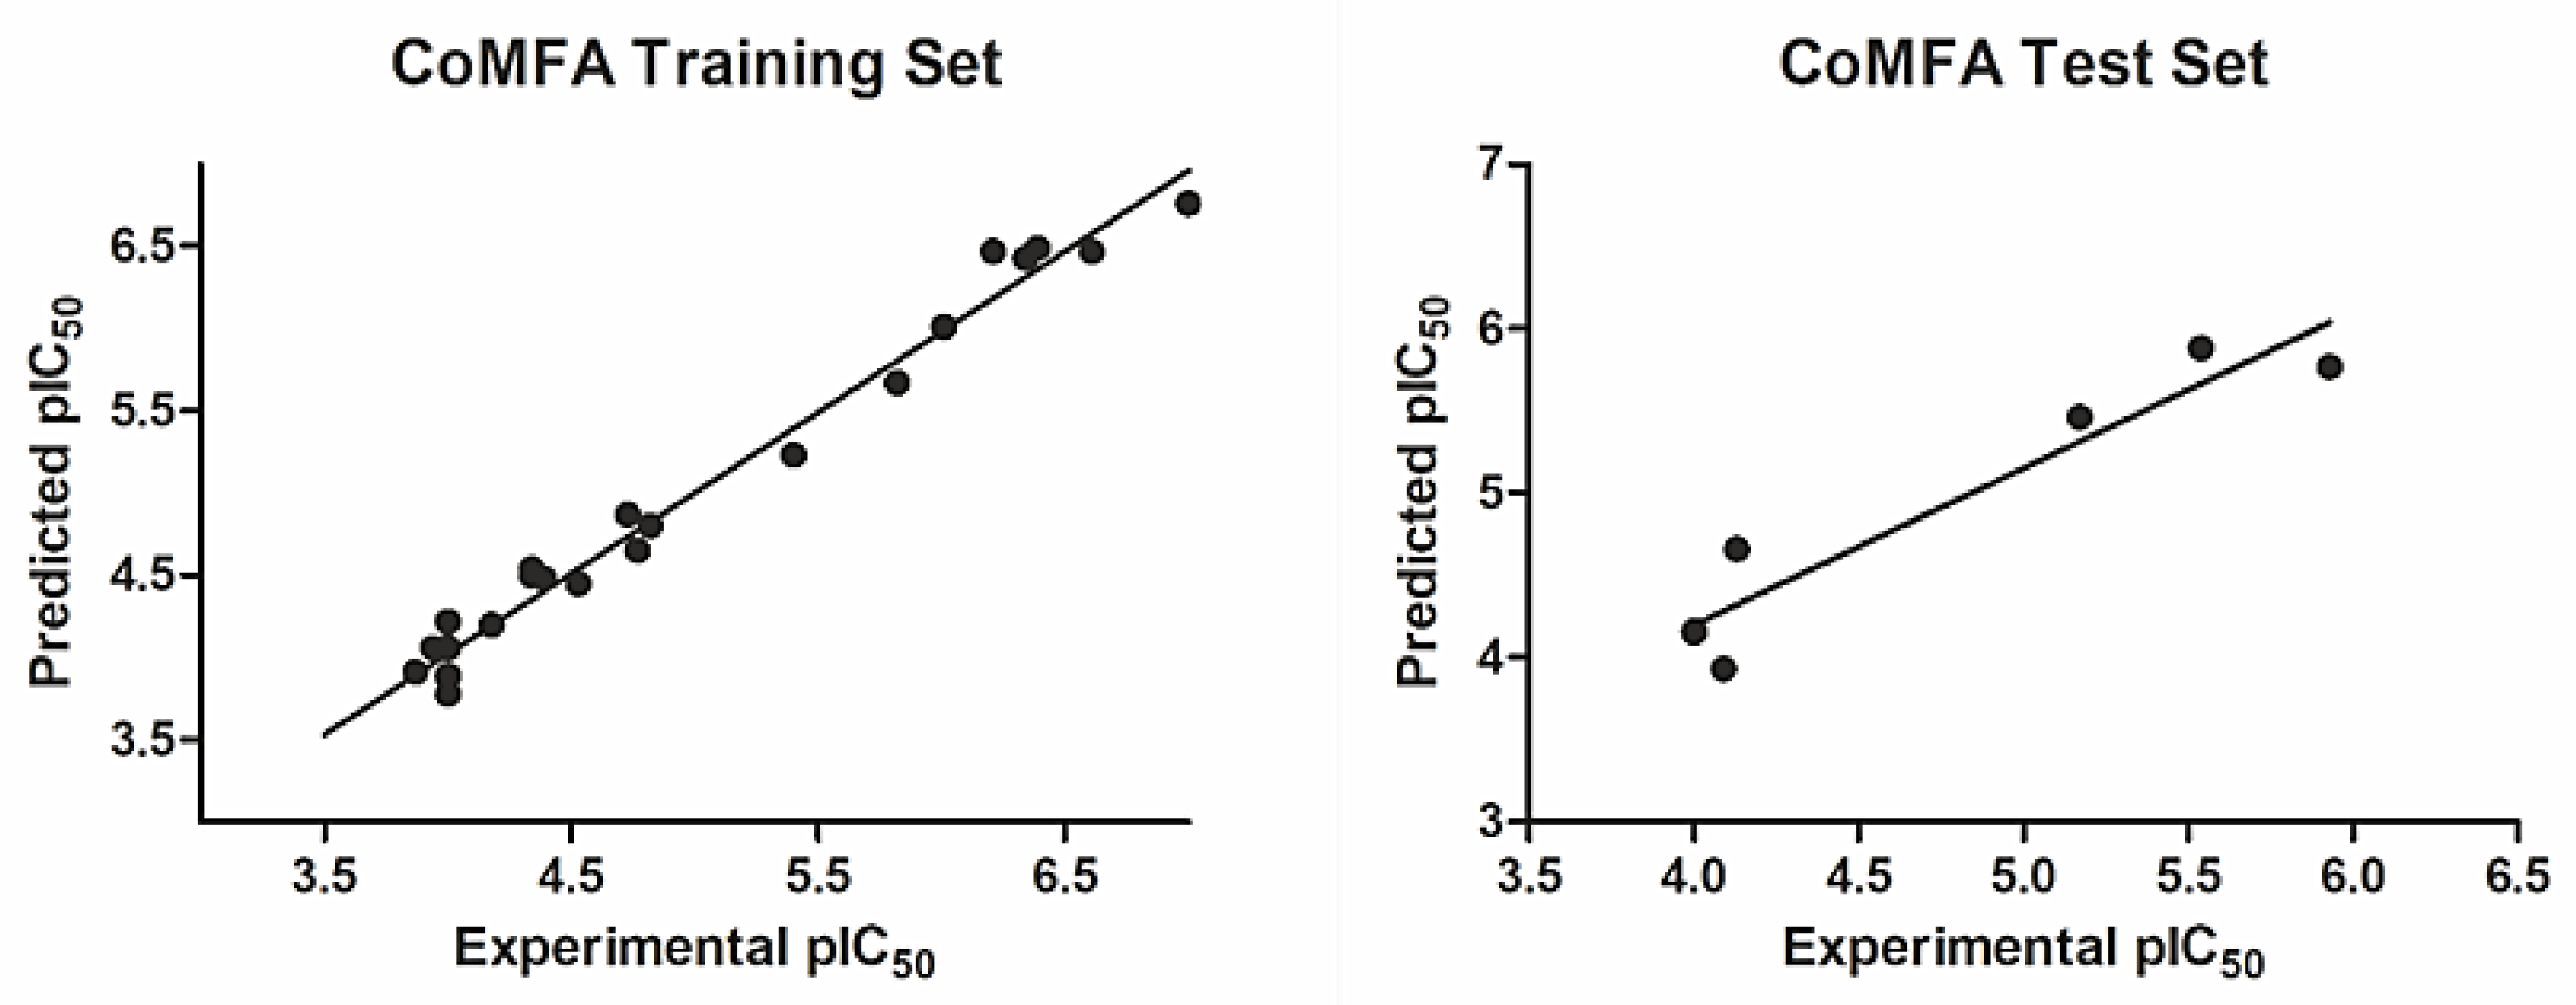
2.3. CoMFA Statistics and Validation

The CoMFA studies were performed using the QSAR module in the Sybyl-X v 2.1 software in the Windows environment. Among the obtained models, only one met all of the requirements. This CoMFA model was characterized by the optimal number of components of 4 and a high value of R2 of 0.98. Moreover, the established model had a cross-validated coefficient of Q2 of 0.61 and an F-value of 234.68. The number of components was designated so that the standard error of prediction was minimal, and cross-validated Q2 values were maximal. The summary of this procedure, along with the CoMSIA modeling results, are gathered in Table 2.
The experimental, calculated, and residual values of pIC50 for the training set and the test set are shown in Table 1; these values do not vary more than the logarithmic unit and thus support the CoMFA model’s statistical validity. Figure 2 shows data correlation between the experimental and the predicted pIC50 values for both the training and the test set of compounds.
As an additional method of validation, a scrambling stability test was performed. This test was carried out to find an ideal number of components and check whether the CoMFA model is sensitive to small perturbations applied to the data. In stable models, the value of dQ2/dR2yy should not exceed 1.2. Moreover, it is considered that an ideal value of this parameter equals 1 [26,27,28]. Obtained results are presented in Table 3.
It is noteworthy that in our model, both parameters (Q2 and DQ2/dR2yy) are within the established ranges, which stand for the high robustness of this CoMFA model.
Furthermore, the CoMFA model was used to predict the pIC50 values for the seven-element test set of compounds. All of the parameters obtained in this procedure are also presented in the test-set section of Table 1. Obtained predictions are quite similar to those experimentally determined. A simple regression-based r2test-set value of 0.91, which was calculated for the test-set molecules, is another significant proof of the obtained model’s statistical importance.
In the end, our model was examined with the use of external validation criteria proposed by Golbraikh and Tropsha [28,29] (Table 2). It fulfills all of those requirements. It confirms that the proposed CoMFA model is statistically significant and robust.

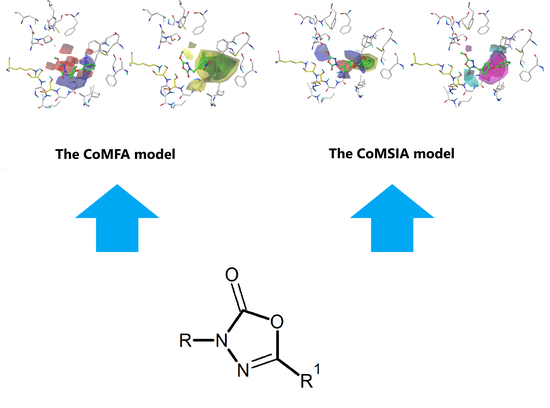
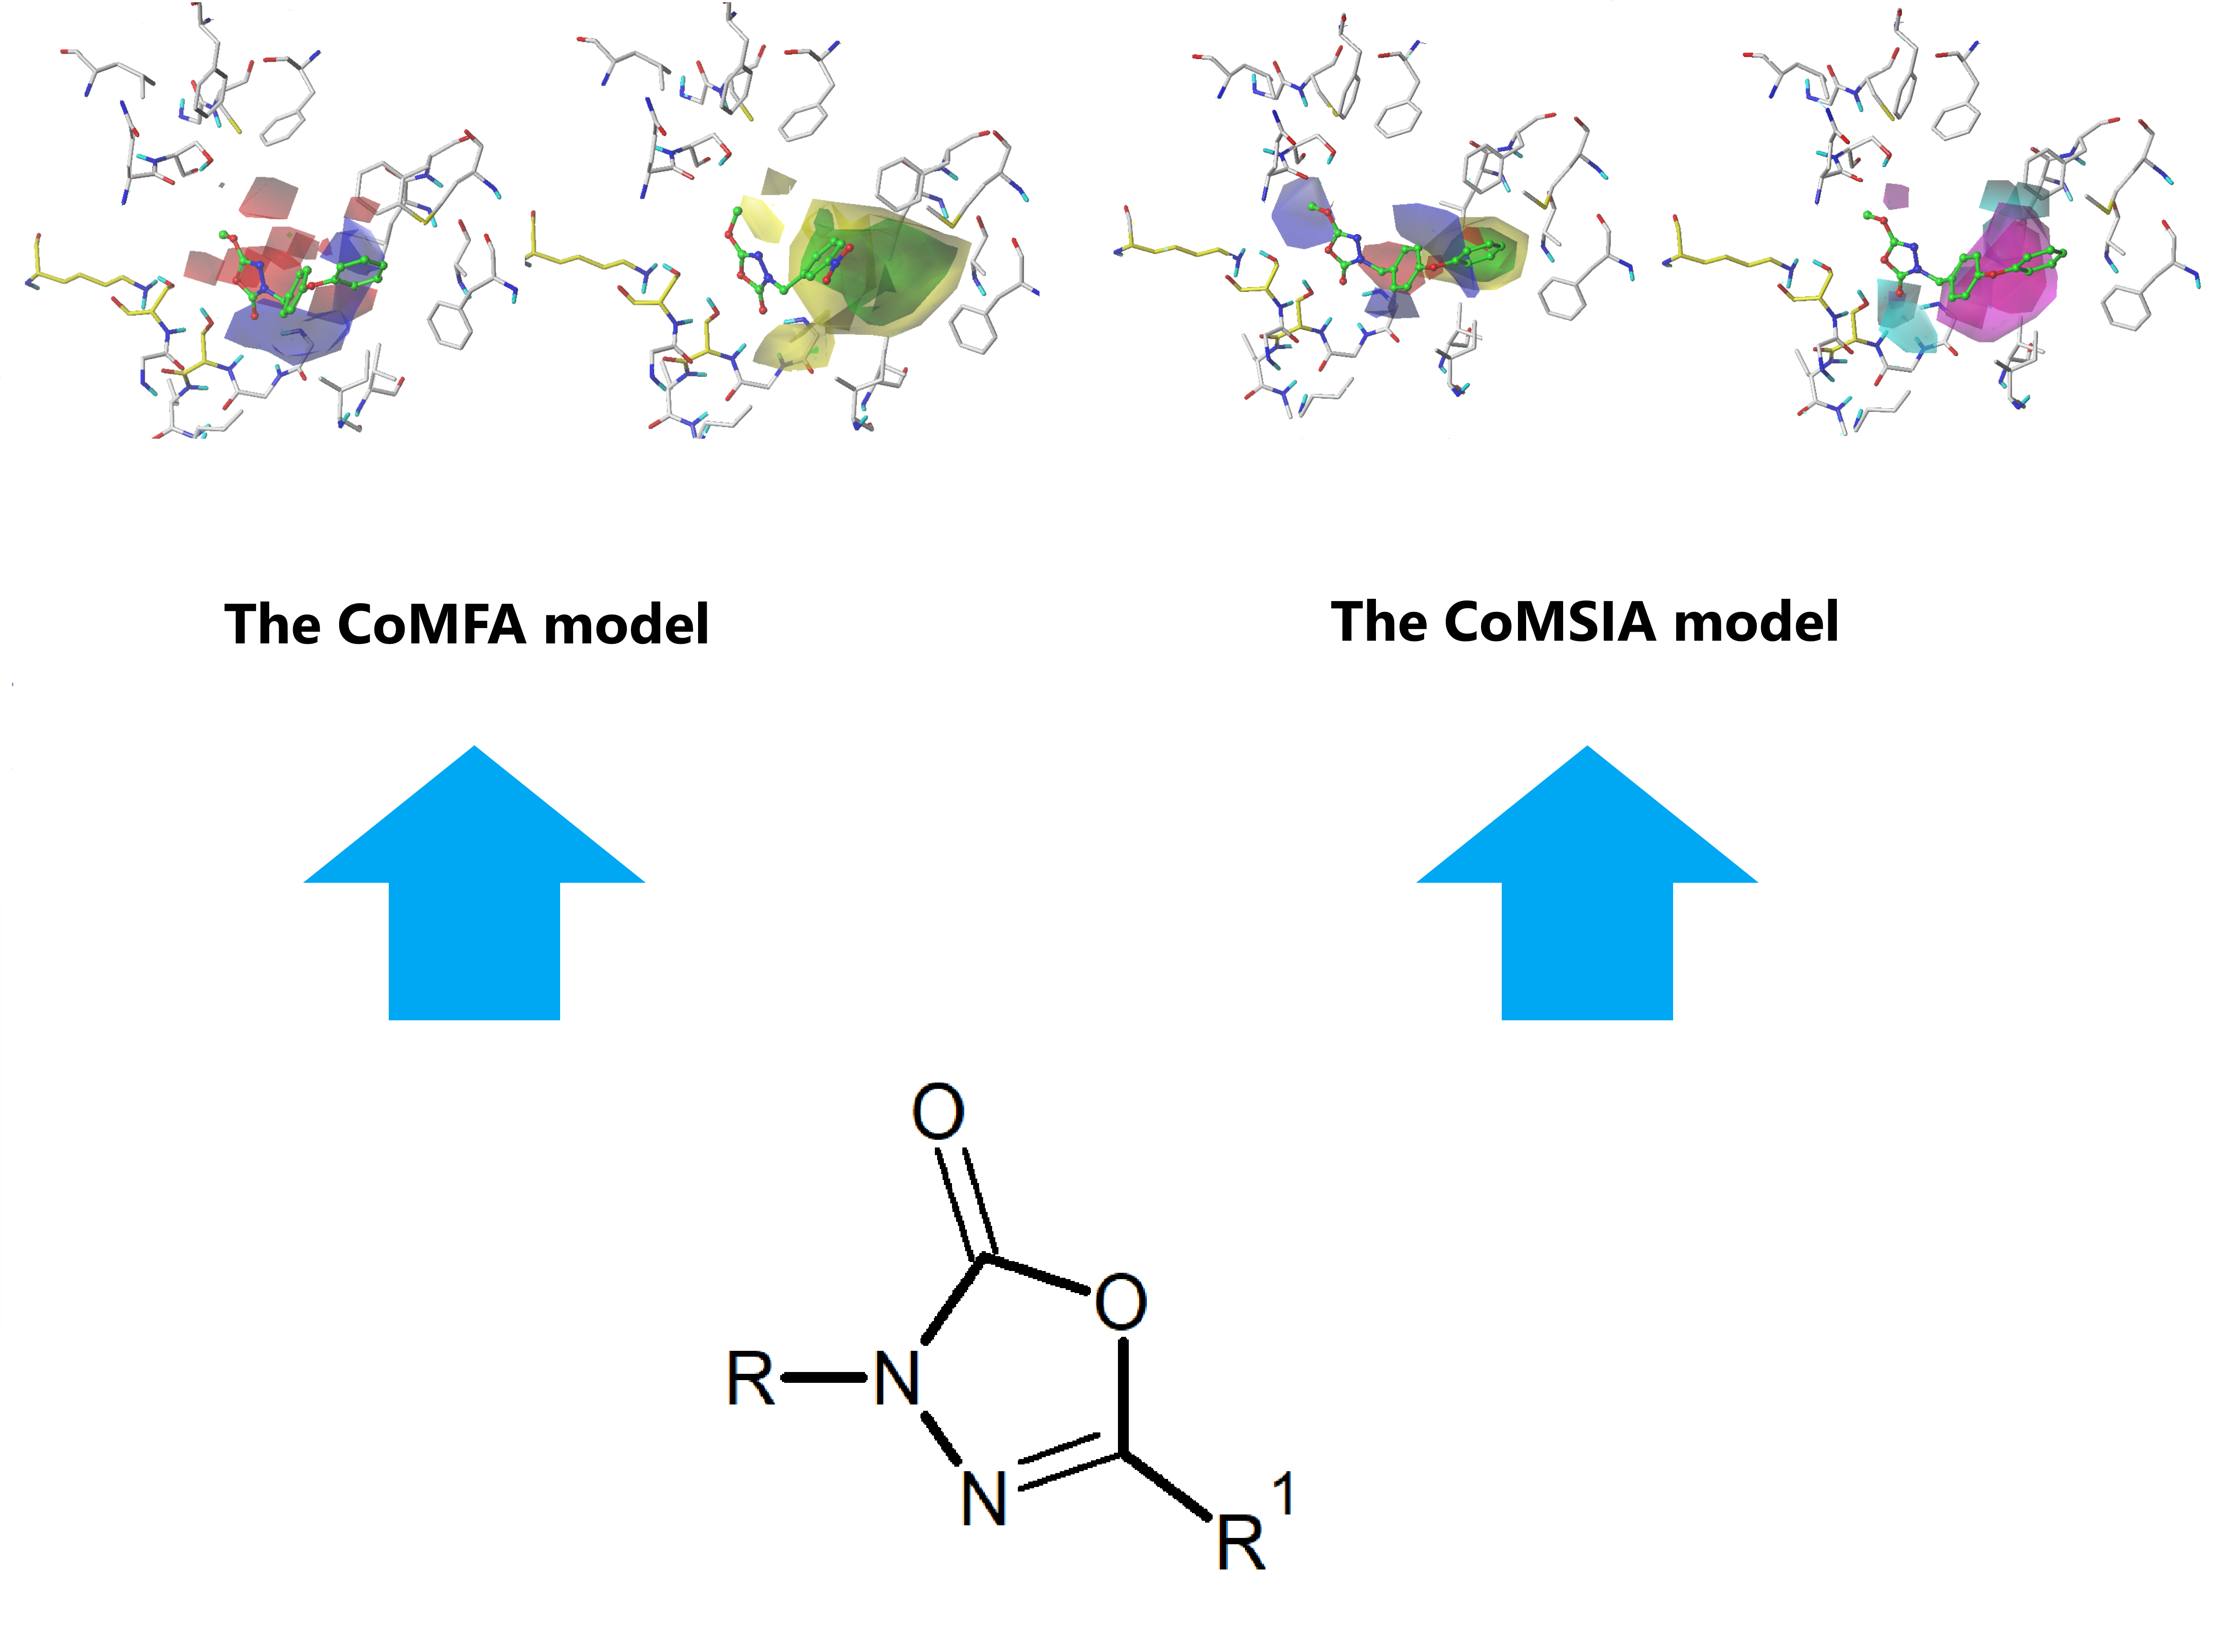
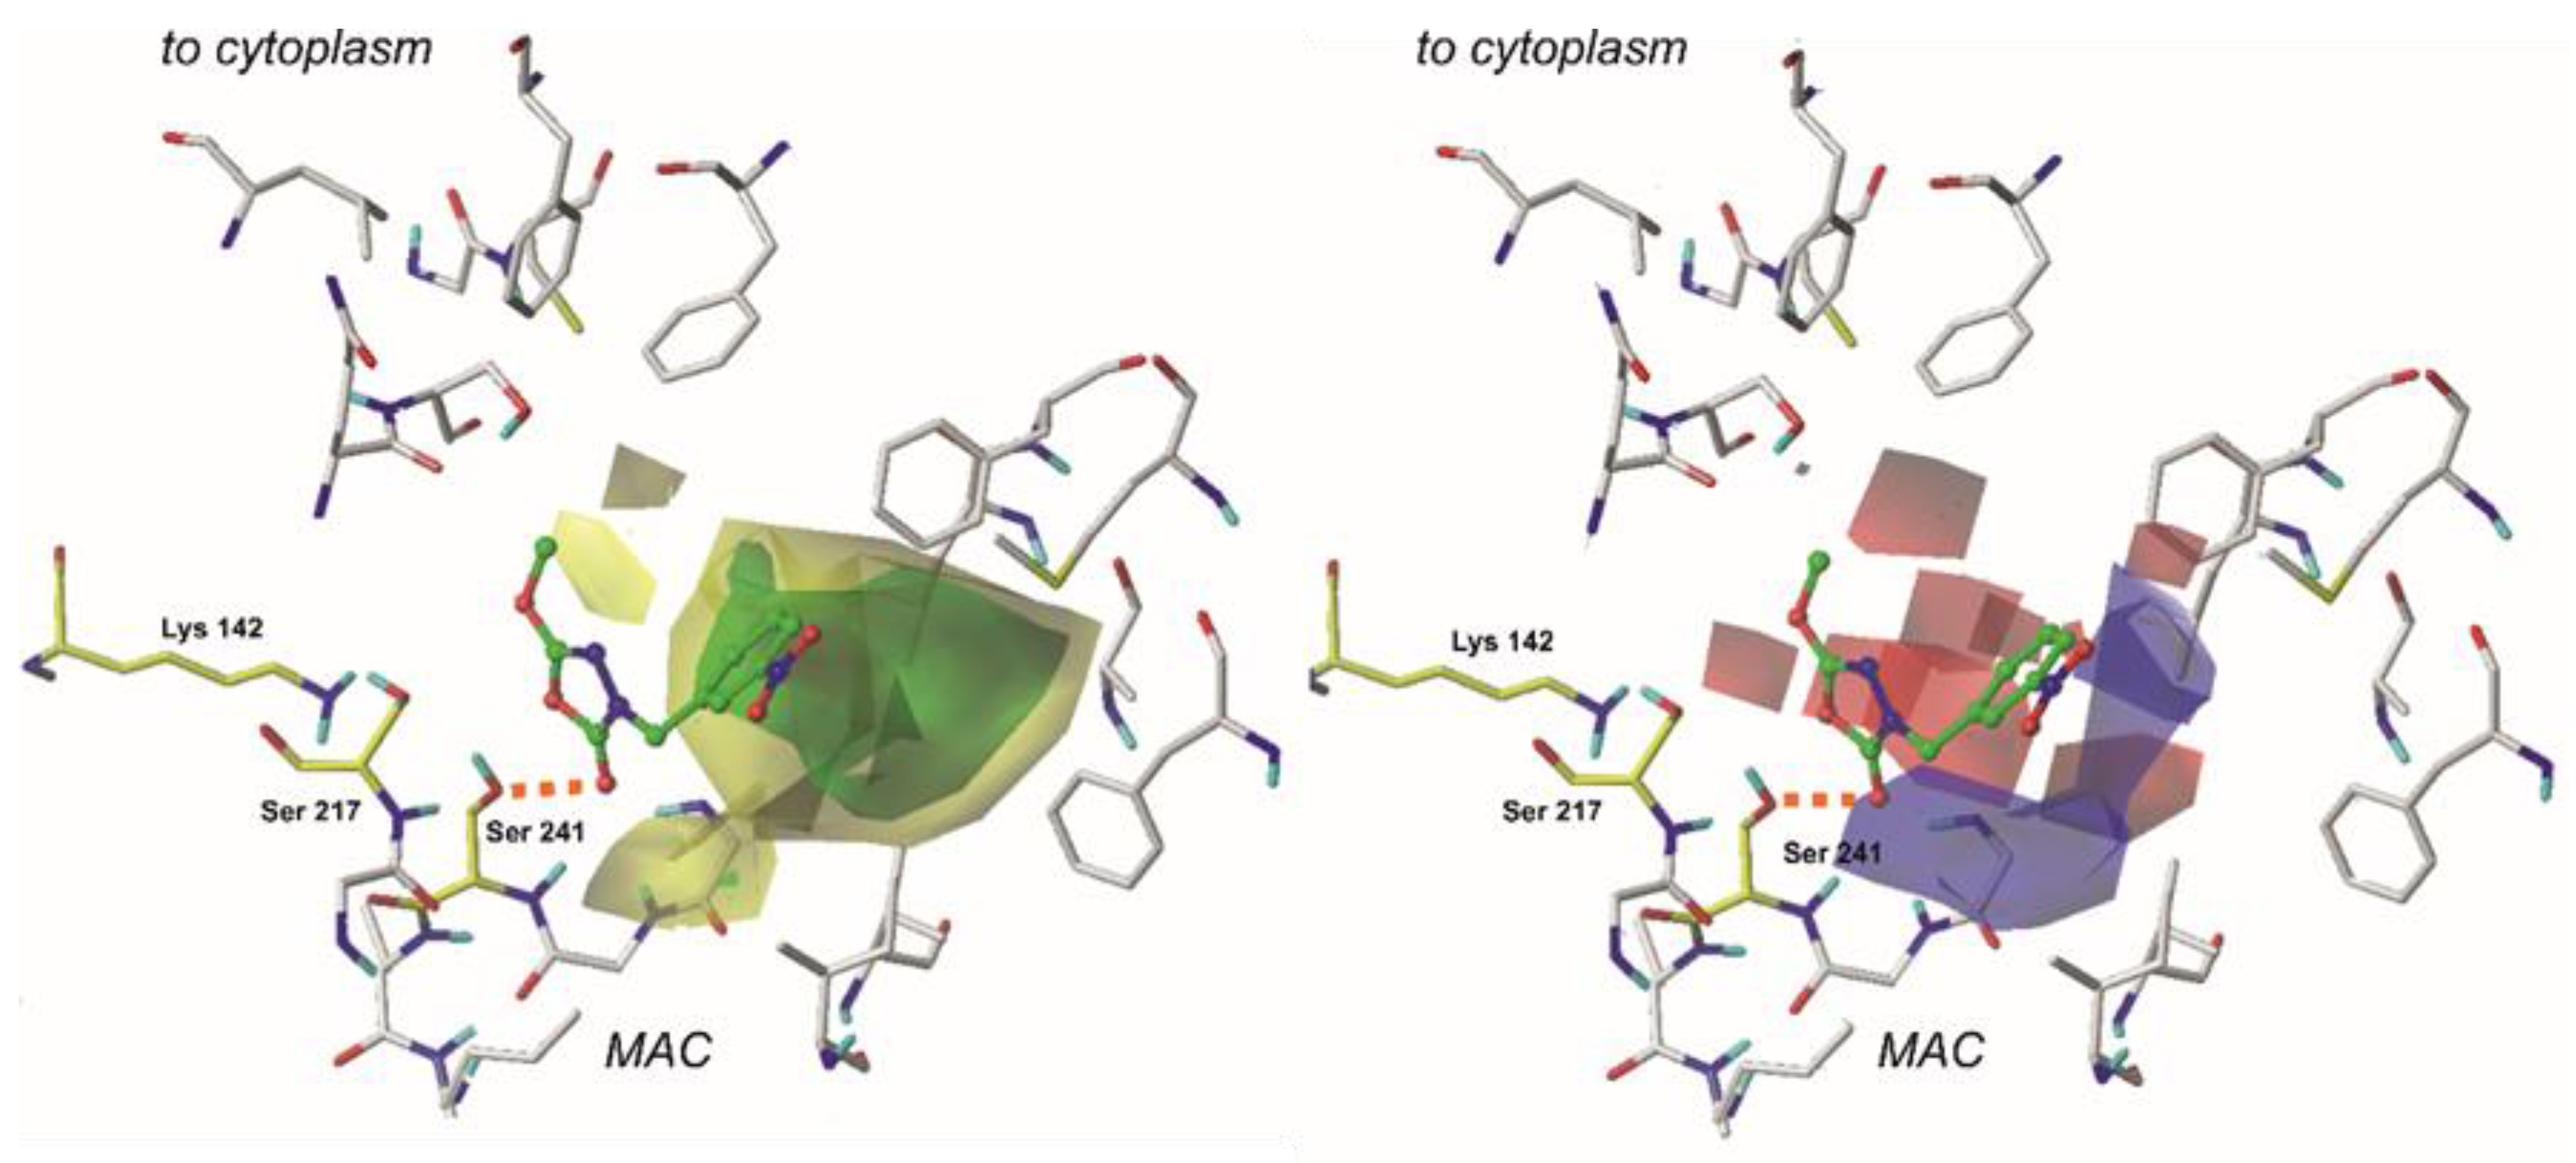
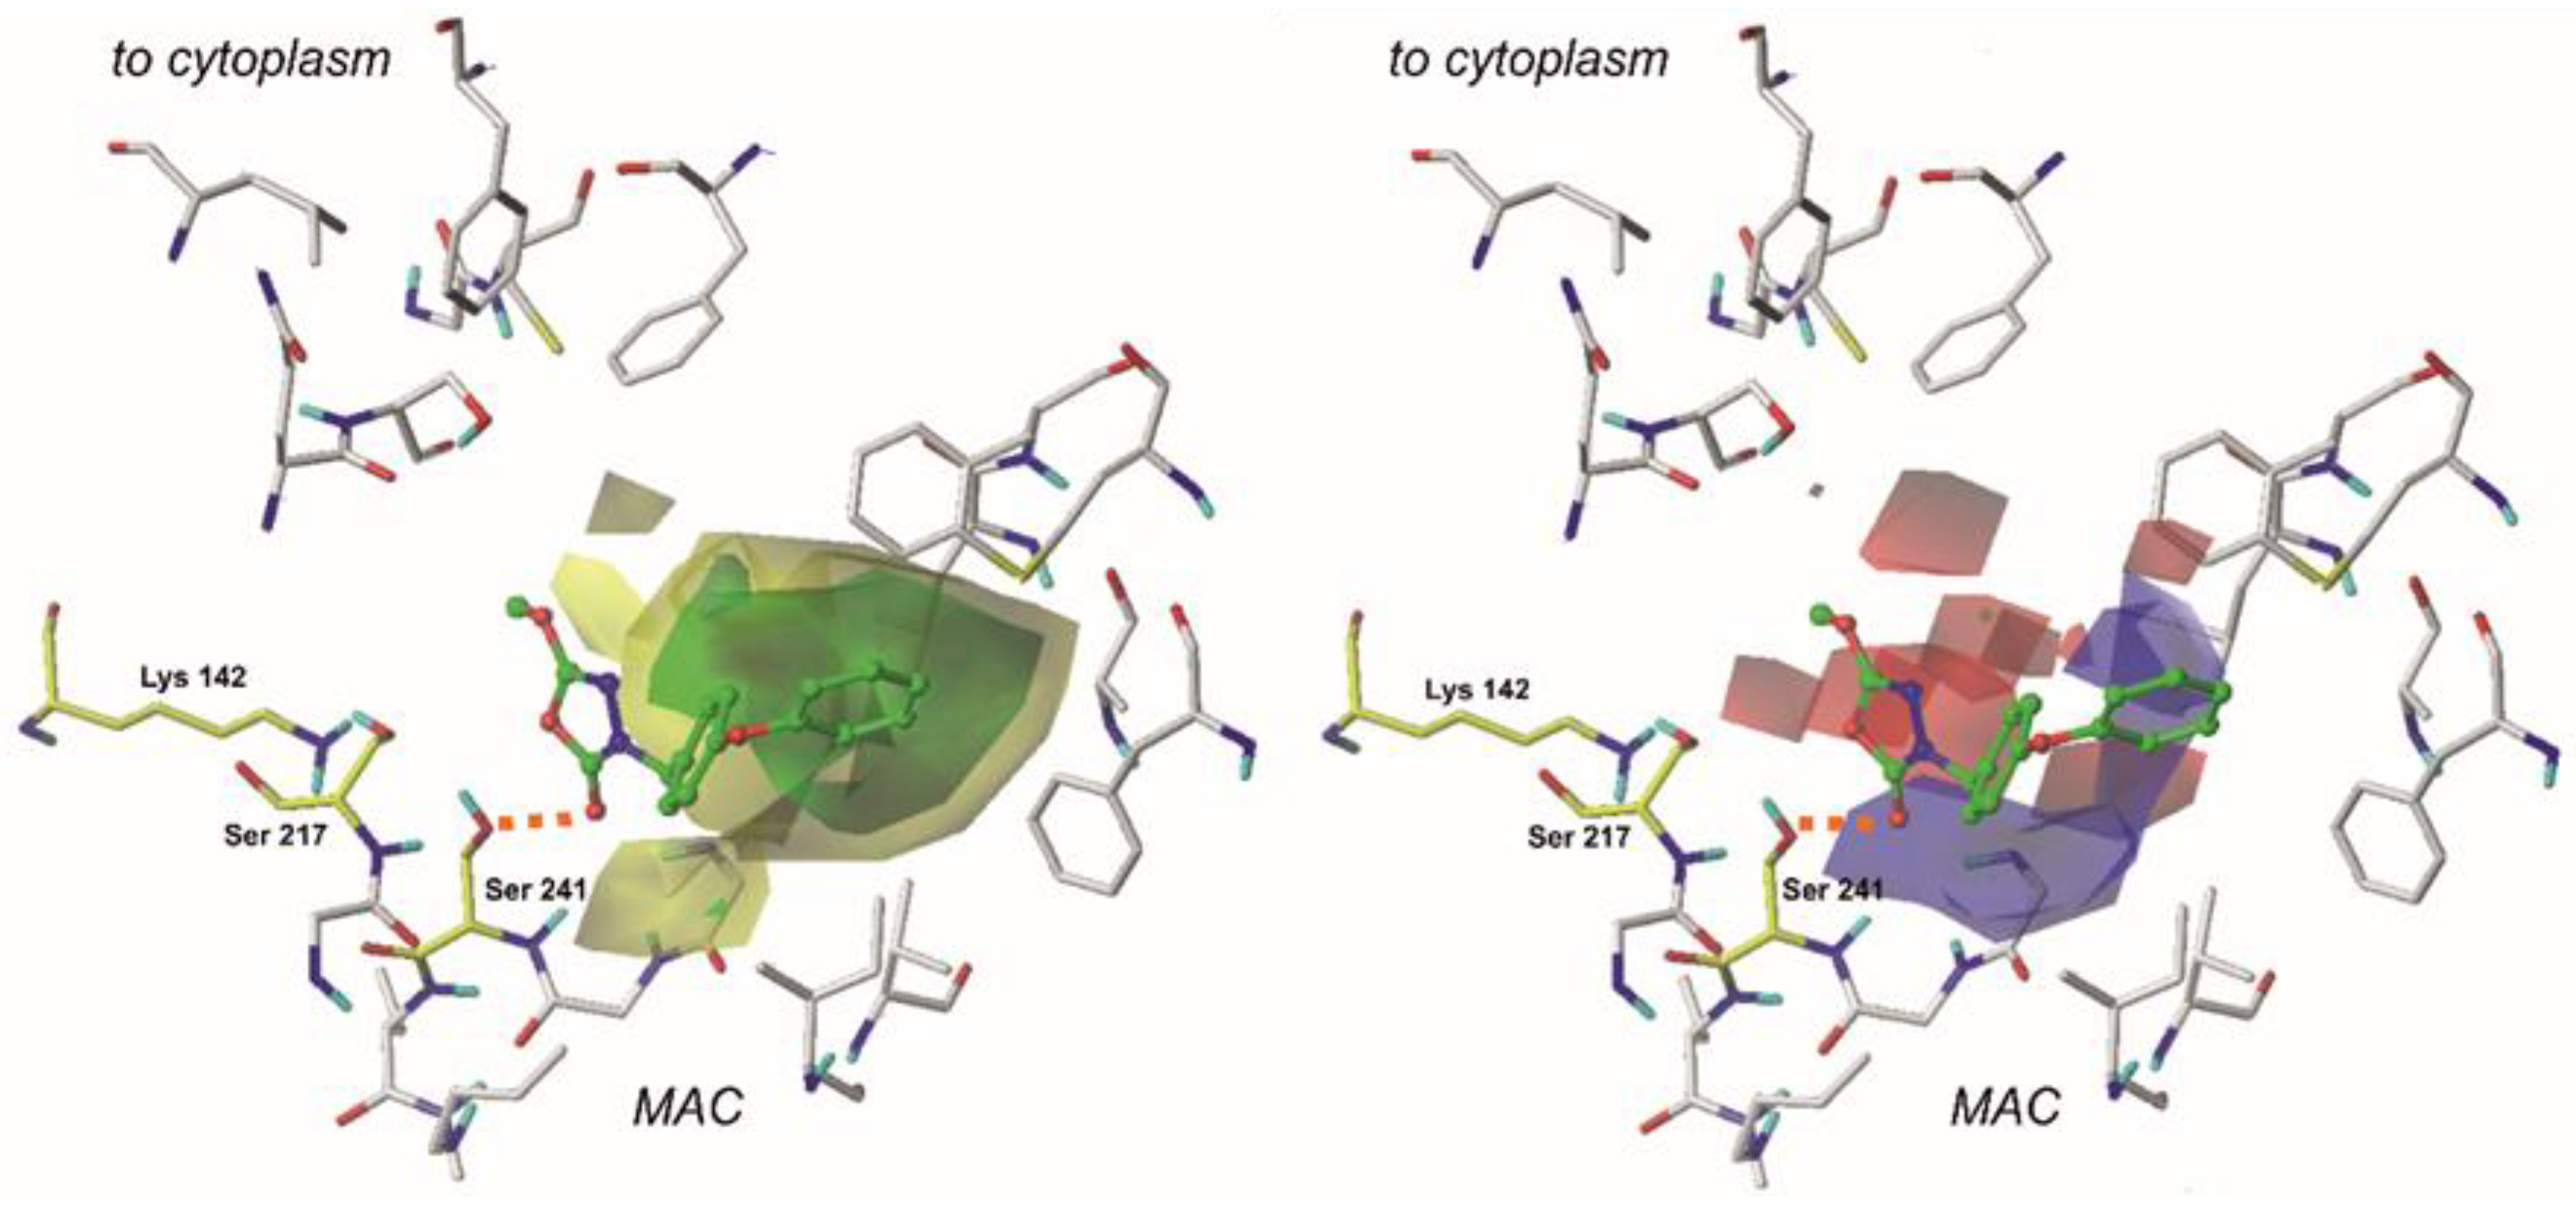
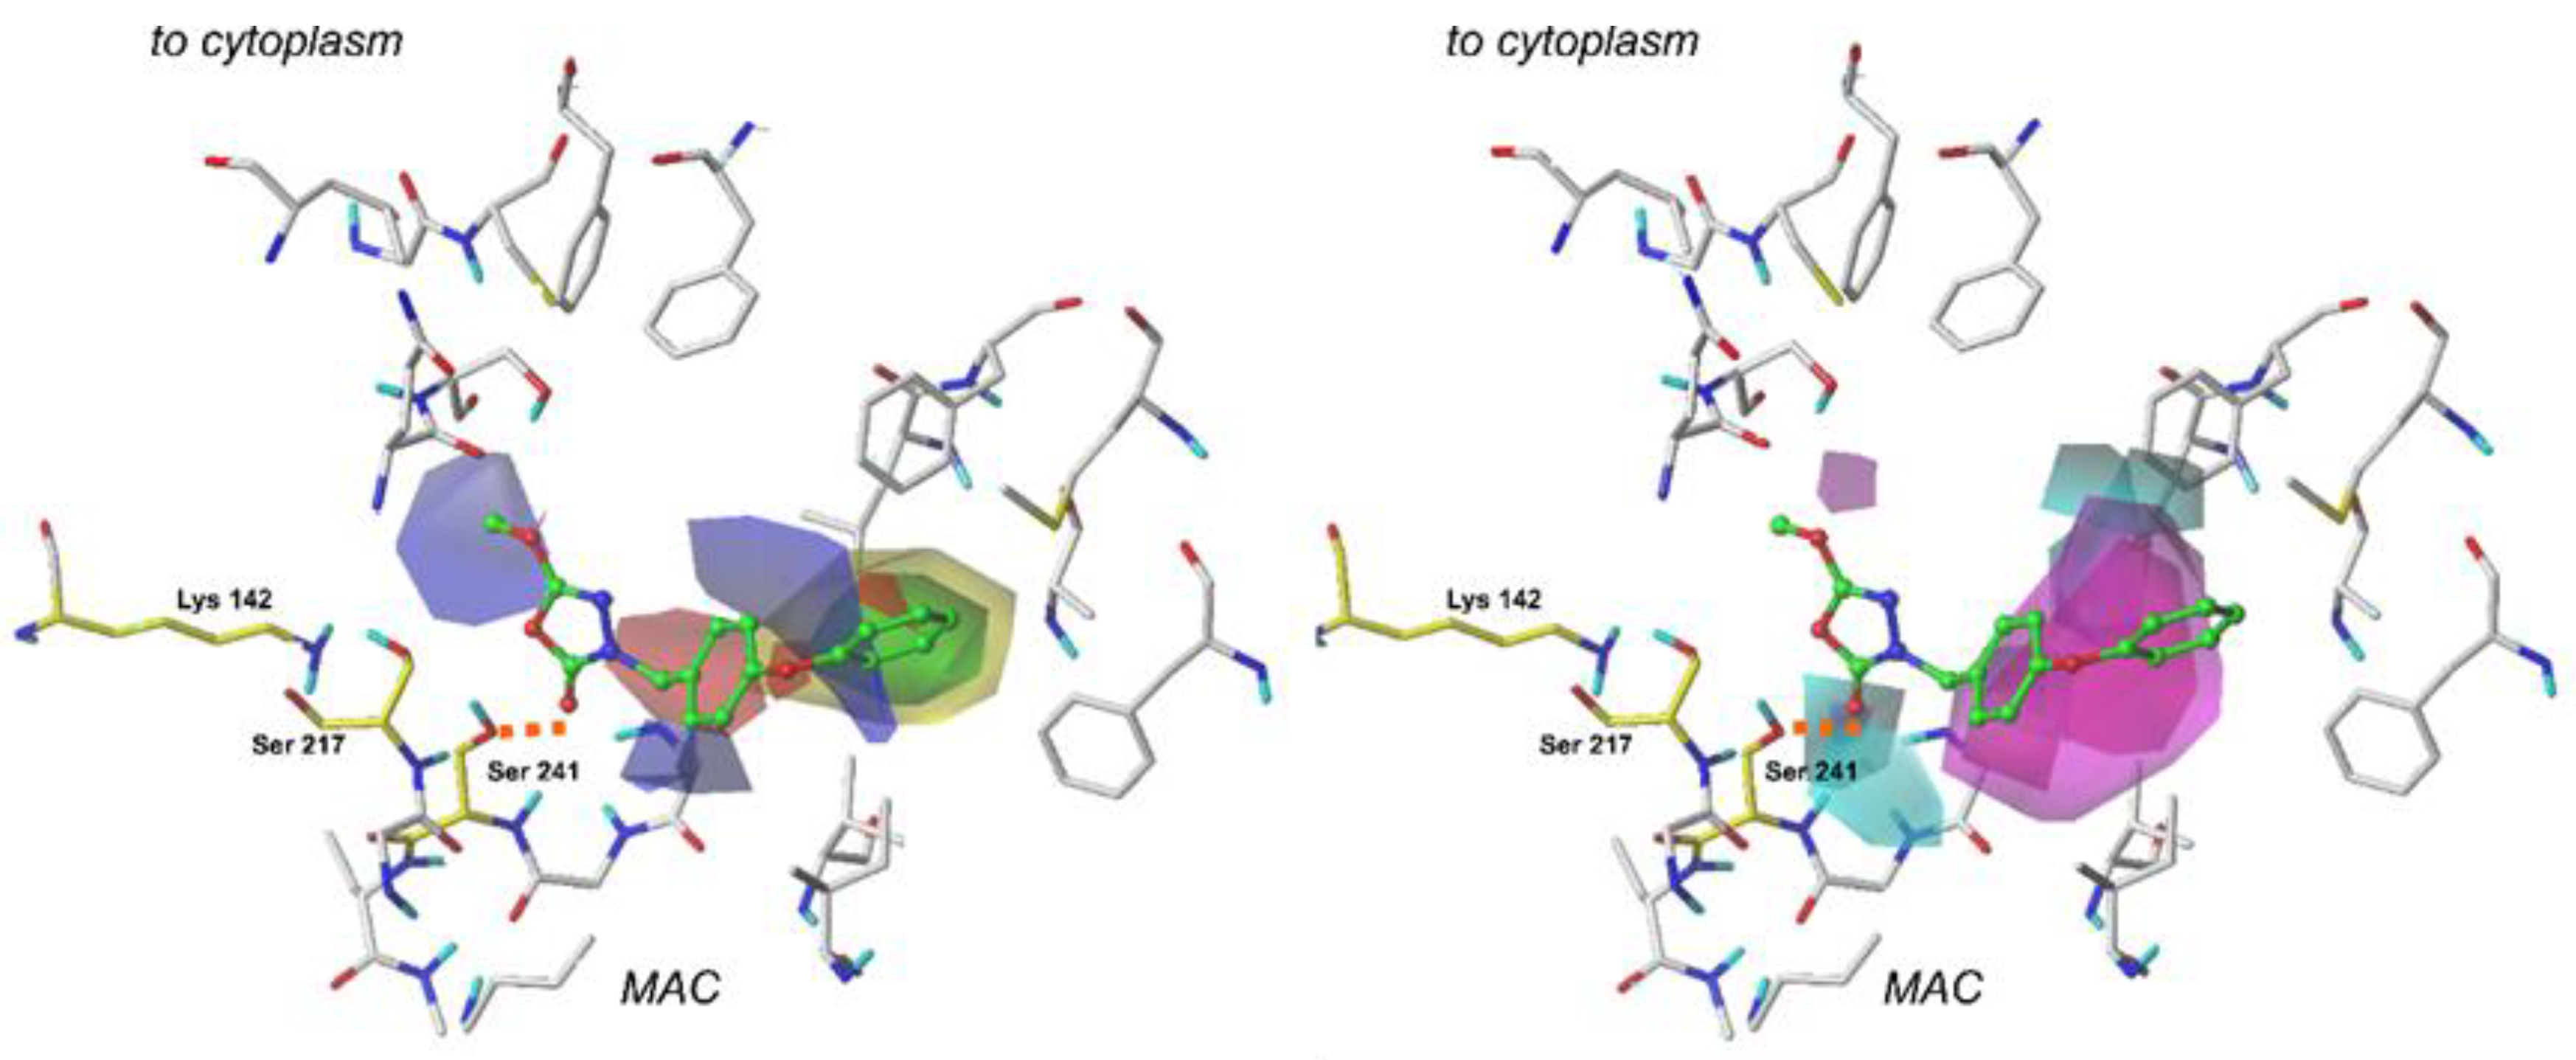
2.4. The CoMFA Contour Map and Its Mapping onto Receptor Structure

Unlike the 2D-QSAR calculations, the CoMFA results can be graphically viewed as a set of colorful plots surrounding the examined compounds. In this technique, there are two types of contributions that can be visualized around the compound. The first one, represented by yellow and green plots, determines regions where the steric interactions occur. In contrast, the second one, which is depicted as red and blue polyhedrons, is related to the electrostatic forces surrounding the examined molecule. Proper examination of these interactions is a valuable source of knowledge, which can provide us with ideas on structure modifications that can be implemented in other drug-design processes.
The constructed CoMFA model was characterized by the field fractions representing steric (54.1%) and electrostatic (45.9%) regions. Figure 3 depicts steric and electrostatic contour maps viewed on the least active (no. 31, pIC50 = 3.87) compound, and Figure 4 visualizes steric and electrostatic field plots mapped on the most active molecule from the training set (no. 1, pIC50 = 7.00) [8,26].
Finally, CoMFA contour maps were generated, and field values were calculated at each point of the three-dimensional grid box. These values contribute a scalar product of the connected QSAR coefficient and the standard-deviation in the associated part of the data plotted as the percentage contributors to QSAR equation [30].
Electrostatic properties are depicted as red and blue regions. Red plots determine regions where moieties with a negative charge are more favorable for enhancing the molecule’s binding affinity. On the other hand, blue fields contribute to the areas where the negative charge is highly unfavorable [7,31].
In the case of each compound from the training set, the examination of electrostatic properties revealed red plots surrounding the 1,3,4-oxadiazol-2-one moiety. This highlights the importance of heterocycle, highly electronegative substituent in this area of each ligand. Moreover, this can explain why compounds 9, 30, and 31 that contain aromatic substituents (e.g., benzene ring) with more homogenous charge distribution attached in the red-plot region are generally characterized by lower biological activity. In the case of compound 1, the blue plots surround the terminal aromatic ring, and it indicates that electropositive constituents are generally more favored in this region. This explains the high biological activity of compounds, e.g., 2 and 10. Moreover, the presence of the -NO2 group in the area encompassed by a blue plot can be considered a possible cause of the low biological activity of compound 31.
Steric properties are visualized as green and yellow plots. The first one represents regions where the presence of bulky substituents is considered to influence the activity of the compound positively. In contrast, the latter stands for the molecule regions, where extensive moieties are related to decreasing binding [31]. Analysis of steric contour maps, viewed on the compounds from the training set, revealed that high-volume moieties, e.g., aromatic rings, are generally more desired on the opposite side to the 1,3,4-oxadiazol-2-one moiety. Thus, providing these regions with an additional 5- or 6- membered ring might positively influence the binding affinity. It is worth noting that molecules containing small-volume substituents attached to the 3rd position of the mentioned earlier heterocycle do not reach the green region of favorable interactions and are characterized by a lower biological activity.
The presence of several smaller yellow contours surrounding the rest of the compound suggests that the compound’s biological activity decreases as the volume of the moiety attached to the, e.g., 1,3,4-oxadiazol-2-one ring rises. Presumably, the presence of these unfavored interactions can explain the low biological activity of compound 12. Moreover, providing the ligand with a six-membered ring or another bulky substituent in this area would be highly unfavorable for the activity of this molecule.

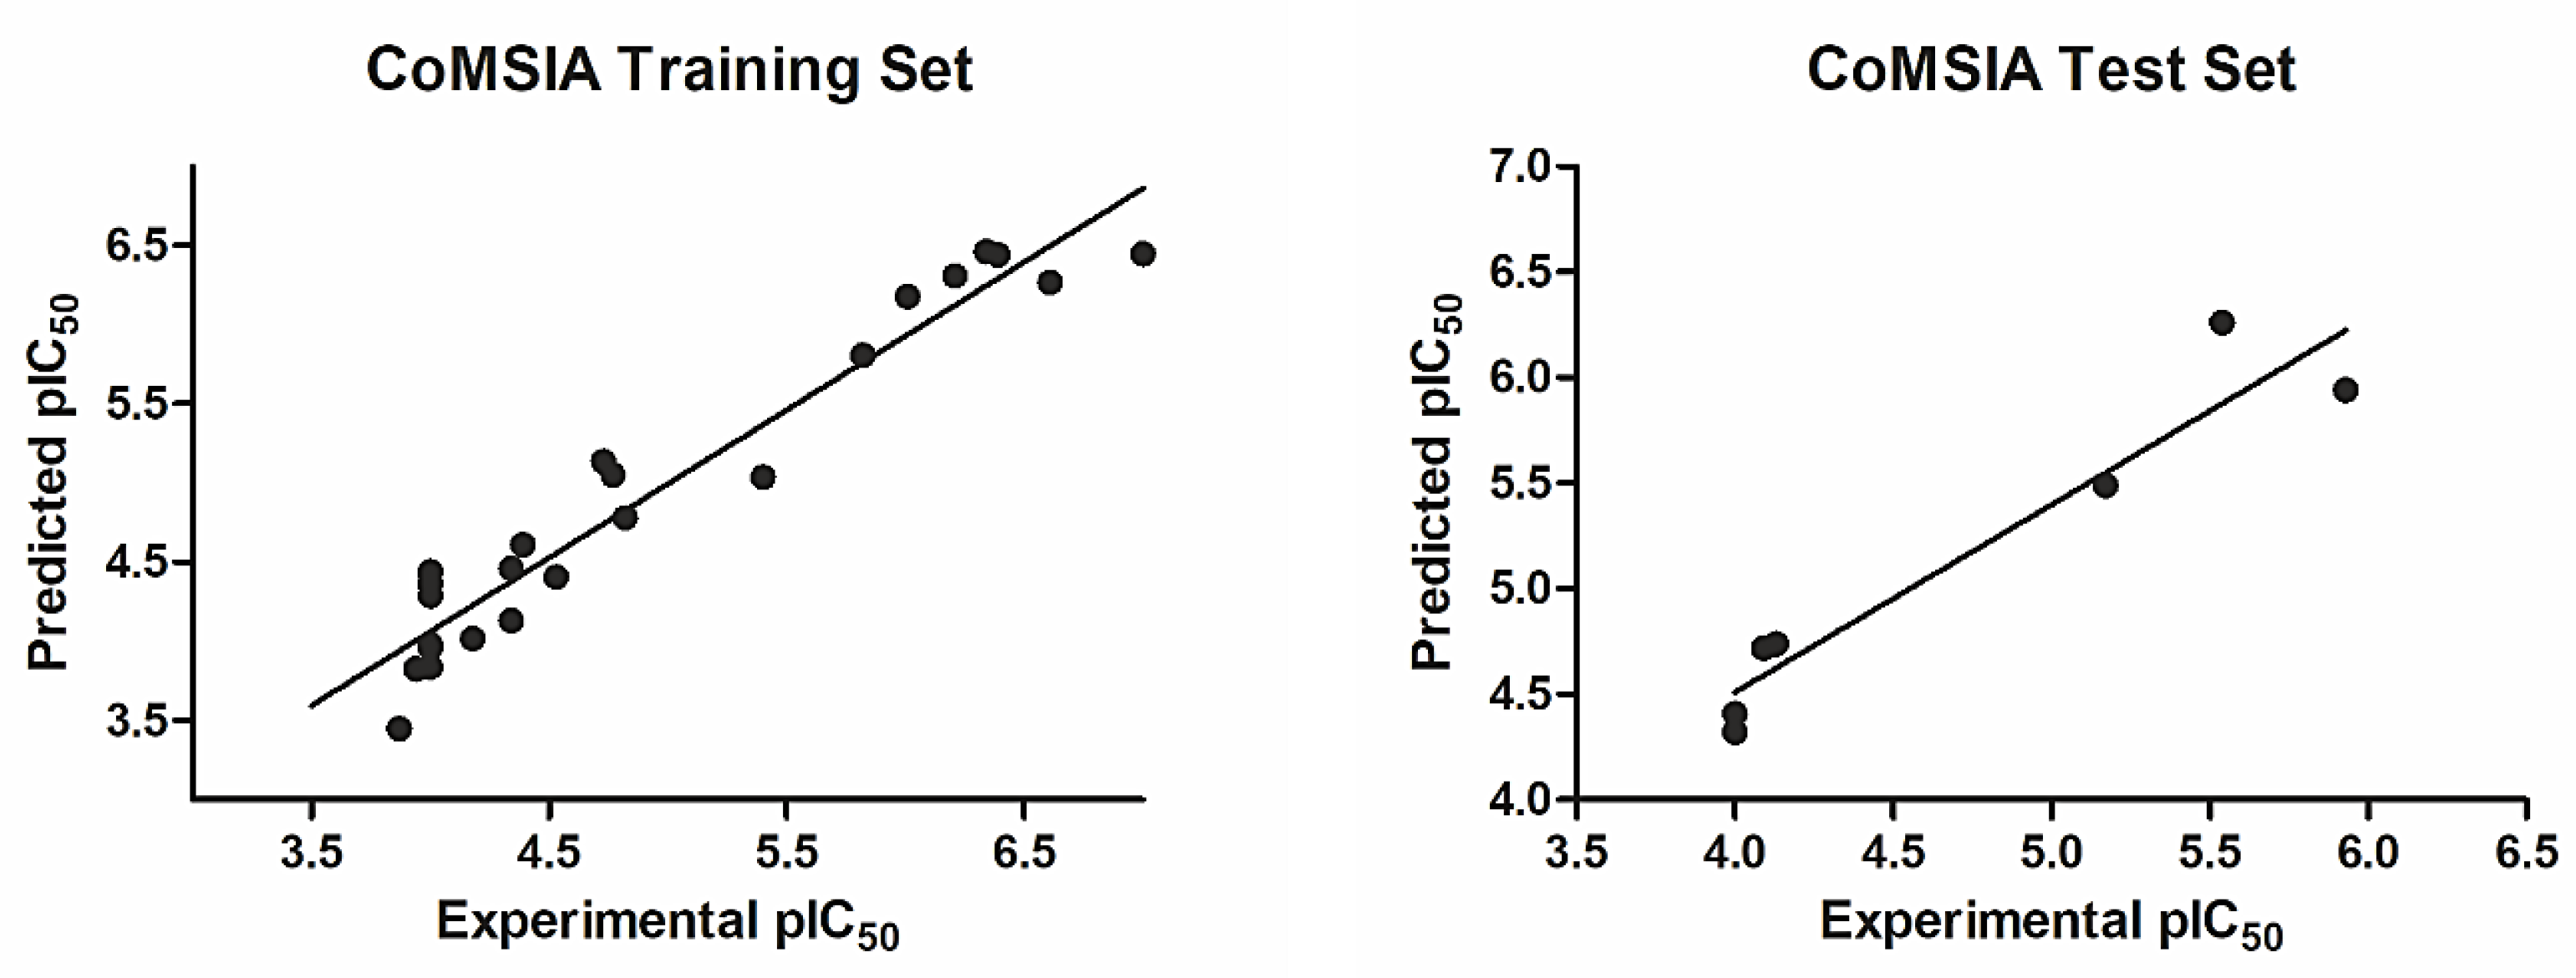
2.5. CoMSIA Model Statistics and Validation

The same 24-element training set was used to develop a Comparative Molecular Similarity Indices Analysis (CoMSIA) model. All of the obtained parameters are presented in Table 2, along with the CoMFA model statistics. In general, this model was characterized by high values of R2 of 0.93 and Q2 of 0.64. The optimal number of components was equal to 3. This model was also characterized by a low value of the standard error of prediction equal to 0.28. The non-cross validated PLS (partial least square) analysis resulted in an F-value of 92.82.
At first, this model was evaluated with the use of the PLS leave-one-out (LOO) procedure. The Q2 value of 0.64 obtained by this method stands for the high stability of the model. As the next step in validation, our model was used to predict the pIC50 values for compounds in the seven-element test set, and it revealed a high correlation of the data (r2test-set = 0.91). Figure 5 depicts data correlation values for both the training set and the test set.
We used a scrambling stability test to generate additional validation parameters and evaluate the statistical significance of the CoMSIA model. The results obtained from this procedure are presented in Table 4. It is noteworthy that for the optimum number of components of 3, the dQ2/dR2yy value does not exceed 1.2 [26].
Finally, we introduced our model to the external validation criteria proposed by Golbraikh and Tropsha [28,29]. All of the obtained parameters stand within recommended values (Table 2). Thus, all presented data stand for good stability and high statistical significance of the CoMSIA model.

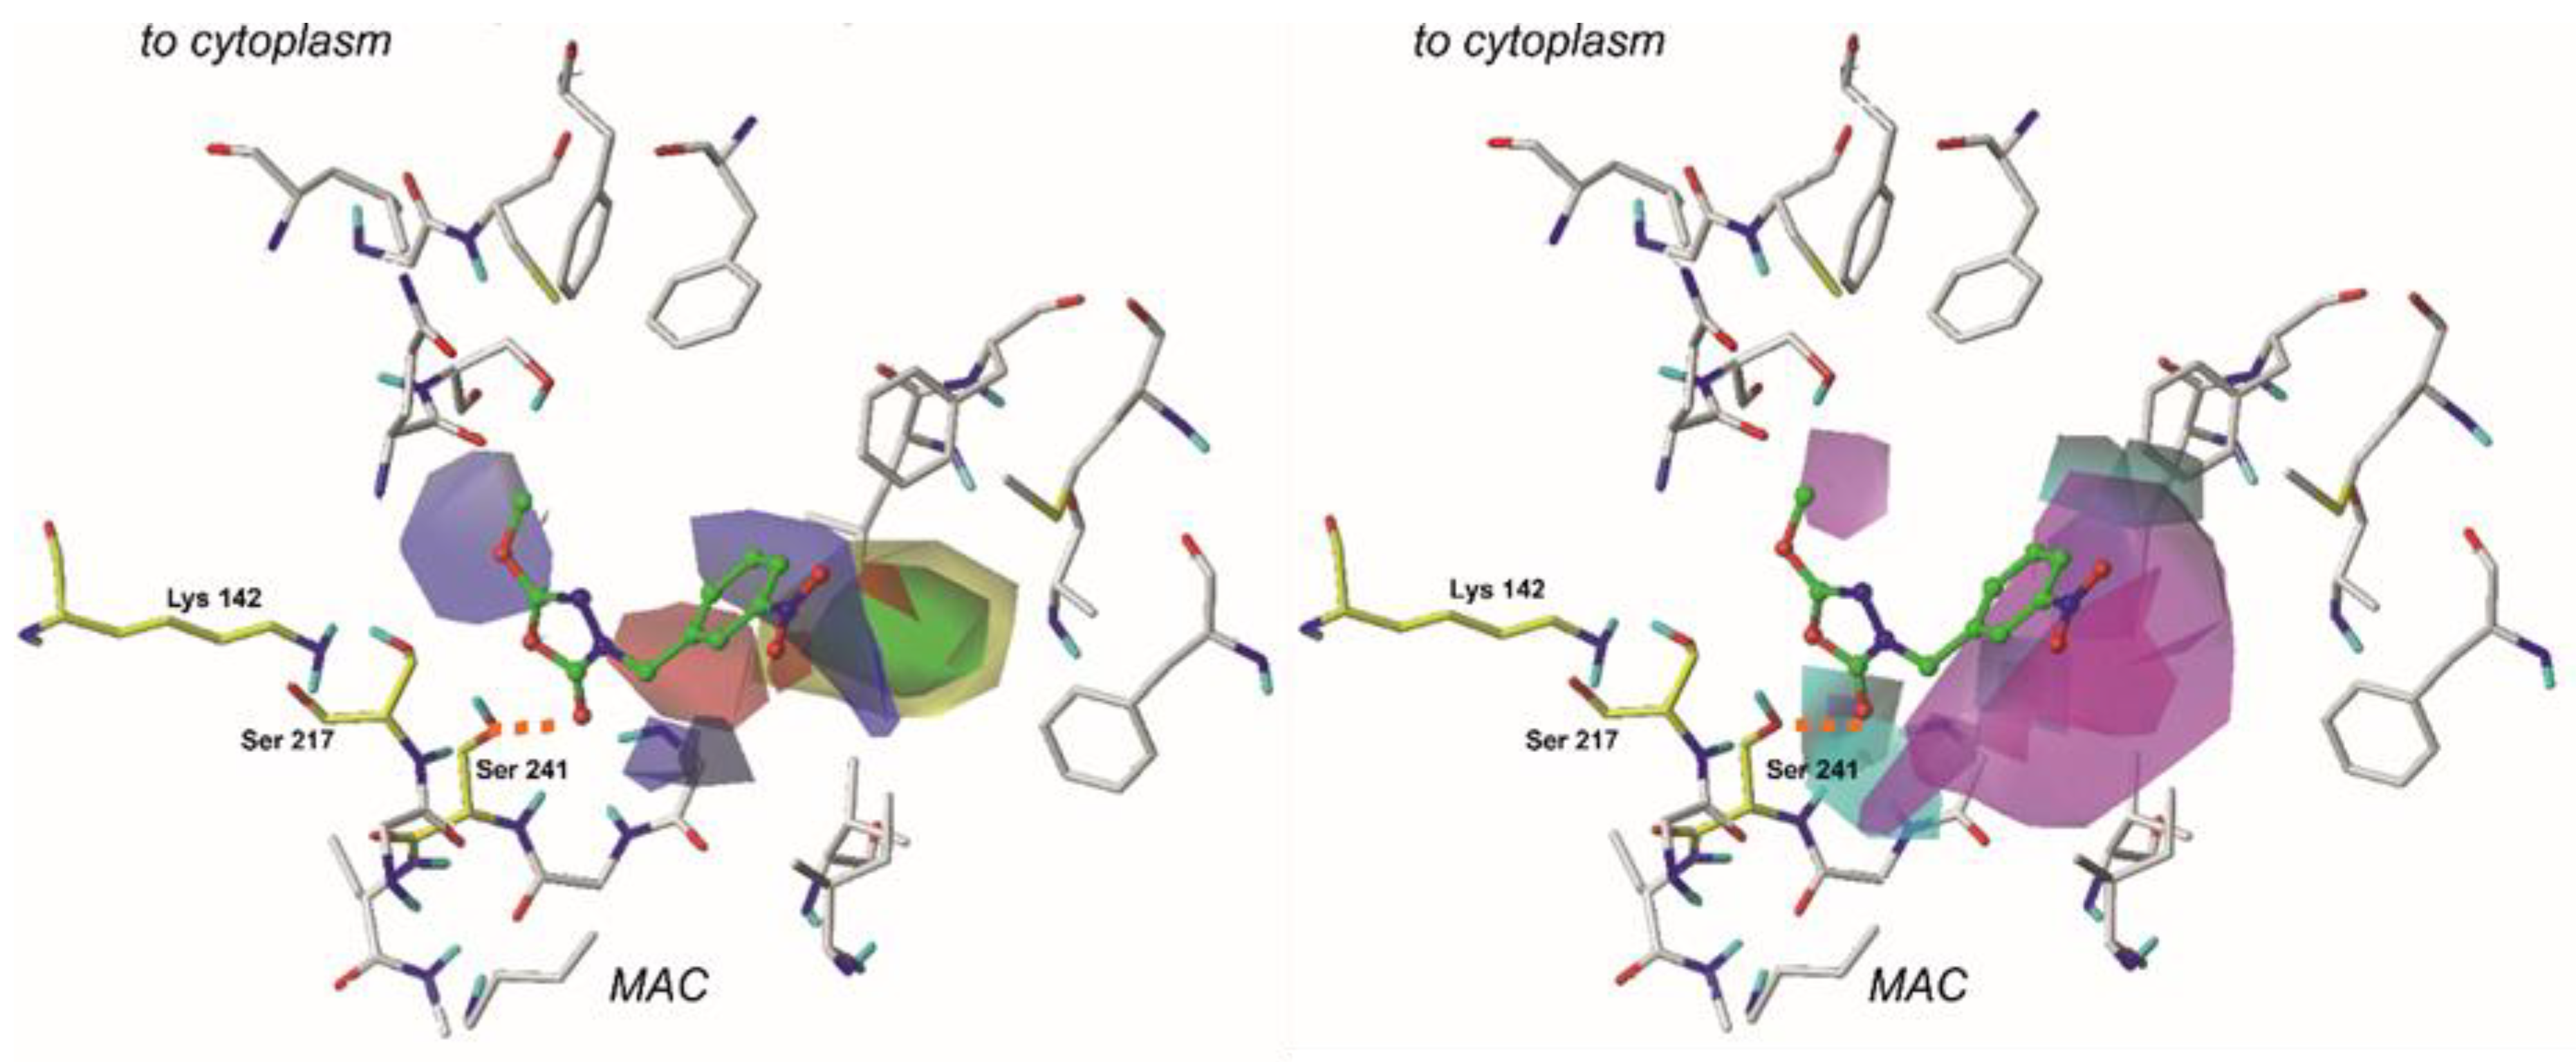
2.6. The CoMSIA Model Statistics and Validation

The CoMSIA 3D-Contour maps were generated in order to visualize the results obtained via these specific calculations. The contour maps of the CoMSIA for the least active and the most active of compounds are depicted in Figure 6 and Figure 7. In the CoMSIA model, the fractions representing electrostatic, steric, hydrogen-bond donor, and hydrogen acceptor fields were 34.6%, 23.9%, 23.4%, and 18.0%, respectively.
Similarly, as in the CoMFA technique, steric and electrostatic contour plots are returned as a result of the CoMSIA modeling. In the case of our CoMSIA model, steric and electrostatic contours obtained in the calculation are in good agreement with the results generated by the previously performed CoMFA study. It is noteworthy that steric and electrostatic interactions’ contribution was relatively smaller than in the previously performed examination [8].
In the CoMSIA study, two additional contour plots are generated—hydrogen bond donor and hydrogen bond acceptor. Their graphical interpretation is depicted in Figure 6 and Figure 7. These fields were generated with 60/40 contribution levels.
Hydrogen bond donor fields are represented by cyan and purple plots. In this context, cyan fields constitute favorable interactions, which means that hydrogen-bond-donating groups in these regions positively affect the molecule’s binding affinity. Purple marks indicate plots where H-bond donors are generally not required, and their presence results in the compound’s biological activity decrease. A large plot showing favorable H-bond donor properties is located in the neighborhood of a terminal aromatic ring in our reference compounds. Hence, providing these structures with another amine or hydroxyl group might benefit the ligand’s binding affinity. It appears that another contour of this type is present close to the 1,3,4-oxadiazol-2-one ring and oxygen atom from the enzyme’s Ser 241 residue. This suggests that the examined area is essential for a binding of a ligand. Moreover, it is believed that introducing another hydrogen-bond acceptor group might positively influence binding affinity and the compound’s biological activity. Interestingly, the same oxygen atom from the carbonyl group (1,2,4-oxadiazol-2-one moiety) of a ligand is involved in other H-bond contacts with Ile 238 and Gly 239. These residues, along with Gly 240, form an oxyanion hole—a characteristic structure responsible for stabilization of intermediates derived in the enzyme’s activation process. Introducing another hydrogen bond donor in this particular place may positively impact the compound’s biological activity.
When studying H-bond acceptor properties, magenta isopleths represent regions where the presence of hydrogen-bond-accepting groups will increase the biological activity of a compound. In contrast, such groups are not desired in fields encompassed by red plots [8]. Several plots need to be considered in this context. In the case of compound 1, a bulky isopleth indicating H-bond acceptor properties is located in a terminal’s phenoxy group neighborhood, which means that, generally speaking, H-bond acceptors are desired in this area. Thus, providing the structure with more electronegative atoms that can act as H-bond acceptors will positively influence the ligand’s binding affinity. Presumably, in the case of compound 31, providing the structure with additional groups acting as H-bond acceptors in the fields encompassed by magenta (e.g., instead of terminal -NO2 group) would positively influence the molecule’s biological activity.

3. Materials and Methods

3.1. Selection and Preparation of Compounds

A series of 1,3,4-oxadiazol-2-one derivatives characterized by the IC50 values were taken from our previously published papers (Table 1) [14,15]. In compounds with the IC50 values, which referred to the racemic mixture, the more active enantiomer (S) was selected for further examination.
Moreover, in several compounds, e.g., 17 and 18, the IC50 value was not determined experimentally. However, it was calculated from the IC50-single, according to the method previously published by Yamamoto et al. (2004) [32].
Furthermore, for some compounds, e.g., 28 and 29, with the IC50 above 100,000 nM, the measurement method could not detect the parameter’s precise value. Thus, the pIC50 value was assumed as 4 [33].

3.2. Molecular Docking and Alignment

The set of examined compounds was docked with the Glide module (Glide, Schrödinger software Release 2018-2, Schrödinger, New York, NY, USA) to the X-ray structure of the humanized rat FAAH enzyme in a complex with a small molecule inhibitor (PDB ID: 3QK5) [23]. Although there are many X-ray structures of fatty acid amide hydrolase available in PDB, we decided to choose this particular one due to its high X-ray crystallography resolution of 2.2 Å.
The biomolecule structure was preprocessed using the Protein Preparation Wizard (Protein Preparation Wizard; Epik, Schrödinger, New York, NY, USA) to optimize the hydrogen bonding network and remove any possible crystallographic artifacts as reported previously [14].
The grid box was centered, applying the X-ray ligand as the template. Molecular docking was carried out using the Standard Precision (SP) method, and 50 poses were generated for each ligand. Poses, where inhibitor interacted with the FAAH enzyme via a hydrogen bond with Ser 241, were the only ones taken for further analysis [5].
Moreover, in order to examine the correctness of the utilized docking procedure, the RMSD value was calculated in Yasara (v20.1.2.24, CMBI, Radboud University Nijmegen, The Netherlands). This protocol aimed to investigate whether a small molecule chemical binds exactly to the active site of the fatty acid amide hydrolase. Additional information about this procedure and a graphical interpretation of the results are gathered in Supplementary Figure S1.

3.3. CoMFA Studies

A modeling set of 31 compounds was submitted for the CoMFA field calculation. In a final model, the training set contained 24 molecules, whereas the test set comprised seven compounds. Test set molecules were chosen in a manner that allowed to cover a reasonable distribution of the biological data. Examined compounds were aligned in a way that allowed to overlaid essential (for the ligand binding) regions of each structure. The Standard Tripos force field was applied with Gasteiger–Hückel point charges and the default sp3 carbon probe with point charge +1.0 [34].
The CoMFA analysis was carried out using the QSAR module available in Sybyl-X (v2.1., Tripos Inc., St. Louis, MO, USA) The final model was designed for the optimal number of components, so the cross-validated R2 and Q2 were at their maximum, while the standard error of prediction was at its lowest [31,35].
As the first step in validation, the PLS analysis was carried out to correlate CoMFA fields to biological activity values (pIC50). Next, the leave-one-out (LOO) method was used to cross-validate the model. In this method, one of the compounds is removed from a dataset. Then, the activity of the missing compound is being predicted using the model developed from the remaining molecules. Moreover, scaling was set to the Standard CoMFA, and the column filtering option was set to 1.0 kcal/mol—to omit those columns where the energy variance was lower than 1.0 kcal/mol [36]. In the next step, the statistical significance of the developed model was examined using a seven-element test set of compounds.
A thorough validation procedure also included the usage of a progressive scrambling stability test. This test was performed to find an ideal number of components and check whether the CoMFA model is sensitive to the small perturbations, which were applied to the data [26,35]. As an additional method of validation, the constructed 3D-QSAR model was examined with the use of external criteria, which were previously implemented by Golbraikh and Tropsha [28,29]. Due to these requirements, a model can be considered predictive and statistically significant if the following conditions are satisfied:
Q2 > 0.5;
r2test-set > 0.6;
(r2 − r20)/r2 < 0.1;
0.85 ≤ k ≤ 1.15
The r2 test-set and r20 are squared correlation coefficients between experimental and predicted biological activity values for the test set molecules with and without Y-intercept set to 0, respectively. ‘k’ is a parameter that refers to the slope of the regression line [37].
The CoMFA contour maps were mapped onto the binding site of the FAAH enzyme, and the structure–activity relationship was discussed in the context of protein–ligand interactions [7,31].

3.4. CoMSIA Studies

The same 24 element training set was also used to construct the CoMSIA model. The model was built in order to examine the structure–activity relationship among FAAH ligands thoroughly. Both the CoMFA and CoMSIA techniques are based on the assumption that there are correlations between changes in a molecule’s binding affinity and properties expressed as molecular fields [11,21].
In this study, the CoMSIA model was created using Sybyl-X (v2.1., Tripos Inc., St. Louis, MO, USA), and the attenuation factor was set to the default value of 0.3 [38]. The grid constructed for the CoMFA analysis was also used for this calculation. The sp3-hybridized carbon atom, with +1.0 probe charge, hydrogen bond donor, and acceptor properties, were placed at each grid point to measure four physicochemical properties (electrostatic, steric, hydrogen-bond donor, and H-bond acceptor). Similarly, positions outside and inside molecular surfaces were calculated at all grid points, while the Gaussian function was applied to determine the distance between molecule and probe atoms [39]. The hydrophobic field was omitted.
The evaluation of this model was performed using the same methods that were earlier applied to determine the CoMFA model’s statistical significance. The CoMSIA model was obtained with the use of the partial least square (PLS) technique. In this calculation, the CoMSIA fields were used as independent variables, whereas values of the pIC50 of each compound were treated as dependent variables. Next, the leave-one-out (LOO) approach was used to select the best out of the established models and generate the cross-validated value of R2 (Q2) and the optimum number of components. Moreover, the PLS analysis was performed for the optimum number of components to determine correlation coefficient R2, standard error of prediction, and F-value. Due to this procedure, it was possible to obtain the model characterized by the optimal number of components, corresponding cross-validated Q2 value, and the lowest cross-validated standard error of estimate [11].
To examine the computed model’s statistical significance, we used it to predict pIC50 values for the seven-element test set. Next, a scrambling stability test was performed as an additional method of evaluation. The CoMSIA model was also evaluated using parameters determined by Golbraikh and Tropsha [28,29]. Finally, the CoMSIA results were graphically interpreted as colorful contribution maps.

4. Conclusions

We used 3D-QSAR techniques to examine the structure–activity relationship of a series of 1,3,4-oxadiazol-2-one compounds. Both constructed 3D-QSAR models were derived from a modeling set containing 31 compounds. Moreover, they were evaluated using the same statistical methods, including the leave-one-out technique, prediction of pIC50 values for an external group of compounds, scrambling stability test, and additional external validation criteria presented by Golbraikh and Tropsha. Obtained results stand for a high statistical significance of these models. The CoMFA and the CoMSIA contour maps provided enough information to understand the structure–activity relationship and identify structural features influencing the inhibitory activity. In particular, these compounds interacted with other residues, such as Gly 239 and Ile 238, that seem to be essential for inhibitor binding. The examination of the electrostatic properties of established models revealed plots referring to the desired electronegative groups, surrounding the 1,3,4-oxadiazol-2-one moiety. This highlights the importance of heterocycle, a highly electronegative moiety in this area of each ligand.
Moreover, analysis of steric contour maps, displayed on the compounds from the training set, revealed that high-volume moieties, e.g., aromatic rings, are generally more desired on the opposite side to the 1,3,4-oxadiazol-2-one moiety. Thus, providing these regions with an additional 5- or 6-membered ring might positively influence the binding affinity. Examination of hydrogen bond donor and acceptor properties contour maps revealed several spots where the implementation of another hydrogen-bond-donating moiety will positively impact molecules’ binding affinity, e.g., in the neighborhood of the 1,3,4-oxadiazol-2-one ring. On the other hand, providing the structure with an additional moiety that would act as a H-bond donor in the neighborhood of the terminal phenoxy group may positively influence the molecule’s properties.
The data presented in this manuscript fill the gap in the research on the FAAH inhibitors. In our opinion, this study contributes to a better understanding of a complex structure–activity relationship present among these ligands. Therefore, this information can be used by medicinal chemists to design novel, more potent and selective FAAH inhibitors to treat patients suffering from a number of diseases, e.g., Parkinson’s disease or schizophrenia.

Supplementary Materials

The following are available online at https://0-www-mdpi-com.brum.beds.ac.uk/article/10.3390/ijms22116108/s1, Figure S1: Three-dimensional graphical interpretation of the docking validation procedure.

Author Contributions

Conceptualization, A.P. and A.A.K.; Funding acquisition, A.A.K.; Investigation, A.Z. and T.L.; Methodology, A.P. and A.A.K.; Supervision, A.A.K.; Visualization, A.Z.; Writing—original draft, A.Z.; Writing—review and editing, A.Z., T.L., J.Z.P., A.P. and A.A.K. All authors have read and agreed to the published version of the manuscript.

Funding

This research was performed under the DS33 grant by Medical University of Lublin, Poland. Calculations were partially performed under a computational grant by Interdisciplinary Center for Mathematical and Computational Modeling (ICM), Warsaw, Poland, grant number G30-18, under resources and licenses from CSC, Finland.

Institutional Review Board Statement

Not applicable.

Informed Consent Statement

Not applicable.

Data Availability Statement

Supporting information for this article is available upon request from corresponding authors.

Conflicts of Interest

The authors declare no conflict of interest. The funders had no role in the design of the study; in the collection, analyses, or interpretation of data; in the writing of the manuscript, or in the decision to publish the results.

Abbreviations

CoMFAComparative Molecular Field Analysis
CoMSIAComparative Molecular Similarity Indices Analysis
FAAHFatty Acid Amide Hydrolase
MACMembrane Access Channel
PLS.Partial Least Square
QSARQuantitative Structure–Activity Relationship
SEEStandard error of estimate
SPStandard Precision

References

  1. Piomelli, D. Endocannabinoids. In Encyclopedia of Biological Chemistry, 2nd ed.; Lennarz, W.J., Lane, M.D., Eds.; Academic Press: Waltham, MA, USA, 2013; pp. 194–196. ISBN 978-0-12-378631-9. [Google Scholar]
  2. Tripathi, R.K.P. A Perspective Review on Fatty Acid Amide Hydrolase (FAAH) Inhibitors as Potential Therapeutic Agents. Eur. J. Med. Chem. 2020, 188, 111953. [Google Scholar] [CrossRef] [PubMed]
  3. Leweke, F.M.; Piomelli, D.; Pahlisch, F.; Muhl, D.; Gerth, C.W.; Hoyer, C.; Klosterkötter, J.; Hellmich, M.; Koethe, D. Cannabidiol Enhances Anandamide Signaling and Alleviates Psychotic Symptoms of Schizophrenia. Transl. Psychiatry 2012, 2, e94. [Google Scholar] [CrossRef] [PubMed] [Green Version]
  4. Gaetani, S.; Dipasquale, P.; Romano, A.; Righetti, L.; Cassano, T.; Piomelli, D.; Cuomo, V. Chapter 5 The Endocannabinoid System as A Target for Novel Anxiolytic and Antidepressant Drugs. In International Review of Neurobiology; Academic Press: Amsterdam, The Netherlands, 2009; Volume 85, pp. 57–72. [Google Scholar]
  5. Mileni, M.; Garfunkle, J.; DeMartino, J.K.; Cravatt, B.F.; Boger, D.L.; Stevens, R.C. Binding and Inactivation Mechanism of a Humanized Fatty Acid Amide Hydrolase by α-Ketoheterocycle Inhibitors Revealed from Co-Crystal Structures. J. Am. Chem. Soc. 2009, 131, 10497. [Google Scholar] [CrossRef] [Green Version]
  6. Van Esbroeck, A.C.M.; Janssen, A.P.A.; Cognetta, A.B.; Ogasawara, D.; Shpak, G.; van der Kroeg, M.; Kantae, V.; Baggelaar, M.P.; de Vrij, F.M.S.; Deng, H.; et al. Activity-Based Protein Profiling Reveals off-Target Proteins of the FAAH Inhibitor BIA 10-2474. Science 2017, 356, 1084–1087. [Google Scholar] [CrossRef] [Green Version]
  7. Roy, K. Advances in QSAR Modeling: Applications in Pharmaceutical, Chemical, Food, Agricultural and Environmental Sciences; Springer: New York, NY, USA, 2017; ISBN 978-3-31-986018-3. [Google Scholar]
  8. Roy, K.; Kar, S.; Das, R.N. Chapter 8—Introduction to 3D-QSAR. In Understanding the Basics of QSAR for Applications in Pharmaceutical Sciences and Risk Assessment; Roy, K., Kar, S., Das, R.N., Eds.; Academic Press: Boston, MA, USA, 2015; pp. 291–317. ISBN 978-0-12-801505-6. [Google Scholar]
  9. Beliaev, A.; Ferreira, H.S.; Learmonth, D.A.; Bonifácio, M.J.; Torrão, L.; Pires, N.M.; Soares-da-Silva, P.; Kiss, L.E. Synthesis and Structure–Activity Relationships of Ionizable 1,3,4-Oxadiazol-2(3H)-Ones as Peripherally Selective FAAH Inhibitors with Improved Aqueous Solubility. Pure Appl. Chem. 2016, 88, 341–347. [Google Scholar] [CrossRef]
  10. Käsnänen, H.; Myllymäki, M.J.; Minkkilä, A.; Kataja, A.O.; Saario, S.M.; Nevalainen, T.; Koskinen, A.M.P.; Poso, A. 3-Heterocycle-Phenyl N-Alkylcarbamates as FAAH Inhibitors: Design, Synthesis and 3D-QSAR Studies. ChemMedChem 2010, 5, 213–231. [Google Scholar] [CrossRef]
  11. Zhao, X.; Chen, M.; Huang, B.; Ji, H.; Yuan, M. Comparative Molecular Field Analysis (CoMFA) and Comparative Molecular Similarity Indices Analysis (CoMSIA) Studies on A1A-Adrenergic Receptor Antagonists Based on Pharmacophore Molecular Alignment. Int. J. Mol. Sci. 2011, 12, 7022–7037. [Google Scholar] [CrossRef] [PubMed]
  12. Han, D.; Wang, B.; Jin, H.; Wang, H.; Chen, M. Design, Synthesis and CoMFA Studies of OEA Derivatives as FAAH Inhibitors. Med. Chem. Res. 2017, 26, 2951–2966. [Google Scholar] [CrossRef]
  13. Lorca, M.; Valdes, Y.; Chung, H.; Romero-Parra, J.; Pessoa-Mahana, C.D.; Mella, J. Three-Dimensional Quantitative Structure-Activity Relationships (3D-QSAR) on a Series of Piperazine-Carboxamides Fatty Acid Amide Hydrolase (FAAH) Inhibitors as a Useful Tool for the Design of New Cannabinoid Ligands. Int. J. Mol. Sci. 2019, 20, 2510. [Google Scholar] [CrossRef] [PubMed] [Green Version]
  14. Patel, J.Z.; Parkkari, T.; Laitinen, T.; Kaczor, A.A.; Saario, S.M.; Savinainen, J.R.; Navia-Paldanius, D.; Cipriano, M.; Leppänen, J.; Koshevoy, I.O.; et al. Chiral 1,3,4-Oxadiazol-2-Ones as Highly Selective FAAH Inhibitors. J. Med. Chem. 2013, 56, 8484–8496. [Google Scholar] [CrossRef]
  15. Patel, J.Z.; van Bruchem, J.; Laitinen, T.; Kaczor, A.A.; Navia-Paldanius, D.; Parkkari, T.; Savinainen, J.R.; Laitinen, J.T.; Nevalainen, T.J. Revisiting 1,3,4-Oxadiazol-2-Ones: Utilization in the Development of ABHD6 Inhibitors. Bioorg. Med. Chem. 2015, 23, 6335–6345. [Google Scholar] [CrossRef] [PubMed]
  16. Use of an Inhibitor to Identify Members of the Hormone-Sensitive Lipase Family. Biochemistry. Available online: https://0-pubs-acs-org.brum.beds.ac.uk/doi/abs/10.1021/bi0613978 (accessed on 9 March 2021).
  17. Muccioli, G.G.; Labar, G.; Lambert, D.M. CAY10499, a Novel Monoglyceride Lipase Inhibitor Evidenced by an Expeditious MGL Assay. ChemBioChem 2008, 9, 2704–2710. [Google Scholar] [CrossRef]
  18. Point, V.; Pavan Kumar, K.V.P.; Marc, S.; Delorme, V.; Parsiegla, G.; Amara, S.; Carrière, F.; Buono, G.; Fotiadu, F.; Canaan, S.; et al. Analysis of the Discriminative Inhibition of Mammalian Digestive Lipases by 3-Phenyl Substituted 1,3,4-Oxadiazol-2(3H)-Ones. Eur. J. Med. Chem. 2012, 58, 452–463. [Google Scholar] [CrossRef] [PubMed]
  19. Delorme, V.; Diomandé, S.V.; Dedieu, L.; Cavalier, J.-F.; Carrière, F.; Kremer, L.; Leclaire, J.; Fotiadu, F.; Canaan, S. MmPPOX Inhibits Mycobacterium Tuberculosis Lipolytic Enzymes Belonging to the Hormone-Sensitive Lipase Family and Alters Mycobacterial Growth. PLoS ONE 2012, 7, e46493. [Google Scholar] [CrossRef] [PubMed]
  20. Käsnänen, H.; Minkkilä, A.; Taupila, S.; Patel, J.Z.; Parkkari, T.; Lahtela-Kakkonen, M.; Saario, S.M.; Nevalainen, T.; Poso, A. 1,3,4-Oxadiazol-2-Ones as Fatty-Acid Amide Hydrolase and Monoacylglycerol Lipase Inhibitors: Synthesis, in Vitro Evaluation and Insight into Potency and Selectivity Determinants by Molecular Modelling. Eur. J. Pharm. Sci. Off. J. Eur. Fed. Pharm. Sci. 2013, 49, 423–433. [Google Scholar] [CrossRef]
  21. Sarma, B.K.; Liu, X.; Kodadek, T. Identification of Selective Covalent Inhibitors of Platelet Activating Factor Acetylhydrolase 1B2 from the Screening of an Oxadiazolone-Capped Peptoid–Azapeptoid Hybrid Library. Bioorg. Med. Chem. 2016, 24, 3953–3963. [Google Scholar] [CrossRef] [Green Version]
  22. Screening of Various Hormone-Sensitive Lipase Inhibitors as Endocannabinoid-Hydrolyzing Enzyme Inhibitors—Minkkilä—2009—ChemMedChem—Wiley Online Library. Available online: https://0-chemistry--europe-onlinelibrary-wiley-com.brum.beds.ac.uk/doi/full/10.1002/cmdc.200900137 (accessed on 9 March 2021).
  23. Bank, R.P.D. RCSB PDB—3QK5: Crystal Structure of Fatty Acid Amide Hydrolase with Small Molecule Inhibitor. Available online: https://www.rcsb.org/structure/3QK5 (accessed on 14 January 2021).
  24. Urniaż, R.D.; Jóźwiak, K. X-Ray Crystallographic Structures as a Source of Ligand Alignment in 3D-QSAR. J. Chem. Inf. Model. 2013, 53, 1406–1414. [Google Scholar] [CrossRef]
  25. Hevener, K.E.; Ball, D.M.; Buolamwini, J.K.; Lee, R.E. Quantitative Structure-Activity Relationship Studies on Nitrofuranyl Antitubercular Agents. Bioorg. Med. Chem. 2008, 16, 8042–8053. [Google Scholar] [CrossRef] [Green Version]
  26. Clark, R.D.; Fox, P.C. Statistical Variation in Progressive Scrambling. J. Comput. Aided Mol. Des. 2004, 18, 563–576. [Google Scholar] [CrossRef] [PubMed]
  27. Luco, J.M.; Ferretti, F.H. QSAR Based on Multiple Linear Regression and PLS Methods for the Anti-HIV Activity of a Large Group of HEPT Derivatives. J. Chem. Inf. Comput. Sci. 1997, 37, 392–401. [Google Scholar] [CrossRef]
  28. Golbraikh, A.; Tropsha, A. Beware of Q2! J. Mol. Graph. Model. 2002, 20, 269–276. [Google Scholar] [CrossRef]
  29. Golbraikh, A.; Shen, M.; Xiao, Z.; Xiao, Y.-D.; Lee, K.-H.; Tropsha, A. Rational Selection of Training and Test Sets for the Development of Validated QSAR Models. J. Comput. Aided Mol. Des. 2003, 17, 241–253. [Google Scholar] [CrossRef] [PubMed]
  30. Murumkar, P.R.; Gupta, S.D.; Zambre, V.P.; Giridhar, R.; Yadav, M.R. Development of Predictive 3D-QSAR CoMFA and CoMSIA Models for β-Aminohydroxamic Acid-Derived Tumor Necrosis Factor-α Converting Enzyme Inhibitors. Chem. Biol. Drug Des. 2009, 73, 97–107. [Google Scholar] [CrossRef] [PubMed]
  31. Kakarla, P.; Inupakutika, M.; Devireddy, A.R.; Gunda, S.K.; Willmon, T.M.; Ranjana, K.; Shrestha, U.; Ranaweera, I.; Hernandez, A.J.; Barr, S.; et al. 3D-QSAR and contour map analysis of tariquidar analogues as multidrug resistance protein-1 (MRP1) inhibitors. Int. J. Pharm. Sci. Res. 2016, 7, 554–572. [Google Scholar] [CrossRef] [PubMed]
  32. Yamamoto, T.; Suzuki, A.; Kohno, Y. High-Throughput Screening for the Assessment of Time-Dependent Inhibitions of New Drug Candidates on Recombinant CYP2D6 and CYP3A4 Using a Single Concentration Method. Xenobiotica 2004, 34, 87–101. [Google Scholar] [CrossRef]
  33. Kaczor, A.; Targowska-Duda, K.; Patel, J.; Laitinen, T.; Parkkari, T.; Adams, Y.; Nevalainen, T.; Poso, A. Comparative Molecular Field Analysis and Molecular Dynamics Studies of α/β Hydrolase Domain Containing 6 (ABHD6) Inhibitors. J. Mol. Model. 2015, 21, 2789. [Google Scholar] [CrossRef] [Green Version]
  34. Yuan, H.; Zhuang, J.; Hu, S.; Li, H.; Xu, J.; Hu, Y.; Xiong, X.; Chen, Y.; Lu, T. Molecular Modeling of Exquisitely Selective C-Met Inhibitors through 3D-QSAR and Molecular Dynamics Simulations. J. Chem. Inf. Model. 2014, 54, 2544–2554. [Google Scholar] [CrossRef]
  35. QSAR and CoMFA Manual, Basics Manual Sybyl ®-X 1.1; Tripos Inc.: St. Louis, MO, USA, 2010.
  36. Flower, D.R. Immunoinformatics: Predicting Immunogenicity In Silico; Springer Science & Business Media: Totowa, NJ, USA, 2007; ISBN 978-1-58829-699-3. [Google Scholar]
  37. Tropsha, A.; Cho, S.J. Cross-Validated R2 Guided Region Selection for CoMFA Studies. In 3D QSAR in Drug Design: Recent Advances; Kubinyi, H., Folkers, G., Martin, Y.C., Eds.; Three-Dimensional Quantitative Structure Activity Relationships; Springer: Dordrecht, The Netherlands, 1998; pp. 57–69. ISBN 978-0-306-46858-2. [Google Scholar]
  38. Zheng, J.; Xiao, G.; Guo, J.; Zheng, Y.; Gao, H.; Zhao, S.; Zhang, K.; Sun, P. Exploring QSARs for 5-Lipoxygenase (5-LO) Inhibitory Activity of 2-Substituted 5-Hydroxyindole-3-Carboxylates by CoMFA and CoMSIA. Chem. Biol. Drug Des. 2011, 78, 314–321. [Google Scholar] [CrossRef]
  39. Balasubramanian, P.K.; Balupuri, A.; Gadhe, C.G.; Cho, S.J. 3D QSAR Modeling Study on 7-Aminofuro [2,3-c] Pyridine Derivatives as TAK1 Inhibitors Using CoMFA and COMSIA. Med. Chem. Res. 2015, 24, 2347–2365. [Google Scholar] [CrossRef]
Figure 1. The general structure of the studied compounds.
Ijms 22 06108 g001
Figure 2. The experimental versus predicted pIC50 values for the CoMFA training set and test set.
Ijms 22 06108 g002
Figure 3. Comparative Molecular Field Analysis (CoMFA) electrostatic (right) and steric (left) fields projected on the 3D structure of the fatty acid amide hydrolase in complex with the least active compound (31). Fields are drawn with 70/30 proportions. Ligands are depicted as sticks and balls with green carbon atoms. Protein is shown as sticks with gray carbon atoms. Catalytic residues are presented as sticks and are colored using yellow carbon atoms. A bond formed between a ligand and an enzyme is depicted as an orange dashed line. Non-polar hydrogens are omitted for clarity.
Ijms 22 06108 g003
Figure 4. Comparative Molecular Field Analysis (CoMFA) electrostatic (right) and steric (left) fields projected on the 3D structure of the fatty acid amide hydrolase in complex with the most active compound (1). Fields are drawn with 70/30 proportions. Ligands are depicted as sticks and balls with green carbon atoms. Protein is shown as with gray carbon atoms. Catalytic residues are presented as sticks and are colored using yellow carbon atoms. A bond formed between a ligand and an enzyme is depicted as an orange dashed line. Non-polar hydrogens are omitted for clarity.
Ijms 22 06108 g004
Figure 5. The experimental versus predicted pIC50 values for the CoMSIA training set and test set.
Ijms 22 06108 g005
Figure 6. Comparative Molecular Similarity Indices Analysis (CoMSIA) steric, electrostatic (left), H-bond acceptor and H-bond donor (right) fields projected on the 3D-structure of fatty acid amide hydrolase in complex with the least active compound (31). Fields are drawn with 60/40, 70/30, 60/40, 60/40 proportions, respectively. Ligands are shown as sticks and balls with green carbon atoms. Protein is shown as wires with gray carbon atoms. Catalytic residues are presented as sticks and colored using yellow carbon atoms. A bond formed between a ligand and an enzyme is depicted as an orange dashed line. Non-polar hydrogens are omitted for clarity.
Ijms 22 06108 g006
Figure 7. Comparative Molecular Similarity Indices Analysis (CoMSIA) steric, electrostatic (left), H-bond acceptor and H-bond donor (right) fields projected on the 3D-structure of fatty acid amide hydrolase in complex with the most active compound (1). Fields are drawn with 60/40, 70/30, 60/40, 60/40 proportions, respectively. Ligands are shown as sticks and balls with green carbon atoms. Protein is shown as wires with gray carbon atoms. Catalytic residues are presented as sticks and colored using yellow carbon atoms. A bond formed between a ligand and an enzyme is depicted as an orange dashed line. Non-polar hydrogens are omitted for clarity.
Ijms 22 06108 g007
Table 1. Modeling set (the training set and the test set) used in the 3D-QSAR study.
No.Chemical StructureExperiment
pIC50
CoMFACoMSIAResidual CoMFAResidual CoMSIA
Training Set
1 Ijms 22 06108 i00176.766.450.240.55
2 Ijms 22 06108 i0026.616.476.270.140.34
3 Ijms 22 06108 i0036.396.496.44−0.10−0.05
4 Ijms 22 06108 i0046.346.436.46−0.09−0.12
5 Ijms 22 06108 i0056.216.476.31−0.26−0.10
6 Ijms 22 06108 i0066.016.016.180.00−0.17
8 Ijms 22 06108 i0075.825.675.810.150.01
10 Ijms 22 06108 i0085.405.235.040.170.36
12 Ijms 22 06108 i0094.824.804.780.020.04
13 Ijms 22 06108 i0104.774.655.050.12−0.28
14 Ijms 22 06108 i0114.734.875.14−0.14−0.41
15 Ijms 22 06108 i0124.534.454.410.080.12
16 Ijms 22 06108 i0134.394.484.61−0.09−0.22
17 Ijms 22 06108 i0144.344.504.13−0.160.21
18 Ijms 22 06108 i0154.344.544.46−0.20−0.12
19 Ijms 22 06108 i0164.184.204.02−0.020.16
22 Ijms 22 06108 i0174.003.883.960.120.04
23 Ijms 22 06108 i0184.003.894.370.11−0.37
25 Ijms 22 06108 i0194.004.063.98−0.060.02
26 Ijms 22 06108 i0204.004.224.29−0.22−0.29
28 Ijms 22 06108 i0214.003.893.840.110.16
29 Ijms 22 06108 i0224.003.784.440.22−0.44
30 Ijms 22 06108 i0233.944.063.83−0.120.11
31 Ijms 22 06108 i0243.873.913.45−0.040.42
Test Set
7 Ijms 22 06108 i0255.935.775.940.16−0.01
9 Ijms 22 06108 i0265.545.886.26−0.34−0.72
11 Ijms 22 06108 i0275.175.465.49−0.29−0.32
20 Ijms 22 06108 i0284.134.664.74−0.53−0.61
21 Ijms 22 06108 i0294.093.934.720.16−0.63
24 Ijms 22 06108 i0304.004.154.32−0.15−0.32
27 Ijms 22 06108 i0314.004.164.41−0.16−0.41
Table 2. Statistical analysis results for the best CoMFA and CoMSIA models.
ParameterR2Q2SEEF-ValueComponentsr2test-setr20k(r2 − r20)/r2
CoMFA0.980.610.16234.6840.910.980.950.08
CoMSIA0.930.640.2892.8230.910.980.890.08
Table 3. Progressive scrambling test results obtained for the comparative molecular fields analysis (CoMFA) model.
Number of Components54321
Q20.510.510.470.450.34
cSDEP0.800.780.700.790.84
DQ2/dR2yy1.120.991.040.770.78
Table 4. Progressive scrambling test results obtained for the comparative molecular similarity indices analysis (CoMSIA) model.
Number of Components54321
Q20.470.500.510.460.32
cSDEP0.830.790.760.790.86
DQ2/dR2yy1.541.281.181.010.78
Publisher’s Note: MDPI stays neutral with regard to jurisdictional claims in published maps and institutional affiliations.

