
Analyzing Olfactory Neuron Precursors Non-Invasively Isolated through NADH FLIM as a Potential Tool to Study Oxidative Stress in Alzheimer’s Disease

 ,
,  , and
, and
Abstract
:1. Introduction
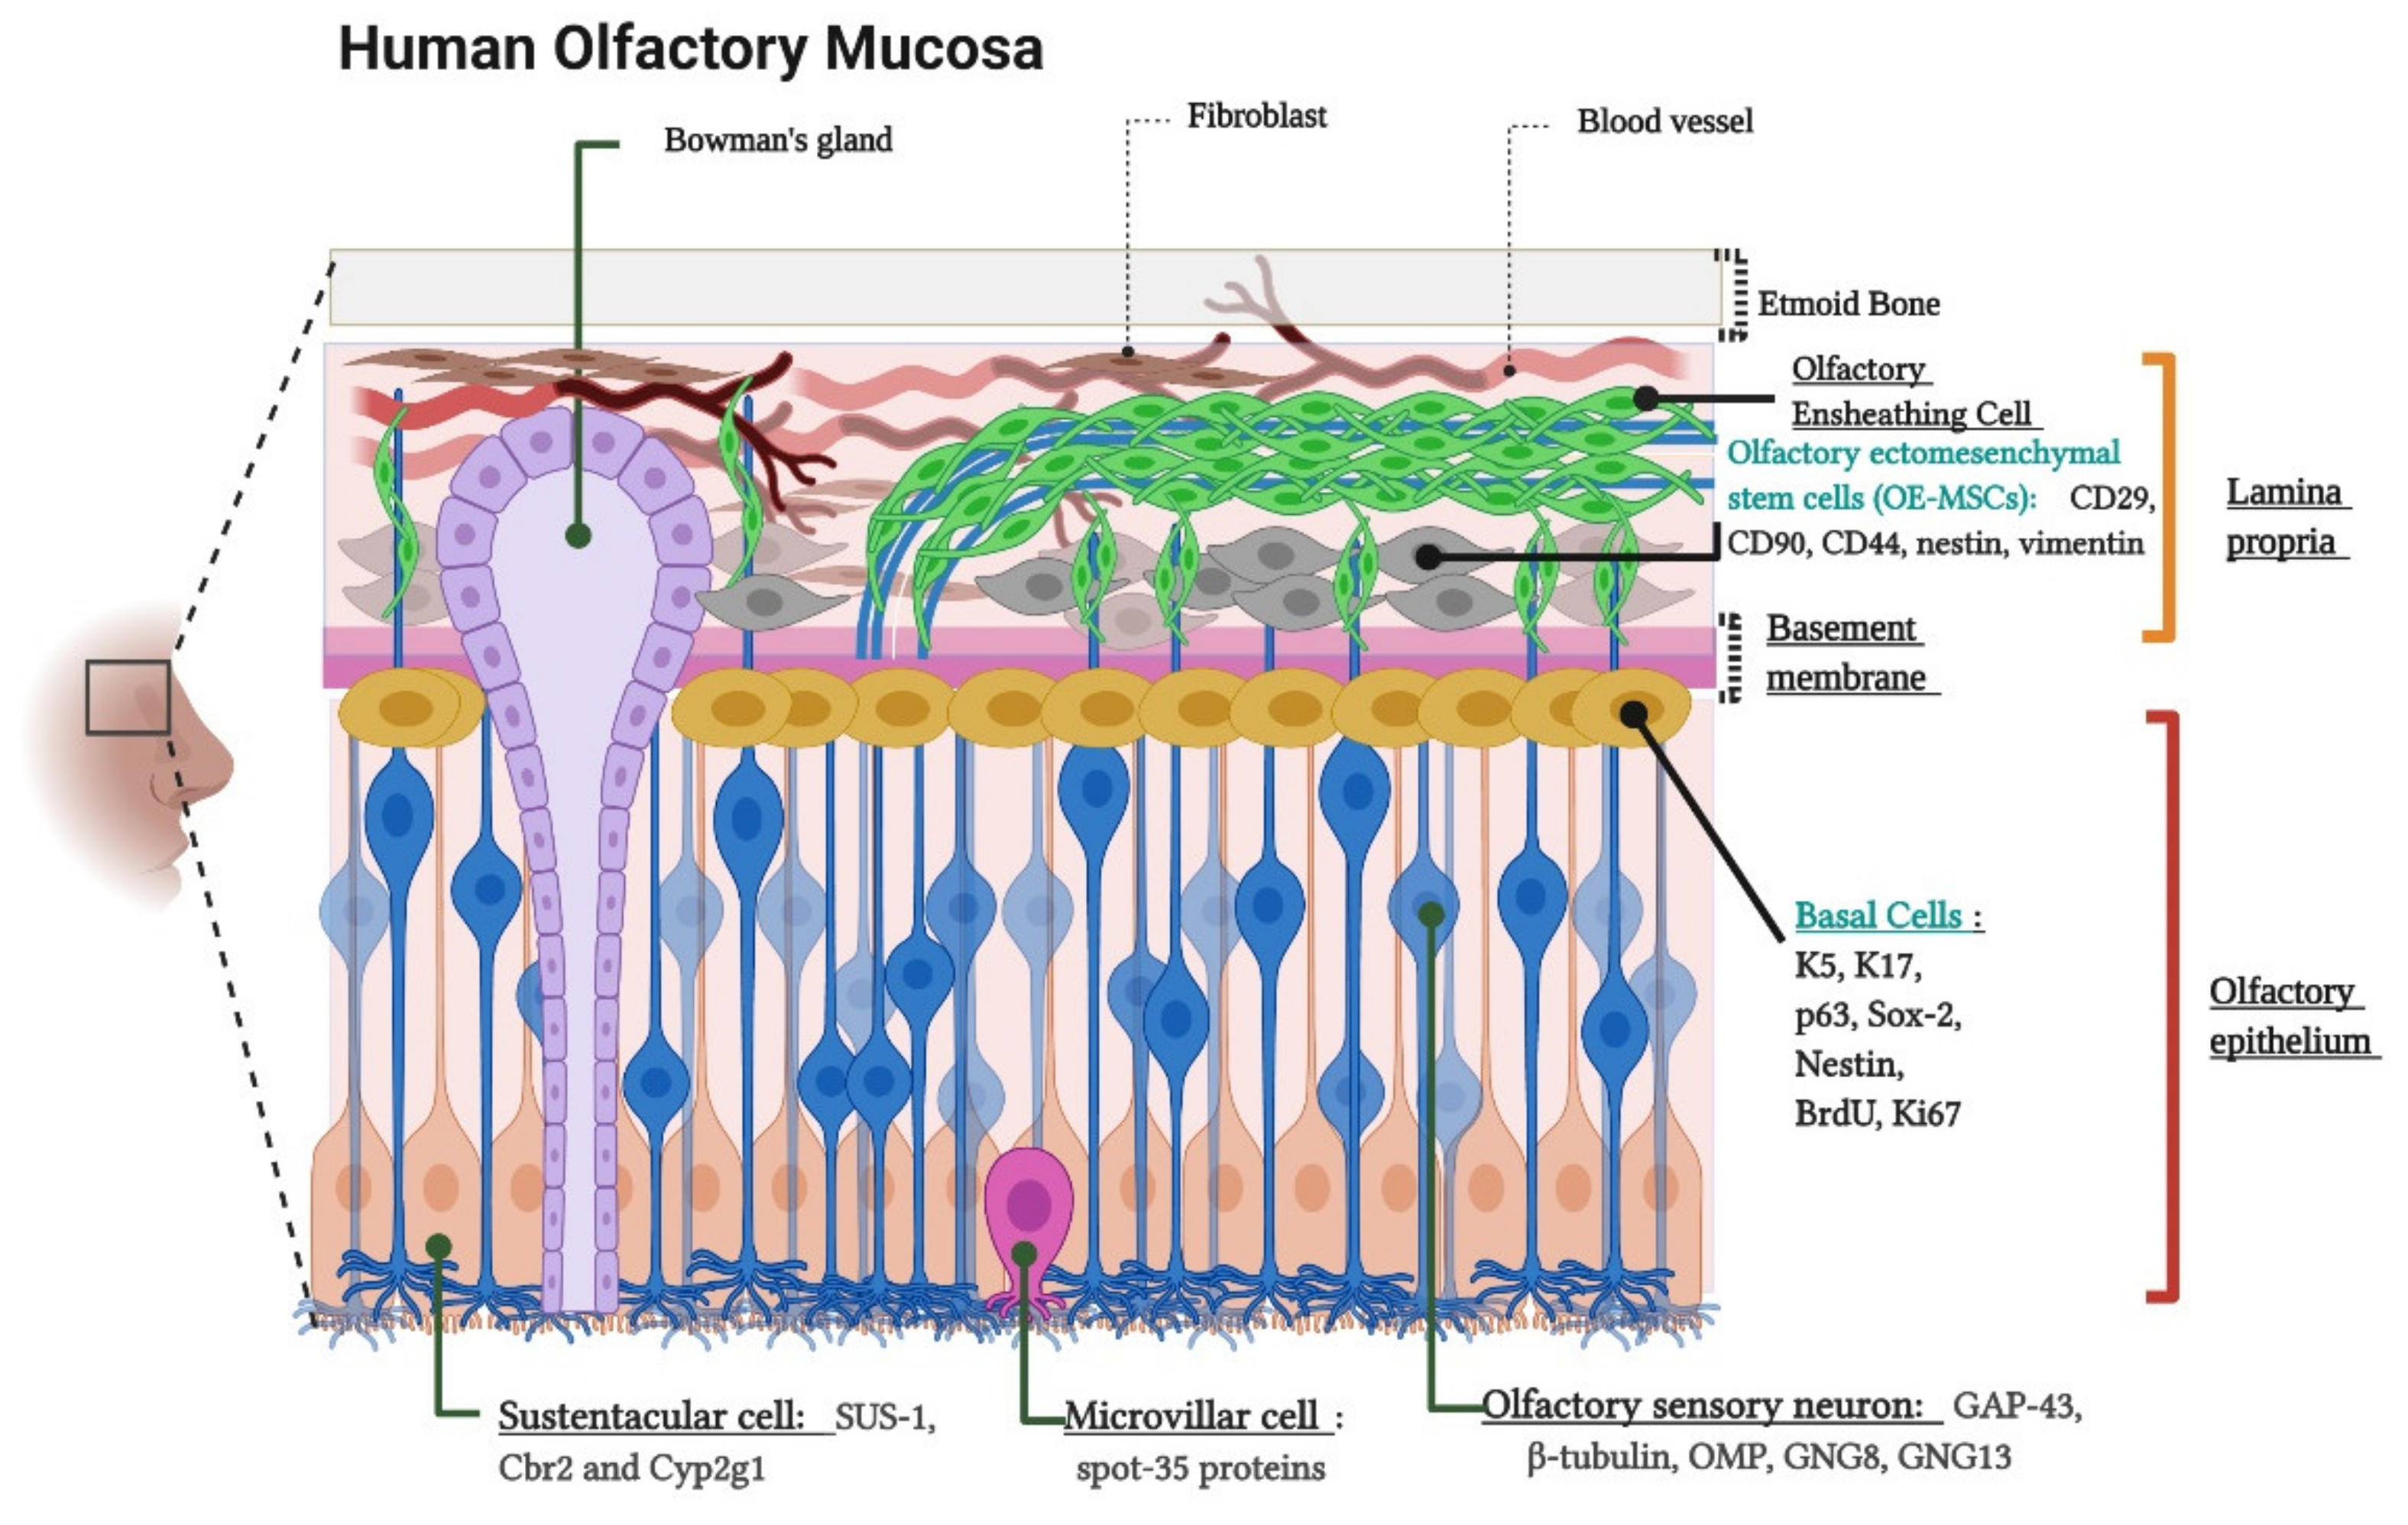
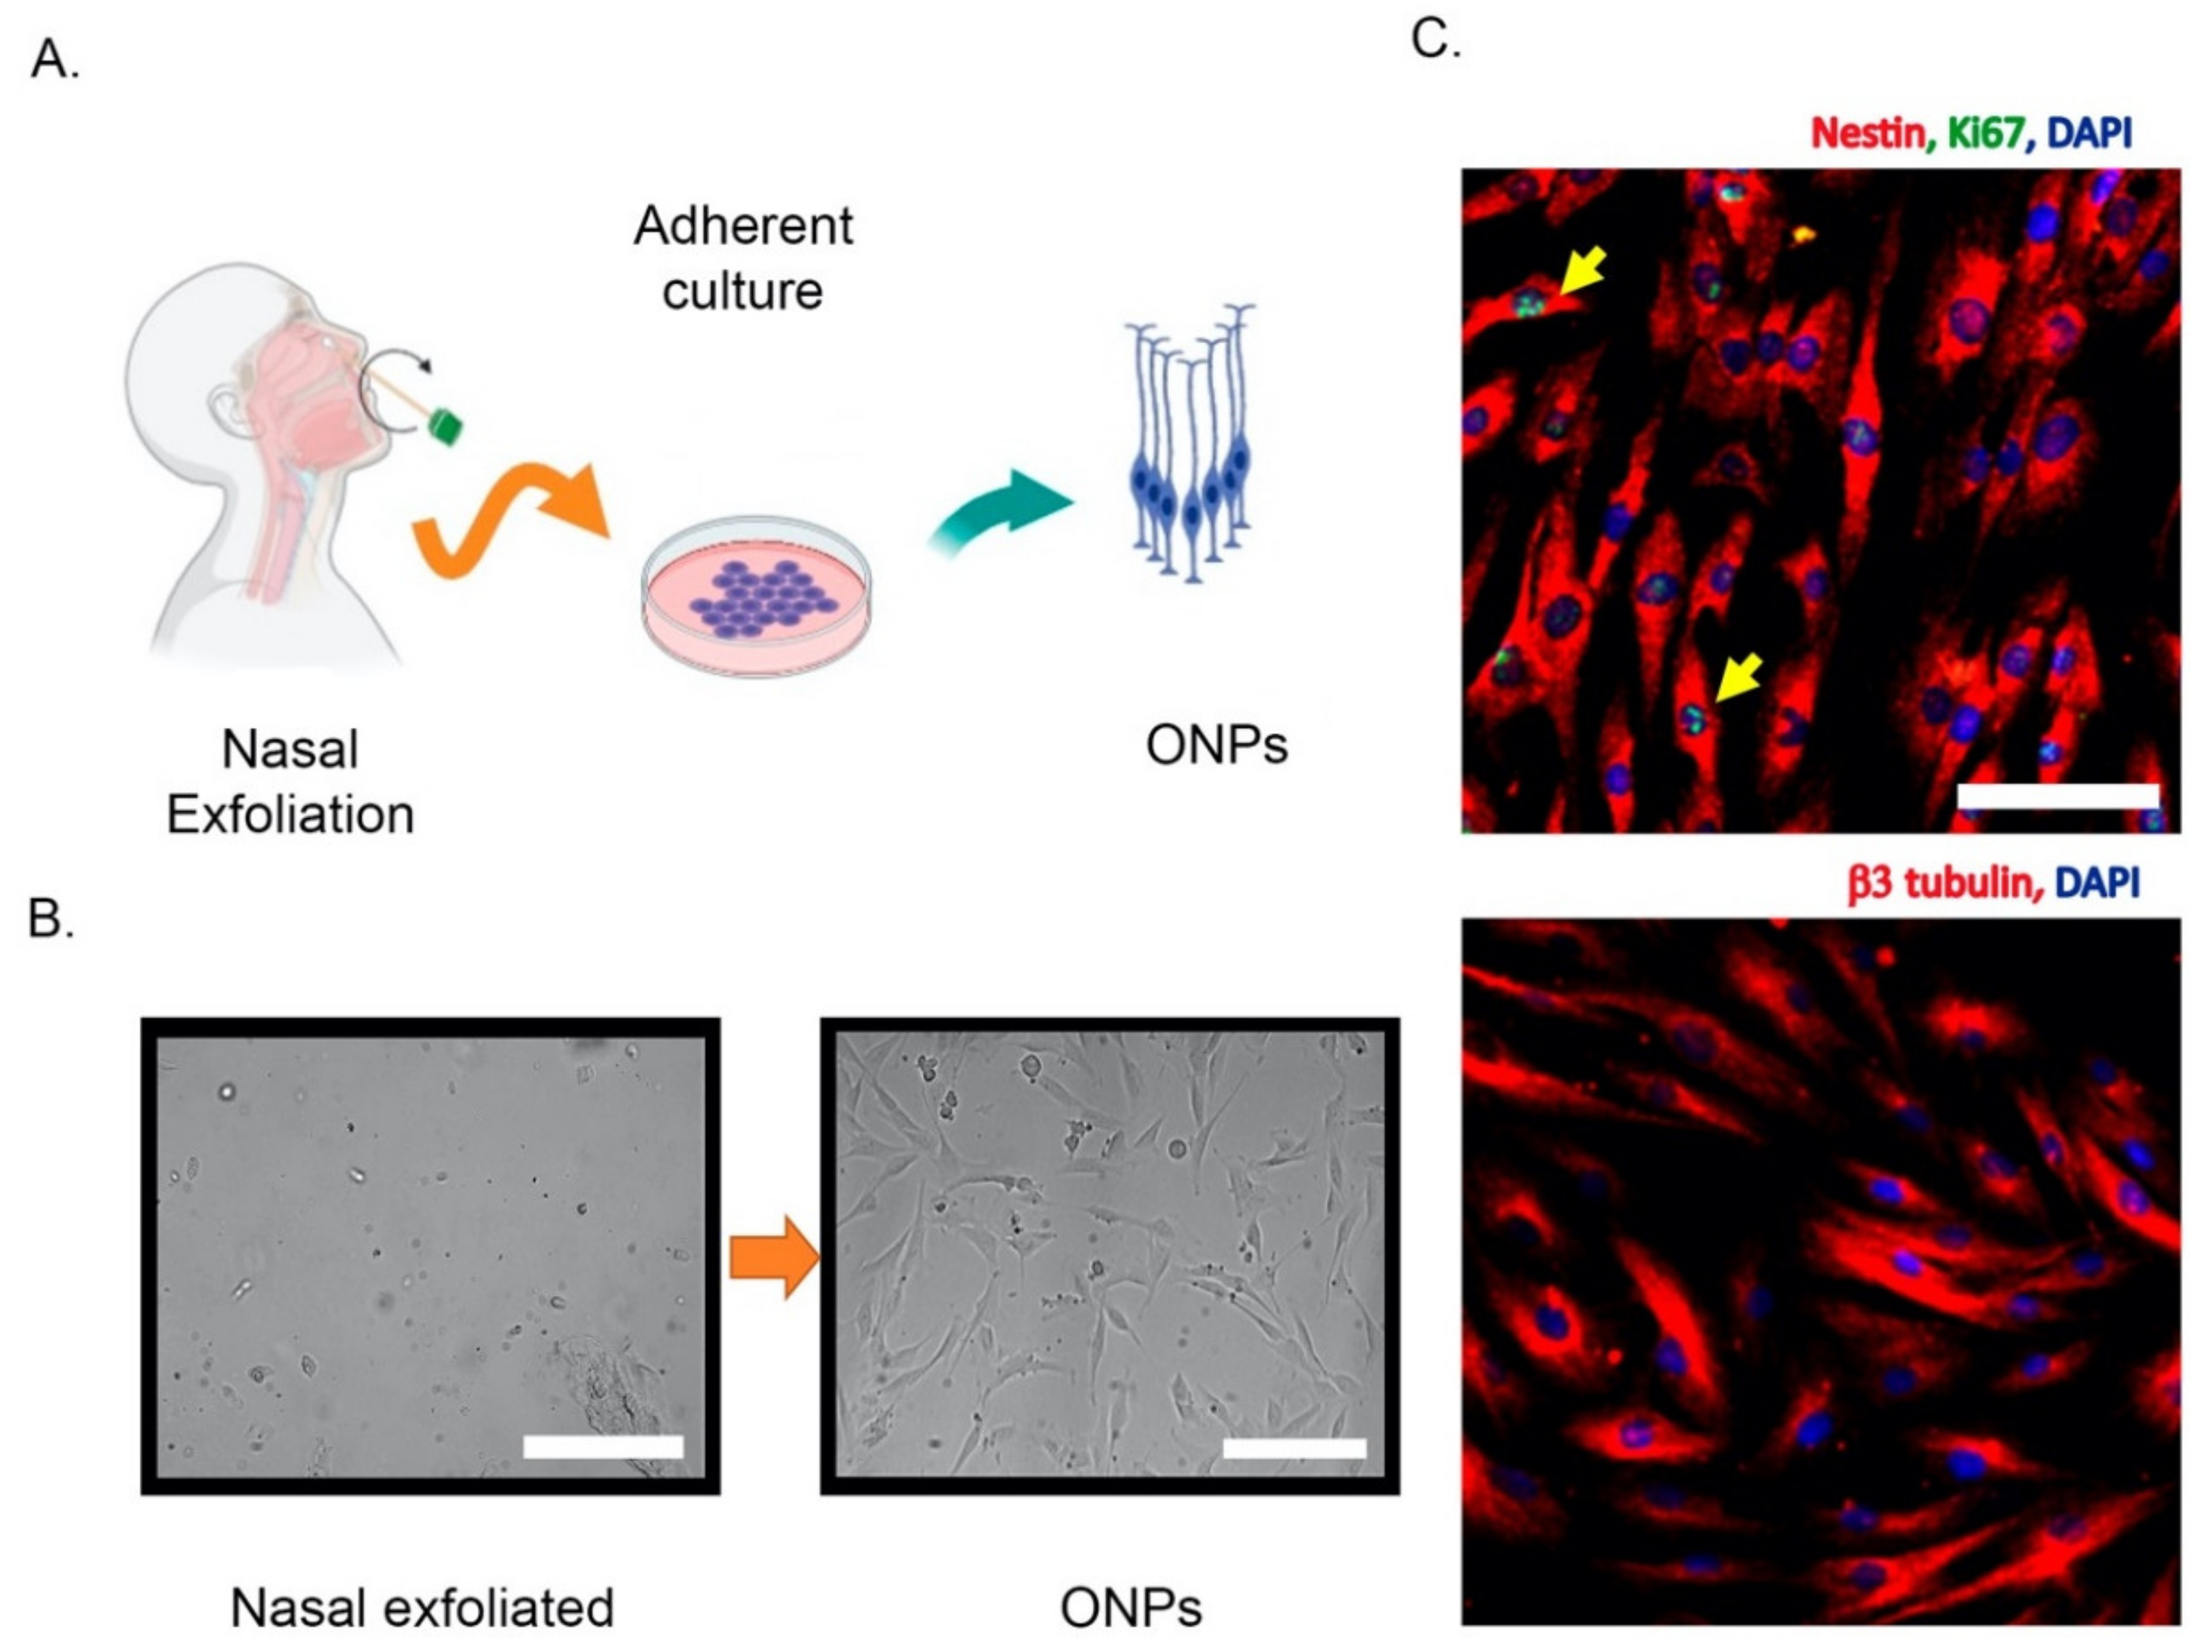
2. Olfactory Neuroepithelium and the Non-Invasive Isolation of ONPs
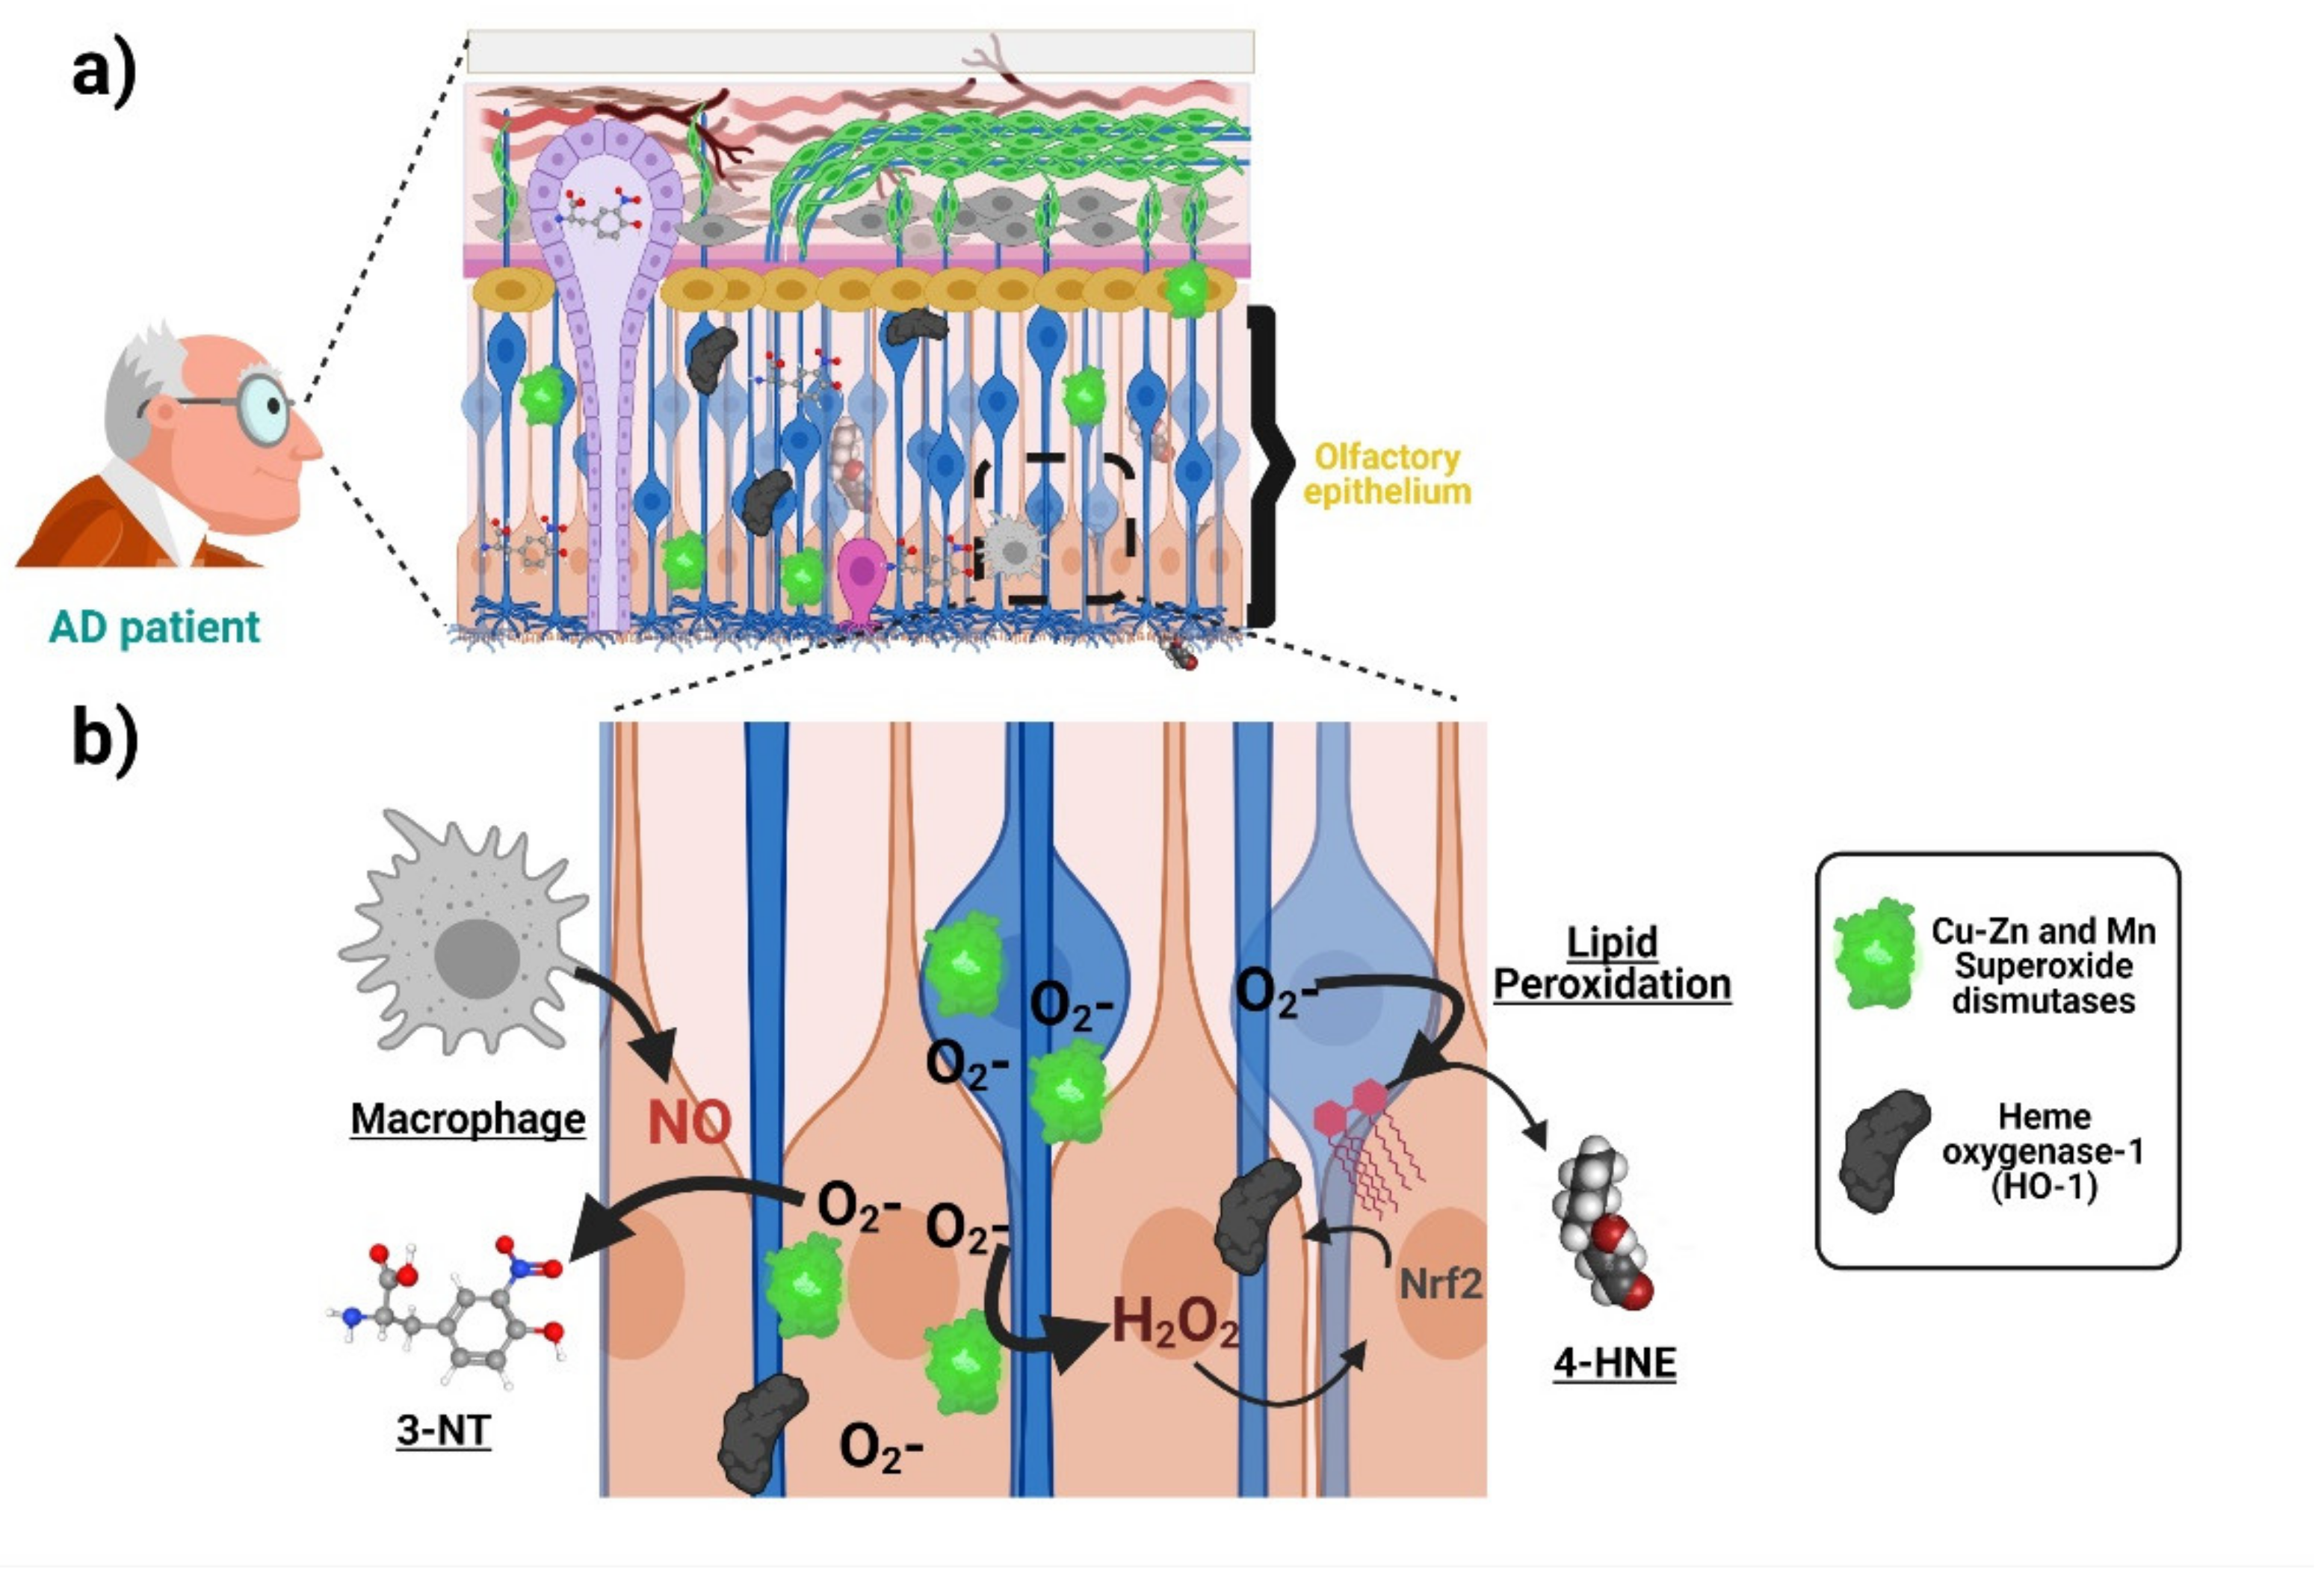
3. Alzheimer’s Disease-Related Oxidative Stress in the Olfactory Epithelium and ONPs
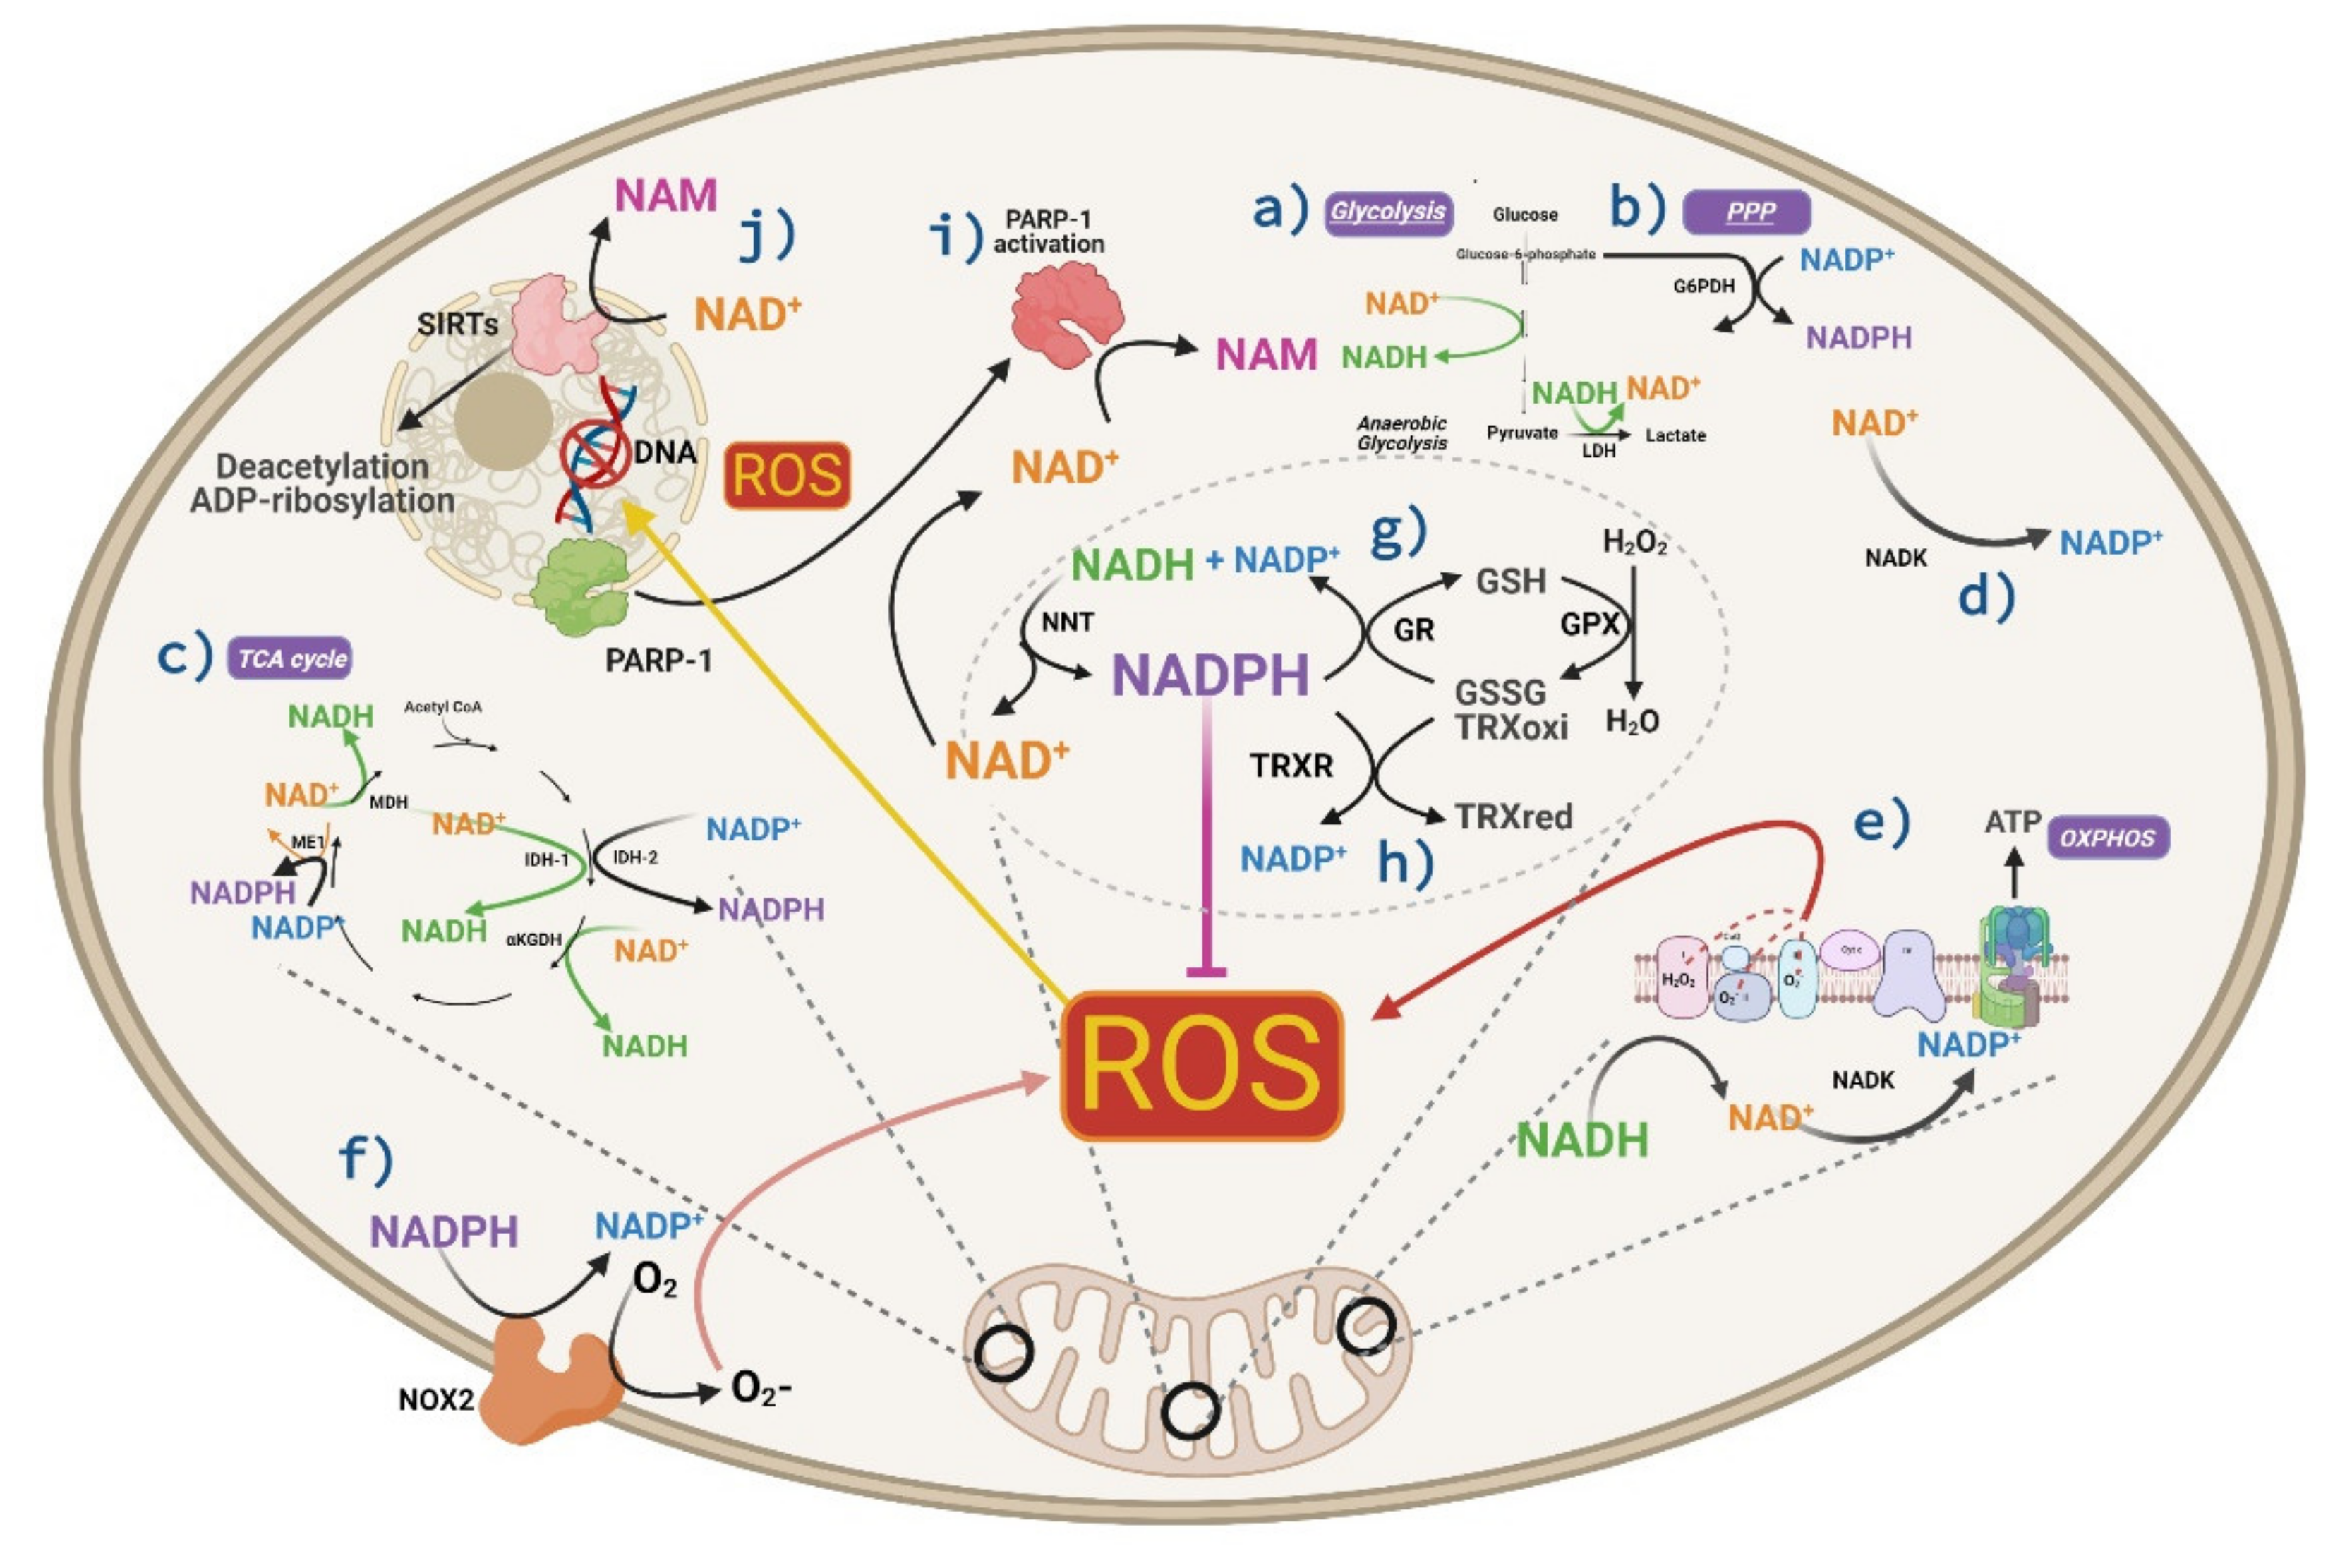
4. The Role of NADH in Cell Metabolism and Antioxidant Defense
5. Analysis of NADH Autofluorescence by FLIM
6. Potential Monitoring of AD Progression through NADH FLIM
7. Perspectives and Future Directions
Author Contributions
Funding
Acknowledgments
Conflicts of Interest
References
- Haque, R.U.; Levey, A.I. Alzheimer’s disease: A clinical perspective and future nonhuman primate research opportunities. Proc. Natl. Acad. Sci. USA 2019. [Google Scholar] [CrossRef] [PubMed] [Green Version]
- Serrano-Pozo, A.; Frosch, M.P.; Masliah, E.; Hyman, B.T. Neuropathological alterations in Alzheimer disease. Cold Spring Harb. Perspect. Med. 2011, 1, a006189. [Google Scholar] [CrossRef] [PubMed]
- Perrin, R.J.; Fagan, A.M.; Holtzman, D.M. Multimodal techniques for diagnosis and prognosis of Alzheimer’s disease. Nature 2009, 461, 916–922. [Google Scholar] [CrossRef]
- Jack, C.R., Jr.; Knopman, D.S.; Jagust, W.J.; Shaw, L.M.; Aisen, P.S.; Weiner, M.W.; Petersen, R.C.; Trojanowski, J.Q. Hypothetical model of dynamic biomarkers of the Alzheimer’s pathological cascade. Lancet. Neurol. 2010, 9, 119–128. [Google Scholar] [CrossRef] [Green Version]
- Trushina, E. Alzheimer’s disease mechanisms in peripheral cells: Promises and challenges. Alzheimer’s Dement. 2019, 5, 652–660. [Google Scholar] [CrossRef] [PubMed]
- Penney, J.; Ralvenius, W.T.; Tsai, L.H. Modeling Alzheimer’s disease with iPSC-derived brain cells. Mol. Psychiatry 2020, 25, 148–167. [Google Scholar] [CrossRef] [PubMed] [Green Version]
- Mackay-Sim, A. Concise review: Patient-derived olfactory stem cells: New models for brain diseases. Stem Cells 2012, 30, 2361–2365. [Google Scholar] [CrossRef]
- Jimenez-Vaca, A.L.; Benitez-King, G.; Ruiz, V.; Ramirez-Rodriguez, G.B.; Hernandez-de la Cruz, B.; Salamanca-Gomez, F.A.; Gonzalez-Marquez, H.; Ramirez-Sanchez, I.; Ortiz-Lopez, L.; Velez-Del Valle, C.; et al. Exfoliated Human Olfactory Neuroepithelium: A Source of Neural Progenitor Cells. Mol. Neurobiol. 2018, 55, 2516–2523. [Google Scholar] [CrossRef]
- Riquelme, A.; Valdes-Tovar, M.; Ugalde, O.; Maya-Ampudia, V.; Fernandez, M.; Mendoza-Duran, L.; Rodriguez-Cardenas, L.; Benitez-King, G. Potential Use of Exfoliated and Cultured Olfactory Neuronal Precursors for In Vivo Alzheimer’s Disease Diagnosis: A Pilot Study. Cell. Mol. Neurobiol. 2020, 40, 87–98. [Google Scholar] [CrossRef]
- Wolozin, B.; Zheng, B.; Loren, D.; Lesch, K.P.; Lebovics, R.S.; Lieberburg, I.; Sunderland, T. Beta/A4 domain of APP: Antigenic differences between cell lines. J. Neurosci. Res. 1992, 33, 189–195. [Google Scholar] [CrossRef]
- Wolozin, B.; Bacic, M.; Merrill, M.J.; Lesch, K.P.; Chen, C.; Lebovics, R.S.; Sunderland, T. Differential expression of carboxyl terminal derivatives of amyloid precursor protein among cell lines. J. Neurosci. Res. 1992, 33, 163–169. [Google Scholar] [CrossRef]
- Butterfield, D.A.; Halliwell, B. Oxidative stress, dysfunctional glucose metabolism and Alzheimer disease. Nat. Rev. Neurosci. 2019, 20, 148–160. [Google Scholar] [CrossRef]
- Nunomura, A.; Perry, G.; Aliev, G.; Hirai, K.; Takeda, A.; Balraj, E.K.; Jones, P.K.; Ghanbari, H.; Wataya, T.; Shimohama, S.; et al. Oxidative damage is the earliest event in Alzheimer disease. J. Neuropathol. Exp. Neurol. 2001, 60, 759–767. [Google Scholar] [CrossRef] [PubMed] [Green Version]
- Smith, M.A.; Nunomura, A.; Lee, H.G.; Zhu, X.; Moreira, P.I.; Avila, J.; Perry, G. Chronological primacy of oxidative stress in Alzheimer disease. Neurobiol. Aging 2005, 26, 579–580. [Google Scholar] [CrossRef]
- Gonzalez-Reyes, R.E.; Nava-Mesa, M.O.; Vargas-Sanchez, K.; Ariza-Salamanca, D.; Mora-Munoz, L. Involvement of Astrocytes in Alzheimer’s Disease from a Neuroinflammatory and Oxidative Stress Perspective. Front. Mol. Neurosci. 2017, 10, 427. [Google Scholar] [CrossRef] [Green Version]
- Habas, A.; Hahn, J.; Wang, X.; Margeta, M. Neuronal activity regulates astrocytic Nrf2 signaling. Proc. Natl. Acad. Sci. USA 2013, 110, 18291–18296. [Google Scholar] [CrossRef] [Green Version]
- Qiu, J.; Dando, O.; Febery, J.A.; Fowler, J.H.; Chandran, S.; Hardingham, G.E. Neuronal Activity and Its Role in Controlling Antioxidant Genes. Int. J. Mol. Sci. 2020, 21, 1933. [Google Scholar] [CrossRef] [Green Version]
- Baxter, P.S.; Hardingham, G.E. Adaptive regulation of the brain’s antioxidant defences by neurons and astrocytes. Free Radic. Biol. Med. 2016, 100, 147–152. [Google Scholar] [CrossRef] [Green Version]
- Araque, A.; Parpura, V.; Sanzgiri, R.P.; Haydon, P.G. Tripartite synapses: Glia, the unacknowledged partner. Trends Neurosci. 1999, 22, 208–215. [Google Scholar] [CrossRef]
- Perea, G.; Navarrete, M.; Araque, A. Tripartite synapses: Astrocytes process and control synaptic information. Trends Neurosci. 2009, 32, 421–431. [Google Scholar] [CrossRef] [PubMed]
- Wang, Q.; Wang, Y.; Shimony, J.S.; Owen, C.J.; Liu, J.; Fagan, A.M.; Cairns, N.J.; Ances, B.; Morris, J.C.; Benzinger, T.L.S. IC-P-172: Simultaneous Quantification of White Matter Abnormalities and Vasogenic Edema in Early Alzheimer Disease. Alzheimer’s Dement. 2016, 12, P125–P126. [Google Scholar] [CrossRef]
- Kitchen, P.; Salman, M.M.; Halsey, A.M.; Clarke-Bland, C.; MacDonald, J.A.; Ishida, H.; Vogel, H.J.; Almutiri, S.; Logan, A.; Kreida, S.; et al. Targeting Aquaporin-4 Subcellular Localization to Treat Central Nervous System Edema. Cell 2020, 181, 784–799. [Google Scholar] [CrossRef]
- Getchell, M.L.; Shah, D.S.; Buch, S.K.; Davis, D.G.; Getchell, T.V. 3-Nitrotyrosine immunoreactivity in olfactory receptor neurons of patients with Alzheimer’s disease: Implications for impaired odor sensitivity. Neurobiol. Aging 2003, 24, 663–673. [Google Scholar] [CrossRef]
- Ghanbari, H.A.; Ghanbari, K.; Harris, P.L.; Jones, P.K.; Kubat, Z.; Castellani, R.J.; Wolozin, B.L.; Smith, M.A.; Perry, G. Oxidative damage in cultured human olfactory neurons from Alzheimer’s disease patients. Aging Cell 2004, 3, 41–44. [Google Scholar] [CrossRef] [PubMed] [Green Version]
- Nelson, V.M.; Dancik, C.M.; Pan, W.; Jiang, Z.G.; Lebowitz, M.S.; Ghanbari, H.A. PAN-811 inhibits oxidative stress-induced cell death of human Alzheimer’s disease-derived and age-matched olfactory neuroepithelial cells via suppression of intracellular reactive oxygen species. J. Alzheimer’s Dis. 2009, 17, 611–619. [Google Scholar] [CrossRef]
- Chance, B. Spectra and reaction kinetics of respiratory pigments of homogenized and intact cells. Nature 1952, 169, 215–221. [Google Scholar] [CrossRef]
- Ghosh, D.; Levault, K.R.; Brewer, G.J. Relative importance of redox buffers GSH and NAD(P)H in age-related neurodegeneration and Alzheimer disease-like mouse neurons. Aging Cell 2014, 13, 631–640. [Google Scholar] [CrossRef] [PubMed]
- Dong, Y.; Sameni, S.; Digman, M.A.; Brewer, G.J. Reversibility of Age-related Oxidized Free NADH Redox States in Alzheimer’s Disease Neurons by Imposed External Cys/CySS Redox Shifts. Sci. Rep. 2019, 9, 11274. [Google Scholar] [CrossRef]
- Ghosh, D.; LeVault, K.R.; Barnett, A.J.; Brewer, G.J. A reversible early oxidized redox state that precedes macromolecular ROS damage in aging nontransgenic and 3xTg-AD mouse neurons. J. Neurosci. Off. J. Soc. Neurosci. 2012, 32, 5821–5832. [Google Scholar] [CrossRef] [Green Version]
- Bradshaw, P.C. Cytoplasmic and Mitochondrial NADPH-Coupled Redox Systems in the Regulation of Aging. Nutrients 2019, 11, 504. [Google Scholar] [CrossRef] [Green Version]
- Schneckenburger, H.; Koenig, K. Fluorescence decay kinetics and imaging of NAD(P)H and flavins as metabolic indicators. Opt. Eng. 1992, 31. [Google Scholar] [CrossRef]
- Lakowicz, J.R.; Szmacinski, H.; Nowaczyk, K.; Johnson, M.L. Fluorescence lifetime imaging of free and protein-bound NADH. Proc. Natl. Acad. Sci. USA 1992, 89, 1271–1275. [Google Scholar] [CrossRef] [PubMed] [Green Version]
- Jafek, B.W. Ultrastructure of human nasal mucosa. Laryngoscope 1983, 93, 1576–1599. [Google Scholar] [CrossRef]
- Moran, D.T.; Rowley, J.C., 3rd; Jafek, B.W.; Lovell, M.A. The fine structure of the olfactory mucosa in man. J. Neurocytol. 1982, 11, 721–746. [Google Scholar] [CrossRef]
- Morrison, E.E.; Costanzo, R.M. Morphology of the human olfactory epithelium. J. Comp. Neurol. 1990, 297, 1–13. [Google Scholar] [CrossRef]
- Verhaagen, J.; Oestreicher, A.B.; Gispen, W.H.; Margolis, F.L. The expression of the growth associated protein B50/GAP43 in the olfactory system of neonatal and adult rats. J. Neurosci. Off. J. Soc. Neurosci. 1989, 9, 683–691. [Google Scholar] [CrossRef] [Green Version]
- Holbrook, E.H.; Wu, E.; Curry, W.T.; Lin, D.T.; Schwob, J.E. Immunohistochemical characterization of human olfactory tissue. Laryngoscope 2011, 121, 1687–1701. [Google Scholar] [CrossRef] [PubMed] [Green Version]
- Fletcher, R.B.; Das, D.; Gadye, L.; Street, K.N.; Baudhuin, A.; Wagner, A.; Cole, M.B.; Flores, Q.; Choi, Y.G.; Yosef, N.; et al. Deconstructing Olfactory Stem Cell Trajectories at Single-Cell Resolution. Cell Stem Cell 2017, 20, 817–830. [Google Scholar] [CrossRef] [Green Version]
- Hahn, C.G.; Han, L.Y.; Rawson, N.E.; Mirza, N.; Borgmann-Winter, K.; Lenox, R.H.; Arnold, S.E. In vivo and in vitro neurogenesis in human olfactory epithelium. J. Comp. Neurol. 2005, 483, 154–163. [Google Scholar] [CrossRef] [PubMed]
- Chen, X.; Fang, H.; Schwob, J.E. Multipotency of purified, transplanted globose basal cells in olfactory epithelium. J. Comp. Neurol. 2004, 469, 457–474. [Google Scholar] [CrossRef] [PubMed]
- Dominici, M.; Le Blanc, K.; Mueller, I.; Slaper-Cortenbach, I.; Marini, F.; Krause, D.; Deans, R.; Keating, A.; Prockop, D.; Horwitz, E. Minimal criteria for defining multipotent mesenchymal stromal cells. The International Society for Cellular Therapy position statement. Cytotherapy 2006, 8, 315–317. [Google Scholar] [CrossRef] [PubMed]
- Delorme, B.; Nivet, E.; Gaillard, J.; Haupl, T.; Ringe, J.; Deveze, A.; Magnan, J.; Sohier, J.; Khrestchatisky, M.; Roman, F.S.; et al. The human nose harbors a niche of olfactory ectomesenchymal stem cells displaying neurogenic and osteogenic properties. Stem Cells Dev. 2010, 19, 853–866. [Google Scholar] [CrossRef]
- Murrell, W.; Feron, F.; Wetzig, A.; Cameron, N.; Splatt, K.; Bellette, B.; Bianco, J.; Perry, C.; Lee, G.; Mackay-Sim, A. Multipotent stem cells from adult olfactory mucosa. Dev. Dyn. Off. Publ. Am. Assoc. Anat. 2005, 233, 496–515. [Google Scholar] [CrossRef]
- Tanos, T.; Saibene, A.M.; Pipolo, C.; Battaglia, P.; Felisati, G.; Rubio, A. Isolation of putative stem cells present in human adult olfactory mucosa. PLoS ONE 2017, 12, e0181151. [Google Scholar] [CrossRef] [Green Version]
- Matigian, N.; Abrahamsen, G.; Sutharsan, R.; Cook, A.L.; Vitale, A.M.; Nouwens, A.; Bellette, B.; An, J.; Anderson, M.; Beckhouse, A.G.; et al. Disease-specific, neurosphere-derived cells as models for brain disorders. Dis. Models Mech. 2010, 3, 785–798. [Google Scholar] [CrossRef] [PubMed] [Green Version]
- Feron, F.; Gepner, B.; Lacassagne, E.; Stephan, D.; Mesnage, B.; Blanchard, M.P.; Boulanger, N.; Tardif, C.; Deveze, A.; Rousseau, S.; et al. Olfactory stem cells reveal MOCOS as a new player in autism spectrum disorders. Mol. Psychiatry 2016, 21, 1215–1224. [Google Scholar] [CrossRef] [PubMed] [Green Version]
- Stewart, R.; Wali, G.; Perry, C.; Lavin, M.F.; Feron, F.; Mackay-Sim, A.; Sutharsan, R. A Patient-Specific Stem Cell Model to Investigate the Neurological Phenotype Observed in Ataxia-Telangiectasia. Methods Mol. Biol. 2017, 1599, 391–400. [Google Scholar] [CrossRef]
- Fan, Y.; Wali, G.; Sutharsan, R.; Bellette, B.; Crane, D.I.; Sue, C.M.; Mackay-Sim, A. Low dose tubulin-binding drugs rescue peroxisome trafficking deficit in patient-derived stem cells in Hereditary Spastic Paraplegia. Biol. Open 2014, 3, 494–502. [Google Scholar] [CrossRef] [Green Version]
- Ayala-Grosso, C.A.; Pieruzzini, R.; Diaz-Solano, D.; Wittig, O.; Abrante, L.; Vargas, L.; Cardier, J. Amyloid-abeta Peptide in olfactory mucosa and mesenchymal stromal cells of mild cognitive impairment and Alzheimer’s disease patients. Brain Pathol. 2015, 25, 136–145. [Google Scholar] [CrossRef]
- Solis-Chagoyan, H.; Flores-Soto, E.; Valdes-Tovar, M.; Cercos, M.G.; Calixto, E.; Montano, L.M.; Barajas-Lopez, C.; Sommer, B.; Aquino-Galvez, A.; Trueta, C.; et al. Purinergic Signaling Pathway in Human Olfactory Neuronal Precursor Cells. Stem Cells Int. 2019, 2019, 2728786. [Google Scholar] [CrossRef]
- Benitez-King, G.; Riquelme, A.; Ortiz-Lopez, L.; Berlanga, C.; Rodriguez-Verdugo, M.S.; Romo, F.; Calixto, E.; Solis-Chagoyan, H.; Jimenez, M.; Montano, L.M.; et al. A non-invasive method to isolate the neuronal linage from the nasal epithelium from schizophrenic and bipolar diseases. J. Neurosci. Methods 2011, 201, 35–45. [Google Scholar] [CrossRef]
- Wolozin, B.; Sunderland, T.; Zheng, B.B.; Resau, J.; Dufy, B.; Barker, J.; Swerdlow, R.; Coon, H. Continuous culture of neuronal cells from adult human olfactory epithelium. J. Mol. Neurosci. Mn 1992, 3, 137–146. [Google Scholar] [CrossRef]
- Gomez, G.; Rawson, N.E.; Hahn, C.G.; Michaels, R.; Restrepo, D. Characteristics of odorant elicited calcium changes in cultured human olfactory neurons. J. Neurosci. Res. 2000, 62, 737–749. [Google Scholar] [CrossRef]
- Yazinski, S.; Gomez, G. Time course of structural and functional maturation of human olfactory epithelial cells in vitro. J. Neurosci. Res. 2014, 92, 64–73. [Google Scholar] [CrossRef]
- Kagan, V.E.; Tyurina, Y.Y.; Sun, W.Y.; Vlasova, I.I.; Dar, H.; Tyurin, V.A.; Amoscato, A.A.; Mallampalli, R.; van der Wel, P.C.A.; He, R.R.; et al. Redox phospholipidomics of enzymatically generated oxygenated phospholipids as specific signals of programmed cell death. Free Radic. Biol. Med. 2020, 147, 231–241. [Google Scholar] [CrossRef] [PubMed]
- Andersen, J.K. Oxidative stress in neurodegeneration: Cause or consequence? Nat. Med. 2004, 10, S18–S25. [Google Scholar] [CrossRef] [PubMed]
- Sutherland, G.T.; Chami, B.; Youssef, P.; Witting, P.K. Oxidative stress in Alzheimer’s disease: Primary villain or physiological by-product? Redox Rep. Commun. Free Radic. Res. 2013, 18, 134–141. [Google Scholar] [CrossRef] [Green Version]
- Butterfield, D.A.; Boyd-Kimball, D. Oxidative Stress, Amyloid-beta Peptide, and Altered Key Molecular Pathways in the Pathogenesis and Progression of Alzheimer’s Disease. J. Alzheimer’s Dis. 2018, 62, 1345–1367. [Google Scholar] [CrossRef] [PubMed] [Green Version]
- Tonnies, E.; Trushina, E. Oxidative Stress, Synaptic Dysfunction, and Alzheimer’s Disease. J. Alzheimer’s Dis. 2017, 57, 1105–1121. [Google Scholar] [CrossRef] [PubMed] [Green Version]
- Kulkarni-Narla, A.; Getchell, T.V.; Schmitt, F.A.; Getchell, M.L. Manganese and copper-zinc superoxide dismutases in the human olfactory mucosa: Increased immunoreactivity in Alzheimer’s disease. Exp. Neurol. 1996, 140, 115–125. [Google Scholar] [CrossRef]
- Chuah, M.I.; Getchell, M.L. Metallothionein in olfactory mucosa of Alzheimer’s disease patients and apoE-deficient mice. Neuroreport 1999, 10, 1919–1924. [Google Scholar] [CrossRef]
- Calhoun-Haney, R.; Murphy, C. Apolipoprotein epsilon4 is associated with more rapid decline in odor identification than in odor threshold or Dementia Rating Scale scores. Brain Cogn. 2005, 58, 178–182. [Google Scholar] [CrossRef] [PubMed]
- Gilbert, P.E.; Murphy, C. The effect of the ApoE epsilon4 allele on recognition memory for olfactory and visual stimuli in patients with pathologically confirmed Alzheimer’s disease, probable Alzheimer’s disease, and healthy elderly controls. J. Clin. Exp. Neuropsychol. 2004, 26, 779–794. [Google Scholar] [CrossRef] [PubMed]
- Wang, Q.S.; Tian, L.; Huang, Y.L.; Qin, S.; He, L.Q.; Zhou, J.N. Olfactory identification and apolipoprotein E epsilon 4 allele in mild cognitive impairment. Brain Res. 2002, 951, 77–81. [Google Scholar] [CrossRef]
- Chen, M.; Lee, H.K.; Moo, L.; Hanlon, E.; Stein, T.; Xia, W. Common proteomic profiles of induced pluripotent stem cell-derived three-dimensional neurons and brain tissue from Alzheimer patients. J. Proteom. 2018, 182, 21–33. [Google Scholar] [CrossRef]
- Ponce, D.P.; Salech, F.; SanMartin, C.D.; Silva, M.; Xiong, C.; Roe, C.M.; Henriquez, M.; Quest, A.F.; Behrens, M.I. Increased susceptibility to oxidative death of lymphocytes from Alzheimer patients correlates with dementia severity. Curr. Alzheimer Res. 2014, 11, 892–898. [Google Scholar] [CrossRef] [Green Version]
- Salech, F.; Ponce, D.P.; SanMartin, C.D.; Rogers, N.K.; Chacon, C.; Henriquez, M.; Behrens, M.I. PARP-1 and p53 Regulate the Increased Susceptibility to Oxidative Death of Lymphocytes from MCI and AD Patients. Front. Aging Neurosci. 2017, 9, 310. [Google Scholar] [CrossRef]
- Tang, K.; Hynan, L.S.; Baskin, F.; Rosenberg, R.N. Platelet amyloid precursor protein processing: A bio-marker for Alzheimer’s disease. J. Neurol. Sci. 2006, 240, 53–58. [Google Scholar] [CrossRef] [Green Version]
- Neumann, K.; Farias, G.; Slachevsky, A.; Perez, P.; Maccioni, R.B. Human platelets tau: A potential peripheral marker for Alzheimer’s disease. J. Alzheimer’s Dis. Jad 2011, 25, 103–109. [Google Scholar] [CrossRef]
- Colciaghi, F.; Marcello, E.; Borroni, B.; Zimmermann, M.; Caltagirone, C.; Cattabeni, F.; Padovani, A.; Di Luca, M. Platelet APP, ADAM 10 and BACE alterations in the early stages of Alzheimer disease. Neurology 2004, 62, 498–501. [Google Scholar] [CrossRef]
- Colciaghi, F.; Borroni, B.; Pastorino, L.; Marcello, E.; Zimmermann, M.; Cattabeni, F.; Padovani, A.; Di Luca, M. [alpha]-Secretase ADAM10 as well as [alpha]APPs is reduced in platelets and CSF of Alzheimer disease patients. Mol. Med. 2002, 8, 67–74. [Google Scholar] [CrossRef] [Green Version]
- Vignini, A.; Sartini, D.; Morganti, S.; Nanetti, L.; Luzzi, S.; Provinciali, L.; Mazzanti, L.; Emanuelli, M. Platelet amyloid precursor protein isoform expression in Alzheimer’s disease: Evidence for peripheral marker. Int. J. Immunopathol. Pharmacol. 2011, 24, 529–534. [Google Scholar] [CrossRef]
- Herrera-Rivero, M.; Soto-Cid, A.; Hernandez, M.E.; Aranda-Abreu, G.E. Tau, APP, NCT and BACE1 in lymphocytes through cognitively normal ageing and neuropathology. An. Da Acad. Bras. De Cienc. 2013, 85, 1489–1496. [Google Scholar] [CrossRef] [Green Version]
- Khan, T.K.; Sen, A.; Hongpaisan, J.; Lim, C.S.; Nelson, T.J.; Alkon, D.L. PKCepsilon deficits in Alzheimer’s disease brains and skin fibroblasts. J. Alzheimer’s Dis. 2015, 43, 491–509. [Google Scholar] [CrossRef] [PubMed]
- Sproul, A.A.; Jacob, S.; Pre, D.; Kim, S.H.; Nestor, M.W.; Navarro-Sobrino, M.; Santa-Maria, I.; Zimmer, M.; Aubry, S.; Steele, J.W.; et al. Characterization and molecular profiling of PSEN1 familial Alzheimer’s disease iPSC-derived neural progenitors. PLoS ONE 2014, 9, e84547. [Google Scholar] [CrossRef]
- Muratore, C.R.; Rice, H.C.; Srikanth, P.; Callahan, D.G.; Shin, T.; Benjamin, L.N.; Walsh, D.M.; Selkoe, D.J.; Young-Pearse, T.L. The familial Alzheimer’s disease APPV717I mutation alters APP processing and Tau expression in iPSC-derived neurons. Hum. Mol. Genet. 2014, 23, 3523–3536. [Google Scholar] [CrossRef] [Green Version]
- Hu, N.W.; Corbett, G.T.; Moore, S.; Klyubin, I.; O’Malley, T.T.; Walsh, D.M.; Livesey, F.J.; Rowan, M.J. Extracellular Forms of Abeta and Tau from iPSC Models of Alzheimer’s Disease Disrupt Synaptic Plasticity. Cell Rep. 2018, 23, 1932–1938. [Google Scholar] [CrossRef] [PubMed]
- Bosetti, F.; Brizzi, F.; Barogi, S.; Mancuso, M.; Siciliano, G.; Tendi, E.A.; Murri, L.; Rapoport, S.I.; Solaini, G. Cytochrome c oxidase and mitochondrial F1F0-ATPase (ATP synthase) activities in platelets and brain from patients with Alzheimer’s disease. Neurobiol. Aging 2002, 23, 371–376. [Google Scholar] [CrossRef]
- Cardoso, S.M.; Proenca, M.T.; Santos, S.; Santana, I.; Oliveira, C.R. Cytochrome c oxidase is decreased in Alzheimer’s disease platelets. Neurobiol. Aging 2004, 25, 105–110. [Google Scholar] [CrossRef]
- Leuner, K.; Schulz, K.; Schutt, T.; Pantel, J.; Prvulovic, D.; Rhein, V.; Savaskan, E.; Czech, C.; Eckert, A.; Muller, W.E. Peripheral mitochondrial dysfunction in Alzheimer’s disease: Focus on lymphocytes. Mol. Neurobiol. 2012, 46, 194–204. [Google Scholar] [CrossRef] [PubMed]
- Sims, N.R.; Finegan, J.M.; Blass, J.P. Altered metabolic properties of cultured skin fibroblasts in Alzheimer’s disease. Ann. Neurol. 1987, 21, 451–457. [Google Scholar] [CrossRef] [PubMed]
- Perez, M.J.; Ponce, D.P.; Osorio-Fuentealba, C.; Behrens, M.I.; Quintanilla, R.A. Mitochondrial Bioenergetics Is Altered in Fibroblasts from Patients with Sporadic Alzheimer’s Disease. Front. Neurosci. 2017, 11, 553. [Google Scholar] [CrossRef] [PubMed]
- Martin-Maestro, P.; Gargini, R.; Garcia, E.; Perry, G.; Avila, J.; Garcia-Escudero, V. Slower Dynamics and Aged Mitochondria in Sporadic Alzheimer’s Disease. Oxidative Med. Cell. Longev. 2017, 2017, 9302761. [Google Scholar] [CrossRef] [Green Version]
- Birnbaum, J.H.; Wanner, D.; Gietl, A.F.; Saake, A.; Kundig, T.M.; Hock, C.; Nitsch, R.M.; Tackenberg, C. Oxidative stress and altered mitochondrial protein expression in the absence of amyloid-beta and tau pathology in iPSC-derived neurons from sporadic Alzheimer’s disease patients. Stem Cell Res. 2018, 27, 121–130. [Google Scholar] [CrossRef] [PubMed]
- Martin-Maestro, P.; Gargini, R.; Sproul, A.A.; Garcia, E.; Anton, L.C.; Noggle, S.; Arancio, O.; Avila, J.; Garcia-Escudero, V. Mitophagy Failure in Fibroblasts and iPSC-Derived Neurons of Alzheimer’s Disease-Associated Presenilin 1 Mutation. Front. Mol. Neurosci. 2017, 10, 291. [Google Scholar] [CrossRef] [Green Version]
- Li, L.; Roh, J.H.; Kim, H.J.; Park, H.J.; Kim, M.; Koh, W.; Heo, H.; Chang, J.W.; Nakanishi, M.; Yoon, T.; et al. The First Generation of iPSC Line from a Korean Alzheimer’s Disease Patient Carrying APP-V715M Mutation Exhibits a Distinct Mitochondrial Dysfunction. Exp. Neurobiol. 2019, 28, 329–336. [Google Scholar] [CrossRef] [PubMed]
- Repetto, M.G.; Reides, C.G.; Evelson, P.; Kohan, S.; de Lustig, E.S.; Llesuy, S.F. Peripheral markers of oxidative stress in probable Alzheimer patients. Eur. J. Clin. Investig. 1999, 29, 643–649. [Google Scholar] [CrossRef]
- Kawamoto, E.M.; Munhoz, C.D.; Glezer, I.; Bahia, V.S.; Caramelli, P.; Nitrini, R.; Gorjao, R.; Curi, R.; Scavone, C.; Marcourakis, T. Oxidative state in platelets and erythrocytes in aging and Alzheimer’s disease. Neurobiol. Aging 2005, 26, 857–864. [Google Scholar] [CrossRef] [PubMed]
- Ihara, Y.; Hayabara, T.; Sasaki, K.; Kawada, R.; Nakashima, Y.; Kuroda, S. Relationship between oxidative stress and apoE phenotype in Alzheimer’s disease. Acta Neurol. Scand. 2000, 102, 346–349. [Google Scholar] [CrossRef]
- Ascolani, A.; Balestrieri, E.; Minutolo, A.; Mosti, S.; Spalletta, G.; Bramanti, P.; Mastino, A.; Caltagirone, C.; Macchi, B. Dysregulated NF-kappaB pathway in peripheral mononuclear cells of Alzheimer’s disease patients. Curr. Alzheimer Res. 2012, 9, 128–137. [Google Scholar] [CrossRef]
- Behrens, M.I.; Silva, M.; Salech, F.; Ponce, D.P.; Merino, D.; Sinning, M.; Xiong, C.; Roe, C.M.; Quest, A.F. Inverse susceptibility to oxidative death of lymphocytes obtained from Alzheimer’s patients and skin cancer survivors: Increased apoptosis in Alzheimer’s and reduced necrosis in cancer. J. Gerontol. Ser. ABiol. Sci. Med Sci. 2012, 67, 1036–1040. [Google Scholar] [CrossRef] [Green Version]
- Cecchi, C.; Fiorillo, C.; Sorbi, S.; Latorraca, S.; Nacmias, B.; Bagnoli, S.; Nassi, P.; Liguri, G. Oxidative stress and reduced antioxidant defenses in peripheral cells from familial Alzheimer’s patients. Free Radic. Biol. Med. 2002, 33, 1372–1379. [Google Scholar] [CrossRef]
- Cecchi, C.; Fiorillo, C.; Baglioni, S.; Pensalfini, A.; Bagnoli, S.; Nacmias, B.; Sorbi, S.; Nosi, D.; Relini, A.; Liguri, G. Increased susceptibility to amyloid toxicity in familial Alzheimer’s fibroblasts. Neurobiol. Aging 2007, 28, 863–876. [Google Scholar] [CrossRef] [PubMed]
- Choi, J.; Malakowsky, C.A.; Talent, J.M.; Conrad, C.C.; Carroll, C.A.; Weintraub, S.T.; Gracy, R.W. Anti-apoptotic proteins are oxidized by Abeta25-35 in Alzheimer’s fibroblasts. Biochim. Et Biophys. Acta 2003, 1637, 135–141. [Google Scholar] [CrossRef] [Green Version]
- Mota, S.I.; Costa, R.O.; Ferreira, I.L.; Santana, I.; Caldeira, G.L.; Padovano, C.; Fonseca, A.C.; Baldeiras, I.; Cunha, C.; Letra, L.; et al. Oxidative stress involving changes in Nrf2 and ER stress in early stages of Alzheimer’s disease. Biochim. Et Biophys. Acta 2015, 1852, 1428–1441. [Google Scholar] [CrossRef] [Green Version]
- Piccini, A.; Fassio, A.; Pasqualetto, E.; Vitali, A.; Borghi, R.; Palmieri, D.; Nacmias, B.; Sorbi, S.; Sitia, R.; Tabaton, M. Fibroblasts from FAD-linked presenilin 1 mutations display a normal unfolded protein response but overproduce Abeta42 in response to tunicamycin. Neurobiol. Dis. 2004, 15, 380–386. [Google Scholar] [CrossRef] [PubMed]
- Martins, S.; Muller-Schiffmann, A.; Erichsen, L.; Bohndorf, M.; Wruck, W.; Sleegers, K.; Van Broeckhoven, C.; Korth, C.; Adjaye, J. IPSC-Derived Neuronal Cultures Carrying the Alzheimer’s Disease Associated TREM2 R47H Variant Enables the Construction of an Abeta-Induced Gene Regulatory Network. Int. J. Mol. Sci. 2020, 21, 4516. [Google Scholar] [CrossRef]
- Kondo, T.; Asai, M.; Tsukita, K.; Kutoku, Y.; Ohsawa, Y.; Sunada, Y.; Imamura, K.; Egawa, N.; Yahata, N.; Okita, K.; et al. Modeling Alzheimer’s disease with iPSCs reveals stress phenotypes associated with intracellular Abeta and differential drug responsiveness. Cell Stem Cell 2013, 12, 487–496. [Google Scholar] [CrossRef] [Green Version]
- Blacker, T.S.; Duchen, M.R. Investigating mitochondrial redox state using NADH and NADPH autofluorescence. Free Radic. Biol. Med. 2016, 100, 53–65. [Google Scholar] [CrossRef] [Green Version]
- Xiao, W.; Wang, R.S.; Handy, D.E.; Loscalzo, J. NAD(H) and NADP(H) Redox Couples and Cellular Energy Metabolism. Antioxid. Redox Signal. 2018, 28, 251–272. [Google Scholar] [CrossRef]
- Jesko, H.; Wencel, P.; Strosznajder, R.P.; Strosznajder, J.B. Sirtuins and Their Roles in Brain Aging and Neurodegenerative Disorders. Neurochem. Res. 2017, 42, 876–890. [Google Scholar] [CrossRef] [PubMed] [Green Version]
- Manjula, R.; Anuja, K.; Alcain, F.J. SIRT1 and SIRT2 Activity Control in Neurodegenerative Diseases. Front. Pharmacol. 2020, 11, 585821. [Google Scholar] [CrossRef] [PubMed]
- Salech, F.; Ponce, D.P.; Paula-Lima, A.C.; SanMartin, C.D.; Behrens, M.I. Nicotinamide, a Poly [ADP-Ribose] Polymerase 1 (PARP-1) Inhibitor, as an Adjunctive Therapy for the Treatment of Alzheimer’s Disease. Front. Aging Neurosci. 2020, 12, 255. [Google Scholar] [CrossRef] [PubMed]
- Holmstrom, K.M.; Finkel, T. Cellular mechanisms and physiological consequences of redox-dependent signalling. Nat. Rev. Mol. Cell Biol. 2014, 15, 411–421. [Google Scholar] [CrossRef] [PubMed]
- Datta, R.; Heaster, T.M.; Sharick, J.T.; Gillette, A.A.; Skala, M.C. Fluorescence lifetime imaging microscopy: Fundamentals and advances in instrumentation, analysis, and applications. J. Biomed. Opt. 2020, 25, 1–43. [Google Scholar] [CrossRef]
- Bordone, M.P.; Salman, M.M.; Titus, H.E.; Amini, E.; Andersen, J.V.; Chakraborti, B.; Diuba, A.V.; Dubouskaya, T.G.; Ehrke, E.; Espindola de Freitas, A.; et al. The energetic brain—A review from students to students. J. Neurochem. 2019, 151, 139–165. [Google Scholar] [CrossRef]
- Pellerin, L.; Magistretti, P.J. Glutamate uptake into astrocytes stimulates aerobic glycolysis: A mechanism coupling neuronal activity to glucose utilization. Proc. Natl. Acad. Sci. USA 1994, 91, 10625–10629. [Google Scholar] [CrossRef] [PubMed] [Green Version]
- Barros, L.F. Metabolic signaling by lactate in the brain. Trends Neurosci. 2013, 36, 396–404. [Google Scholar] [CrossRef] [PubMed]
- Vergara, R.C.; Jaramillo-Riveri, S.; Luarte, A.; Moenne-Loccoz, C.; Fuentes, R.; Couve, A.; Maldonado, P.E. The Energy Homeostasis Principle: Neuronal Energy Regulation Drives Local Network Dynamics Generating Behavior. Front. Comput. Neurosci. 2019, 13, 49. [Google Scholar] [CrossRef] [PubMed] [Green Version]
- Diaz-Garcia, C.M.; Mongeon, R.; Lahmann, C.; Koveal, D.; Zucker, H.; Yellen, G. Neuronal Stimulation Triggers Neuronal Glycolysis and Not Lactate Uptake. Cell Metab. 2017, 26, 361–374. [Google Scholar] [CrossRef]
- Bak, L.K.; Walls, A.B.; Schousboe, A.; Ring, A.; Sonnewald, U.; Waagepetersen, H.S. Neuronal glucose but not lactate utilization is positively correlated with NMDA-induced neurotransmission and fluctuations in cytosolic Ca2+ levels. J. Neurochem. 2009, 109 Suppl 1, 87–93. [Google Scholar] [CrossRef]
- Chen, L.; Zhang, Z.; Hoshino, A.; Zheng, H.D.; Morley, M.; Arany, Z.; Rabinowitz, J.D. NADPH production by the oxidative pentose-phosphate pathway supports folate metabolism. Nat. Metab. 2019, 1, 404–415. [Google Scholar] [CrossRef]
- Bolanos, J.P.; Almeida, A. The pentose-phosphate pathway in neuronal survival against nitrosative stress. IUBMB Life 2010, 62, 14–18. [Google Scholar] [CrossRef] [PubMed]
- Rydstrom, J. Mitochondrial NADPH, transhydrogenase and disease. Biochim. Biophys. Acta 2006, 1757, 721–726. [Google Scholar] [CrossRef] [Green Version]
- Lopert, P.; Patel, M. Nicotinamide nucleotide transhydrogenase (Nnt) links the substrate requirement in brain mitochondria for hydrogen peroxide removal to the thioredoxin/peroxiredoxin (Trx/Prx) system. J. Biol. Chem. 2014, 289, 15611–15620. [Google Scholar] [CrossRef] [Green Version]
- Ying, W. NAD+/NADH and NADP+/NADPH in cellular functions and cell death: Regulation and biological consequences. Antioxid. Redox Signal. 2008, 10, 179–206. [Google Scholar] [CrossRef] [PubMed] [Green Version]
- Sies, H.; Berndt, C.; Jones, D.P. Oxidative Stress. Annu. Rev. Biochem. 2017, 86, 715–748. [Google Scholar] [CrossRef] [PubMed]
- Brolin, S.E.; Naeser, P. Bioluminescence analysis of NAD(P)H and NAD(P)+ preventing mutual interference by selective nucleotide destruction and enhanced specific light emission. J. Biochem. Biophys. Methods 1992, 25, 149–162. [Google Scholar] [CrossRef]
- Bernofsky, C.; Swan, M. An improved cycling assay for nicotinamide adenine dinucleotide. Anal. Biochem. 1973, 53, 452–458. [Google Scholar] [CrossRef]
- Grant, R.S.; Kapoor, V. Murine glial cells regenerate NAD, after peroxide-induced depletion, using either nicotinic acid, nicotinamide, or quinolinic acid as substrates. J. Neurochem. 1998, 70, 1759–1763. [Google Scholar] [CrossRef]
- Yu, Q.; Pourmandi, N.; Xue, L.; Gondrand, C.; Fabritz, S.; Bardy, D.; Patiny, L.; Katsyuba, E.; Auwerx, J.; Johnsson, K. A biosensor for measuring NAD(+) levels at the point of care. Nat. Metab. 2019, 1, 1219–1225. [Google Scholar] [CrossRef] [PubMed]
- Casabona, G.; Sturiale, L.; L’Episcopo, M.R.; Raciti, G.; Fazzio, A.; Sarpietro, M.G.; Genazzani, A.A.; Cambria, A.; Nicoletti, F. HPLC analysis of cyclic adenosine diphosphate ribose and adenosine diphosphate ribose: Determination of NAD+ metabolites in hippocampal membranes. Ital. J. Biochem. 1995, 44, 258–268. [Google Scholar]
- Trammell, S.A.; Brenner, C. Targeted, LCMS-based Metabolomics for Quantitative Measurement of NAD(+) Metabolites. Comput. Struct. Biotechnol. J. 2013, 4, e201301012. [Google Scholar] [CrossRef] [Green Version]
- Evans, J.; Wang, T.C.; Heyes, M.P.; Markey, S.P. LC/MS analysis of NAD biosynthesis using stable isotope pyridine precursors. Anal. Biochem. 2002, 306, 197–203. [Google Scholar] [CrossRef] [PubMed]
- Yamada, K.; Hara, N.; Shibata, T.; Osago, H.; Tsuchiya, M. The simultaneous measurement of nicotinamide adenine dinucleotide and related compounds by liquid chromatography/electrospray ionization tandem mass spectrometry. Anal. Biochem. 2006, 352, 282–285. [Google Scholar] [CrossRef]
- Bustamante, S.; Jayasena, T.; Richani, D.; Gilchrist, R.B.; Wu, L.E.; Sinclair, D.A.; Sachdev, P.S.; Braidy, N. Quantifying the cellular NAD+ metabolome using a tandem liquid chromatography mass spectrometry approach. Metab. Off. J. Metab. Soc. 2017, 14, 15. [Google Scholar] [CrossRef]
- Zhao, Y.; Yang, Y. Profiling metabolic states with genetically encoded fluorescent biosensors for NADH. Curr. Opin. Biotechnol. 2015, 31, 86–92. [Google Scholar] [CrossRef] [PubMed]
- Cohen, M.S.; Stewart, M.L.; Goodman, R.H.; Cambronne, X.A. Methods for Using a Genetically Encoded Fluorescent Biosensor to Monitor Nuclear NAD. Methods Mol. Biol. 2018, 1813, 391–414. [Google Scholar] [CrossRef]
- Zhu, X.H.; Lu, M.; Lee, B.Y.; Ugurbil, K.; Chen, W. In vivo NAD assay reveals the intracellular NAD contents and redox state in healthy human brain and their age dependences. Proc. Natl. Acad. Sci. USA 2015, 112, 2876–2881. [Google Scholar] [CrossRef] [Green Version]
- Reinert, K.C.; Dunbar, R.L.; Gao, W.; Chen, G.; Ebner, T.J. Flavoprotein autofluorescence imaging of neuronal activation in the cerebellar cortex in vivo. J. Neurophysiol. 2004, 92, 199–211. [Google Scholar] [CrossRef] [PubMed] [Green Version]
- Chance, B.; Schoener, B.; Oshino, R.; Itshak, F.; Nakase, Y. Oxidation-reduction ratio studies of mitochondria in freeze-trapped samples. NADH and flavoprotein fluorescence signals. J. Biol. Chem. 1979, 254, 4764–4771. [Google Scholar] [CrossRef]
- Yaseen, M.A.; Sakadzic, S.; Wu, W.; Becker, W.; Kasischke, K.A.; Boas, D.A. In vivo imaging of cerebral energy metabolism with two-photon fluorescence lifetime microscopy of NADH. Biomed. Opt. Express 2013, 4, 307–321. [Google Scholar] [CrossRef] [PubMed] [Green Version]
- Becker, W.; Bergmann, A.; Biscotti, G.; Rueck, A. Advanced Time-Correlated Single Photon Counting Techniques for Spectroscopy and Imaging in Biomedical Systems; SPIE: Bellingham, WA, USA, 2004; Volume 5340. [Google Scholar]
- Sharick, J.T.; Favreau, P.F.; Gillette, A.A.; Sdao, S.M.; Merrins, M.J.; Skala, M.C. Protein-bound NAD(P)H Lifetime is Sensitive to Multiple Fates of Glucose Carbon. Sci. Rep. 2018, 8, 5456. [Google Scholar] [CrossRef] [PubMed]
- Gomez, C.A.; Fu, B.; Sakadzic, S.; Yaseen, M.A. Cerebral metabolism in a mouse model of Alzheimer’s disease characterized by two-photon fluorescence lifetime microscopy of intrinsic NADH. Neurophotonics 2018, 5, 045008. [Google Scholar] [CrossRef] [PubMed]
- Ranjit, S.; Malacrida, L.; Stakic, M.; Gratton, E. Determination of the metabolic index using the fluorescence lifetime of free and bound nicotinamide adenine dinucleotide using the phasor approach. J. Biophotonics 2019, 12, e201900156. [Google Scholar] [CrossRef]
- Blacker, T.S.; Mann, Z.F.; Gale, J.E.; Ziegler, M.; Bain, A.J.; Szabadkai, G.; Duchen, M.R. Separating NADH and NADPH fluorescence in live cells and tissues using FLIM. Nat. Commun. 2014, 5, 3936. [Google Scholar] [CrossRef] [PubMed] [Green Version]
- Ranjit, S.; Malacrida, L.; Jameson, D.M.; Gratton, E. Fit-free analysis of fluorescence lifetime imaging data using the phasor approach. Nat. Protoc. 2018, 13, 1979–2004. [Google Scholar] [CrossRef]
- Evers, M.; Salma, N.; Osseiran, S.; Casper, M.; Birngruber, R.; Evans, C.L.; Manstein, D. Enhanced quantification of metabolic activity for individual adipocytes by label-free FLIM. Sci. Rep. 2018, 8, 8757. [Google Scholar] [CrossRef]
- Blacker, T.S.; Sewell, M.D.E.; Szabadkai, G.; Duchen, M.R. Metabolic Profiling of Live Cancer Tissues Using NAD(P)H Fluorescence Lifetime Imaging. Methods Mol. Biol. 2019, 1928, 365–387. [Google Scholar] [CrossRef]
- Stringari, C.; Nourse, J.L.; Flanagan, L.A.; Gratton, E. Phasor fluorescence lifetime microscopy of free and protein-bound NADH reveals neural stem cell differentiation potential. PLoS ONE 2012, 7, e48014. [Google Scholar] [CrossRef] [Green Version]
- Dong, Y.; Brewer, G.J. Global Metabolic Shifts in Age and Alzheimer’s Disease Mouse Brains Pivot at NAD+/NADH Redox Sites. J. Alzheimer’s Dis. 2019, 71, 119–140. [Google Scholar] [CrossRef] [PubMed] [Green Version]
- Hou, Y.; Lautrup, S.; Cordonnier, S.; Wang, Y.; Croteau, D.L.; Zavala, E.; Zhang, Y.; Moritoh, K.; O’Connell, J.F.; Baptiste, B.A.; et al. NAD(+) supplementation normalizes key Alzheimer’s features and DNA damage responses in a new AD mouse model with introduced DNA repair deficiency. Proc. Natl. Acad. Sci. USA 2018, 115, E1876–E1885. [Google Scholar] [CrossRef] [Green Version]
- Alano, C.C.; Garnier, P.; Ying, W.; Higashi, Y.; Kauppinen, T.M.; Swanson, R.A. NAD+ depletion is necessary and sufficient for poly(ADP-ribose) polymerase-1-mediated neuronal death. J. Neurosci. Off. J. Soc. Neurosci. 2010, 30, 2967–2978. [Google Scholar] [CrossRef]
- Abeti, R.; Abramov, A.Y.; Duchen, M.R. Beta-amyloid activates PARP causing astrocytic metabolic failure and neuronal death. Brain: A J. Neurol. 2011, 134, 1658–1672. [Google Scholar] [CrossRef] [PubMed] [Green Version]
- Dong, Y.; Digman, M.A.; Brewer, G.J. Age- and AD-related redox state of NADH in subcellular compartments by fluorescence lifetime imaging microscopy. GeroScience 2019, 41, 51–67. [Google Scholar] [CrossRef] [Green Version]
- Covarrubias, A.J.; Perrone, R.; Grozio, A.; Verdin, E. NAD(+) metabolism and its roles in cellular processes during ageing. Nat. Rev. Mol. Cell Biol. 2021, 22, 119–141. [Google Scholar] [CrossRef]
- Vial, M.L.; Zencak, D.; Grkovic, T.; Gorse, A.D.; Mackay-Sim, A.; Mellick, G.D.; Wood, S.A.; Quinn, R.J. A Grand Challenge. 2. Phenotypic Profiling of a Natural Product Library on Parkinson’s Patient-Derived Cells. J. Nat. Prod. 2016, 79, 1982–1989. [Google Scholar] [CrossRef] [PubMed] [Green Version]
- Aldewachi, H.; Al-Zidan, R.N.; Conner, M.T.; Salman, M.M. High-Throughput Screening Platforms in the Discovery of Novel Drugs for Neurodegenerative Diseases. Bioengineering 2021, 8, 30. [Google Scholar] [CrossRef]
- Perez Del Palacio, J.; Diaz, C.; de la Cruz, M.; Annang, F.; Martin, J.; Perez-Victoria, I.; Gonzalez-Menendez, V.; de Pedro, N.; Tormo, J.R.; Algieri, F.; et al. High-Throughput Screening Platform for the Discovery of New Immunomodulator Molecules from Natural Product Extract Libraries. J. Biomol. Screen. 2016, 21, 567–578. [Google Scholar] [CrossRef]
- Choi, S.H.; Kim, Y.H.; Quinti, L.; Tanzi, R.E.; Kim, D.Y. 3D culture models of Alzheimer’s disease: A road map to a “cure-in-a-dish”. Mol. Neurodegener. 2016, 11, 75. [Google Scholar] [CrossRef] [PubMed] [Green Version]
- LaBarbera, K.M.; Limegrover, C.; Rehak, C.; Yurko, R.; Izzo, N.J.; Knezovich, N.; Watto, E.; Waybright, L.; Catalano, S.M. Modeling the mature CNS: A predictive screening platform for neurodegenerative disease drug discovery. J. Neurosci. Methods 2021. [Google Scholar] [CrossRef]
- Seyb, K.I.; Schuman, E.R.; Ni, J.; Huang, M.M.; Michaelis, M.L.; Glicksman, M.A. Identification of small molecule inhibitors of beta-amyloid cytotoxicity through a cell-based high-throughput screening platform. J. Biomol. Screen. 2008, 13, 870–878. [Google Scholar] [CrossRef] [PubMed] [Green Version]
- Hou, X.Q.; Yan, R.; Yang, C.; Zhang, L.; Su, R.Y.; Liu, S.J.; Zhang, S.J.; He, W.Q.; Fang, S.H.; Cheng, S.Y.; et al. A novel assay for high-throughput screening of anti-Alzheimer’s disease drugs to determine their efficacy by real-time monitoring of changes in PC12 cell proliferation. Int. J. Mol. Med. 2014, 33, 543–549. [Google Scholar] [CrossRef] [PubMed] [Green Version]
- Kondo, T.; Imamura, K.; Funayama, M.; Tsukita, K.; Miyake, M.; Ohta, A.; Woltjen, K.; Nakagawa, M.; Asada, T.; Arai, T.; et al. iPSC-Based Compound Screening and In Vitro Trials Identify a Synergistic Anti-amyloid beta Combination for Alzheimer’s Disease. Cell Rep. 2017, 21, 2304–2312. [Google Scholar] [CrossRef] [Green Version]
- Kryscio, R.J.; Abner, E.L.; Caban-Holt, A.; Lovell, M.; Goodman, P.; Darke, A.K.; Yee, M.; Crowley, J.; Schmitt, F.A. Association of Antioxidant Supplement Use and Dementia in the Prevention of Alzheimer’s Disease by Vitamin E and Selenium Trial (PREADViSE). Jama Neurol. 2017, 74, 567–573. [Google Scholar] [CrossRef]
- Masaki, K.H.; Losonczy, K.G.; Izmirlian, G.; Foley, D.J.; Ross, G.W.; Petrovitch, H.; Havlik, R.; White, L.R. Association of vitamin E and C supplement use with cognitive function and dementia in elderly men. Neurology 2000, 54, 1265–1272. [Google Scholar] [CrossRef]
- Choi, D.Y.; Lee, Y.J.; Hong, J.T.; Lee, H.J. Antioxidant properties of natural polyphenols and their therapeutic potentials for Alzheimer’s disease. Brain Res. Bull. 2012, 87, 144–153. [Google Scholar] [CrossRef] [PubMed]
- Karunaweera, N.; Raju, R.; Gyengesi, E.; Munch, G. Plant polyphenols as inhibitors of NF-kappaB induced cytokine production-a potential anti-inflammatory treatment for Alzheimer’s disease? Front. Mol. Neurosci. 2015, 8, 24. [Google Scholar] [CrossRef] [Green Version]
- Baum, L.; Lam, C.W.; Cheung, S.K.; Kwok, T.; Lui, V.; Tsoh, J.; Lam, L.; Leung, V.; Hui, E.; Ng, C.; et al. Six-month randomized, placebo-controlled, double-blind, pilot clinical trial of curcumin in patients with Alzheimer disease. J. Clin. Psychopharmacol. 2008, 28, 110–113. [Google Scholar] [CrossRef] [Green Version]
- Turner, R.S.; Thomas, R.G.; Craft, S.; van Dyck, C.H.; Mintzer, J.; Reynolds, B.A.; Brewer, J.B.; Rissman, R.A.; Raman, R.; Aisen, P.S.; et al. A randomized, double-blind, placebo-controlled trial of resveratrol for Alzheimer disease. Neurology 2015, 85, 1383–1391. [Google Scholar] [CrossRef] [PubMed]
- Kuriyama, S.; Hozawa, A.; Ohmori, K.; Shimazu, T.; Matsui, T.; Ebihara, S.; Awata, S.; Nagatomi, R.; Arai, H.; Tsuji, I. Green tea consumption and cognitive function: A cross-sectional study from the Tsurugaya Project 1. Am. J. Clin. Nutr. 2006, 83, 355–361. [Google Scholar] [CrossRef] [PubMed] [Green Version]
- Molino, S.; Dossena, M.; Buonocore, D.; Ferrari, F.; Venturini, L.; Ricevuti, G.; Verri, M. Polyphenols in dementia: From molecular basis to clinical trials. Life Sci. 2016, 161, 69–77. [Google Scholar] [CrossRef] [PubMed]
- Ringman, J.M.; Frautschy, S.A.; Teng, E.; Begum, A.N.; Bardens, J.; Beigi, M.; Gylys, K.H.; Badmaev, V.; Heath, D.D.; Apostolova, L.G.; et al. Oral curcumin for Alzheimer’s disease: Tolerability and efficacy in a 24-week randomized, double blind, placebo-controlled study. Alzheimer’s Res. Ther. 2012, 4, 43. [Google Scholar] [CrossRef] [PubMed] [Green Version]
- de Vries, K.; Strydom, M.; Steenkamp, V. Bioavailability of resveratrol: Possibilities for enhancement. J. Herb. Med. 2018, 11, 71–77. [Google Scholar] [CrossRef] [Green Version]
- Broman-Fulks, J.J.; Canu, W.H.; Trout, K.L.; Nieman, D.C. The effects of quercetin supplementation on cognitive functioning in a community sample: A randomized, placebo-controlled trial. Ther. Adv. Psychopharmacol. 2012, 2, 131–138. [Google Scholar] [CrossRef] [Green Version]
- Remington, R.; Bechtel, C.; Larsen, D.; Samar, A.; Doshanjh, L.; Fishman, P.; Luo, Y.; Smyers, K.; Page, R.; Morrell, C.; et al. A Phase II Randomized Clinical Trial of a Nutritional Formulation for Cognition and Mood in Alzheimer’s Disease. J. Alzheimer’s Dis. 2015, 45, 395–405. [Google Scholar] [CrossRef] [Green Version]
- Moreira, P.I.; Harris, P.L.; Zhu, X.; Santos, M.S.; Oliveira, C.R.; Smith, M.A.; Perry, G. Lipoic acid and N-acetyl cysteine decrease mitochondrial-related oxidative stress in Alzheimer disease patient fibroblasts. J. Alzheimer’s Dis. 2007, 12, 195–206. [Google Scholar] [CrossRef] [PubMed]
- El-Magd, M.A.; Khalifa, S.F.; FA, A.A.; Badawy, A.A.; El-Shetry, E.S.; Dawood, L.M.; Alruwaili, M.M.; Alrawaili, H.A.; Risha, E.F.; El-Taweel, F.M.; et al. Incensole acetate prevents beta-amyloid-induced neurotoxicity in human olfactory bulb neural stem cells. Biomed. Pharmacother. Biomed. Pharmacother. 2018, 105, 813–823. [Google Scholar] [CrossRef]
- Bonaccorso, A.; Pellitteri, R.; Ruozi, B.; Puglia, C.; Santonocito, D.; Pignatello, R.; Musumeci, T. Curcumin Loaded Polymeric vs. Lipid Nanoparticles: Antioxidant Effect on Normal and Hypoxic Olfactory Ensheathing Cells. Nanomaterials 2021, 11, 159. [Google Scholar] [CrossRef]
- Bonferoni, M.C.; Rassu, G.; Gavini, E.; Sorrenti, M.; Catenacci, L.; Giunchedi, P. Nose-to-Brain Delivery of Antioxidants as a Potential Tool for the Therapy of Neurological Diseases. Pharmaceutics 2020, 12, 1246. [Google Scholar] [CrossRef]
- Mythri, R.B.; Jagatha, B.; Pradhan, N.; Andersen, J.; Bharath, M.M. Mitochondrial complex I inhibition in Parkinson’s disease: How can curcumin protect mitochondria? Antioxid. Redox Signal. 2007, 9, 399–408. [Google Scholar] [CrossRef]
- Mett, J.; Muller, U. The medium-chain fatty acid decanoic acid reduces oxidative stress levels in neuroblastoma cells. Sci. Rep. 2021, 11, 6135. [Google Scholar] [CrossRef] [PubMed]
- Hughes, S.D.; Kanabus, M.; Anderson, G.; Hargreaves, I.P.; Rutherford, T.; O’Donnell, M.; Cross, J.H.; Rahman, S.; Eaton, S.; Heales, S.J. The ketogenic diet component decanoic acid increases mitochondrial citrate synthase and complex I activity in neuronal cells. J. Neurochem. 2014, 129, 426–433. [Google Scholar] [CrossRef]
- Hu, X.; Teng, S.; He, J.; Sun, X.; Du, M.; Kou, L.; Wang, X. Pharmacological basis for application of scutellarin in Alzheimer’s disease: Antioxidation and antiapoptosis. Mol. Med. Rep. 2018, 18, 4289–4296. [Google Scholar] [CrossRef] [PubMed] [Green Version]
- Alamro, A.A.; Alsulami, E.A.; Almutlaq, M.; Alghamedi, A.; Alokail, M.; Haq, S.H. Therapeutic Potential of Vitamin D and Curcumin in an In Vitro Model of Alzheimer Disease. J. Cent. Nerv. Syst. Dis. 2020, 12, 1179573520924311. [Google Scholar] [CrossRef] [PubMed]
- Bacci, A.; Runfola, M.; Sestito, S.; Rapposelli, S. Beyond Antioxidant Effects: Nature-Based Templates Unveil New Strategies for Neurodegenerative Diseases. Antioxidants 2021, 10, 367. [Google Scholar] [CrossRef]
- Sang, Z.; Wang, K.; Han, X.; Cao, M.; Tan, Z.; Liu, W. Design, Synthesis, and Evaluation of Novel Ferulic Acid Derivatives as Multi-Target-Directed Ligands for the Treatment of Alzheimer’s Disease. Acs Chem. Neurosci. 2019, 10, 1008–1024. [Google Scholar] [CrossRef]
- Keller, J.M.; Frega, M. Past, Present, and Future of Neuronal Models In Vitro. Adv. Neurobiol. 2019, 22, 3–17. [Google Scholar] [CrossRef]
- Lancaster, M.A.; Renner, M.; Martin, C.A.; Wenzel, D.; Bicknell, L.S.; Hurles, M.E.; Homfray, T.; Penninger, J.M.; Jackson, A.P.; Knoblich, J.A. Cerebral organoids model human brain development and microcephaly. Nature 2013, 501, 373–379. [Google Scholar] [CrossRef]
- Ahn, S.I.; Kim, Y. Human Blood-Brain Barrier on a Chip: Featuring Unique Multicellular Cooperation in Pathophysiology. Trends Biotechnol. 2021. [Google Scholar] [CrossRef]
- Salman, M.M.; Marsh, G.; Kusters, I.; Delince, M.; Di Caprio, G.; Upadhyayula, S.; de Nola, G.; Hunt, R.; Ohashi, K.G.; Gray, T.; et al. Design and Validation of a Human Brain Endothelial Microvessel-on-a-Chip Open Microfluidic Model Enabling Advanced Optical Imaging. Front. Bioeng. Biotechnol. 2020, 8, 573775. [Google Scholar] [CrossRef] [PubMed]
- Oddo, A.; Peng, B.; Tong, Z.; Wei, Y.; Tong, W.Y.; Thissen, H.; Voelcker, N.H. Advances in Microfluidic Blood-Brain Barrier (BBB) Models. Trends Biotechnol. 2019, 37, 1295–1314. [Google Scholar] [CrossRef] [PubMed]
- Vadivelu, R.K.; Ooi, C.H.; Yao, R.Q.; Tello Velasquez, J.; Pastrana, E.; Diaz-Nido, J.; Lim, F.; Ekberg, J.A.; Nguyen, N.T.; St John, J.A. Generation of three-dimensional multiple spheroid model of olfactory ensheathing cells using floating liquid marbles. Sci. Rep. 2015, 5, 15083. [Google Scholar] [CrossRef] [PubMed] [Green Version]
- Ayuso, J.M.; Gillette, A.; Lugo-Cintron, K.; Acevedo-Acevedo, S.; Gomez, I.; Morgan, M.; Heaster, T.; Wisinski, K.B.; Palecek, S.P.; Skala, M.C.; et al. Organotypic microfluidic breast cancer model reveals starvation-induced spatial-temporal metabolic adaptations. EBioMedicine 2018, 37, 144–157. [Google Scholar] [CrossRef] [Green Version]
- Liang, N.; Trujillo, C.A.; Negraes, P.D.; Muotri, A.R.; Lameu, C.; Ulrich, H. Stem cell contributions to neurological disease modeling and personalized medicine. Prog. Neuro-Psychopharmacol. Biol. Psychiatry 2018, 80, 54–62. [Google Scholar] [CrossRef] [PubMed]
- Gosnell, M.E.; Anwer, A.G.; Cassano, J.C.; Sue, C.M.; Goldys, E.M. Functional hyperspectral imaging captures subtle details of cell metabolism in olfactory neurosphere cells, disease-specific models of neurodegenerative disorders. Biochim. Et Biophys. Acta 2016, 1863, 56–63. [Google Scholar] [CrossRef] [PubMed] [Green Version]


| Pathogenic Mechanism | Main Finding | Cellular Type | Lineage | References |
|---|---|---|---|---|
| Amyloid/Tau | Platelets from AD patients reproduce the increased amyloidogenic processing of AβPP | Platelets | Non-neuronal | [68] |
| Amyloid/Tau | AD platelets harbor increased levels of a higher molecular weight tau isoform | Platelets | Non-neuronal | [69] |
| Amyloid/Tau | Alteration of AβPP, BACE, and ADAM 10 levels in early stages of the disease | Platelets | Non-neuronal | [70,71,72] |
| Amyloid/Tau | It is suggested a decreased non-amyloidogenic processing of AβPP by a lack of nicastrin mRNA expression in samples obtained from AD patients | Lymphocytes | Non-neuronal | [73] |
| Amyloid/Tau | Altered balance between Aβ-oligomers and PKCε levels in AD. Loss of PKCε-mediated inhibition of Aβ | Fibroblasts | Non-neuronal | [74] |
| Amyloid/Tau | Higher Aβ42/Aβ40 ratio compared to control cells | PSEN1 iPSC-derived neural progenitors | Neuronal | [75] |
| Amyloid/Tau | Mutation alters the initial cleavage site of γ-secretase, resulting in an increased generation of Aβ42, in addition to an increase in the levels of total and phosphorylated tau | Neuron-derived iPSCs from patients harboring the London FAD AβPP mutation V717I | Neuronal | [76] |
| Amyloid/Tau | Oligomeric forms of canonical Aβ impairs synaptic plasticity | Cortical neurons from three genetic forms of AD —PSEN1 L113_I114insT, AβPP duplication (AβPPDp), and Ts21— generated from iPSCs | Neuronal | [77] |
| Amyloid/Tau | Increase in the content and changes in the subcellular distribution of t-tau and p-tau in cells from AD patients compared to controls | Non-invasively isolated ONPs | Neuronal | [9] |
| Mitochondria | Compromise of mitochondrial COX from AD patients | Platelets | Non-neuronal | [78] |
| Mitochondria | Platelets isolated from AD patients show decreased ATP levels | Platelets | Non-neuronal | [79] |
| Mitochondria | AD lymphocytes exhibit impairment of total OXPHOS capacity | Lymphocytes | Non-neuronal | [80] |
| Mitochondria | AD skin fibroblasts show increased production of CO2 and reduced oxygen uptake suggesting that mitochondrial electron transport chain might be compromised | Fibroblasts | Non-neuronal | [81] |
| Mitochondria | AD fibroblasts present reduction in mitochondrial length and a dysfunctional mitochondrial bioenergetics profile | Fibroblasts | Non-neuronal | [82] |
| Mitochondria | SAD fibroblasts exhibit aged mitochondria, and their recycling process is impaired | Fibroblasts | Non-neuronal | [83] |
| Mitochondria | Patient-derived cells show increased levels of oxidative phosphorylation chain complexes | Human induced pluripotent stem cell-derived neuronal cells (iN cells) from SAD patients | Neuronal | [84] |
| Mitochondria | Mitophagy failure as a consequence of lysosomal dysfunction | iPSC-derived neurons from FAD1 patients harboring PSEN1 A246E mutation | Neuronal | [85] |
| Mitochondria | Neurons exhibit defective mitochondrial axonal transport | iPSC-derived neurons from an AD patient carrying AβPP -V715M mutation | Neuronal | [86] |
| Oxidative Stress | Increased activity of the antioxidant enzyme catalase in probable AD patients | Erythrocytes | Non-neuronal | [87] |
| Oxidative Stress | Increased production and content of thiobarbituric acid-reactive substances (TBARS), superoxide dismutase (SOD), and nitric oxide synthase (NOS) | Erythrocytes and Platelets | Non-neuronal | [88] |
| Oxidative Stress | Increase in the content of the unfolded version of p53 as well as reduced SOD activity | Peripheral blood mononuclear cells (PBMCs) | Non-neuronal | [89] |
| Oxidative Stress | Exacerbated response to NFKB pathway | PBMCs | Non-neuronal | [90] |
| Oxidative Stress | Increased ROS production in response to H2O2 | PBMCs | Non-neuronal | [66] |
| Oxidative Stress | AD lymphocytes were more prone to cell death after a H2O2 challenge | Lymphocytes | Non-neuronal | [91] |
| Oxidative Stress | Reduced antioxidant capacity of FAD lymphocytes and fibroblasts together with increased lipid peroxidation on their plasma membrane | Lymphocytes and Fibroblasts | Non-neuronal | [92] |
| Oxidative Stress | Aβ peptides were better internalized and generated greater oxidative damage in FAD fibroblasts | Fibroblasts | Non-neuronal | [93] |
| Oxidative Stress | Aβ peptide caused a higher increase in the oxidation of HSP60 | Fibroblasts | Non-neuronal | [94] |
| Oxidative Stress | Reduction in the levels of Vimentin in samples from AD patients | iPSCs-derived neurons from AD patient | Neuronal | [65] |
| Oxidative Stress | Increased levels of hydroxynonenal, Nɛ-(carboxymethyl)lysine), and heme oxygenase-1 in samples from AD patients | Biopsy-derived ONPs | Neuronal | [24] |
| Oxidative Stress | Increased susceptibility to oxidative-stress-induced cell death | Biopsy-derived ONPs | Neuronal | [25] |
| ER-Stress | Impaired ER Ca2+ and ER stress in PBMCs from MCIs and mild AD patients | PBMCs | Non-neuronal | [95] |
| ER-Stress | Accumulation of Aβ oligomers induced ER and oxidative stress | iPSC-derived neural cells from a patient carrying APP-E693Δ mutation and a sporadic AD patient | Neuronal | [96] |
| ER-Stress | Aβ-S8C dimer triggers an ER stress response more prominent in AD neuronal cultures where several genes from the UPR were upregulated | iPSC-derived neuronal cultures carrying the AD-associated TREM2 R47H variant | Neuronal | [97] |
| ER-Stress | Accumulation of Aβ oligomers in iPSC-derived neurons from AD patients leads to increased ER stress | iPSC-derived neurons from patients with an AβPP-E693Δ mutation | Neuronal | [98] |
| Assay | Analyte | Advantages | Disadvantages | Ref |
|---|---|---|---|---|
| Luminometric analysis | NAD+, NADH, NADP+, and NADPH concentration | Method is reproducible and reported in tissues and cells. | Partial inactivation of luciferase system. Invasive and destructive. | [118] |
| Colorimetric Assay using thiazolyl blue | Intracellular NAD+ concentration | Identifies biological trends that are highly reproducible in the literature. | Indirect measurement affected by minor variations in temperature and pH. Cannot detect low picomolar levels. Invasive and destructive. | [119,120] |
| BRET-based biosensors | NAD+ concentration | Quantifies NAD+ levels in cell culture, tissue, and blood samples. The readout can be performed by a microplate reader or a simple digital camera. Minimum consumption of biological samples. | Invasive and destructive. | [121] |
| Reverse phase HPLC | Endogenous intracellular and extracellular levels of NAD+ and related metabolites | The method uses elements to increase sensitivity. | Limited to low micromolar detection levels. Since many NAD-related metabolites can be converted to one or more metabolites the identified concentrations may be fraught with inaccuracies. Invasive and destructive detection. Static information of a population of cells. | [122] |
| LC-MS/MS | Endogenous intracellular and extracellular levels of NAD+ and related metabolites | High specificity and sensitivity. | The assay requires time, many preparations, and materials not readily available. Static information of a population of cells. Invasive and destructive detection. | [123,124] |
| LC-MS/MS (NAD metabolite isotopic labels) | Endogenous intracellular and extracellular levels of NAD+ and related metabolites | The method provides greater resolution and lower limit of detection. | Static information of a population cells. Invasive and destructive. | [125,126] |
| Fluorescent imaging with metabolite sensors | NADH, NAD+ concentrations, and their ratio | Metabolite sensors may be used to profile metabolic states of living cells in real-time and with single-cell or even subcellular resolution. | Invasive (metabolite sensors are introduced into any cell or organism). With some sensors, fluorescence is sensitive to pH. Other sensors have a limited dynamic range in fluorescence. | [127,128] |
| Novel MRI-based process | NAD+ and NADH concentrations | Non-invasive and non-destructive, measured in healthy aged human brains. | Only measures 2 analytes. | [129] |
| Fluorescence Lifetime Imaging (FLIM) | NAD+, NADH, NADP+, and NADPH | Non-invasive and non-destructive using autofluorescence intensity. May be used to profile metabolic states of living cells in real-time. | Requires an expensive equipment. | [99] |
| Compounds | Targeting | Mechanism | In Vitro/In Vivo Models | Comments | Refs |
|---|---|---|---|---|---|
| Incensole acetate (IA) | Oxidative stress induced by Aβ | Increased levels of the antioxidant enzyme HO-1 | Human olfactory bulb neural stem cells (hOBNSCs) | The cellular model belongs to the olfactory system; therefore, we envision similar results in our proposed cellular model. | [169] |
| Curcumin loaded polymeric or lipid nanosuspensions | Oxidative stress | Elevation of total cellular glutathione levels and enhanced cell viability under oxidative stress | Normal and hypoxic olfactory ensheathing cells (OECs) | The use of OECs (non-myelinating glial cells that wrap olfactory neurons) in hypoxic conditions enables a roadmap to improve the delivery of antioxidants through the nose-to-brain route. | [170,171,172] |
| Saturated medium-chain fatty acid (MCFA) decanoic acid (10:0) | Oxidative stress | Upregulation of catalase activity and increase in mitochondrial citrate synthase | Neuroblastoma cells (SH-SY5Y cells) | MCFA decanoic acid has only been evaluated in human cell lines. These findings suggest it is worth testing them in AD patient-derived ONPs. | [173,174] |
| Scutellarin (SC) | Oxidative stress and apoptosis | Enhances the levels of superoxide dismutase | L-Glu-treated HT22 cells/ AD mice induced by AlCl3 and D-gal | SC has shown antioxidant and antiapoptotic properties only in induced models of AD; thus, it would be interesting to evaluate these properties in a cellular model derived from AD patients. | [175] |
| Curcumin and Vitamin D3 | Oxidative stress | Increased SOD enzyme activity and catalase enzyme expression | Primary neuronal cortical culture from rats treated with Aβ | Antioxidant combinations show a synergistic effect that could be tested in an ONP model. | [176] |
| TM-10 (a ferulic acid derivative and a highly selective BuChE inhibitor) | Oxidative stress, Aβ aggregation, butyrylcholinesterase (BuChE) inhibition | Neuroprotective effect against Aβ42- mediated SH-SY5Y neurotoxicity, and autophagy induction. In mice, improves scopolamine-inducedmemory impairment | SH-SY5Y cell, U87 cell, AlCl3-induced zebrafish AD model, and mice treated with scopolamine | The search of Multi-Target-Directed-Ligands (MTDLs) has allowed fusing novel natural antioxidants derivatives and highly selective BuChE inhibitors. Thus, compounds with multiple biological activities are obtained, including ChE inhibitory activity, MAOs inhibitory potency, antioxidant activity, disaggregation effect on Aβ, and the ability to cross the blood−brain barrier. The use of AD patient-derived ONPs could be a valuable tool for validating these compounds in humans. | [177,178] |
Publisher’s Note: MDPI stays neutral with regard to jurisdictional claims in published maps and institutional affiliations. |
© 2021 by the authors. Licensee MDPI, Basel, Switzerland. This article is an open access article distributed under the terms and conditions of the Creative Commons Attribution (CC BY) license (https://creativecommons.org/licenses/by/4.0/).
Share and Cite
Gómez-Virgilio, L.; Luarte, A.; Ponce, D.P.; Bruna, B.A.; Behrens, M.I. Analyzing Olfactory Neuron Precursors Non-Invasively Isolated through NADH FLIM as a Potential Tool to Study Oxidative Stress in Alzheimer’s Disease. Int. J. Mol. Sci. 2021, 22, 6311. https://0-doi-org.brum.beds.ac.uk/10.3390/ijms22126311
Gómez-Virgilio L, Luarte A, Ponce DP, Bruna BA, Behrens MI. Analyzing Olfactory Neuron Precursors Non-Invasively Isolated through NADH FLIM as a Potential Tool to Study Oxidative Stress in Alzheimer’s Disease. International Journal of Molecular Sciences. 2021; 22(12):6311. https://0-doi-org.brum.beds.ac.uk/10.3390/ijms22126311
Chicago/Turabian StyleGómez-Virgilio, Laura, Alejandro Luarte, Daniela P. Ponce, Bárbara A. Bruna, and María I. Behrens. 2021. "Analyzing Olfactory Neuron Precursors Non-Invasively Isolated through NADH FLIM as a Potential Tool to Study Oxidative Stress in Alzheimer’s Disease" International Journal of Molecular Sciences 22, no. 12: 6311. https://0-doi-org.brum.beds.ac.uk/10.3390/ijms22126311