
Poly(A)+ Sensing of Hybridization-Sensitive Fluorescent Oligonucleotide Probe Characterized by Fluorescence Correlation Methods

 , and
, and 
Abstract
:1. Introduction
2. Results
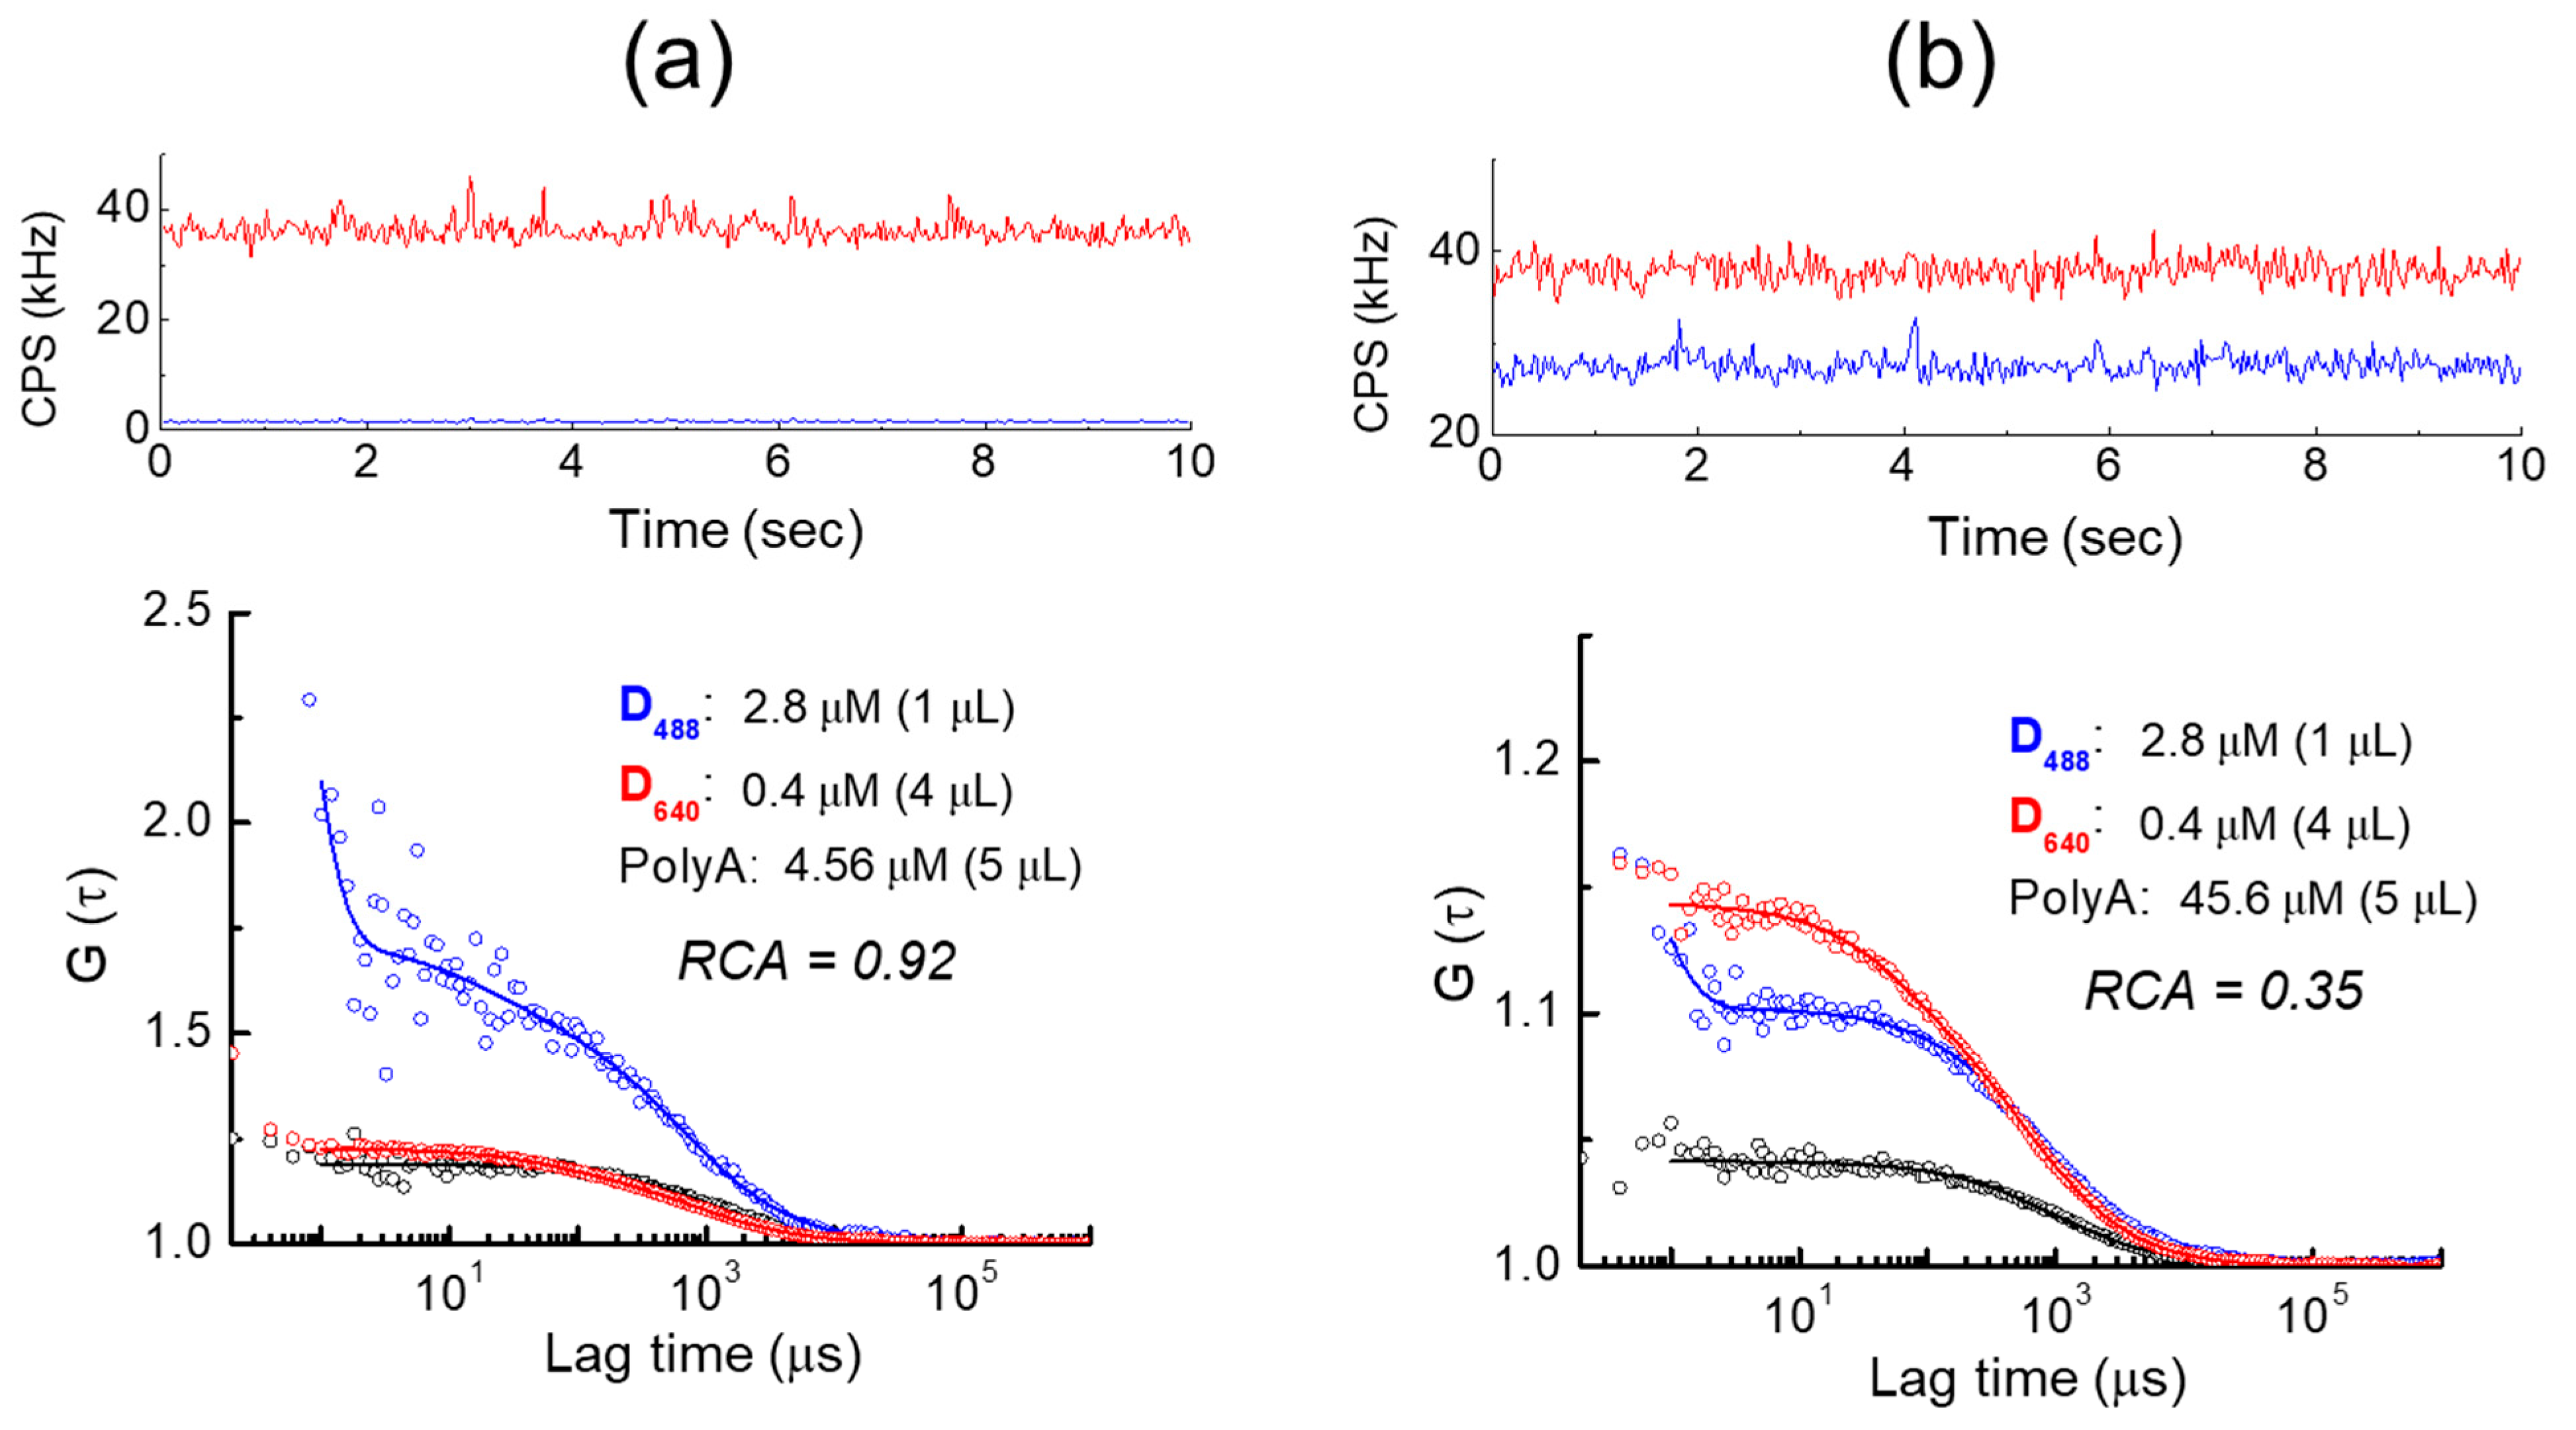
Fluorescence Behavior of Dnnn before and after Hybridization with Poly(A) Oligomer
3. Discussion
4. Materials and Methods
4.1. Cell Culture
4.2. Confocal Laser Scanning Microscopy
4.3. Fluorescence Correlation Spectroscopy and Fluorescence Cross-Correlation Spectroscopy
5. Conclusions
Author Contributions
Funding
Institutional Review Board Statement
Informed Consent Statement
Data Availability Statement
Conflicts of Interest
Abbreviations
| CPS | (Fluorescence detection) counts per second |
| Dnnn | DNA-based ECHO probe of principal excitation wavelength nnn |
| DMEM | Dulbecco’s modified Eagle’s medium |
| ECHO | Exciton-controlled hybridization-sensitive oligonucleotide |
| FBS | Fetal bovine serum |
| FCS | Fluorescence correlation spectroscopy |
| FCCS | Fluorescence cross-correlation spectroscopy |
| FI | Averaged fluorescence intensity |
| FISH | Fluorescence in situ hybridization |
| GFP | Green fluorescent protein |
| LNA | Locked nucleic acids |
| mRNA | Messenger RNA |
| RCA | Relative cross-correlation amplitude |
| rRNA | Ribosomal RNA |
| SNP | Single nucleotide polymorphism |
| snRNA | Small nuclear RNA |
| tRNA | Transfer RNA |
References
- Armitage, B. Imaging of RNA in live cells. Curr. Opin. Chem. Biol. 2011, 15, 806–812. [Google Scholar] [CrossRef]
- Okamoto, A. Modified ECHO probes for highly specific RNA detection in living cells. Trends Org. Chem. 2014, 17, 45–57. [Google Scholar]
- Xia, Y.; Zhang, R.; Wang, Z.; Tian, J.; Chen, X. Recent advances in high-performance fluorescent and bioluminescent RNA imaging probes. Chem. Soc. Rev. 2017, 46, 2824–2843. [Google Scholar] [CrossRef] [Green Version]
- Sollner-Webb, B.; Mougey, E.B. News from the nucleolus: rRNA gene expression. Trends Biochem. Sci. 1991, 16, 58–62. [Google Scholar] [CrossRef]
- Matera, A.G.; Terns, R.M.; Terns, M.P. Non-coding RNAs: Lessons from the small nuclear and small nucleolar RNAs. Nat. Rev. Mol. Cell Biol. 2007, 8, 209–220. [Google Scholar] [CrossRef]
- Schimmel, P. The emerging complexity of the tRNA world: Mammalian tRNAs beyond protein synthesis. Nat. Rev. Mol. Cell Biol. 2018, 19, 45–58. [Google Scholar] [CrossRef] [PubMed]
- Park, H.Y.; Buxbaum, A.R.; Singer, R.H. Single mRNA Tracking in Live Cells. In Methods in Enzymology; Elsevier BV: Amsterdam, The Netherlands, 2010; Volume 472, pp. 387–406. [Google Scholar]
- Bertrand, E.; Chartrand, P.; Schaefer, M.; Shenoy, S.; Singer, R.H.; Long, R.M. Localization of ASH1 mRNA Particles in Living Yeast. Mol. Cell 1998, 2, 437–445. [Google Scholar] [CrossRef] [Green Version]
- Fusco, D.; Accornero, N.; Lavoie, B.; Shenoy, S.M.; Blanchard, J.-M.; Singer, R.H.; Bertrand, E. Single mRNA Molecules Demonstrate Probabilistic Movement in Living Mammalian Cells. Curr. Biol. 2003, 13, 161–167. [Google Scholar] [CrossRef] [Green Version]
- Daigle, N.; Ellenberg, J. λN-GFP: An RNA reporter system for live-cell imaging. Nat. Methods 2007, 4, 633–636. [Google Scholar] [CrossRef]
- Ozawa, T.; Natori, Y.; Sato, M.; Umezawa, Y. Imaging dynamics of endogenous mitochondrial RNA in single living cells. Nat. Chem. Biol. 2007, 4, 413–419. [Google Scholar] [CrossRef]
- Santangelo, P.J.; Lifland, A.W.; Curt, P.; Sasaki, Y.; Bassell, G.J.; E Lindquist, M.; Crowe, J. Single molecule–sensitive probes for imaging RNA in live cells. Nat. Methods 2009, 6, 347–349. [Google Scholar] [CrossRef] [PubMed]
- Oomoto, I.; Suzuki-Hirano, A.; Umeshima, H.; Han, Y.-W.; Yanagisawa, H.; Carlton, P.; Harada, Y.; Kengaku, M.; Okamoto, A.; Shimogori, T.; et al. ECHO-liveFISH: In vivo RNA labeling reveals dynamic regulation of nuclear RNA foci in living tissues. Nucleic Acids Res. 2015, 30, e126. [Google Scholar] [CrossRef] [PubMed] [Green Version]
- Ainger, K.; Avossa, D.; Morgan, F.; Hill, S.J.; Barry, C.; Barbarese, E.; Carson, J.H. Transport and localization of exogenous myelin basic protein mRNA microinjected into oligodendrocytes. J. Cell Biol. 1993, 123, 431–441. [Google Scholar] [CrossRef] [PubMed]
- Ishihama, Y.; Funatsu, T. Single molecule tracking of quantum dot-labeled mRNAs in a cell nucleus. Biochem. Biophys. Res. Commun. 2009, 381, 33–38. [Google Scholar] [CrossRef] [PubMed]
- Smith, A.M.; Duan, H.; Mohs, A.; Nie, S. Bioconjugated quantum dots for in vivo molecular and cellular imaging. Adv. Drug Deliv. Rev. 2008, 60, 1226–1240. [Google Scholar] [CrossRef] [Green Version]
- Knowles, R.B.; Sabry, J.H.; Martone, M.E.; Deerinck, T.J.; Ellisman, M.H.; Bassell, G.J.; Kosik, K.S. Translocation of RNA Granules in Living Neurons. J. Neurosci. 1996, 16, 7812–7820. [Google Scholar] [CrossRef] [PubMed] [Green Version]
- De Brabander, M.; Geuens, G.; Nuydens, R.; Moeremans, M.; De Mey, J. Probing microtubule-dependent intracellular motility with nanometre particle video ultramicroscopy (nanovid ultramicroscopy). Cytobios 1985, 43, 273–283. [Google Scholar]
- Pack, C.-G.; Paulson, B.; Shin, Y.; Jung, M.K.; Kim, J.S. Variably Sized and Multi-Colored Silica-Nanoparticles Characterized by Fluorescence Correlation Methods for Cellular Dynamics. Materials 2020, 14, 19. [Google Scholar] [CrossRef]
- Silverman, A.P.; Kool, E.T. Quenched probes for highly specific detection of cellular RNAs. Trends Biotechnol. 2005, 23, 225–230. [Google Scholar] [CrossRef]
- Samanta, D.; Ebrahimi, S.B.; Mirkin, C.A. Nucleic-Acid Structures as Intracellular Probes for Live Cells. Adv. Mater. 2020, 32, e1901743. [Google Scholar] [CrossRef]
- Ikeda, S.; Kubota, T.; Yuki, M.; Okamoto, A. Exciton-Controlled Hybridization-Sensitive Fluorescent Probes: Multicolor Detection of Nucleic Acids. Angew. Chem. Int. Ed. 2009, 17, 6480–6484. [Google Scholar] [CrossRef]
- Sugizaki, K.; Okamoto, A. ECHO-LNA Conjugates: Hybridization-Sensitive Fluorescence and Its Application to Fluorescent Detection of Various RNA Strands. Bioconjug. Chem. 2010, 21, 2276–2281. [Google Scholar] [CrossRef] [PubMed]
- Kubota, T.; Ikeda, S.; Yanagisawa, H.; Yuki, M.; Okamoto, A. Cy5-Conjugated Hybridization-Sensitive Fluorescent Oligonucleo-tides for Ratiometric Analysis of Nuclear Poly(A)+ RNA. Bioconjug Chem. 2011, 22, 1625–1630. [Google Scholar] [CrossRef]
- Sato, S.; Watanabe, M.; Katsuda, Y.; Murata, A.; Wang, D.O.; Uesugi, M. Live-Cell Imaging of Endogenous mRNAs with a Small Molecule. Angew. Chem. Int. Ed. 2015, 54, 1855–1858. [Google Scholar] [CrossRef] [PubMed] [Green Version]
- Slomovic, S.; Fremder, E.; Staals, R.H.G.; Pruijn, G.J.M.; Schuster, G. Addition of poly(A) and poly(A)-rich tails during RNA degra-dation in the cytoplasm of human cells. Proc. Natl. Acad. Sci. USA 2010, 107, 7407–7412. [Google Scholar] [CrossRef] [Green Version]
- Trcek, T.; Larson, D.R.; Moldón, A.; Query, C.C.; Singer, R.H. Single-Molecule mRNA Decay Measurements Reveal Promoter- Reg-ulated mRNA Stability in Yeast. Cell 2011, 147, 1484–1497. [Google Scholar] [CrossRef] [PubMed] [Green Version]
- Liang, L.; Wang, X.; Xing, D.; Chen, T.; Chen, W.R. Noninvasive determination of cell nucleoplasmic viscosity by fluorescence correlation spectroscopy. J. Biomed. Opt. 2009, 14, 024013. [Google Scholar] [CrossRef]
- Szczepański, K.; Kwapiszewska, K.; Holyst, R. Stability of cytoplasmic nanoviscosity during cell cycle of HeLa cells synchronized with Aphidicolin. Sci. Rep. 2019, 9, 1–8. [Google Scholar] [CrossRef] [PubMed]
- Bacia, K.; A Kim, S.; Schwille, P. Fluorescence cross-correlation spectroscopy in living cells. Nat. Methods 2006, 3, 83–89. [Google Scholar] [CrossRef]
- Wobma, H.M.; Blades, M.L.; Grekova, E.; McGuire, D.L.; Chen, K.; Chan, W.C.W.; Cramb, D.T. The development of direct multicolour fluo-rescence cross-correlation spectroscopy: Towards a new tool for tracking complex biomolecular events in real-time. Phys. Chem. Chem. Phys. 2012, 14, 3290. [Google Scholar] [CrossRef]
- Santra, S.; Bagwe, R.P.; Dutta, D.; Stanley, J.T.; Walter, G.A.; Tan, W.; Moudgil, B.M.; Mericle, R.A. Synthesis and Characterization of Fluorescent, Radio-Opaque, and Paramagnetic Silica Nanoparticles for Multimodal Bioimaging Applications. Adv. Mater. 2005, 17, 2165–2169. [Google Scholar] [CrossRef]
- Lee, W.; Lee, Y.-I.; Lee, J.; Davis, L.M.; Deininger, P.; Soper, S.A. Cross-Talk-Free Dual-Color Fluorescence Cross-Correlation Spec-troscopy for the Study of Enzyme Activity. Anal. Chem. 2010, 82, 1401–1410. [Google Scholar] [CrossRef] [Green Version]
- Pack, C.G.; Song, M.R.; Tae, E.L.; Hiroshima, M.; Byun, K.H.; Kim, J.S.; Sako, Y. Microenvironments and different nanoparticle dynamics in living cells revealed by a standard nanoparticle. J. Control. Release 2012, 163, 315–321. [Google Scholar] [CrossRef]
- Shin, H.-S.; Okamoto, A.; Sako, Y.; Kim, S.W.; Kim, S.Y.; Pack, C.-G. Characterization of the Triplet State of Hybridization-Sensitive DNA Probe by Using Fluorescence Correlation Spectroscopy. J. Phys. Chem. A 2013, 117, 27–33. [Google Scholar] [CrossRef] [PubMed]
- Ikeda, S.; Okamoto, A. Hybridization-Sensitive On–Off DNA Probe: Application of the Exciton Coupling Effect to Effective Fluorescence Quenching. Chem. Asian J. 2008, 3, 958–968. [Google Scholar] [CrossRef]
- Shin, H.-S.; Okamoto, A.; Sako, Y.; Kim, S.W.; Kim, S.Y.; Pack, C.-G. Radiationless deactivation of hybridization-sensitive DNA probe. J. Lumin. 2012, 132, 2566–2571. [Google Scholar] [CrossRef]
- Elkon, R.; Ugalde, A.P.; Agami, R. Alternative cleavage and polyadenylation: Extent, regulation and function. Nat. Rev. Genet. 2013, 14, 496–506. [Google Scholar] [CrossRef] [PubMed]
- Lukacs, G.L.; Haggie, P.; Seksek, O.; Lechardeur, D.; Freedman, N.; Verkman, A.S. Size-dependent DNA Mobility in Cytoplasm and Nucleus. J. Biol. Chem. 2000, 275, 1625–1629. [Google Scholar] [CrossRef] [Green Version]
- Takagi, T.; Kii, H.; Kinjo, M. DNA Measurements by Using Fluorescence Correlation Spectroscopy and Two-Color Fluorescence Cross Correlation Spectroscopy. Curr. Pharm. Biotechnol. 2004, 5, 199–204. [Google Scholar] [CrossRef] [PubMed]
- Kubota, T.; Ikeda, S.; Yanagisawa, H.; Yuki, M.; Okamoto, A. Hybridization-Sensitive Fluorescent Probe for Long-Term Monitoring of Intracellular RNA. Bioconjug. Chem. 2009, 20, 1256–1261. [Google Scholar] [CrossRef]
- Pack, C.; Saito, K.; Tamura, M.; Kinjo, M. Microenvironment and Effect of Energy Depletion in the Nucleus Analyzed by Mobility of Multiple Oligomeric EGFPs. Biophys. J. 2006, 91, 3921–3936. [Google Scholar] [CrossRef] [Green Version]
- Tyagi, S.; Bratu, D.P.; Kramer, F.R. Multicolor molecular beacons for allele discrimination. Nat. Biotechnol. 1998, 16, 49–53. [Google Scholar] [CrossRef] [PubMed]
- Kuhn, H.; Demidov, V.V.; Coull, J.M.; Fiandaca, M.J.; Gildea, B.D.; Frank-Kamenetskii, M.D. Hybridization of DNA and PNA Molecular Beacons to Single-Stranded and Double-Stranded DNA Targets. J. Am. Chem. Soc. 2002, 124, 1097–1103. [Google Scholar] [CrossRef]
- Bratu, D.P.; Cha, B.-J.; Mhlanga, M.M.; Kramer, F.R.; Tyagi, S. Visualizing the distribution and transport of mRNAs in living cells. Proc. Natl. Acad. Sci. USA 2003, 100, 13308–13313. [Google Scholar] [CrossRef] [PubMed] [Green Version]
- Tadakuma, H.; Ishihama, Y.; Shibuya, T.; Tani, T.; Funatsu, T. Imaging of single mRNA molecules moving within a living cell nucleus. Biochem. Biophys. Res. Commun. 2006, 344, 772–779. [Google Scholar] [CrossRef] [PubMed]
- Hayashi, G.; Yanase, M.; Takeda, K.; Sakakibara, D.; Sakamoto, R.; Wang, D.O.; Okamoto, A. Hybridization-Sensitive Fluorescent Oligonu-cleotide Probe Conjugated with a Bulky Module for Compartment-Specific mRNA Monitoring in a Living Cell. Bioconjug. Chem. 2015, 26, 412–417. [Google Scholar] [CrossRef]
- Ow, H.; Larson, D.R.; Srivastava, M.; Baird, B.A.; Webb, W.W.; Wiesner, U. Bright and Stable Core−Shell Fluorescent Silica Nano-particles. Nano Lett. 2005, 5, 113–117. [Google Scholar] [CrossRef] [PubMed]
- Martinez-Moro, M.; Di Silvio, D.; Moya, S.E. Fluorescence correlation spectroscopy as a tool for the study of the intracellular dynamics and biological fate of protein corona. Biophys. Chem. 2019, 253, 106218. [Google Scholar] [CrossRef]
- Pack, C.-G.; Yukii, H.; Toh-E, A.; Kudo, T.; Tsuchiya, H.; Kaiho, A.; Sakata, E.; Murata, S.; Yokosawa, H.; Sako, Y.; et al. Quantitative live-cell imaging reveals spatio-temporal dynamics and cytoplasmic assembly of the 26S proteasome. Nat. Commun. 2014, 5, 3396. [Google Scholar] [CrossRef] [PubMed] [Green Version]


| Fluorescent Probe | D (μm2/s) | |
|---|---|---|
| Medium | HeLa | |
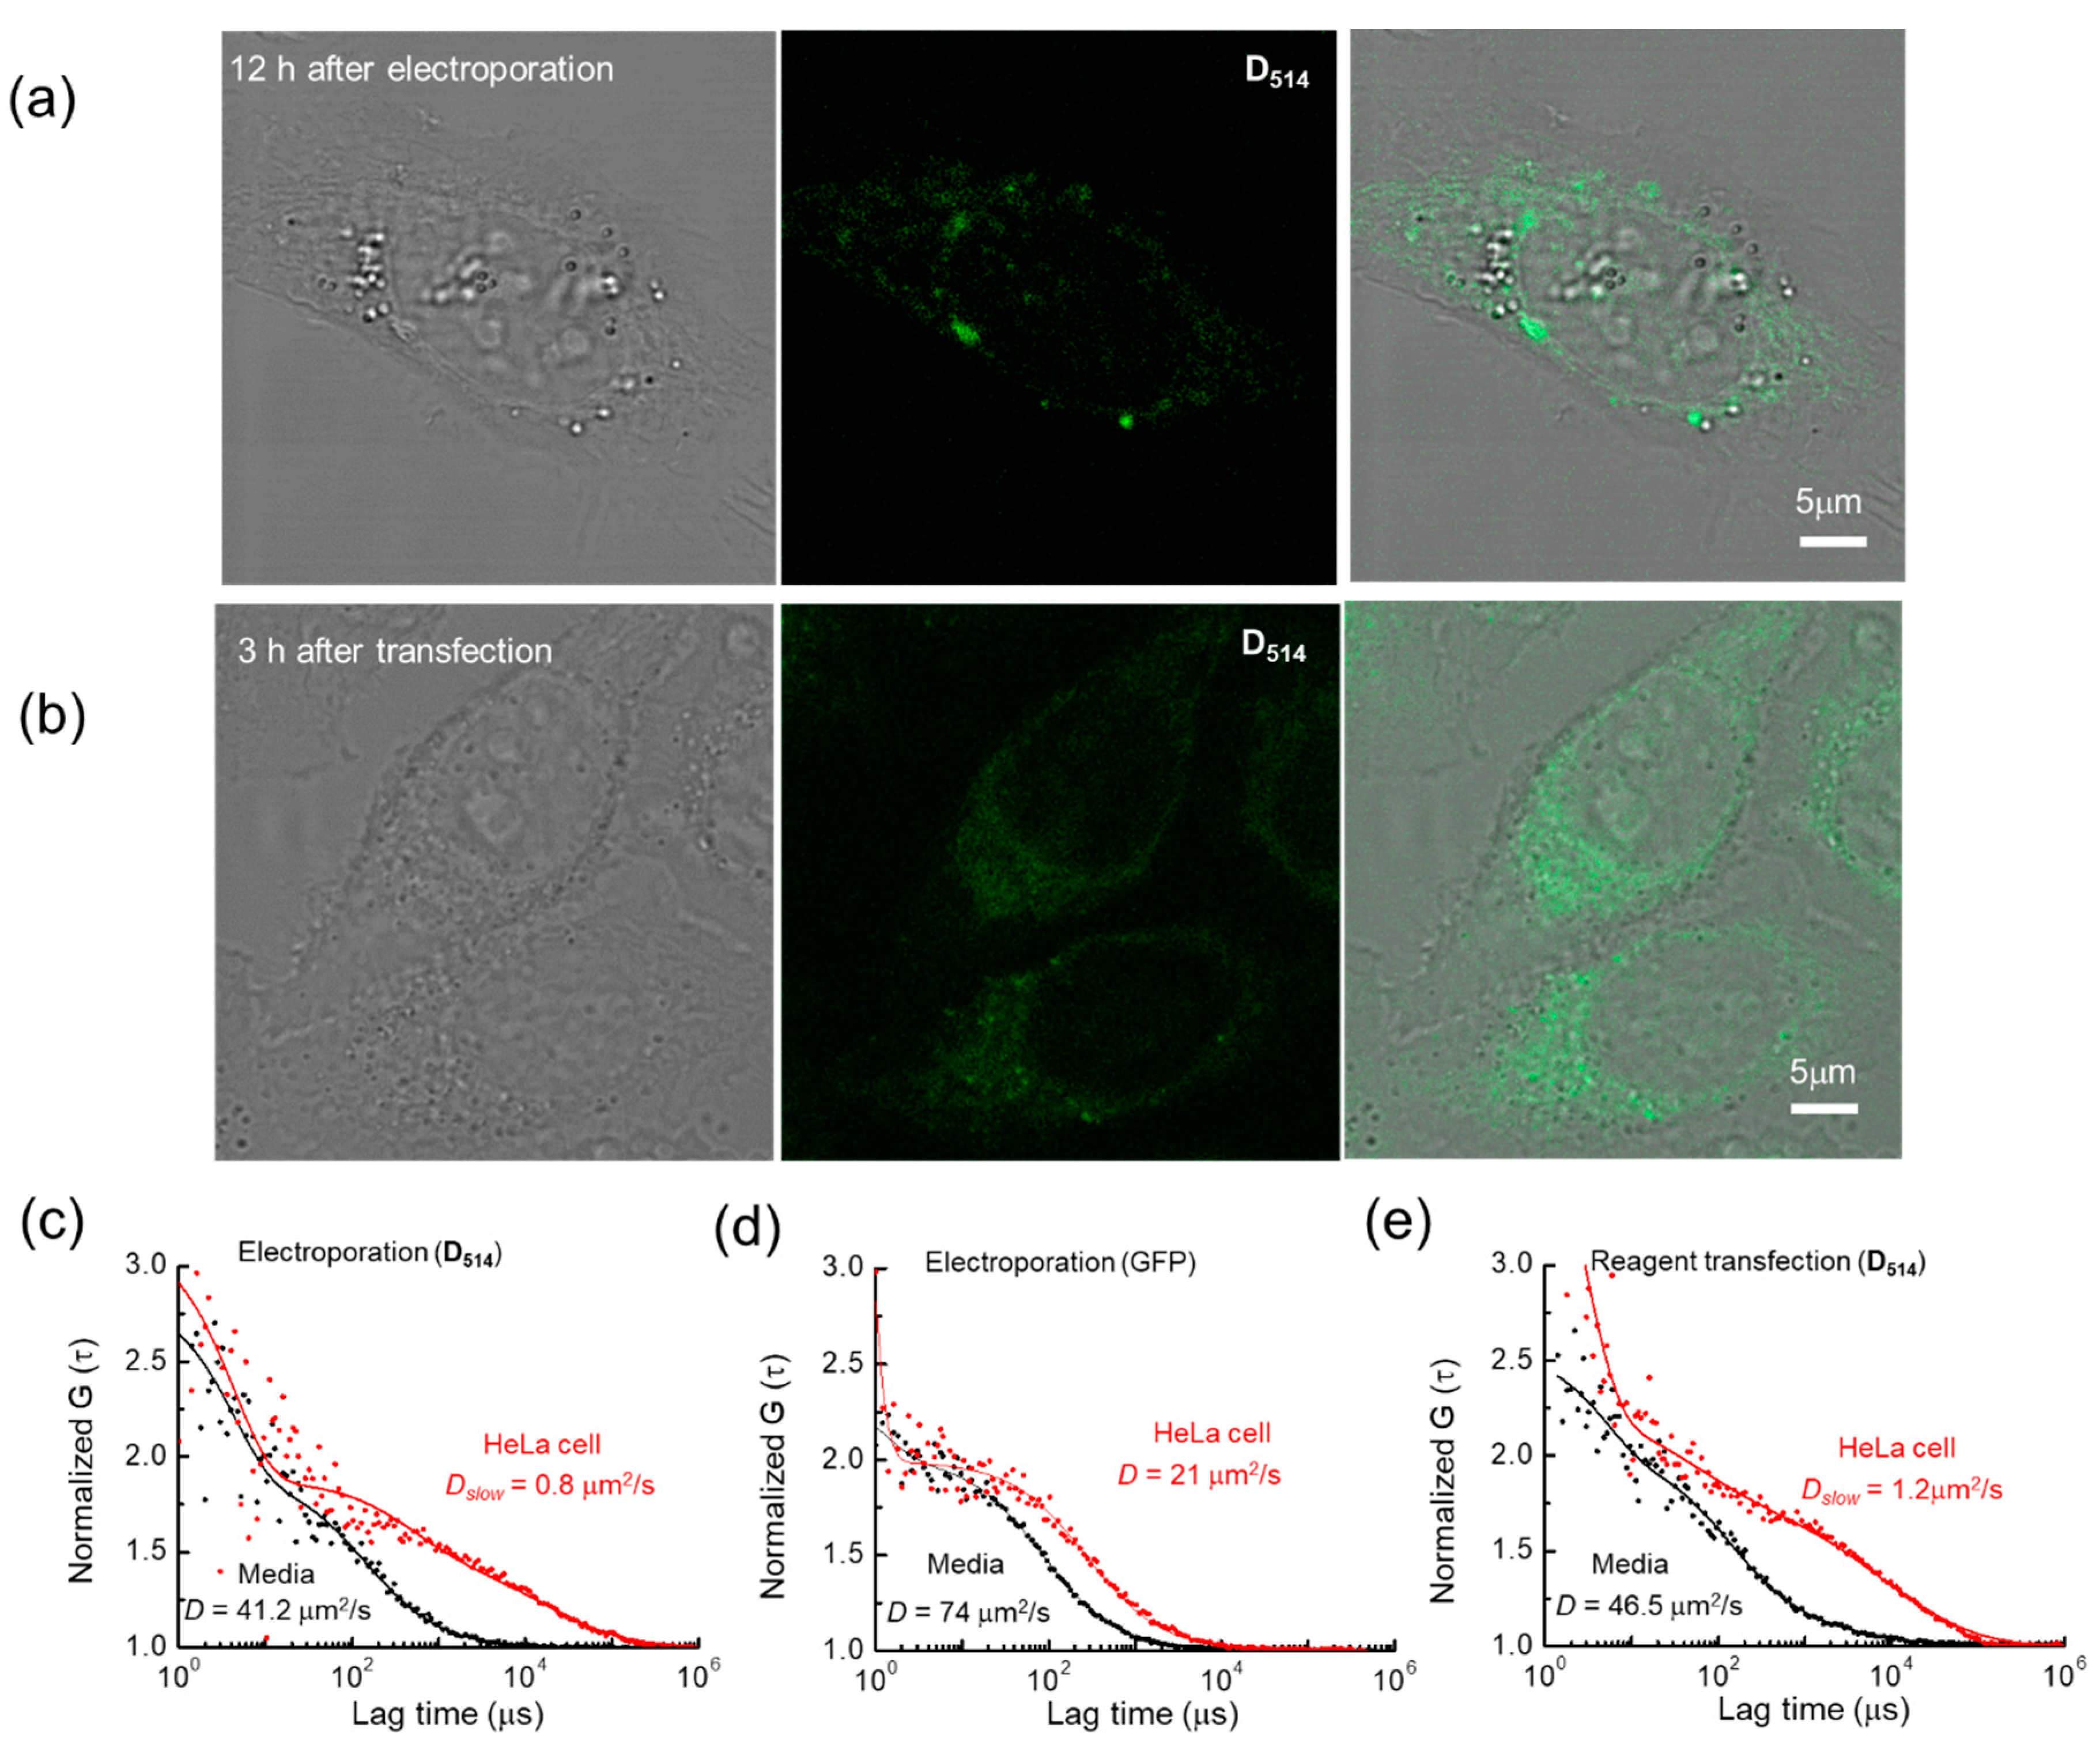
| GFP (Electroporation) | 74 | 21 |
| 5′-d(T6D514T6)-3′ (Electroporation) | 41.20 | 0.78 |
| 5′-d(T6D514T6)-3′ (Reagent transfection) | 46.50 | 0.80 |
Publisher’s Note: MDPI stays neutral with regard to jurisdictional claims in published maps and institutional affiliations. |
© 2021 by the authors. Licensee MDPI, Basel, Switzerland. This article is an open access article distributed under the terms and conditions of the Creative Commons Attribution (CC BY) license (https://creativecommons.org/licenses/by/4.0/).
Share and Cite
Paulson, B.; Shin, Y.; Okamoto, A.; Oh, Y.-M.; Kim, J.K.; Pack, C.-G. Poly(A)+ Sensing of Hybridization-Sensitive Fluorescent Oligonucleotide Probe Characterized by Fluorescence Correlation Methods. Int. J. Mol. Sci. 2021, 22, 6433. https://0-doi-org.brum.beds.ac.uk/10.3390/ijms22126433
Paulson B, Shin Y, Okamoto A, Oh Y-M, Kim JK, Pack C-G. Poly(A)+ Sensing of Hybridization-Sensitive Fluorescent Oligonucleotide Probe Characterized by Fluorescence Correlation Methods. International Journal of Molecular Sciences. 2021; 22(12):6433. https://0-doi-org.brum.beds.ac.uk/10.3390/ijms22126433
Chicago/Turabian StylePaulson, Bjorn, Yeonhee Shin, Akimitsu Okamoto, Yeon-Mok Oh, Jun Ki Kim, and Chan-Gi Pack. 2021. "Poly(A)+ Sensing of Hybridization-Sensitive Fluorescent Oligonucleotide Probe Characterized by Fluorescence Correlation Methods" International Journal of Molecular Sciences 22, no. 12: 6433. https://0-doi-org.brum.beds.ac.uk/10.3390/ijms22126433