Article

How to Obtain a Mega-Intestine with Normal Morphology: In Silico Modelling of Postnatal Intestinal Growth in a Cd97-Transgenic Mouse

1
Research Laboratories, Department of Surgery, Leipzig University, 04107 Leipzig, Germany
2
Interdisciplinary Institute for Bioinformatics (IZBI), Leipzig University, 04107 Leipzig, Germany
3
Institute for Medical Informatics, Statistics and Epidemiology (IMISE), Leipzig University, 04107 Leipzig, Germany
*
Authors to whom correspondence should be addressed.
These authors contributed equally to this work.
Int. J. Mol. Sci. 2021, 22(14), 7345; https://0-doi-org.brum.beds.ac.uk/10.3390/ijms22147345
Submission received: 1 June 2021 / Revised: 29 June 2021 / Accepted: 2 July 2021 / Published: 8 July 2021
(This article belongs to the Special Issue Dual Function Molecules and Processes in Cell Fate Decision 2.0)

Abstract

:
Intestinal cylindrical growth peaks in mice a few weeks after birth, simultaneously with crypt fission activity. It nearly stops after weaning and cannot be reactivated later. Transgenic mice expressing Cd97/Adgre5 in the intestinal epithelium develop a mega-intestine with normal microscopic morphology in adult mice. Here, we demonstrate premature intestinal differentiation in Cd97/Adgre5 transgenic mice at both the cellular and molecular levels until postnatal day 14. Subsequently, the growth of the intestinal epithelium becomes activated and its maturation suppressed. These changes are paralleled by postnatal regulation of growth factors and by an increased expression of secretory cell markers, suggesting growth activation of non-epithelial tissue layers as the origin of enforced tissue growth. To understand postnatal intestinal growth mechanistically, we study epithelial fate decisions during this period with the use of a 3D individual cell-based computer model. In the model, the expansion of the intestinal stem cell (SC) population, a prerequisite for crypt fission, is largely independent of the tissue growth rate and is therefore not spontaneously adaptive. Accordingly, the model suggests that, besides the growth activation of non-epithelial tissue layers, the formation of a mega-intestine requires a released growth control in the epithelium, enabling accelerated SC expansion. The similar intestinal morphology in Cd97/Adgre5 transgenic and wild type mice indicates a synchronization of tissue growth and SC expansion, likely by a crypt density-controlled contact inhibition of growth of intestinal SC proliferation. The formation of a mega-intestine with normal microscopic morphology turns out to originate in changes of autonomous and conditional specification of the intestinal cell fate induced by the activation of Cd97/Adgre5.

1. Introduction

Epithelial proliferation is tightly controlled. Loss of control leads to hyperplasia and tumour formation [1]. A major growth control mechanism of epithelia is the contact inhibition of growth [2,3]. Here, cell–cell and cell–matrix contacts control the onset of proliferation, rendering the cells capable of adapting their proliferation to changing cell density. In the intestine, such control is essential for embryonic development and leads to steady state regulation. The mechanism is still active in many colorectal cancer cell lines [4,5]. Its role in postnatal intestinal growth remains elusive.
During postnatal growth, the length and diameter of the mouse small intestine markedly increase, and the intestinal stem cell (SC) pool dramatically expands due to crypt fission, the process by which a parental crypt divides and produces two daughter crypts [6]. Accordingly, proliferation is strongly activated. In adult mice, permanent epithelial cell shedding at the intestinal villi still requires active proliferation [7], while SC expansion and crypt fission largely cease. Here, we look for the mechanisms that control epithelial cell fates in these periods, with a particular emphasis on proliferation.
Transgenic or knock-out mice with altered postnatal intestinal growth characteristics help to elucidate major pathways controlling this process [8,9,10]. However, the interaction between the different tissue layers, including the mucosa with the epithelium, the submucosa, which mainly consists of fibroblasts, the smooth muscle layers of the muscularis and the serosa, impedes the understanding of the regulation. Due to these interactions, the activation of a single pathway can strongly affect the growth of the entire intestine, while its repression may change only epithelial morphology or the other way around. A prominent example of such complex regulation is hyaluronic acid-induced growth changes in the intestine of postnatal mice [11,12,13]. Simplifying, we start our investigations assuming that postnatal intestinal growth originates in the expansion of the outer, non-epithelial layers of the tissue. This expansion leads to reduced epithelial cell density, loss of contact inhibition of growth and thus to enforced epithelial cell proliferation and crypt fission, that is, to adaptive growth of the epithelium. These assumptions are supported by experimental findings that postnatal hyper-activation of epithelial cell proliferation, while changing the morphology of the epithelium, does not increase intestinal length [Riehl et al., 2015, 2012], that is, does not enforce intestinal growth.
Cd97/Adgre5 is a member of the unique adhesion family of G protein-coupled receptors (ADGRs), which show a bipartite adhesive/receptive structure. Transgenic mice expressing Cd97 in intestinal epithelium (Tg(villin-Cd97)2, in short: Tg2 mice) develop a mega-intestine with hyper-proliferation of the transit-amplifying cells in the postnatal period, though no obvious microscopic intestinal differences exist between adult Tg2 and wild-type (WT) mice [8]. A morphological analysis of the growth process, including the quantification of the crypt and villi size, the crypt numbers and the distribution of proliferative cells in the tissue, has already been undertaken [8]. Here, we provide data on the molecular and cellular changes associated with the formation of the mega-intestine in these mice. We demonstrate that transgenic Cd97 results in premature intestinal differentiation. This would likely reduce, not enhance, intestinal growth as seen in Tg2 mice after downregulation of the key transcription factor Prdm1. However, an increase in growth factor transcripts, among them the EGFR/ErbB1 ligands Areg and Btc, afterwards likely accelerates tissue growth and suppresses full intestinal maturation. These results suggest that the formation of a mega-intestine in Tg2 mice originates in growth factor-enforced expansion of the outer, non-epithelial layers of the tissue.
In order to study the epithelial response of accelerated tissue expansion, we introduce a 3D computational model of an adaptive epithelial growth process including crypt formation, SC expansion and crypt fission. This model describes the growing epithelium and part of the submucosa as self-organizing populations of individual cells that adhere to a polymer membrane and shape it via cell–matrix interactions. Growth of the muscularis, that is, tissue growth, is modelled assuming an externally forced expansion of the polymer membrane.
Simulations of postnatal intestinal growth by our model demonstrate that changes in the tissue growth rate do not affect SC expansion in the adaptive epithelium and suggest a reduced sensitivity to contact inhibition of growth to enable accelerated SC expansion as seen in Tg2 mice. We demonstrate that crypt density can control such regulation. Thus, the expansion of intestinal SCs during postnatal growth might be controlled by 3D tissue organization. Our study shows how computational models fed with appropriate experimental data can support the understanding of cell fate decisions during tissue growth processes.

2. Results

2.1. Properties of Postnatal Intestinal Growth

We start with a simple analytical view on postnatal intestinal growth to clarify our basic assumptions. In newborn mice, substantial intestinal growth starts around postnatal day seven (P7) after pre-crypt structures are formed [14]. It is active for a short period only. We approximate the change in the size of the intestinal surface by dA/dt = rG exp(−t/τG) A. Here, A is the surface, rG the initial surface growth rate and τG the decay constant of growth. It follows:
A = A0*exp(rGG*(1 − exp(−t/τG))
where A0 is the initial size of the surface. Intestinal growth dynamics suggest τG in the range of one to two weeks [6]. The factor exp(rGG) describes the total expansion of A. Both the external and internal areas of the mouse small intestine increase by a factor of about five [15]. Thus, one can estimate rG to be in the range rG = 1–2 per week. Solutions to the equation for different parameter settings are shown in Figure 1A.
During growth, the number of crypts NC increases. The crypt density nC = NC/A of neonatal and adult Tg2 mice is similar to that of WT mice [8]. Thus, we assume that intestinal surface growth and crypt fission are coupled. For constant nc, maximum crypt fission, activity is seen at tmf = τG ln(rgτG). Increasing rG and/or τG increases the final intestinal size and shifts the time of maximum fission activity to higher values. Both changes are evident in Tg2 mice.
In the above approach, rG and τG describe properties of the entire intestine. Patterning of the intestinal tissue, however, depends on properties of all tissue layers (Figure 1B–E). As the epithelial morphology is conserved in Tg2 mice, we expected an enforced growth of the outer layers in these mice and assumed that the epithelium simply adopts to these layers. To support this idea, we characterized the growing tissue experimentally (Figure 1A).

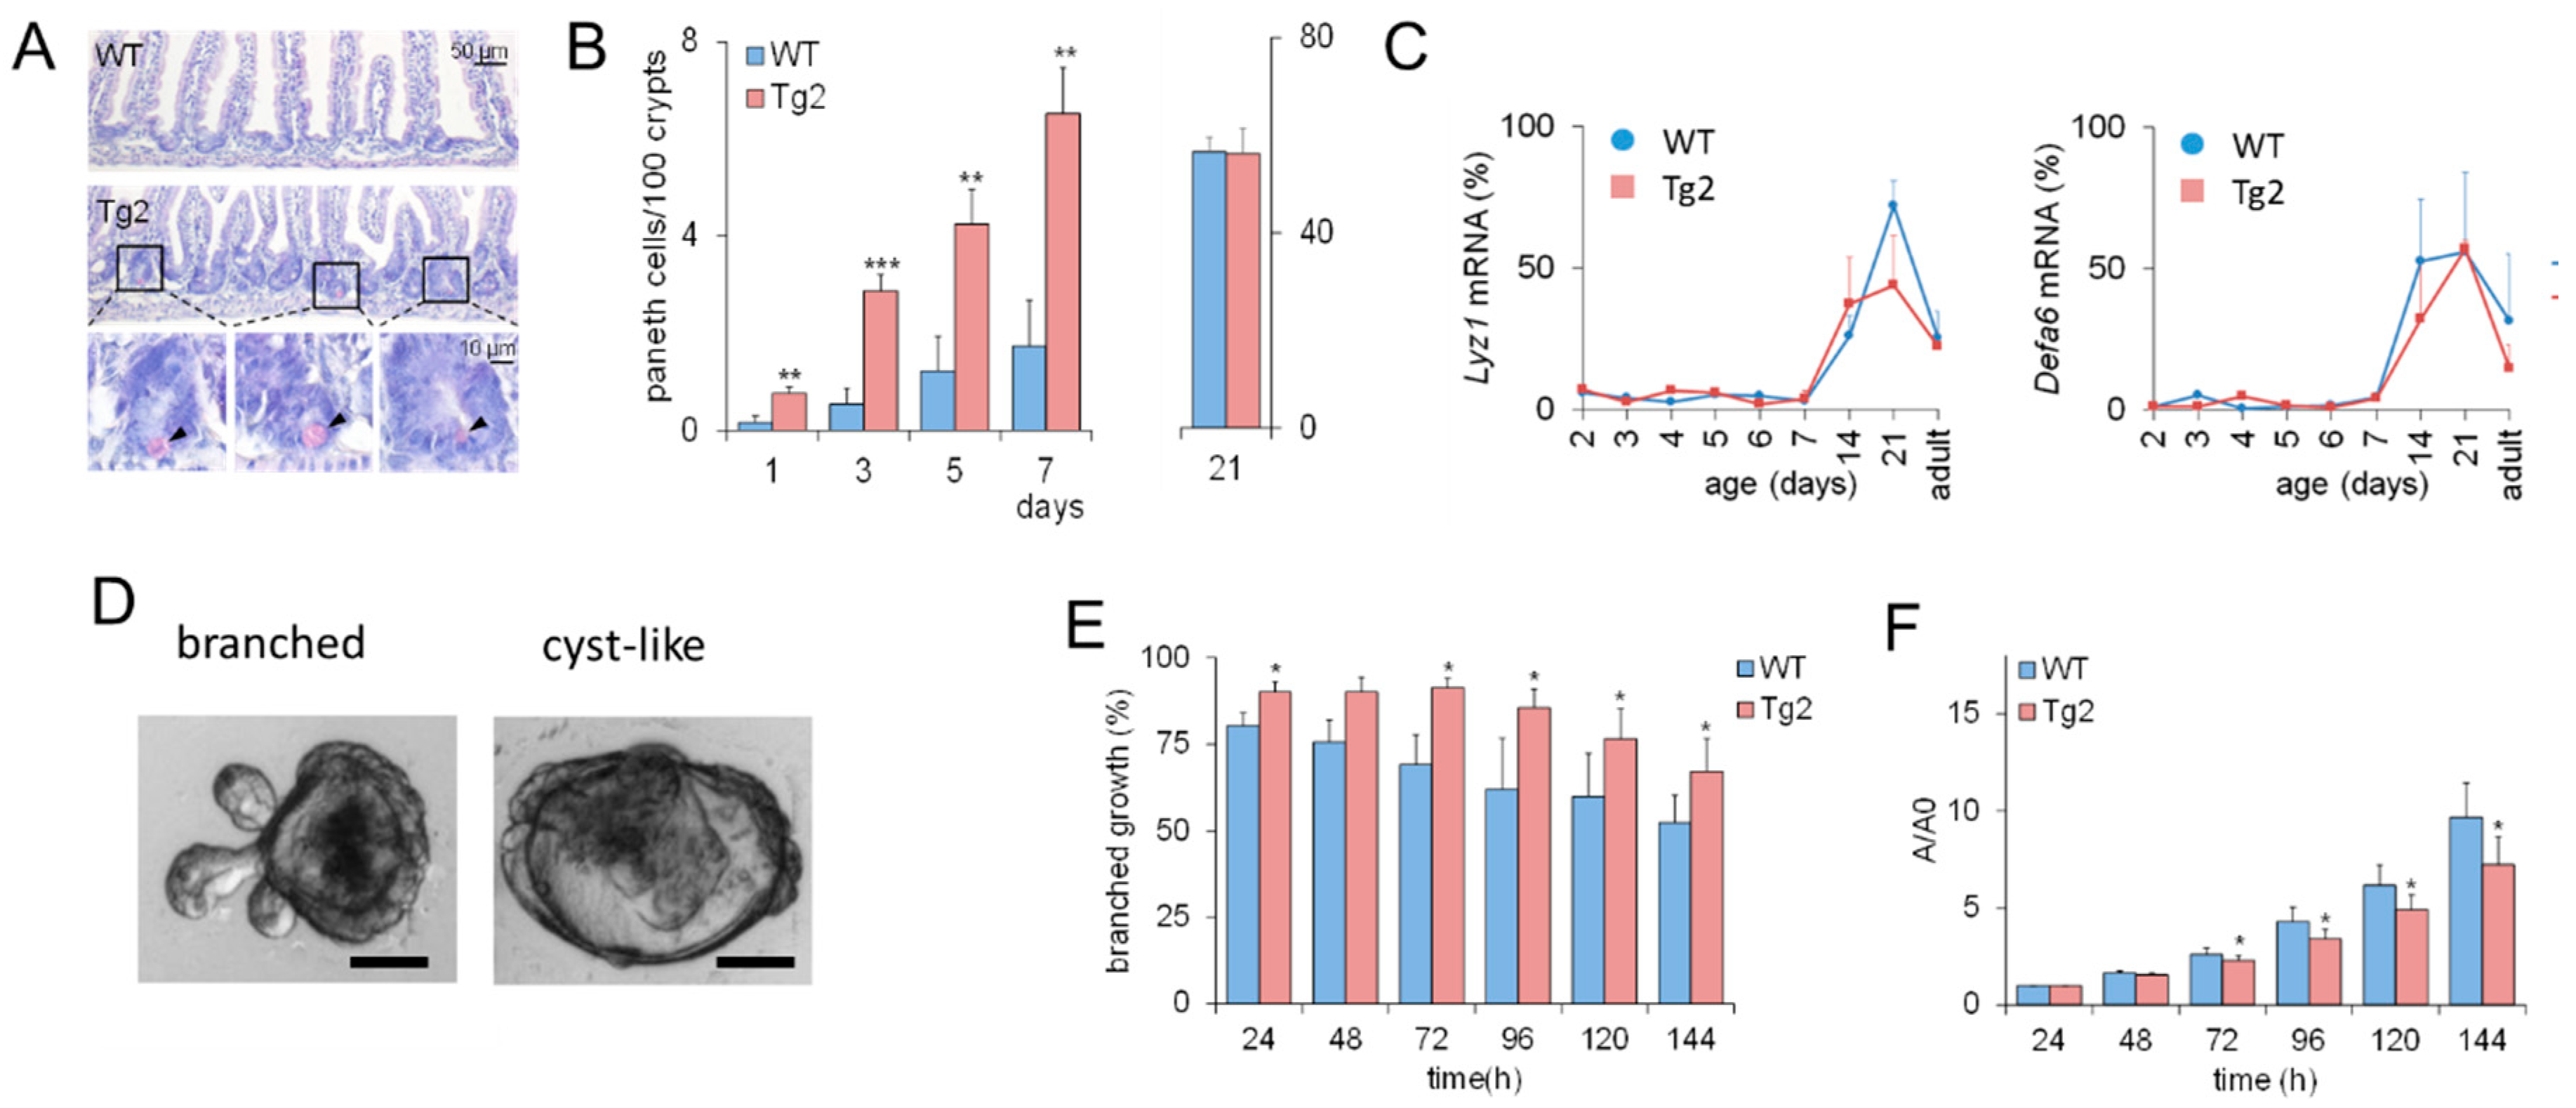
2.2. Accelerated Crypt Formation and Paneth Cell (PC) Specification in Tg2 Mice

The mouse small intestine has narrow finger-like villi at birth. Epithelial proliferation is restricted to the intervillus domain at the base of the villi where crypt development starts [14]. We quantified the progression of crypt formation in the first postnatal week by applying a morphological score defined by the ratio between crypt length and width (Figure 2A,B). At postnatal days P1, P3, P5 and P7, crypts show a higher crypt formation score in Tg2 compared with WT mice (Figure 2C). These morphological changes are not driven by proliferation [14]. Consistently, bromodeoxyuridine (BrdU) incorporation is similar or slightly enhanced in our Tg2 mice compared with WT mice at P2 and P4 (Figure 2D).
These results imply that CD97 expression is associated with early changes in the biomechanical properties of the intestine. Based on previous computational model results [16], we expected that this would also affect intestinal cell lineage specification. Thus, we verified whether the accelerated crypt formation is accompanied by an accelerated cell specification in Tg2 mice. We focused on PCs (Figure 3A), which contribute to the formation of the SC niche [17]. In the first postnatal week, the PC number increased in both mice (Figure 3B), but the increase was about three-fold higher in Tg2 compared with WT mice. We tested whether this earlier PC specification coincides with earlier PC maturation. Until P7, markers of mature PCs (Lyz1, Defa6) were poorly detectable by qRT-PCR. Thus, either PC maturation is not accelerated in Tg2 mice, or the PC number is still too small for detection. At P14, P21, where crypts grow in length (Supplement 1, Figure S1), and in adult mice, expression of these genes is similar in Tg2 and WT mice (Figure 3C).

2.3. Mature Growth Characteristics of Organoids Derived from 2-Week-Old Tg2 Mice

Premature crypt formation and PC specification might be an intrinsic epithelial effect or related to changes in the submucosa of Tg2 mice. To answer this question, we applied an intestinal organoid culture. Intestinal organoids differ in their growth pattern depending on mouse donor age. Foetal organoids normally show cyst-like growth (Figure 3D and Figure S1), whereas organoids from adult mice are more often branched [18]. In organoids derived from two-week-old Tg2 mice, this transition is accelerated; that is, they grow branched more often than organoids derived from age-matched WT mice (Figure 3E). Accordingly, their growth rate is reduced compared to age-matched WT mice (Figure 3F). It is more similar to that of organoids derived from adult WT mice (Supplement 1, Figure S1, [19]). Thus, premature development is an intrinsic property of Tg2 intestinal tissue. This observation seems to be in contradiction to the development of a mega-intestine in these mice.

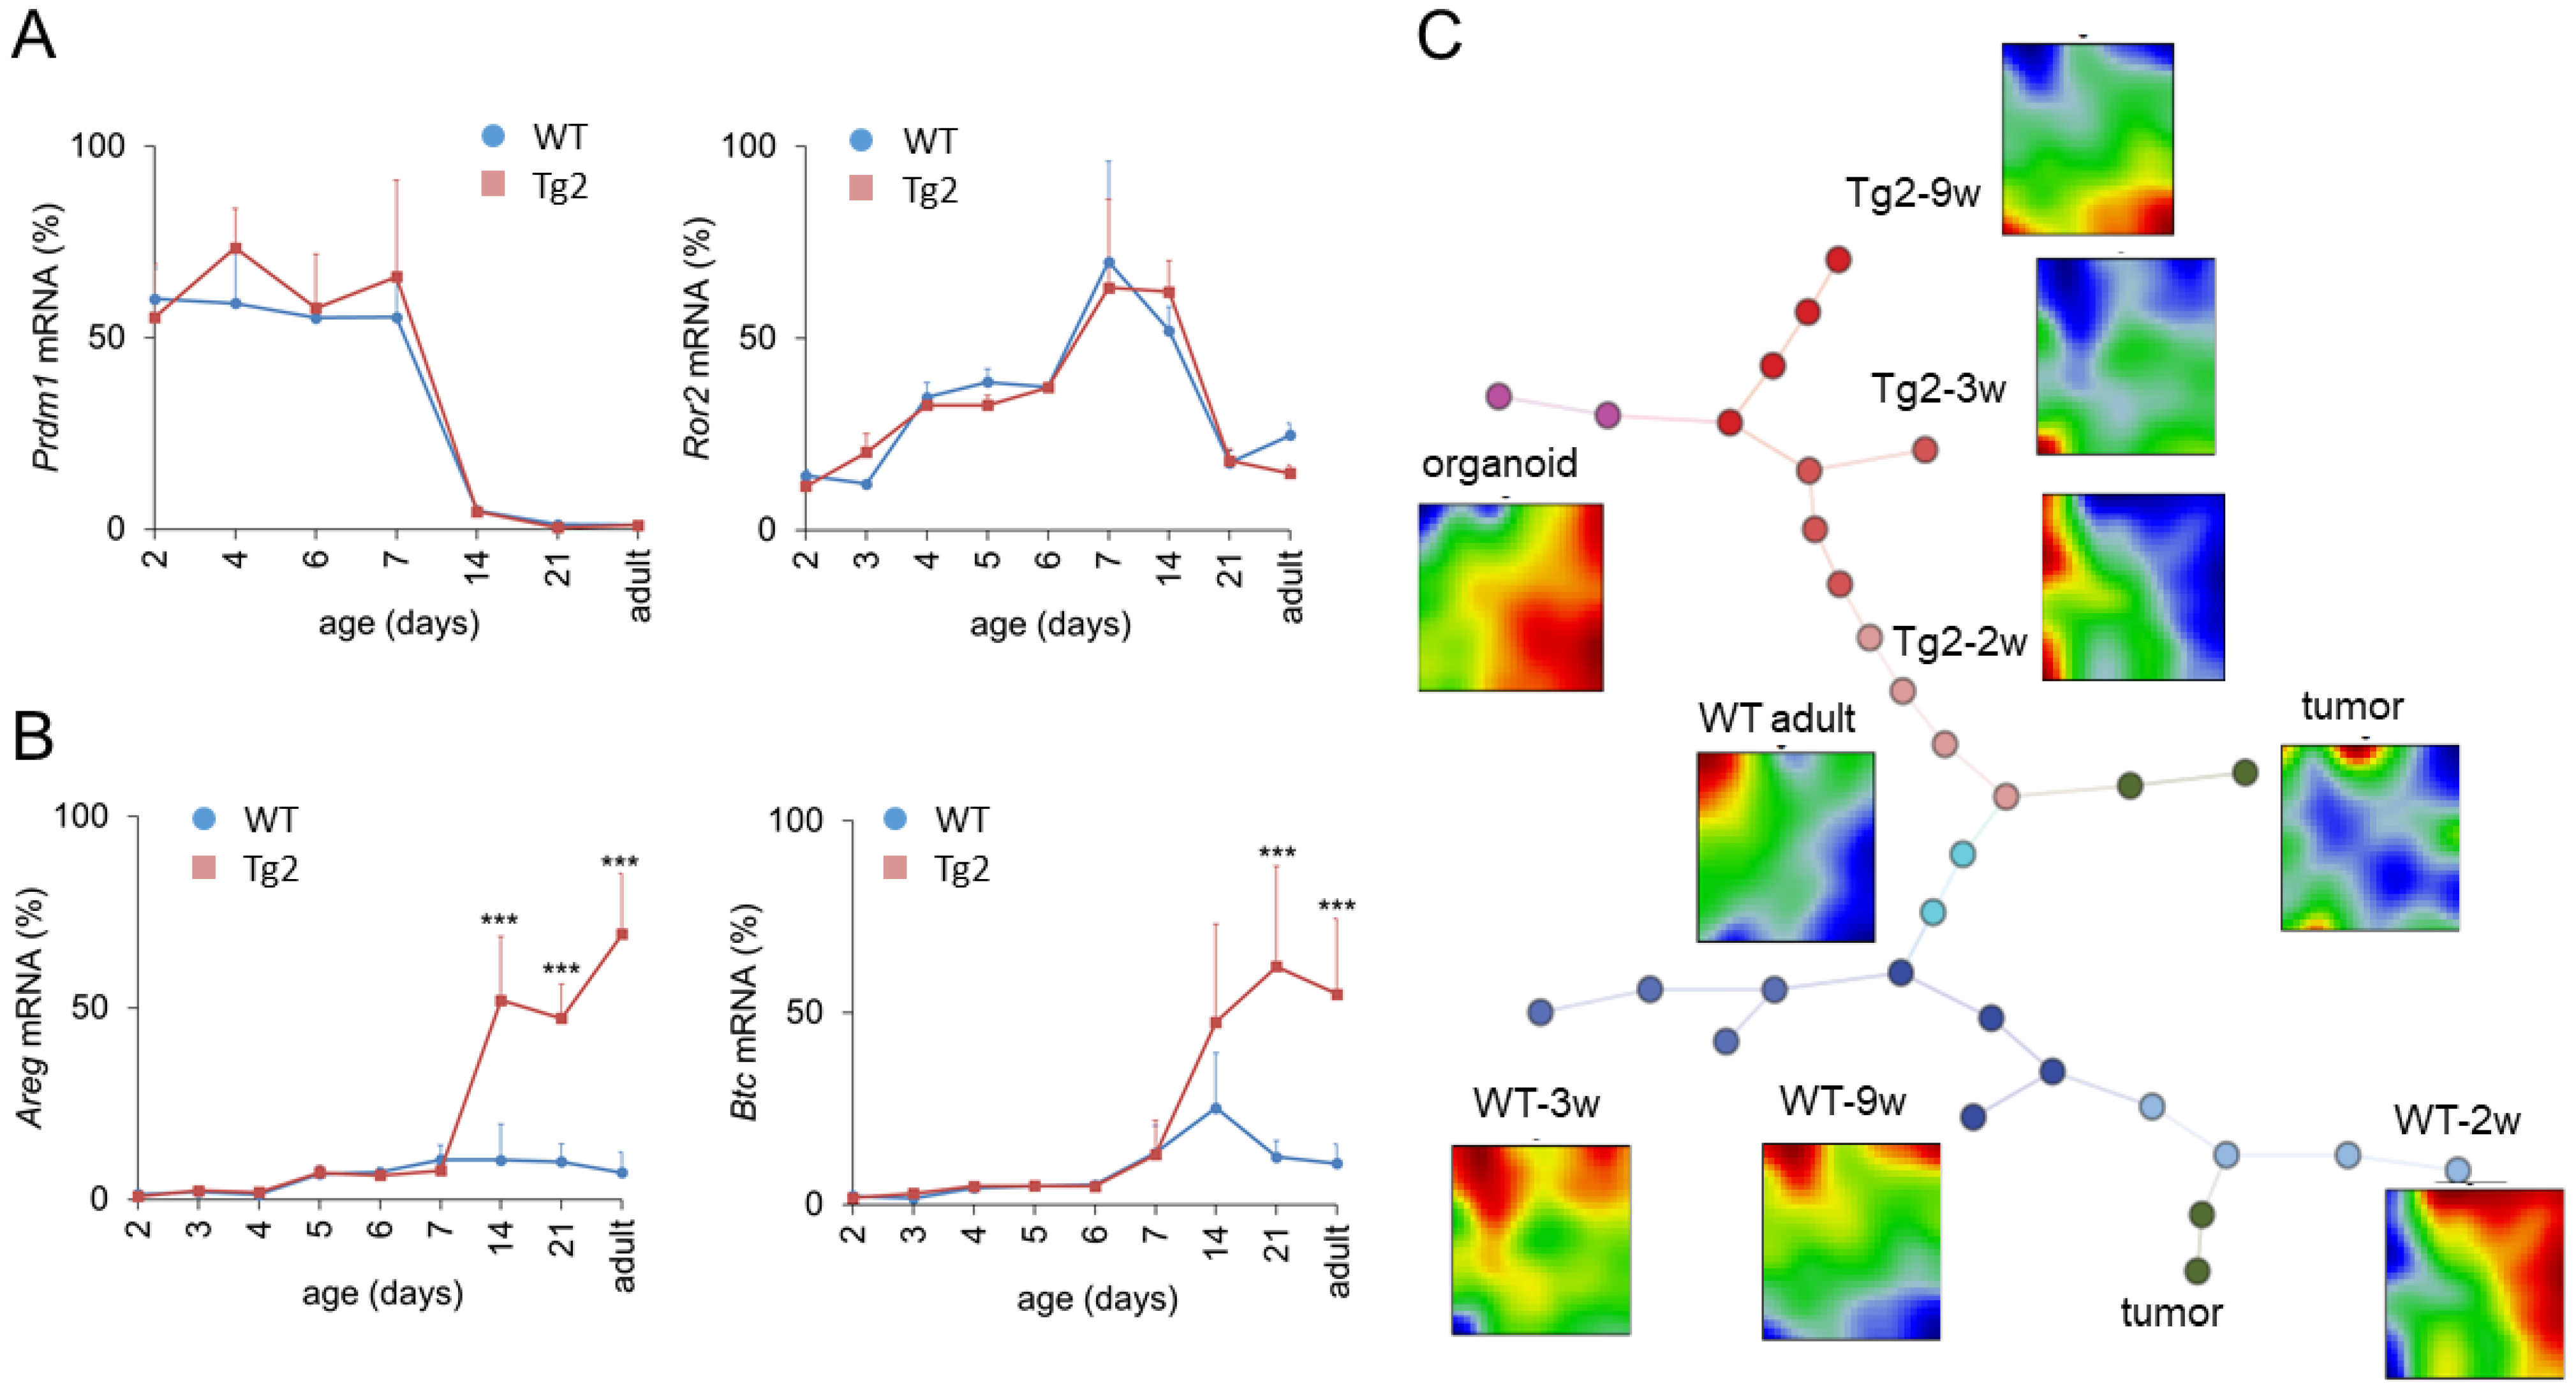
2.4. Changed Expression of Growth Factors in Tg2 Mice after Prdm1 Downregulation

Prdm1 is a key regulator of enterocyte maturation during postnatal development. Early enlarged crypts as seen in Tg2 mice are also present in Prdm1 knock-out mice at P7 [20]. To exclude disturbed Prdm1 regulation in Tg2 mice, we quantified its expression. Within the first weeks after birth, Prdm1 expression was similar in Tg2 and WT mice (Figure 4A). In accordance with [20,21], Prdm1 was downregulated in both mice around P14. Thus, premature intestinal development in Tg2 mice is not related to an early Prdm1 downregulation: Although crypts are formed earlier, essential gene regulatory processes associated with intestinal maturation are not accelerated. In the following, we focused on the time after Prdm1 downregulation.
A potential scenario of Tg2-specific intestinal growth is prolonged midgut elongation. Midgut elongation in the embryo is controlled by the Wnt5A ligand Ror2 [22]. However, Ror2 levels are similar between Tg2 and WT mice after birth and drop after Prdm1 downregulation (Figure 4A). This suggests that embryonic growth is not prolonged in Tg2 mice and stops after Prdm1 downregulation. In order to explain the mega-intestine formation, we next analysed growth factor regulation.
Growth factors, such as Areg and Btc, which bind to the ErbB family of receptor tyrosine kinase 1 (ERB, also named EGFR), increase the proliferative activity and regenerative potential of the intestinal epithelium [23,24] but can also stimulate the proliferation of smooth muscle cells [25]. Areg is a direct target of Yap1 and its induction contributes to Yap1-mediated cell proliferation [26]. In the intestine, the activation of Yap1 mediates the proliferation of smooth muscle cells and induces intestinal length growth [27,28]. Thus, we considered Areg and Btc as potential regulators of intestinal growth. We quantified their expression during the postnatal period until adulthood (Figure 4B). Until P7, Areg and Btc are weakly expressed. Afterwards, both are slightly upregulated in WT mice but strongly upregulated in Tg2 mice. This suggests that these growth factors might stimulate the enforced growth of the Tg2 intestine starting after Prdm1 downregulation.

2.5. Global Gene Expression Changes in Tg2 Mice

To screen for molecular differences between Tg2 and WT mice after Prdm1 downregulation more systematically, we analysed intestinal transcriptomic profiles starting from P14 in detail. Based on microarray data of intestinal samples of two-, three- and nine-week-old (2w, 3w, 9w) Tg2 and WT mice, we calculated gene self-organizing maps (SOM). To improve data confidence, we included data from intestinal samples of adult WT mice, intestinal tumours and WT organoids [8].
The SOM portraits differ starkly between WT and Tg2 at all developmental stages and remain different with increasing mouse age (2w-3w-9w) (Figure 4C), despite the similar morphology [8]. These differences are obvious when comparing the position and extension of over- and under-expression spots in the average group portraits.
SOM portraits of Tg2-2w mice are more like WT adult portraits than the portraits of WT-2w mice, supporting the above results on Tg2 premature differentiation. However, with increasing mouse age, Tg2 samples develop more and more similarity with WT organoids, suggesting a growth factor-controlled state similar to that of organoids [29]. This concerns enterocytes (ECs) and goblet cells (GCs) in particular. We analysed these findings in more detail (see also Supplement 1, Figures S2 and S3).

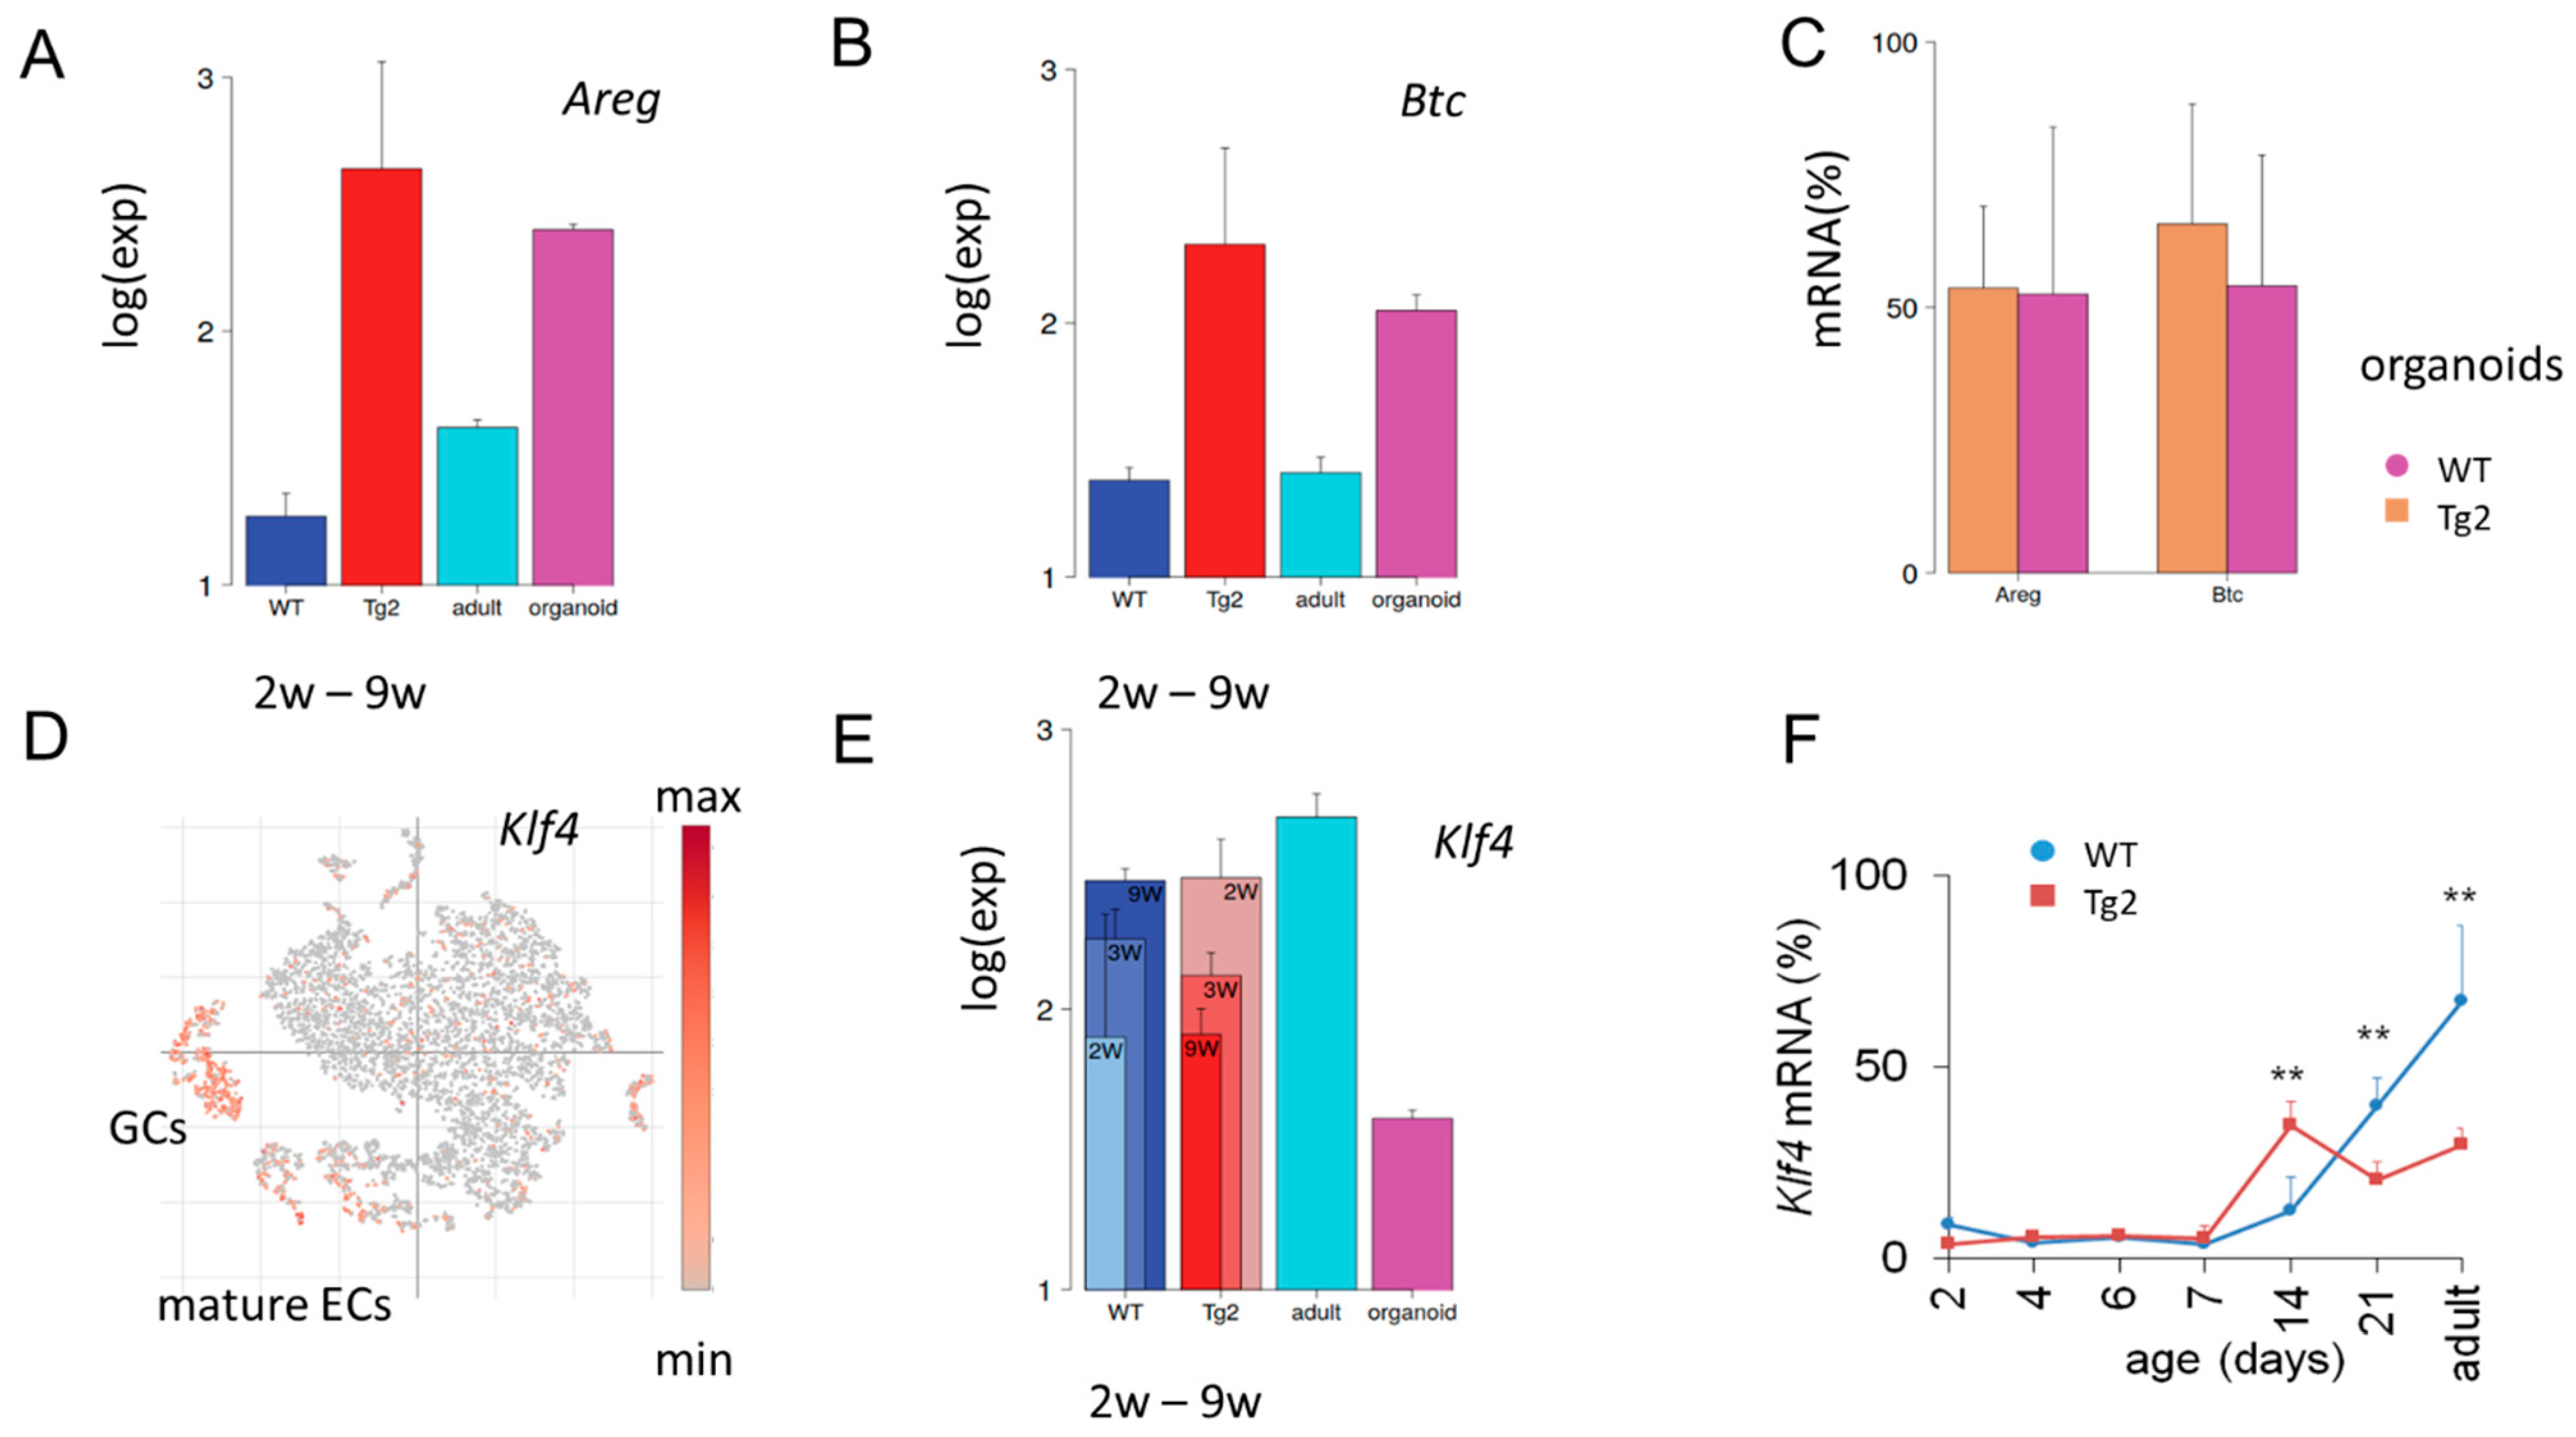
2.6. Specific Gene Expression in the Intestinal Epithelium in Tg2 Mice

Accelerated growth of non-epithelial tissue layers in Tg2 compared with WT mice would require mechanisms of transactivation. Our qRT-PCR results on Areg and Btc suggested an enhanced secretory activity of the Tg2 epithelium. To support this hypothesis, we searched for further expression characteristics stably induced by transgenic Cd97. We found an entire gene cluster similarly activated in Tg2 (2w, 3w, 9w) mice and repressed in young WT (2w, 3w, 9w) mice (Supplement 1). Functional annotation shows that the cluster genes associate with the GO sets’ “response to retinoic acid” and the “immune system process”. Consistent with our qRT-PCR, we found Areg and Btc among these genes (Figure 5A,B). Their expression in Tg2 mice is activated similarly as in WT organoids, confirming an expression similarity between Tg2 tissue and organoid samples. There seems to be no additivity of this activation, as organoids from Tg2 and WT mice show similar expression (Figure 5C). While Areg and Btc are only weakly expressed in WT tissue, other genes of the cluster, such as Cldn4 and Tm4sf4, are typically activated in adult secretory cells including GCs, tuft and enteroendocrine (EECs) cells (Supplement 1, Figure S4). Their increased expression further supports the idea of an enhanced secretory activity of the Tg2 epithelium.

2.7. Early Transient Activation of the Differentiation Marker Klf4 in Tg2 Mice

Klf4 is expressed in post-mitotic, differentiated ECs and GCs [31] (Figure 5D) and regulates homeostasis of the epithelium [32]. In mice with conditional loss of Klf4, both the rates of proliferation and the migration of crypt cells are increased and the expression of genes encoding regulators of differentiation is reduced [33]. At P14, we found Klf4 upregulated in Tg2 compared with WT mice, while later in development after P21, this relationship reverses (Figure 5E). We confirmed the result by qRT-PCR (Figure 5F). These findings support a premature differentiation at P14 in Tg2 mice and a suppressed maturation in adult Tg2 mice and propose Klf4 expression as a marker to monitor this fate change.
Klf4 can be increased, and the protein can be stabilized by phosphorylated Stat3 [34]. As CD97 can activate Stat3 [35], our data provide a potential link between transgenic Cd97 and early increased Klf4 in Tg2 mice. How Klf4 becomes repressed in Tg2 mice with age remains an open question.
In summary, the gene expression in Tg2 mice is consistent with the hypothesis of an enforced expansion of the outer intestinal layers in these mice and suggests growth factors as inducers.

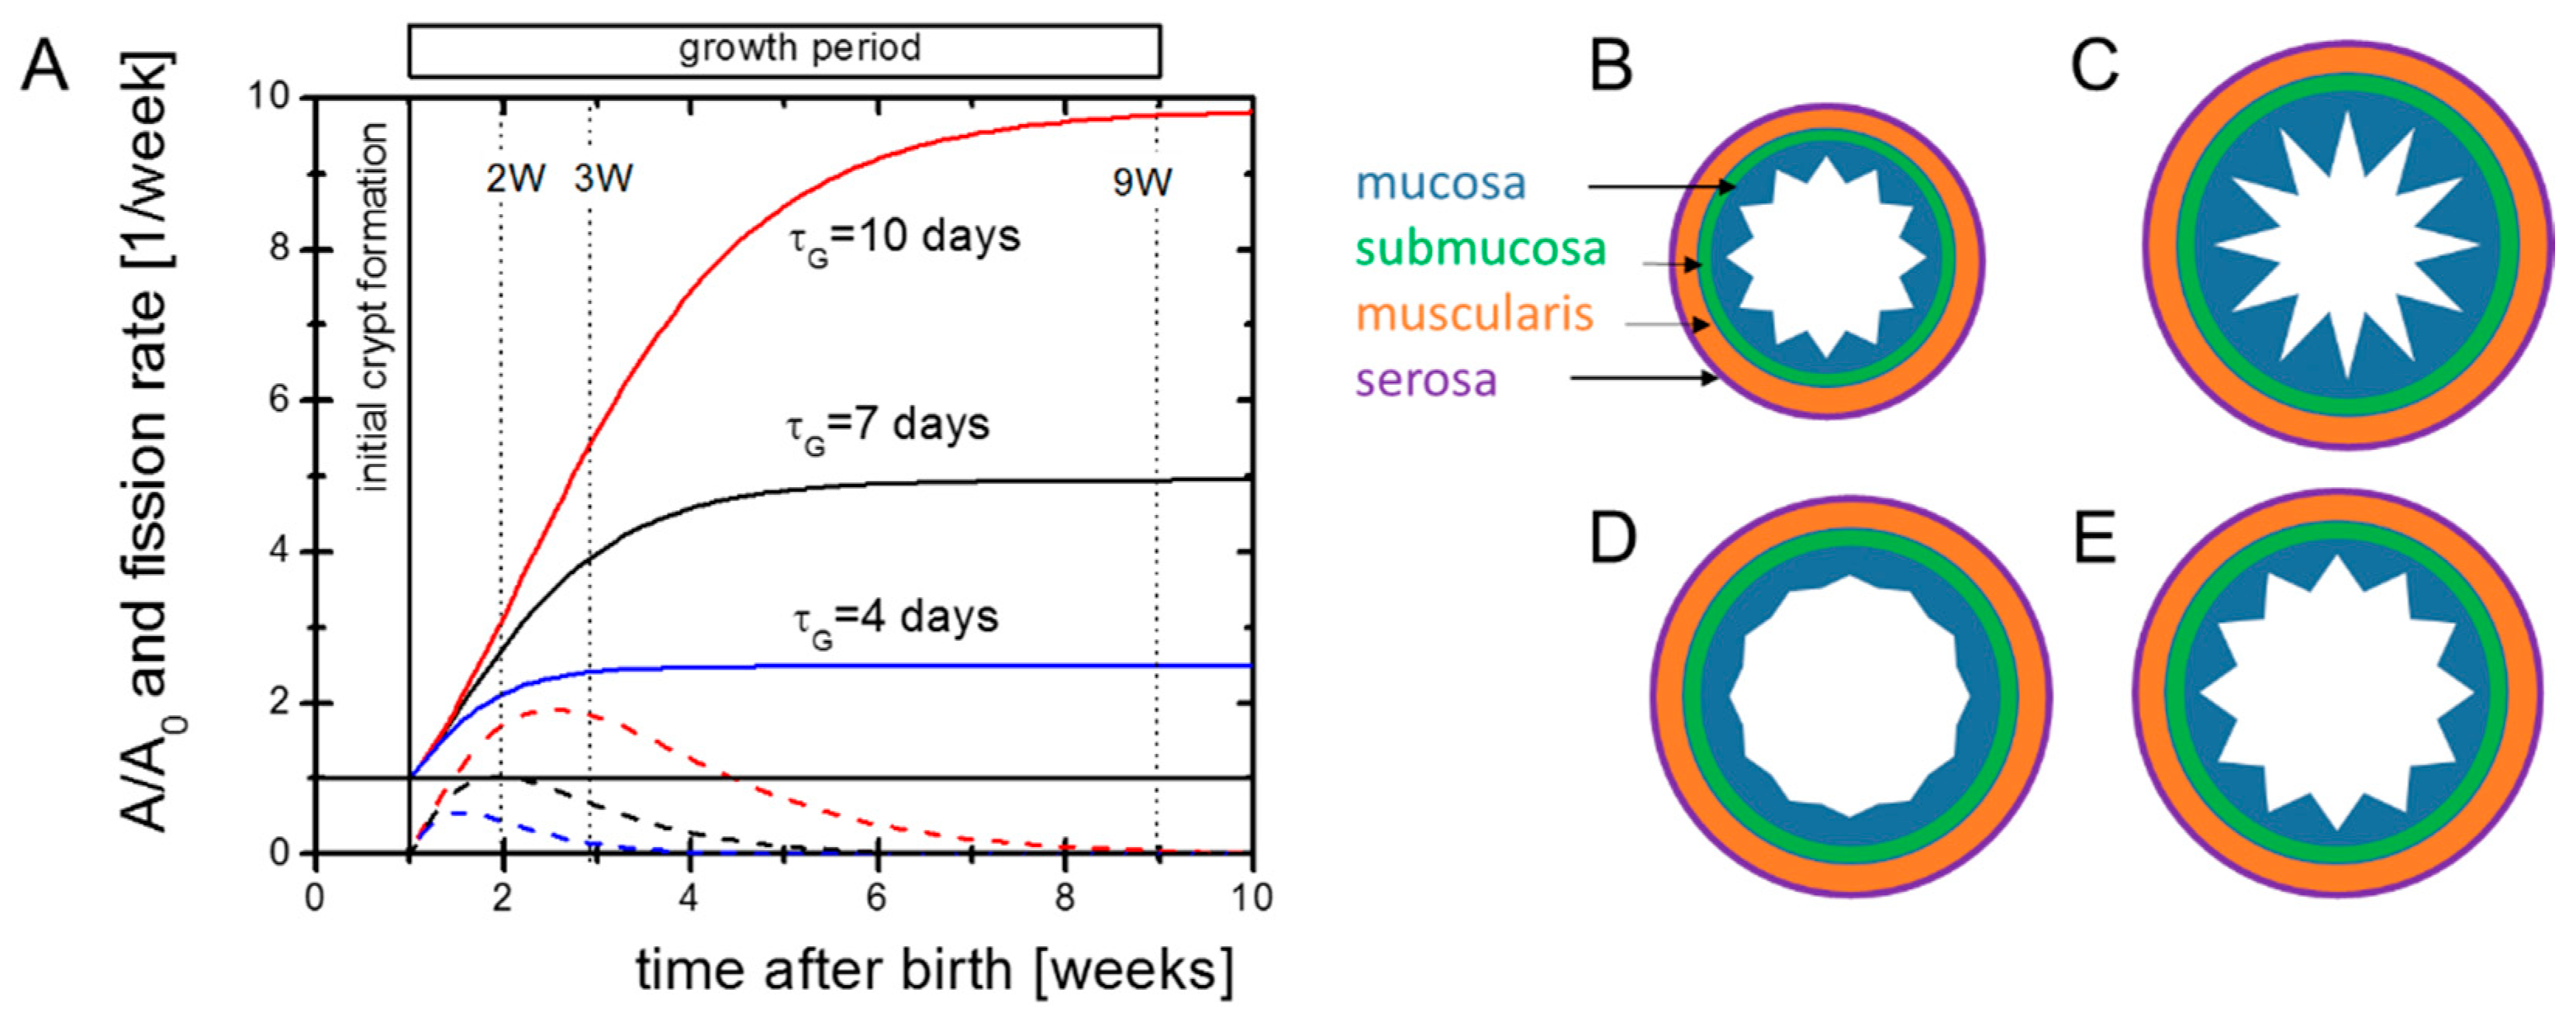
2.8. A Computational Model of Neonatal Crypt Formation

From our experimental data, it remained open whether the observed increase of growth factors in Tg2 mice activates epithelial proliferation as well. We expected adaptive growth of the epithelium because intrinsic activated proliferation during postnatal growth leads to morphological changes [13] not seen in Tg2 mice. Thereby, the question arose of whether spontaneous adaptive growth of the epithelium in parallel allows for crypt fission.
To answer this question, we introduced a computational model allowing the simulation of self-organized epithelial fate determination. This model comprises: (i) a population of epithelial cells adhering to a basal membrane (BM) and (ii) a population of fibroblasts adhering to the opposite side of the BM. The modelled epithelial population contains stem cells (SCs; in the following, italics indicate model cells) that can proliferate permanently. SCs maintenance requires high Wnt and Notch activity. If these activities decrease, SCs change their fate and specify into PCs, GCs and ECs (Figure 6C) [36]. Thereby, PC specification requires a positive threshold curvature of the tissue. Epithelial cells have proliferative capacity until they become terminally differentiated. Fibroblasts do not change their fate.
The BM is represented by a network of semi-flexible polymers. Allowing the network to re-organize, the in silico intestinal mucosa can change shape according to cell–cell and cell–network interactions. Details of the model are explained in Supplement 2.
We started our simulations with a cylindrical tissue of fixed length representing inter-villus junctions. External forces induce permanent radial growth of the cylinder with rate r (Supplement 2, Figure S5). Epithelial cells completely cover the inner, fibroblasts the outer, surface of the cylinder. Cell proliferation induces pressure in the system and cells move towards sinks in the pressure. Such sinks are localized at the openings of the intestinal cylinder. Cells crossing the openings are removed and therefore the pressure drops to zero. We assume that these cells actively migrate onto the villi [37] or follow a contraction of the differentiating villus epithelium [38]. The ‘cell turnover’ onto the villi per time unit corresponds to the pressure distribution that establishes in the system. If the turnover is blocked, cell density and thus pressure increases, and cell production becomes limited by the radial growth. For r = 0, constant pressure establishes where all cells undergo contact inhibition of growth.
During an initial simulation period, SC maintenance is supported by external Wnt in the central part of the tissue (Figure 6A), consistent with high Wnt activity in the inter-villus regions of mice after birth [39]. Specification of PCs, which provide Wnt, cannot occur in the initial tissue configuration because local curvature is too low. Only, over time, the re-organization of the polymer network enables high local curvature and thus PC specification. External Wnt is switched off if a threshold number of PCs (NPC = 20) has been specified. Subsequently, SCs gain Wnt from these and further established PCs only. We consider this time point as the starting point of our postnatal growth simulation (t = 0).

2.9. Basic Model Simulations of Crypt Formation

For our simulation studies, we applied parameter sets from our organoid model [16]. For simplicity, fibroblasts are modelled like ECs (Supplement 2). Notably, the self-organizing epithelial cell population alone tends to form small villus-like structures instead of crypts (Figure 6B). The fibroblast layer on the opposite site of the BM compensates this trend, and tissue shape changes preferentially occur due to specific biomechanical properties of the BM in contact with PCs.
Our simulations demonstrate that crypts form, expand and undergo fission in parallel to tissue expansion, with and without blocked turnover onto the villi and at a wide range of growth rates r (Figure 6C–E, Supplement 2, Figure S6). For the chosen parameters, the formation of crypts takes about two weeks. Afterwards, crypts reach a size where they start fission (Video A). Fission is induced by separating PC clusters and includes fibroblast movement similar to that of mice [40,41]. Most of the crypt fission events take place within cross-sections of the cylinder as crypts expand asymmetrically due to radial growth (Figure 7A). In our simulations, the fission process takes more than an additional week of development. A statistical analysis of this process is therefore out of reach even with high computational power (see Materials and Methods).
Before crypt fission, two growth phases occur (Figure 7A). In the initial phase after the Wnt switch, the number of SCs decreases because only those SCs remain that are stabilized by PCs (Figure 7B). SCs tend to switch into epithelial lineages (EC, GC) after external Wnt is exhausted. Afterwards, in the expansion phase, the SC numbers increase, because the BM in contact with PCs expands under the pressure induced by proliferating cells. This leads to specification of new PCs, as they are required for SC maintenance. Consequently, a larger part of the BM expands and the number of SCs increases further. This positive feedback explains why niche cell numbers (SCs and PCs) grow exponentially with a constant doubling time tD (Figure 7C).
During SC expansion, a stable cell turnover onto the villi establishes although the SC number steadily increases, that is, a defined number of cells NT is released per crypt that is shared between the growing inter-crypt surface and the villi. This is a result of the SC niche pressure, which is induced by the force required to push cells out of the crypt. Reaching a threshold pressure, cells start undergoing contact inhibition of growth, and turnover cannot further increase. To reach a stable cell turnover, NT, a minimum number of SCs per crypt is required, which depends on their cell cycle time. For a longer cell cycle time, more SCs are required to reach a stable cell turnover (Figure 7B). They ensure similar cell production and, accordingly, longer cell cycle times do not result in a lower turnover.
Lower turnover is observed when the radial growth rate r is increased. In this case, more and more cells are required to cover the inner surface of the cylinder. This reduces the pressure in this part of the tissue and thus the number of cells moving onto the villi. Therefore, without additional changes, villi would shrink with increasing radial growth rate r. Contrarily, increasing r does not affect the niche pressure or the SC doubling time tD (Figure 7D). This might change if the radial tissue growth requires cell production above NT(r = 0). The simulation of such a fast expanding system unfortunately exceeds our current computational power.
In summary, the model suggests that the expansion of the intestinal SC population, a prerequisite for crypt fission, is largely independent of the tissue growth rate.

2.10. Simulation of Accelerated Crypt Formation

For a limited time, the increased cell production required during tissue growth can be provided by the crypts if their production NT(r = 0) is initially not exhausted, as in the case of blocked turnover onto the villi. However, over the entire growth process, stable cell production per unit tissue area can be ensured only by keeping a defined crypt density. Thus, new crypts have to form via fission. To ensure constant crypt density for increasing r, the crypt size for fission (Figure 6E) has to be reached within a shorter time; SC niche expansion must become faster (fission rate = 1/SC doubling time). A straightforward way to accelerate niche expansion is to increase the niche pressure.
Blocking turnover increases the density and pressure in the cylinder region but has only a marginal effect on the niche pressure. Accordingly, the SC doubling time tD remains constant when blocking the turnover (Figure 7C). Shortening the SC cycle time τ decreases their doubling time td (Figure 7D), that is, higher pressure establishes regardless of the same sensitivity to contact inhibition of growth. Here, the increased pressure results from cells that leave the G0 phase and start growing. The faster they grow, the faster neighbouring cells are pushed away. At the crypt bottom, this applies also to neighbours that stay in G0. A dynamic pressure to move them, which increases with decreasing cycle time τ, adds to the static pressure to keep them quiescent. However, epithelial cells are much more flexible in their shape than in their in silico models, which dampens this effect. Thus, we consider such effects in mice as minor.
An immediate increase of the niche pressure can be achieved by decreasing the SC sensitivity to contact inhibition of growth such that they can proliferate at a higher niche pressure. This pressure then establishes and niche expansion accelerates. We modelled such a scenario by increasing the relative compression that is tolerated by the cells, dV/V0. When plotting the SC doubling time td over the median compression of the SCs, which is proportional to the pressure in the niche, an inverse dependency between both is observed. A fit of the data allows estimating the median compression where crypt growth vanishes, that is, td goes to infinity (Figure 7E). Importantly, an intestine with WT morphology can only develop if the rate of tissue growth and SC expansion (crypt fission) are synchronized. A specific synchronization in Tg2 mice is unlikely, suggesting a crypt density-controlled mechanism that acts similarly in both WT and Tg2 mice.
Following this idea, we took up our simple analytical model. We assumed crypt density-dependent fission activity: dN/dt = c(nc)N, with a rate c(nc) = rM (1 − nC/nCE), where nCE is the equilibrium crypt density. As c(nc) = 1/td, this is synonymous with a crypt density-controlled SC expansion. Replacing in Equation (1) ‘rG A’ with ‘rC NC’ allows us to study the growth process under this control mechanism. Here, rM and rC are constants describing the maximum fission rate and the surface production rate per crypt, respectively. Initially, the crypt density drops, but afterwards it reconstitutes in parallel to the vanishing growth of the non-epithelial tissue layers (Figure 7F). Prolonged growth of these layers simply leads to a prolonged time to reach the equilibrium crypt density. Thus, a crypt density-controlled contact inhibition of growth in the SCs can explain the growth of the intestinal epithelium in postnatal mice.

3. Discussion

Through the simulation of tissue dynamics, computational tissue models allow the causal linking of successive experimental observations. They have the advantage that they can be developed with a long-term view; if computational capacities are improved, further questions can be addressed based on the same model or straightforward model extensions. Exploiting these capabilities, computational tissue models have strongly supported the understanding of fate control of intestinal SCs in the last decade [42]. Here, we introduce an individual cell-based model of postnatal intestinal growth that builds on our previous models of the adult intestinal crypt [36,43] and intestinal organoids [16,44]. General results on intestinal postnatal growth obtained in simulation series were then utilized to link different experimental data on transgenic mice that express Cd97 in the intestinal epithelium and develop a mega-intestine with normal microscopic morphology [8].
We provided evidence that in transgenic Cd97 mice, the formation of the intestinal SC niche immediately after birth (P1–P7) and the following maturation of the intestine (P7–P14) are accelerated. This is somewhat counter to the formation of a mega-intestine seen in the adult transgenic mice. Around P14, when Prdm1 is downregulated, several growth factors, known to be associated with crypt-fission and tissue growth during regeneration, become upregulated in the transgenic Cd97 mice. These findings suggest an adaptive growth of the epithelium following accelerated intestinal growth. The regulation is an example of concurrency between autonomous and conditional fate specification induced by gene expression differences. Changes of tissue specification can be monitored, for example, by Klf4, which shows inverse regulation in Tg2 compared with the WT intestinal epithelium.
In our computational model, the expansion of the SC population is largely independent of the tissue growth rate and therefore not spontaneously adaptive. SC expansion is determined by the sensitivity to contact inhibition of growth, a cell-intrinsic property, and by SC niche biomechanics. Adaptive growth of the epithelium thus requires explicit synchronization between tissue growth and SC expansion (leading to crypt fission), not considered in the model. Similar morphology in transgenic Cd97 and WT mice argues for a crypt density-controlled SC expansion. Such regulated adaptation might be realized by secretory activity of the epithelium and the cells of the submucosa as described by [11].
As crypt fission is initialized by separating clusters of PCs, we expect PC specification to be involved. A potential mechanism is increased PC specification at low crypt density. According to former model studies, high external Wnt or R-spondin enforces PC specification [16]. An isolated crypt surrounded by niche mesenchyme (e.g., sub-epithelial fibroblasts) that produces these factors [45] can attract more factors than competing crypts. Alternatively (or in parallel), a high concentration of noggin or gremlin1/gremlin2, also produced by the niche mesenchyme, represses bone morphogenic protein (BMP) [46] and therefore enforces niche expansion. This effect is also stronger at low crypt density.
The suppression of BMP in the villus mesenchyme can even result in de novo crypt formation in adult tissue [47]. Such behaviour has been modelled, applying Wnt and BMP diffusion–reaction systems [26]. However, de novo crypt formation contributes to the early postnatal intestinal phase only, whereas crypt fission is the dominant process later. Theoretical approaches predict a fixed wavelength of related tissue organization, depending on the biomechanical properties of the intestinal tissue [48]. Such organization is also seen in the first steps of our model simulations, and subsequent crypt growth based on those established structures.
In summary, we suggest the following scenario for the formation of a mega-intestine with an epithelium that shows WT morphology: First, tissue growth becomes accelerated by growth factors. In parallel, cell turnover of the crypts is increased to enable stable growth of the villi. Stable crypt density for different growth velocities suggests that this increase is ensured by the formation of new crypts via enforced fission. Enforced fission requires enforced SC expansion. We suggest that such enforced expansion originates from decreased sensitivity to contact inhibition of growth that is regulated by crypt density. In other words, we suggest a spontaneous adaptive behaviour of the epithelium following accelerated tissue growth.
Tissue growth has been linked to Areg and Btc expression [10]. Thereby, epithelial secretion might induce an entire cascade of signals that allows signal progression towards the outer layers such as the muscularis. According to our general tissue growth scenario, accelerated growth might originate either in a higher value of the initial growth rate rG or in a larger value of the decay constant of growth τG, due to increased growth factor expression. As long as the general growth scenario is conserved, tissue growth will eventually stop. It can partially reactivate after ileocecal resection but in the radial direction only [49]. Thereby, crypt density on the circumference remains conserved as well.
What ultimately stops SC expansion and thus crypt fission? Here, we suggest a crypt density-dependent mechanism regulating contact inhibition of growth. However, regulated pressure resistance of the BM or contractility of the fibroblast layer represent alternative scenarios.
During homeostasis, the epithelium changes from adaptive fission to adaptive proliferation. The pressure within the differentiated epithelium, which is reduced during the tissue growth phase, is increased and apoptosis on the villi starts. Increasing rates of apoptosis can be balanced by activating (accelerating) the proliferation of quiescent (slowly proliferating) intestinal SCs. The actual distribution of proliferating cells is determined by the rate of apoptosis. Massive apoptosis that exceeds the regenerative capacity can even result in villus contraction [7]. Cell loss is not balanced by crypt fission. It can be reactivated following crypt loss only, for example, as a consequence of radiation [50].
While the morphological differences between Cd97 transgenic and WT mice vanish in adult mice, gene expression differences persist. Regardless, tissue growth stops. Does decreased sensitivity to contact inhibition of growth persist during homeostasis in adult transgenic Cd97 mice? Results on EGFR-signalling might support this idea [51]. Decreased sensitivity to contact inhibition of growth does not change the distribution of proliferative cells but enables faster regeneration, because more cells per time unit can be provided. This would explain why Tg2 mice are more protected against DSS-induced colitis [52]. However, increased tissue pressure would change the morphology of crypts and villi, most probably increasing their size. This is not seen in transgenic Cd97 mice, indicating that higher cell contractility is responsible for protection against colitis. Morphological changes are also present in other mice that develop a mega-intestine, for example, in Cldn15 knock-out mice [9], indicating remaining changes in the growth balance in these mice.
Besides suggesting a postnatal growth scenario, our simulation results provide a hypothetical link between several phenomena induced or regulated by CD97, such as postnatal intestinal growth, DSS-induced colitis and tumour invasion. Further potential applications of the model are studies on how aberrant SC specification and BM biomechanics following mutations affect crypt formation and potentially lead to tumour precursor states as in familial adenomatous polyposis [53]. Simulation of the proposed crypt density-dependent control of crypt fission will require massively improved computational capacities. Clearly, as in any other computational model, the introduced model does not provide a one-to-one description of the tissue under consideration. Thus, the hypotheses generated about fate control during postnatal growth need to be validated experimentally. Here, model simulations can be utilized to suggest efficient experimental strategies.

4. Materials and Methods

4.1. Model of Neonatal Crypt Fission

The model builds on our former approaches to intestinal crypt and organoid dynamics. It describes populations of different cell types interacting with a basal membrane (BM). Cells are represented by elastic spheres and the BM by a triangulated network of semi-flexible polymers. In the following, we provide a brief description of the model. Further details and parameters are given in Supplement 2, Table S1.
As in our models of organoid growth [16,44], the BM is free to move and re-organizes permanently in response to cell-BM interaction. BM movement is the origin of tissue shape changes. BM re-organization, comprising the introduction of new triangles and the removal of existing ones, ensures that the mesh size of the BM is kept within a defined range. On one hand, this avoids penetration by cells from the epithelial or the sub-epithelial cell populations; on the other hand, it keeps the polymer number technically tractable.
The cell specification and differentiation of the model epithelium into subpopulations (SCs into PCs, GCs, ECs) follows the rules introduced in the crypt models [36,43]. Maintenance of SCs requires active Wnt and Notch signalling. Wnt signalling is activated either by external sources or by neighbouring PCs (number ≥ NW). Active Notch signalling requires contact to secretory cells (number ≥ NN). If the Wnt or Notch activity falls below certain thresholds, SCs specify. Such specification is reversible as long as progenitors do not become terminally differentiated. Low Notch induces PC specification, low Wnt EC specification, and low Notch together with low Wnt induces GC specification. To avoid the infinite expansion of an (SC-PC) niche population, PC specification requires sufficient positive tissue curvature C0; otherwise, pseudo-GC (with high Wnt) are specified.
Proliferation is modelled by a stochastic increase of the target cell volume VT from V0 to 2V0 in NP steps and a subsequent split of the cell into two daughters. The capability of proliferation is lineage-specific. SC are capable of permanent proliferation. ECs stop proliferation and become terminally differentiated at a fixed time tprol after specification. PCs and GCs finish a last cell cycle after their specification before they become terminally differentiated. In extension to former crypt models, we introduce a population of sub-epithelial fibroblasts. These cells are capable of proliferation and adhere to the opposite side of the BM. They do not form subpopulations. All cells capable of proliferation are subject to contact inhibition of growth: they stop proliferating if they are compressed, and their actual volume VA is smaller than (V0-dV). This regulation is fully reversible, that is, proliferation restarts if compression is released, as long as it has not been stopped by differentiation.
The initial tissue structure is cylindrical. This open structure mimics the crypt villus interspace that forms before birth. Details of SC specification associated with the initial model configuration are described in the text. All cells are free to move, driven by cell–cell and cell–BM forces. Cell–cell interactions are short-range neighbour interactions and include surface adhesion, mutual deformation and compression as well as attraction via an intercellular ‘apical’ polymer network. Cell–BM interactions are also short range and include adhesion via a selected BM-knot and repulsion via all others in the selected interaction range. Epithelial cells that cross the openings of the cylinder (villi) are removed from the system. In contrast, fibroblasts stop moving and remain at the openings. Cell apoptosis occurs when cells lose their contact to the BM. In contrast to our previous models, cells that lose contact to the BM do not undergo apoptosis immediately. These cells shrink rapidly in size, and during this process, the neighbouring cells experience a strong contraction via the intercellular network. This mechanism supports a closed epithelium. PCs have a limited average lifetime tPC.

4.2. Model Computations

Our simulations were performed in cooperation with the Centre for Information Services and High Performance Computing (ZIH) at the TU Dresden. These shared resources can be requested for each simulation with a maximum runtime of one week. Hence, depending on the number of crypts that form, we were able to simulate between 1 and 4 weeks of tissue development using an Intel Haswell CPU architecture with Intel(R) Xeon(R) CPU E5-2680 v3 processors and up to 256 GB RAM. For each setup we ran at least 10 simulations.

4.3. Data Analysis

We started analysis right after external Wnt sources were switched off (t = 0). This time point depends on the individual simulation. The various time frames denoted in our data plots refer to this variable time point and the corresponding ZIH run-time limits. For t > 0, observations were made every 1.2 h (observation step). This was sufficient to follow up crypt formation, cell turnover and lineage changes. For characterization of the turnover and SC numbers, we averaged the results of 20 observations. For turnover, we counted the epithelial cells that were removed at the cylindrical end only. Cells that lost contact to the BM were not considered.
The radial extension (along the cylinder axis) of the BM was determined with a resolution of 5 µm. Thereby, the BM was split into slices of 5 µm width, ignoring the open boundaries. For each point describing the BM, its distance to the cylinder axis was calculated as the radius. The average of those radii was finally considered as radial extension.
Calculation of the SC growth rate q was started at the time point where a linear fit over all following time points reached R > 0.95. For detecting the SC doubling time, td = ln(2)/(ln(10)q), only simulations were used in which non-interacting crypts form.
For SC compression analysis, we analysed the last 40 observation steps (2 days) of the simulations. Thus, for an average of 25 SCs per observation step, a set of about 1000 data points were analysed.

4.4. Mice and Ethics Statement

This research complies with the ethics guidelines of Leipzig University. We obtained ethics approval from the Landesdirektion Leipzig for i.p. injection of BrdU (TVV 52/13–06/Apr/2014, TVV 53/14–06/03/2015, TVV 22/16–01/06/2016). Tg(villin-Cd97)2 mice (in short Tg2) expressed high-copy numbers of full-length mouse Cd97(EGF1234) under the control of the villin promoter [52]. Within the first week of life, we always analysed the same number of Tg2 and wild-type (in short WT) C57BL/6J offspring of one litter to ensure that postnatal Tg2 and WT mice had exactly the same age. Intestinal tumours were obtained from 12 month VC+/?Msh2LoxP/LoxP (in short Msh2/) mice [19].

4.5. Intestinal Morphology

In neonatal mice up to P7, the whole intestine, and in older mice, intestinal segments [52], were dissected and paraffin-embedded. The crypt size was determined from microscope images taken from haematoxylin-eosin (HE)-stained sections using Fiji (www.fiji.sc, accessed on 20 June 2021). In neonatal mice, PC precursors were detected by their distinct eosinophilic staining, and later their typical granular pattern was used for identification. In 2- and 4-day-old mice, the number and position of proliferating BrdU-positive intestinal epithelial cells was determined as described [8]. Per 50 mg/kg body weight, 2 mg/mL BrdU (Sigma-Aldrich, Taufkirchen, Germany) was injected; i.p. Mice were sacrificed 2 and 24 h afterwards. Paraffin sections were stained for BrdU incorporation using the BrdU In-situ detection Kit II (BD Biosciences, Heidelberg, Germany).

4.6. Organoid 3D Live Imaging

Six centimetres of the jejunum was used to generate intestinal organoids [19]. Organoids were split 1 day before z-stack series were taken by 3D live imaging for 6 days. Organoid growth rates and the relative area A/A0 of the cross-section of growing organoids were quantified [19]. The growth pattern of each organoid was assessed at the various time-points either as branched, that is, multiple crypt-like structures project outward, or cyst-like, that is, hollow spheres with no or few projections.

4.7. Microarray and SOM Analysis

mRNA from jejunal samples of 2-, 3-, and 9-week-old Tg2 and WT mice (2 mice with 2 replicates each) as well as adult WT mice, organoids of adult WT mice (2 replicates), and tumours of 12 month old Msh2/ mice (4 replicates) were extracted using TRIzol (Thermo Fisher Scientific, Waltham, MA, USA) and analysed with the Bead Chip Array MouseRef-8 v2 (Illumina, San Diego, CA, USA). Data were selected by a p-value < 0.05 from the background corrected raw data. The base-10 logarithmic expression data were analysed by the oposSOM R package [54]. Data were filtered in order to consider only those IDs with reliable expression values (p-values < 0.05) for all samples. For the remaining 6365 IDs, log10 values were corrected for batch effects [55] and processed by the oposSOM-pipeline.

4.8. qRT-PCR

Intestinal tissue was homogenized in 600 µL RLT Buffer (Qiagen, Hilden, Germany) and total RNA was isolated according to the manufacturer’s instructions. For cDNA synthesis, 1 μg RNA was transcribed using the SuperScript™ IV First-Strand Synthesis System (ThermoFischer). Relative levels of mRNA were quantified using an Applied Biosystems 7500 Real-Time PCR System (ThermoFischer) with the ΔΔCt method. The expression of specific genes was normalized to mouse Rps29. Primer sequences are provided upon request.

4.9. Statistics Tests

p-values less than 5% were considered to be significant and are indicated with * p < 0.05, ** p < 0.01, or *** p < 0.001.

Supplementary Materials

The following are available online at https://0-www-mdpi-com.brum.beds.ac.uk/article/10.3390/ijms22147345/s1. References [56,57] are cited in the supplementary materials.

Author Contributions

conceptualization: G.A., J.G.; methodology G.A., J.G., T.T., K.R.; investigation F.H., K.R., M.Q., C.K., G.A.; validation: G.A., M.Q.; formal analysis: T.T., J.P., J.G.; software: T.T.; visualization: J.G., T.T., G.A., M.Q.; writing—original draft preparation: J.G. All authors have read and agreed to the published version of the manuscript.

Funding

This study was supported by the Bundesministerium für Bildung und Forschung (grant: INDRA, grant number: BMBF 031A312).

Institutional Review Board Statement

This research complies with the ethics guidelines of Leipzig University. We obtained ethics approval from the Landesdirektion Leipzig for i.p. injection of BrdU (TVV 52/13–06/Apr/2014, TVV 53/14–06/03/2015, TVV 22/16–01/06/2016).

Informed Consent Statement

Not applicable.

Data Availability Statement

The average expression data of three individual sample of each group (Figure 4) is available as supplementary material. This data includes gene symbols, the average expression as logarithmic fold change (logFC), rank scores (WAD, T-score, p-value) and the metagene position according to the gene’s location in the SOM.

Acknowledgments

The model computations were performed using a Bull/Atos cluster at the Center for Information Services and High Performance Computing (ZIH) at TU Dresden. We thank Doreen Sittig and Ulrike Schmiedek for technical assistance.

Conflicts of Interest

The authors declare no conflict of interest.

References

  1. Huang, S.; Ingber, D. The structural and mechanical complexity of cell-growth control. Nat. Cell Biol. 1999, 1, E131–E138. [Google Scholar] [CrossRef]
  2. Puliafito, A.; Hufnagel, L.; Neveu, P.; Streichan, S.; Sigal, A.; Fygenson, D.K.; Shraiman, B.I. Collective and single cell behavior in epithelial contact inhibition. Proc. Natl. Acad. Sci. USA 2012, 109, 739–744. [Google Scholar] [CrossRef] [Green Version]
  3. Beauchamp, R.D.; Sheng, H.M.; Shao, J.Y.; Thompson, E.A.; Ko, T.C. Intestinal cell cycle regulations. Interactions of cyclin D1, Cdk4, and p21Cip1. Ann. Surg. 1996, 223, 620–627. [Google Scholar] [CrossRef]
  4. Kim, N.G.; Koh, E.; Chen, X.; Gumbiner, B.M. E-cadherin mediates contact inhibition of proliferation through Hippo signaling-pathway components. Proc. Natl. Acad. Sci. USA 2011, 108, 11930–11935. [Google Scholar] [CrossRef] [Green Version]
  5. Galle, J.; Hoffmann, M.; Aust, G. From single cells to tissue architecture—A bottom-up approach to modelling the spatio-temporal organisation of complex multi-cellular systems. J. Math. Biol. 2009, 58, 261–283. [Google Scholar] [CrossRef] [PubMed]
  6. Dehmer, J.J.; Garrison, A.P.; Speck, K.E.; Dekaney, C.M.; Van Landeghem, L.; Sun, X.; Henning, S.J.; Helmrath, M.A. Expansion of intestinal epithelial stem cells during murine development. PLoS ONE 2011, 6, e27070. [Google Scholar] [CrossRef] [Green Version]
  7. Williams, J.M.; Duckworth, C.A.; Burkitt, M.D.; Watson, A.J.; Campbell, B.J.; Pritchard, D.M. Epithelial cell shedding and barrier function: A matter of life and death at the small intestinal villus tip. Vet. Pathol. 2015, 52, 445–455. [Google Scholar] [CrossRef] [Green Version]
  8. Aust, G.; Kerner, C.; Gonsior, S.; Sittig, D.; Schneider, H.; Buske, P.; Scholz, M.; Dietrich, N.; Oldenburg, S.; Karpus, O.N.; et al. Mice overexpressing CD97 in intestinal epithelial cells provide a unique model for mammalian postnatal intestinal cylindrical growth. Mol. Biol. Cell. 2013, 24, 2256–2268. [Google Scholar] [CrossRef]
  9. Tamura, A.; Kitano, Y.; Hata, M.; Katsuno, T.; Moriwaki, K.; Sasaki, H.; Hayashi, H.; Suzuki, Y.; Noda, T.; Furuse, M.; et al. Megaintestine in claudin-15-deficient mice. Gastroenterology 2008, 134, 523–534. [Google Scholar] [CrossRef]
  10. Troyer, K.L.; Luetteke, N.C.; Saxon, M.L.; Qiu, T.H.; Xian, C.J.; Lee, D.C. Growth retardation, duodenal lesions, and aberrant ileum architecture in triple null mice lacking EGF, amphiregulin, and TGF-alpha. Gastroenterology 2001, 121, 68–78. [Google Scholar] [CrossRef]
  11. Riehl, T.E.; Alvarado, D.; Ee, X.; Ciorba, M.A.; Stenson, W.F. Hyaluronic acid promotes Lgr5+ stem cell proliferation and crypt fission through TLR4 and PGE2 transactivation of EGFR. Am. J. Physiol. Gastrointest. Liver Physiol. 2020, 319, G63–G73. [Google Scholar] [CrossRef] [PubMed]
  12. Riehl, T.E.; Santhanam, S.; Foster, L.; Ciorba, M.; Stenson, W.F. CD44 and TLR4 mediate hyaluronic acid regulation of Lgr5+ stem cell proliferation, crypt fission, and intestinal growth in postnatal and adult mice. Am. J. Physiol. Gastrointest. Liver Physiol. 2015, 309, G874–G887. [Google Scholar] [CrossRef] [Green Version]
  13. Riehl, T.E.; Ee, X.; Stenson, W.F. Hyaluronic acid regulates normal intestinal and colonic growth in mice. Am. J. Physiol. Gastrointest. Liver Physiol. 2012, 303, G377–G388. [Google Scholar] [CrossRef] [Green Version]
  14. Sumigray, K.D.; Terwilliger, M.; Lechler, T. Morphogenesis and Compartmentalization of the Intestinal Crypt. Dev. Cell. 2018, 45, 183–197.e5. [Google Scholar] [CrossRef] [Green Version]
  15. Wołczuk, K.; Wilczyńska, B.; Jaroszewska, M.; Kobak, J. Morphometric characteristics of the small and large intestines of Mus musculus during postnatal development. Folia Morphol. 2011, 70, 252–259. [Google Scholar]
  16. Thalheim, T.; Quaas, M.; Herberg, M.; Braumann, U.D.; Kerner, C.; Loeffler, M.; Aust, G.; Galle, J. Linking stem cell function and growth pattern of intestinal organoids. Dev. Biol. 2018, 433, 254–261. [Google Scholar] [CrossRef]
  17. Sato, T.; van Es, J.H.; Snippert, H.J.; Stange, D.E.; Vries, R.G.; van den Born, M.; Barker, N.; Shroyer, N.F.; van de Wetering, M.; Clevers, H. Paneth cells constitute the niche for Lgr5 stem cells in intestinal crypts. Nature 2011, 469, 415–418. [Google Scholar] [CrossRef] [Green Version]
  18. Navis, M.; Martins Garcia, T.; Renes, I.B.; Vermeulen, J.L.; Meisner, S.; Wildenberg, M.E.; van den Brink, G.R.; van Elburg, R.M.; Muncan, V. Mouse fetal intestinal organoids: New model to study epithelial maturation from suckling to weaning. EMBO Rep. 2019, 20, e46221. [Google Scholar] [CrossRef]
  19. Keysselt, K.; Kreutzmann, T.; Rother, K.; Kerner, C.; Krohn, K.; Przybilla, J.; Buske, P.; Löffler-Wirth, H.; Loeffler, M.; Galle, J.; et al. Different in vivo and in vitro transformation of intestinal stem cells in mismatch repair deficiency. Oncogene 2017, 36, 2750–2761. [Google Scholar] [CrossRef]
  20. Muncan, V.; Heijmans, J.; Krasinski, S.D.; Büller, N.V.; Wildenberg, M.E.; Meisner, S.; Radonjic, M.; Stapleton, K.A.; Lamers, W.H.; Biemond, I.; et al. Blimp1 regulates the transition of neonatal to adult intestinal epithelium. Nat. Commun. 2011, 2, 452. [Google Scholar] [CrossRef] [PubMed] [Green Version]
  21. Harper, J.; Mould, A.; Andrews, R.M.; Bikoff, E.K.; Robertson, E.J. The transcriptional repressor Blimp1/Prdm1 regulates postnatal reprogramming of intestinal enterocytes. Proc. Natl. Acad. Sci. USA 2011, 108, 10585–10590. [Google Scholar] [CrossRef] [Green Version]
  22. Yamada, M.; Udagawa, J.; Matsumoto, A.; Hashimoto, R.; Hatta, T.; Nishita, M.; Minami, Y.; Otani, H. Ror2 is required for midgut elongation during mouse development. Dev. Dyn. 2010, 239, 941–953. [Google Scholar] [CrossRef]
  23. Dahlhoff, M.; Horst, D.; Gerhard, M.; Kolligs, F.T.; Wolf, E.; Schneider, M.R. Betacellulin stimulates growth of the mouse intestinal epithelium and increases adenoma multiplicity in Apc+/Min mice. FEBS Lett. 2008, 582, 2911–2915. [Google Scholar] [CrossRef] [Green Version]
  24. Shao, J.; Sheng, H. Amphiregulin promotes intestinal epithelial regeneration: Roles of intestinal subepithelial myofibroblasts. Endocrinology 2010, 151, 3728–3737. [Google Scholar] [CrossRef] [Green Version]
  25. Shin, H.S.; Lee, H.J.; Nishida, M.; Lee, M.S.; Tamura, R.; Yamashita, S.; Matsuzawa, Y.; Lee, I.K.; Koh, G.Y. Betacellulin and amphiregulin induce upregulation of cyclin D1 and DNA synthesis activity through differential signaling pathways in vascular smooth muscle cells. Circ. Res. 2003, 93, 302–310. [Google Scholar] [CrossRef] [Green Version]
  26. Zhang, J.; Ji, J.Y.; Yu, M.; Overholtzer, M.; Smolen, G.A.; Wang, R.; Brugge, J.S.; Dyson, N.J.; Haber, D.A. YAP-dependent induction of amphiregulin identifies a non-cell-autonomous component of the Hippo pathway. Nat. Cell Biol. 2009, 11, 1444–1450. [Google Scholar] [CrossRef] [PubMed]
  27. Dai, L.N.; Yan, J.K.; Zhang, T.; Cai, W.; Yan, W.H. Butyrate promotes the adaptation of intestinal smooth muscle cells through the yes-associated protein (YAP) pathway in a rat model of short bowel syndrome. Am. J. Transl. Res. 2019, 11, 453–462. [Google Scholar] [PubMed]
  28. Dai, L.N.; Yan, J.K.; Xiao, Y.T.; Wen, J.; Zhang, T.; Zhou, K.J.; Wang, Y.; Cai, W. Butyrate stimulates the growth of human intestinal smooth muscle cells by activation of yes-associated protein. J. Cell Physiol. 2018, 233, 3119–3128. [Google Scholar] [CrossRef]
  29. Sato, T.; Vries, R.G.; Snippert, H.J.; van de Wetering, M.; Barker, N.; Stange, D.E.; van Es, J.H.; Abo, A.; Kujala, P.; Peters, P.J.; et al. Single Lgr5 stem cells build crypt-villus structures in vitro without a mesenchymal niche. Nature 2009, 459, 262–265. [Google Scholar] [CrossRef] [PubMed]
  30. Haber, A.L.; Biton, M.; Rogel, N.; Herbst, R.H.; Shekhar, K.; Smillie, C.; Burgin, G.; Delorey, T.M.; Howitt, M.R.; Katz, Y.; et al. A single-cell survey of the small intestinal epithelium. Nature 2017, 551, 333–339. [Google Scholar] [CrossRef]
  31. Flandez, M.; Guilmeau, S.; Blache, P.; Augenlicht, L.H. KLF4 regulation in intestinal epithelial cell maturation. Exp. Cell Res. 2008, 314, 3712–3723. [Google Scholar] [CrossRef] [Green Version]
  32. Yu, T.; Chen, X.; Zhang, W.; Li, J.; Xu, R.; Wang, T.C.; Ai, W.; Liu, C. Krüppel-like factor 4 regulates intestinal epithelial cell morphology and polarity. PLoS ONE 2012, 7, e32492. [Google Scholar] [CrossRef] [PubMed] [Green Version]
  33. Ghaleb, A.M.; McConnell, B.B.; Kaestner, K.H.; Yang, V.W. Altered intestinal epithelial homeostasis in mice with intestine-specific deletion of the Krüppel-like factor 4 gene. Dev. Biol. 2011, 349, 310–320. [Google Scholar] [CrossRef] [Green Version]
  34. Dhaliwal, N.K.; Abatti, L.E.; Mitchell, J.A. KLF4 protein stability regulated by interaction with pluripotency transcription factors overrides transcriptional control. Genes Dev. 2019, 33, 1069–1082. [Google Scholar] [CrossRef] [PubMed] [Green Version]
  35. Park, G.B.; Kim, D. MicroRNA-503-5p Inhibits the CD97-Mediated JAK2/STAT3 Pathway in Metastatic or Paclitaxel-Resistant Ovarian Cancer Cells. Neoplasia 2019, 21, 206–215. [Google Scholar] [CrossRef] [PubMed]
  36. Buske, P.; Galle, J.; Barker, N.; Aust, G.; Clevers, H.; Loeffler, M. A comprehensive model of the spatio-temporal stem cell and tissue organisation in the intestinal crypt. PLoS Comput. Biol. 2011, 7, e1001045. [Google Scholar] [CrossRef] [Green Version]
  37. Krndija, D.; Marjou, F.E.; Guirao, B.; Richon, S.; Leroy, O.; Bellaiche, Y.; Hannezo, E.B.; Vignjevic, D.M. Active cell migration is critical for steady-state epithelial turnover in the gut. Science 2019, 365, 705–710. [Google Scholar] [CrossRef]
  38. Vig, D.K.; Hamby, A.E.; Wolgemuth, C.W. Cellular Contraction Can Drive Rapid Epithelial Flows. Biophys. J. 2017, 113, 1613–1622. [Google Scholar] [CrossRef] [Green Version]
  39. Kim, B.M.; Mao, J.; Taketo, M.M.; Shivdasani, R.A. Phases of canonical Wnt signaling during the development of mouse intestinal epithelium. Gastroenterology 2007, 133, 529–538. [Google Scholar] [CrossRef] [Green Version]
  40. Langlands, A.J.; Almet, A.A.; Appleton, P.L.; Newton, I.P.; Osborne, J.M.; Näthke, I.S. Paneth Cell-Rich Regions Separated by a Cluster of Lgr5+ Cells Initiate Crypt Fission in the Intestinal Stem Cell Niche. PLoS Biol. 2016, 14, e1002491. [Google Scholar] [CrossRef] [Green Version]
  41. Yamazaki, M.; Fujii, E.; Watanabe, T.; Kato, A.; Suzuki, M. Histopathological evaluation of crypt fission during intestinal development in neonatal mice. J. Toxicol. Pathol. 2020, 33, 39–46. [Google Scholar] [CrossRef]
  42. Almet, A.A.; Maini, P.K.; Moulton, D.E.; Byrne, H.M. Modeling perspectives on the intestinal crypt, a canonical system for growth, mechanics, and remodeling. Curr. Opin. Biomed. Eng. 2020, 15, 32–39. [Google Scholar] [CrossRef]
  43. Thalheim, T.; Buske, P.; Przybilla, J.; Rother, K.; Loeffler, M.; Galle, J. Stem cell competition in the gut: Insights from multi-scale computational modelling. J. R. Soc. Interface 2016, 13, 20160218. [Google Scholar] [CrossRef]
  44. Buske, P.; Przybilla, J.; Loeffler, M.; Sachs, N.; Sato, T.; Clevers, H.; Galle, J. On the biomechanics of stem cell niche formation in the gut—Modelling growing organoids. FEBS J. 2012, 279, 3475–3487. [Google Scholar] [CrossRef]
  45. Lei, N.Y.; Jabaji, Z.; Wang, J.; Joshi, V.S.; Brinkley, G.J.; Khalil, H.; Wang, F.; Jaroszewicz, A.; Pellegrini, M.; Li, L.; et al. Intestinal subepithelial myofibroblasts support the growth of intestinal epithelial stem cells. PLoS ONE 2014, 9, e84651. [Google Scholar] [CrossRef] [PubMed] [Green Version]
  46. Van Neerven, S.M.; Vermeulen, L. The interplay between intrinsic and extrinsic Wnt signaling in controlling intestinal transformation. Differentiation 2019, 108, 17–23. [Google Scholar] [CrossRef] [PubMed]
  47. Haramis, A.P.; Begthel, H.; van den Born, M.; van Es, J.; Jonkheer, S.; Offerhaus, G.J.; Clevers, H. De novo crypt formation and juvenile polyposis on BMP inhibition in mouse intestine. Science 2004, 303, 1684–1686. [Google Scholar] [CrossRef] [PubMed] [Green Version]
  48. Hannezo, E.; Prost, J.; Joanny, J.F. Instabilities of monolayered epithelia: Shape and structure of villi and crypts. Phys. Rev. Lett. 2011, 107, 078104. [Google Scholar] [CrossRef] [Green Version]
  49. Dekaney, C.M.; Fong, J.J.; Rigby, R.J.; Lund, P.K.; Henning, S.J.; Helmrath, M.A. Expansion of intestinal stem cells associated with long-term adaptation following ileocecal resection in mice. Am. J. Physiol. Gastrointest. Liver Physiol. 2007, 293, G1013–G1022. [Google Scholar] [CrossRef] [PubMed] [Green Version]
  50. Malipatlolla, D.K.; Patel, P.; Sjöberg, F.; Devarakonda, S.; Kalm, M.; Angenete, E.; Lindskog, E.B.; Grandér, R.; Persson, L.; Stringer, A.; et al. Long-term mucosal injury and repair in a murine model of pelvic radiotherapy. Sci. Rep. 2019, 9, 13803. [Google Scholar] [CrossRef] [PubMed] [Green Version]
  51. Pittelkow, M.R.; Cook, P.W.; Shipley, G.D.; Derynck, R.; Coffey, R.J., Jr. Autonomous growth of human keratinocytes requires epidermal growth factor receptor occupancy. Cell Growth Differ. 1993, 4, 513–521. [Google Scholar]
  52. Becker, S.; Wandel, E.; Wobus, M.; Schneider, R.; Amasheh, S.; Sittig, D.; Kerner, C.; Naumann, R.; Hamann, J.; Aust, G. Overexpression of CD97 in intestinal epithelial cells of transgenic mice attenuates colitis by strengthening adherens junctions. PLoS ONE 2010, 5, e8507. [Google Scholar] [CrossRef]
  53. Leedham, S.J.; Wright, N.A. Expansion of a mutated clone: From stem cell to tumour. J. Clin. Pathol. 2008, 61, 164–171. [Google Scholar] [CrossRef]
  54. Loeffler-Wirth, H.; Kalcher, M.; Binder, H. oposSOM: R-package for high-dimensional portraying of genome-wide expression landscapes on Bioconductor. Bioinformatics 2015, 31, 3225–3227, R-package oposSOM, Version 2.2.0. [Google Scholar] [CrossRef]
  55. Ritchie, M.E.; Phipson, B.; Wu, D.; Hu, Y.; Law, C.W.; Shi, W.; Smyth, G.K. limma powers differential expression analyses for RNA-sequencing and microarray studies. Nucleic Acids Res. 2015, 43, e47, R-package limma, Version 3.42.2. [Google Scholar] [CrossRef]
  56. Pitzonka, L.; Wang, X.; Ullas, S.; Wolff, D.W.; Wang, Y.; Goodrich, D.W. The THO ribonucleoprotein complex is required for stem cell homeostasis in the adult mouse small intestine. Mol. Cell. Biol. 2013, 33, 3505–3514. [Google Scholar] [CrossRef] [Green Version]
  57. Galle, J.; Loeffler, M.; Drasdo, D. Modeling the effect of deregulated proliferation and apoptosis on the growth of epithelial cll populations in vitro. Biophys. J. 2005, 88, 62–75. [Google Scholar] [CrossRef] [Green Version]
Figure 1. Potential growth scenarios. (A) Growth of the outer intestinal surface A (solid lines) according to Equation (1) and corresponding solutions for the crypt fission activity required to keep the crypt density constant (dashed lines). Our experiments aimed at characterizing the initial cellular state of the intestine and its molecular regulation in the growth phase. The dotted vertical lines indicate the time points where microarrays of intestinal samples were applied to screen gene regulation. (B) Initial patterning of the intestine. (CE) Pattern of the mucosa after different growth scenarios. (C) Overshooting epithelial growth (e.g., after HA-administration [Riehl et al., 2012]). (D) Declined epithelial growth (e.g., knock-out of EGFR-ligands [Troyer et al., 2001]). (E) Balanced growth of the muscularis and the mucosa (e.g., in Cd97 transgenic mice, [Aust et al., 2013]). The submucosa and the serosa are assumed to be adaptive in either case.
Ijms 22 07345 g001
Figure 2. Crypt formation is accelerated in Tg2 mice. (A) Definition of the crypt formation score. (B) Representative images of the different scores in HE-stained jejunal sections. (C) Percentage of crypts with the different scores at postnatal days 1, 3, 5 and 7 (n = 5 mice/genotype, 300 crypts/mouse, mean ± SEM, * p < 0.05, ** p < 0.01, *** p < 0.001. (D) Percentage of BrdU-positive cells at a defined position along the crypt-villus axis (crypt base = 1) at P2 and P4 determined 2 and 24 h after BrdU incorporation (n = 5/mice/genotype/time point, n = 10 crypt-villus axis/mouse; mean ± SEM; WT compared with Tg2). High BrdU staining at the crypt bottom indicates that mature PCs are missing.
Ijms 22 07345 g002
Figure 3. Accelerated PC development in Tg2 mice. (A) HE-stained jejunal sections of 7-day-old Tg2 and WT mice. PCs were identified by their typical eosinophil staining (arrows). (B) The number of PCs was determined in 100 duodenal and 200 jejunal crypts (HE-stained intestinal sections, n = 5 mice/genotype/time point, n = 300 crypts/mouse, mean ± SEM; ** p < 0.01, *** p < 0.001 WT compared with Tg2). (C) Age-dependent Lyz1 and Defa6 expression in jejunal samples of Tg2 and WT mice determined by qRT-PCR (n = 3 mice/genotype/age, normalized to Rps29, mean ± SD). (D) Growth pattern of branched and cyst-like organoids after one week of culture (scale bar: 50 µm). (E) Different growth properties of Tg2 and WT intestinal organoids: Percentage of SC-derived organoids of 2-week-old mice with a branched growth pattern (n = 5 mice/genotype, n = 15 organoids/mouse, mean ± SEM; * p < 0.05 WT compared with Tg2). (F) Organoids of two-week-old WT mice grew faster compared with those of age-matched Tg2 mice. The area A of the stacked cross-section of each organoid was quantified relative to that of the first time point A0 (n = 5 mice/genotype, n = 15 organoids/mouse, mean ± SEM; * p < 0.05 WT compared with Tg2).
Ijms 22 07345 g003
Figure 4. Transcriptional changes after Prdm1 downregulation in Tg2 mice. Age-dependent gene expression in jejunal samples of Tg2 and WT mice determined by qRT-PCR (n = 3 mice/genotype/age, normalized to Rps29, mean ± SD, *** p < 0.001, Tg2 compared with WT). (A) Prdm1 was downregulated at P14; subsequently Ror2 became repressed in both mouse types. (B) At P14, the expression of the growth factors Areg and Btc1 is enhanced in Tg2 mice. (C) SOM analysis of transcriptomic profiles of Tg2 and WT intestinal tissue. Correlation spanning tree of the transcriptomes of each sample and average SOM portraits for each sample group are shown, including samples of 2w, 3w and 9w Tg2 and WT mice, adult WT mice, organoids and intestinal tumours. In the SOM portraits, overexpressed spots appear in red, underexpressed in blue. In the spanning tree, each dot represents one analysed sample. Different dot colours indicate different sample groups. Tg2-2w samples are similar with adult WT samples supporting their premature state. In contrast, Tg2-9w samples share similarities with WT organoids, suggesting a growth factor-controlled state.
Ijms 22 07345 g004
Figure 5. Tg2-specific expression. (A,B) Microarray data of the averaged expression of Areg (A) and Btc (B) in postnatal jejunal tissue of Tg2 and WT mice. Tg2 tissue of all young mice (2w-9w) shows similarly enhanced expression compared with WT tissue. A similar difference is seen between adult WT tissue and WT organoid samples. (C) Areg and Btc qRT-PCR levels in Tg2 and WT organoids (n = 5 organoid cultures/mice/genotype, normalized to Rps29, mean ± SD, ** p < 0.01). (D) Re-analysis of published single cell (sc)RNA-sequencing data [30]. In the adult WT epithelium, Klf4 expression is activated in mature epithelial cells (ECs) and goblet cells (GC). Each point represents one analysed intestinal cell, which clusters according to its transcriptomic profile. (E,F) Different expression dynamics of Klf4 in Tg2 and WT mice. (E) Klf4 microarray data of intestinal jejunal samples of young (2w, 3w and 9w), adult tissue and organoids of WT mice. (F) Klf4 qRT-PCR levels in Tg2 and WT mice (n = 3 mice/genotype/age, normalized to Rps29, mean ± SD, ** p < 0.01).
Ijms 22 07345 g005
Figure 6. In-silico simulation of 3D crypt formation. (A) Initial state: SCs are stabilized by external Wnt. (B) Without a fibroblast layer beneath the growing epithelium, the tissue buckles and forms small villus-like luminal structures instead of crypts. Side views comparing systems without and with fibroblasts at the same time point. (C) Growing system: SCs are stabilized by PCs providing Wnt and Notch ligands. Crypts form while tissue expands. Cells moving out of the cylinder are lost. They are thought to move on the villi. Fibroblasts are not shown. (D) Side view of the growing tissue at different time points. Crypts form within about 2 weeks. (E) After that time, crypts reach a state where they undergo fission. Shown is a time series of a cross-section through the cylinder. The BM is shown in (C) and (D) only (grey net).
Ijms 22 07345 g006
Figure 7. Constant cell turnover during SC expansion. (A) Growth phases: Shown are snapshots of the initial (left) and expansion phase (right) from simulations with different tissue growth rate r. Fibroblasts are not shown. Crypts expand asymmetrically. Colour code: SCs (red), PCs (green), GCs (yellow), ECs (blue). (B) Cell turnover onto the villi. In the initial phase, the number of SCs can decrease. Afterwards, SCs start expanding and a stable turnover establishes, which depends on the number of crypts formed. Shown are results of individual simulations (r = 0.1). For minimal cell cycle time τ = 14 h (open symbols), more SCs are required to stabilize the turnover than for τ = 10 h (filled symbols). (C) SC expansion. In the expansion phase, SC numbers grow exponentially. Similar expansion is seen with r = 0.1 (filled symbols, simulations as in (B)), r = 0.2 (half-filled symbols) and with blocked turnover (open symbols). (D) While changes of τ and of the tolerated compression dV/V0 change the SC doubling time td, changes of r do not. The rates have been averaged over 5 simulations (error: sd). (E) td inversely depends on median compression of the cells dV0/V0 (colours as in (D)). In our model, SC expansion vanishes for dV0/V0 ≤ 0.075. Line: data fit. (F) Results of the analytical model of tissue growth with a density-dependent fission rate rM(1 − nC/nCE). Enforced adaptive growth reduces the crypt density. This implies higher SC turnover. Calculations were started with nC = nCE. The shortest SC doubling time td realized is about 1 week (rM = 5/week).
Ijms 22 07345 g007
Publisher’s Note: MDPI stays neutral with regard to jurisdictional claims in published maps and institutional affiliations.

