Article

Genome-Wide Identification and Characterization of PIN-FORMED (PIN) Gene Family Reveals Role in Developmental and Various Stress Conditions in Triticum aestivum L.

1
Department of Life Science, College of Life Science and Biotechnology, Dongguk University, Goyang 10326, Korea
2
Krishi Vigyan Kendra, Swami Keshwanand Rajasthan Agricultural University, Bikaner 334603, India
3
Faculty of Agriculture, Sri Sri University, Cuttack 754006, India
4
Department of Biotechnology, Centurion University of Technology and Management Jatni, Bhubaneswar 754006, India
5
Department of Biological Engineering, College of Engineering, Konkuk University, Seoul 143701, Korea
6
Department of Biological and Environmental Science, Dongguk University, Goyang 10326, Korea
7
Research Institute of Biotechnology and Medical Converged Science, Dongguk University, Goyang 10326, Korea
8
Department of Bioindustry and Bioresource Engineering, Plant Engineering Research Institute, Sejong University, Seoul 05006, Korea
9
Department of Dairy Microbiology, College of Dairy Science and Food Technology, Raipur 49200, India
*
Authors to whom correspondence should be addressed.
Int. J. Mol. Sci. 2021, 22(14), 7396; https://0-doi-org.brum.beds.ac.uk/10.3390/ijms22147396
Submission received: 18 May 2021 / Revised: 30 June 2021 / Accepted: 5 July 2021 / Published: 9 July 2021
(This article belongs to the Special Issue Environmental Stress and Plants)

Abstract

:
PIN-FORMED (PIN) genes play a crucial role in regulating polar auxin distribution in diverse developmental processes, including tropic responses, embryogenesis, tissue differentiation, and organogenesis. However, the role of PIN-mediated auxin transport in various plant species is poorly understood. Currently, no information is available about this gene family in wheat (Triticum aestivum L.). In the present investigation, we identified the PIN gene family in wheat to understand the evolution of PIN-mediated auxin transport and its role in various developmental processes and under different biotic and abiotic stress conditions. In this study, we performed genome-wide analysis of the PIN gene family in common wheat and identified 44 TaPIN genes through a homology search, further characterizing them to understand their structure, function, and distribution across various tissues. Phylogenetic analyses led to the classification of TaPIN genes into seven different groups, providing evidence of an evolutionary relationship with Arabidopsis thaliana and Oryza sativa. A gene exon/intron structure analysis showed a distinct evolutionary path and predicted the possible gene duplication events. Further, the physical and biochemical properties, conserved motifs, chromosomal, subcellular localization, transmembrane domains, and three-dimensional (3D) structure were also examined using various computational approaches. Cis-elements analysis of TaPIN genes showed that TaPIN promoters consist of phytohormone, plant growth and development, and stress-related cis-elements. In addition, expression profile analysis also revealed that the expression patterns of the TaPIN genes were different in different tissues and developmental stages. Several members of the TaPIN family were induced during biotic and abiotic stress. Moreover, the expression patterns of TaPIN genes were verified by qRT-PCR. The qRT-PCR results also show a similar expression with slight variation. Therefore, the outcome of this study provides basic genomic information on the expression of the TaPIN gene family and will pave the way for dissecting the precise role of TaPINs in plant developmental processes and different stress conditions.

Graphical Abstract

1. Introduction

The phytohormone auxin plays a key role in plant developmental processes [1,2,3,4]. Auxin forms gradients and concentration maxima in tissues and organs to stimulate diverse biological processes including gravitropism [5,6], organ initiation [7], leaf venation [8], apical dominance [9], embryo axis formation [10], root architecture [11], leaf vascular development [12], tropisms [13,14], fruit ripening [15], phototropism [16], phyllotactic patterning [17], lateral root emergence [18], root hair growth [19], apical hook development and root patterning [20], and sporophyte and male gametophyte development [21,22]. Several researchers have demonstrated that metabolic changes and transport of auxin play a key role in tissue differentiation, embryogenesis, organogenesis, differential growth, and tropic responses [2,3,4,23,24,25,26]. Auxin is synthesized in various plant tissues by several different pathways [27,28] and subjected to long- and short-range transport mediated by influx and efflux auxin transporters [25,29]. Auxin concentration maxima formation is accomplished by polar auxin transport by influx and efflux auxin transport proteins. The polar auxin transport between cells is facilitated by three major auxin transporter families: AUXIN-RESISTANT1 (AUX1)/AUX1-LIKEs proteins for auxin influx [5,30], PIN proteins [25,31], and ATP binding cassette family members for auxin efflux [32,33]. Among these, PIN family proteins play a key role in directional polar auxin transport and formation of local auxin gradients since these PINs are asymmetrically located at the plasma membrane and their polarity regulates the route of intercellular auxin flow in response to different endogenous and environmental signals [33,34,35].
PIN proteins have been well characterized in Arabidopsis, which includes eight members that differ in the length of a middle region [34,36,37]. Five of the Arabidopsis PINs (AtPIN1-4 and AtPIN7) have a long hydrophilic loop situated at the plasma membrane, implicated in the directional and cell-to-cell auxin transport [2,22,38]. Further, these long AtPINs do not localize statically in the plasma membrane; however, they constitutively cycle between the plasma membrane and endosomal compartments, and their relocation is triggered by internal and external stimuli [39], while three AtPINs, namely, AtPIN5, AtPIN6 and AtPIN8, contain a smaller central hydrophilic domain, and both AtPIN5 and AtPIN8 are located in the endoplasmic reticulum, indicating a potential role in modulating intracellular auxin homeostasis [40,41]. Interestingly, AtPIN6 is localized in the endoplasmic reticulum and plasma membrane, indicating that it might be involved in intercellular auxin transport and cellular auxin homeostasis [42]. Furthermore, PIN proteins are highly conserved from primitive to modern plants, although the sizes of their genomes and their numbers of genes differ greatly in plants, for instance, 8 PIN genes in Arabidopsis [36,43], 17 in cotton [44], 14 in maize [45], 10 in pepper [46], 12 in rice [47], 15 in poplar [48], 23 in soybean [49], 10 in tomato [50], 29 in tobacco [51], 11 in sorghum [52], and 10 in potato [53]. Several homologous PIN genes have been characterized in monocots and dicots [45,47,54,55], including the following examples: overexpression of the ABP1 altered PIN-mediated auxin transport in tobacco [56]; NtPIN4 regulates axillary bud growth in tobacco [51]; OsPIN1b regulates seminal root elongation in response to low phosphate and nitrogen in rice [57]; and MtPIN1 and MtPIN3 regulate the shade avoidance response under various environments in Medicago truncatula [58].
With recent advances in sequencing technologies, there has been a dramatic increase in the number of sequenced plant genomes in recent years. Although genome sequence databases have provided researchers with a wealth of encoded information, the genes identified in plant species’ genomes are still uncharacterized, particularly in terms of their function and regulation. The structural and functional characterization of those genes is now a challenging approach [59]. Common wheat (Triticum aestivum L.) is a major cereal and staple crop worldwide, providing food for humans and feed for animals [60,61]. Wheat is an important source of carbohydrates, protein, vitamins, and minerals for humans [61,62,63,64]. However, wheat production is adversely affected by several biotic and abiotic stresses such as insects, fungal, bacterial, and viral diseases, heat, drought, cold, and salinity [63,65,66]. Therefore, several researchers have concentrated on improving productivity, quality, and stress tolerance in wheat. Wheat is originated from the natural hybridization of three closely related genomes: A, B and D. The wheat genome has already been sequenced completely, and 124,201 genes have been identified [61]. Gene distribution analysis across the three subgenomes revealed that there is a higher number of genes on the B subgenome with 44,523 (35%), compared to the A and D subgenomes, which had 40,253 (33%) and 39,425 (32%), respectively [61]. In the present investigation, we identified the PIN gene family in wheat to understand the evolution of PIN-mediated auxin transport and its role in various developmental processes and under different biotic and abiotic stress conditions. In this study, we performed genome-wide analysis of the PIN gene family in common wheat and identified 44 TaPIN genes using various computational approaches, further characterizing them to understand their structure, function, and distribution across various tissues.

2. Results

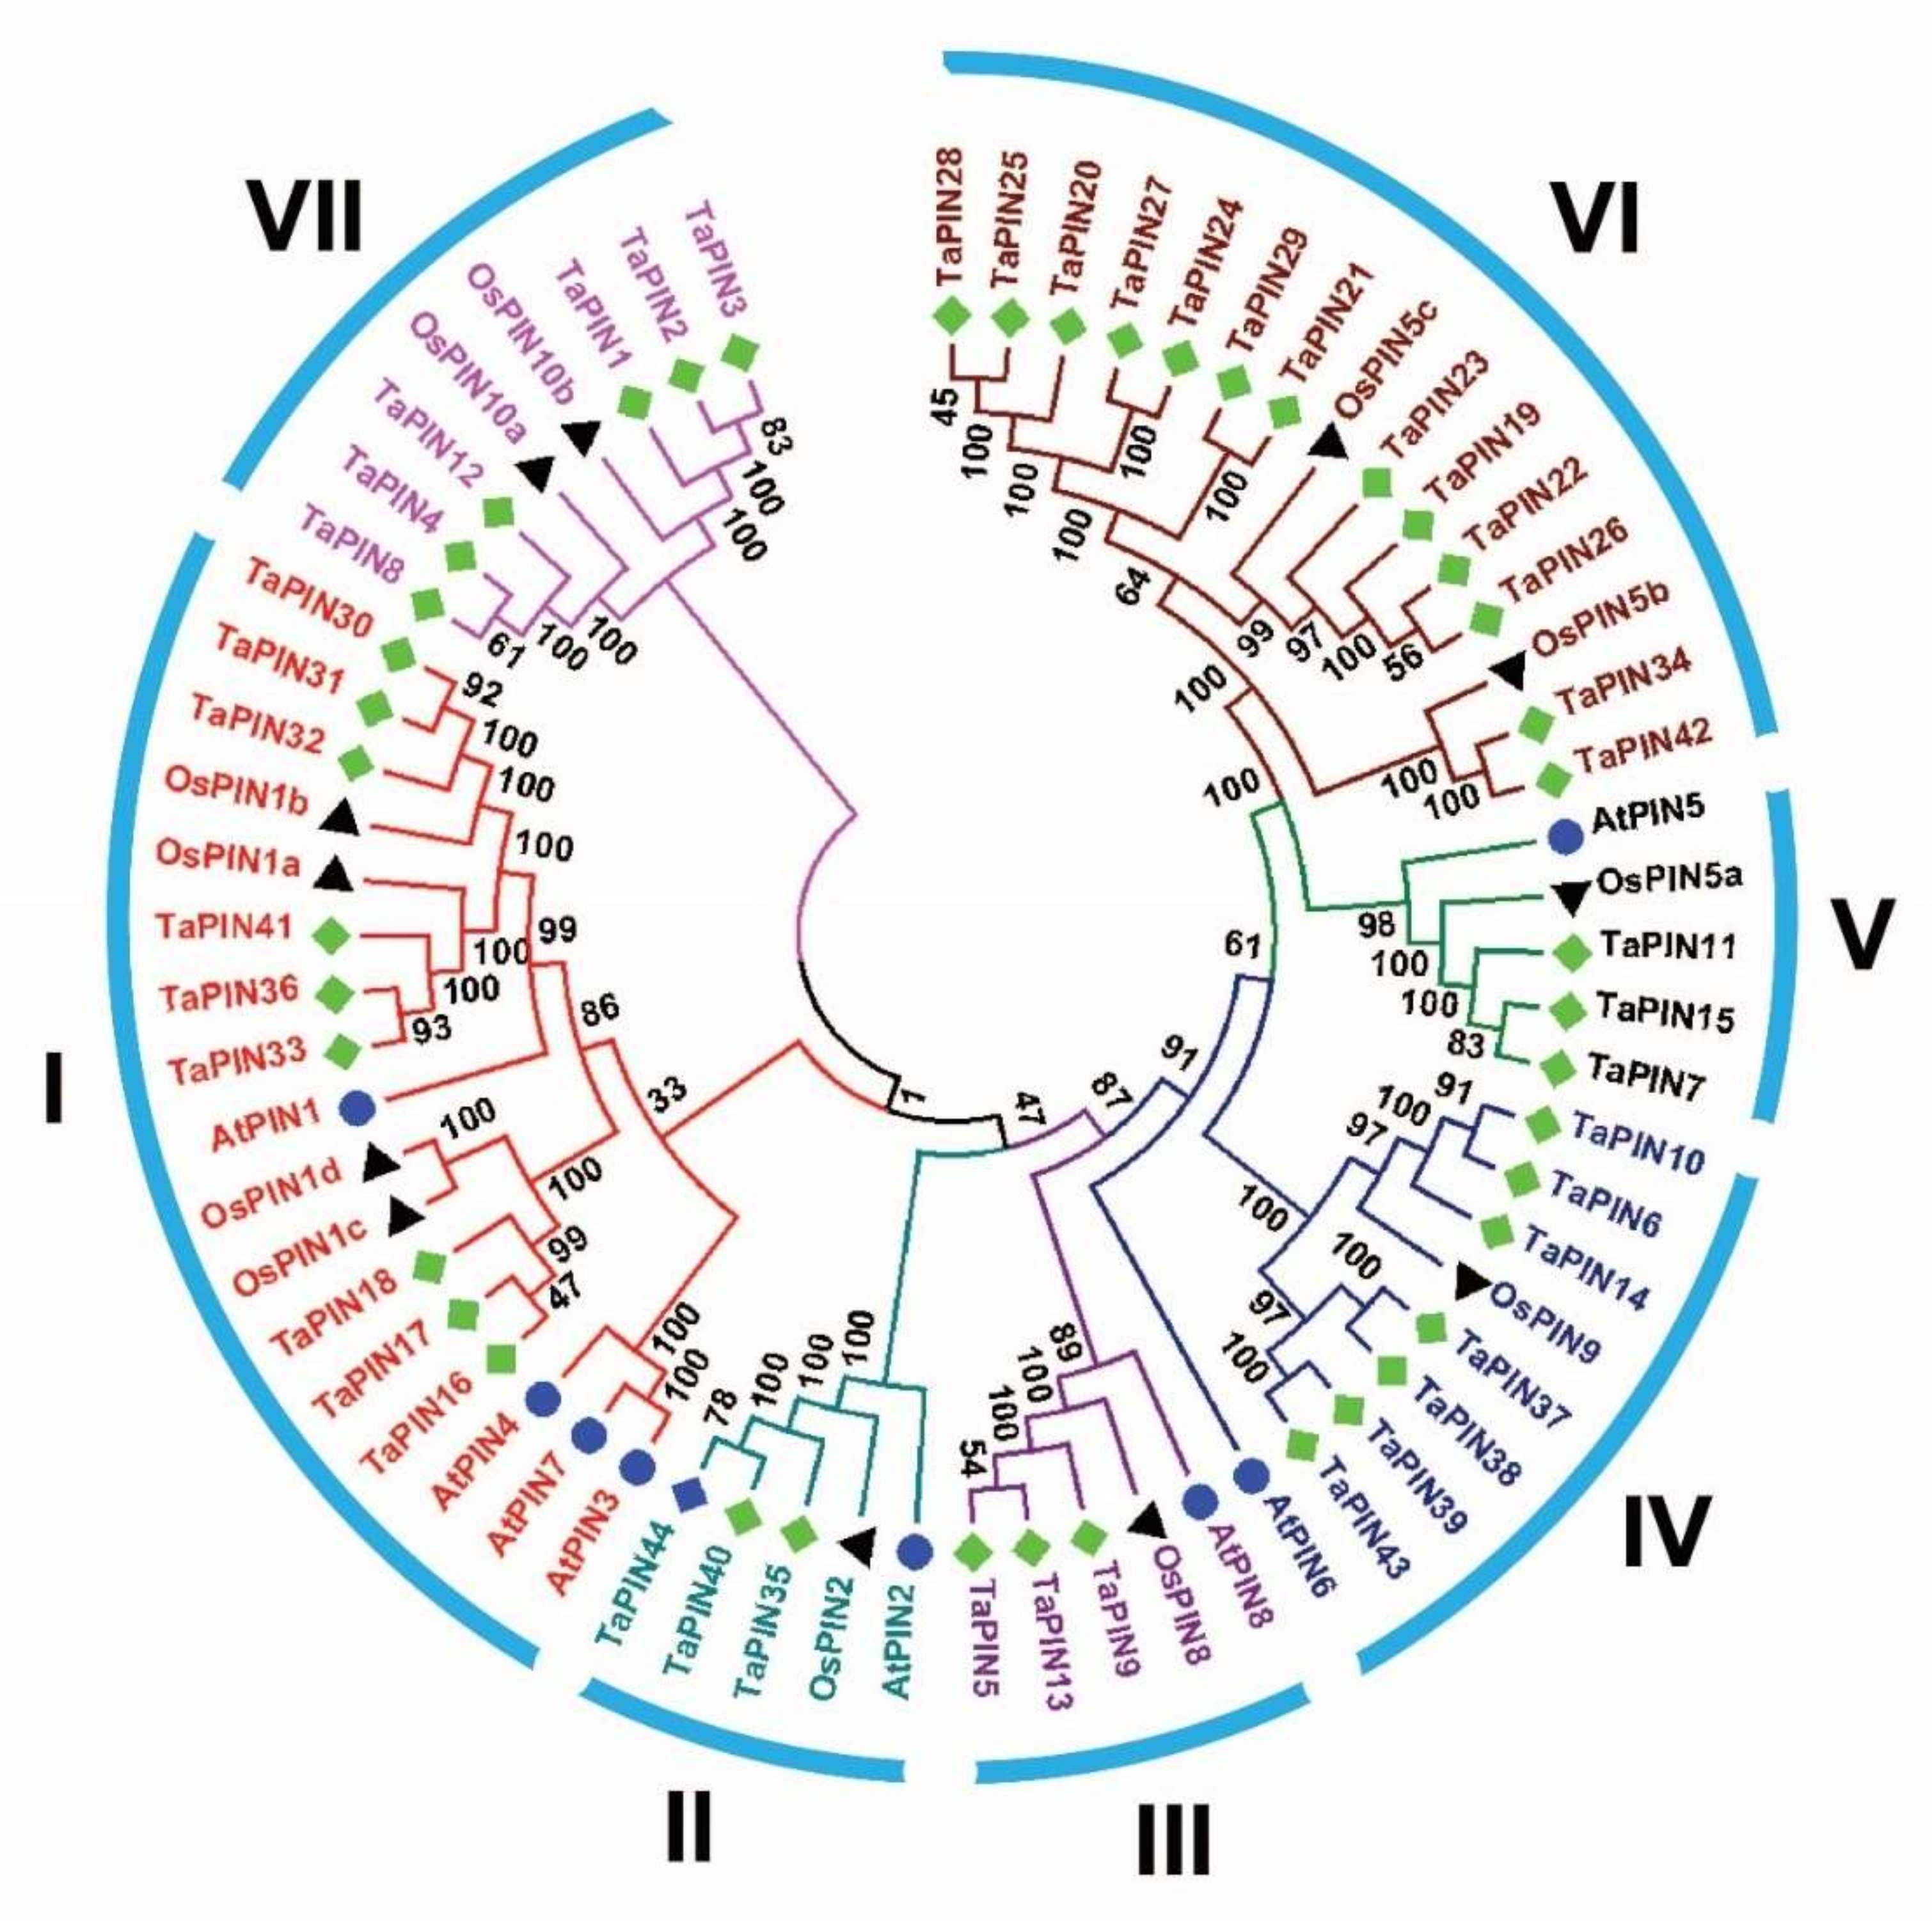
2.1. Identification of PIN Family Members in T. aestivum

A total of 44 PIN genes were identified in the wheat genome (Table 1); this number is relatively high compared to the previously reported PINs in other plant species such as Arabidopsis, rice, sorghum, and maize (Table 2).
This result might be owing to the higher ploidy level and large genome size of wheat. Bread wheat is originated from the natural hybridization of three closely related genomes (A, B and D) [67]. The TaPIN family had an average molecular weight of 49.87 kDa. The average isoelectric point (pI) of the TaPIN family ranged from 5.92 to 9.32; TaPIN44 had the highest pI, 9.32, while TaPIN38 had the lowest pI of 5.92. We also plotted the molecular weight of TaPINs with their pI to examine the molecular weight distribution of different TaPIN family members (Figure S1). The plots indicate that most TaPINs have a similar molecular weight and pI, and they clustered together. The calculated grand average of hydropathy index (GRAVY) values of all TaPINs was 0.011 to 0.809, indicating that they were hydrophobic in nature. The determination of the subcellular localization of TaPIN proteins will help to understand the molecular function. The subcellular localization prediction of TaPIN proteins suggests that most TaPINs were located on the plasma membrane (Table 1).
To investigate the evolutionary relationship between TaPINs and other plant species PINs, a phylogenetic tree was constructed with TaPIN, AtPIN and OsPIN proteins (Table S1). The results indicate that TaPIN proteins were divided into seven groups (Figure 1), where group VI was the largest with 13 members. Groups I, II, III, IV, V and VII included nine, three, three, seven, three and six members, respectively (Figure 1 and Figure S2).

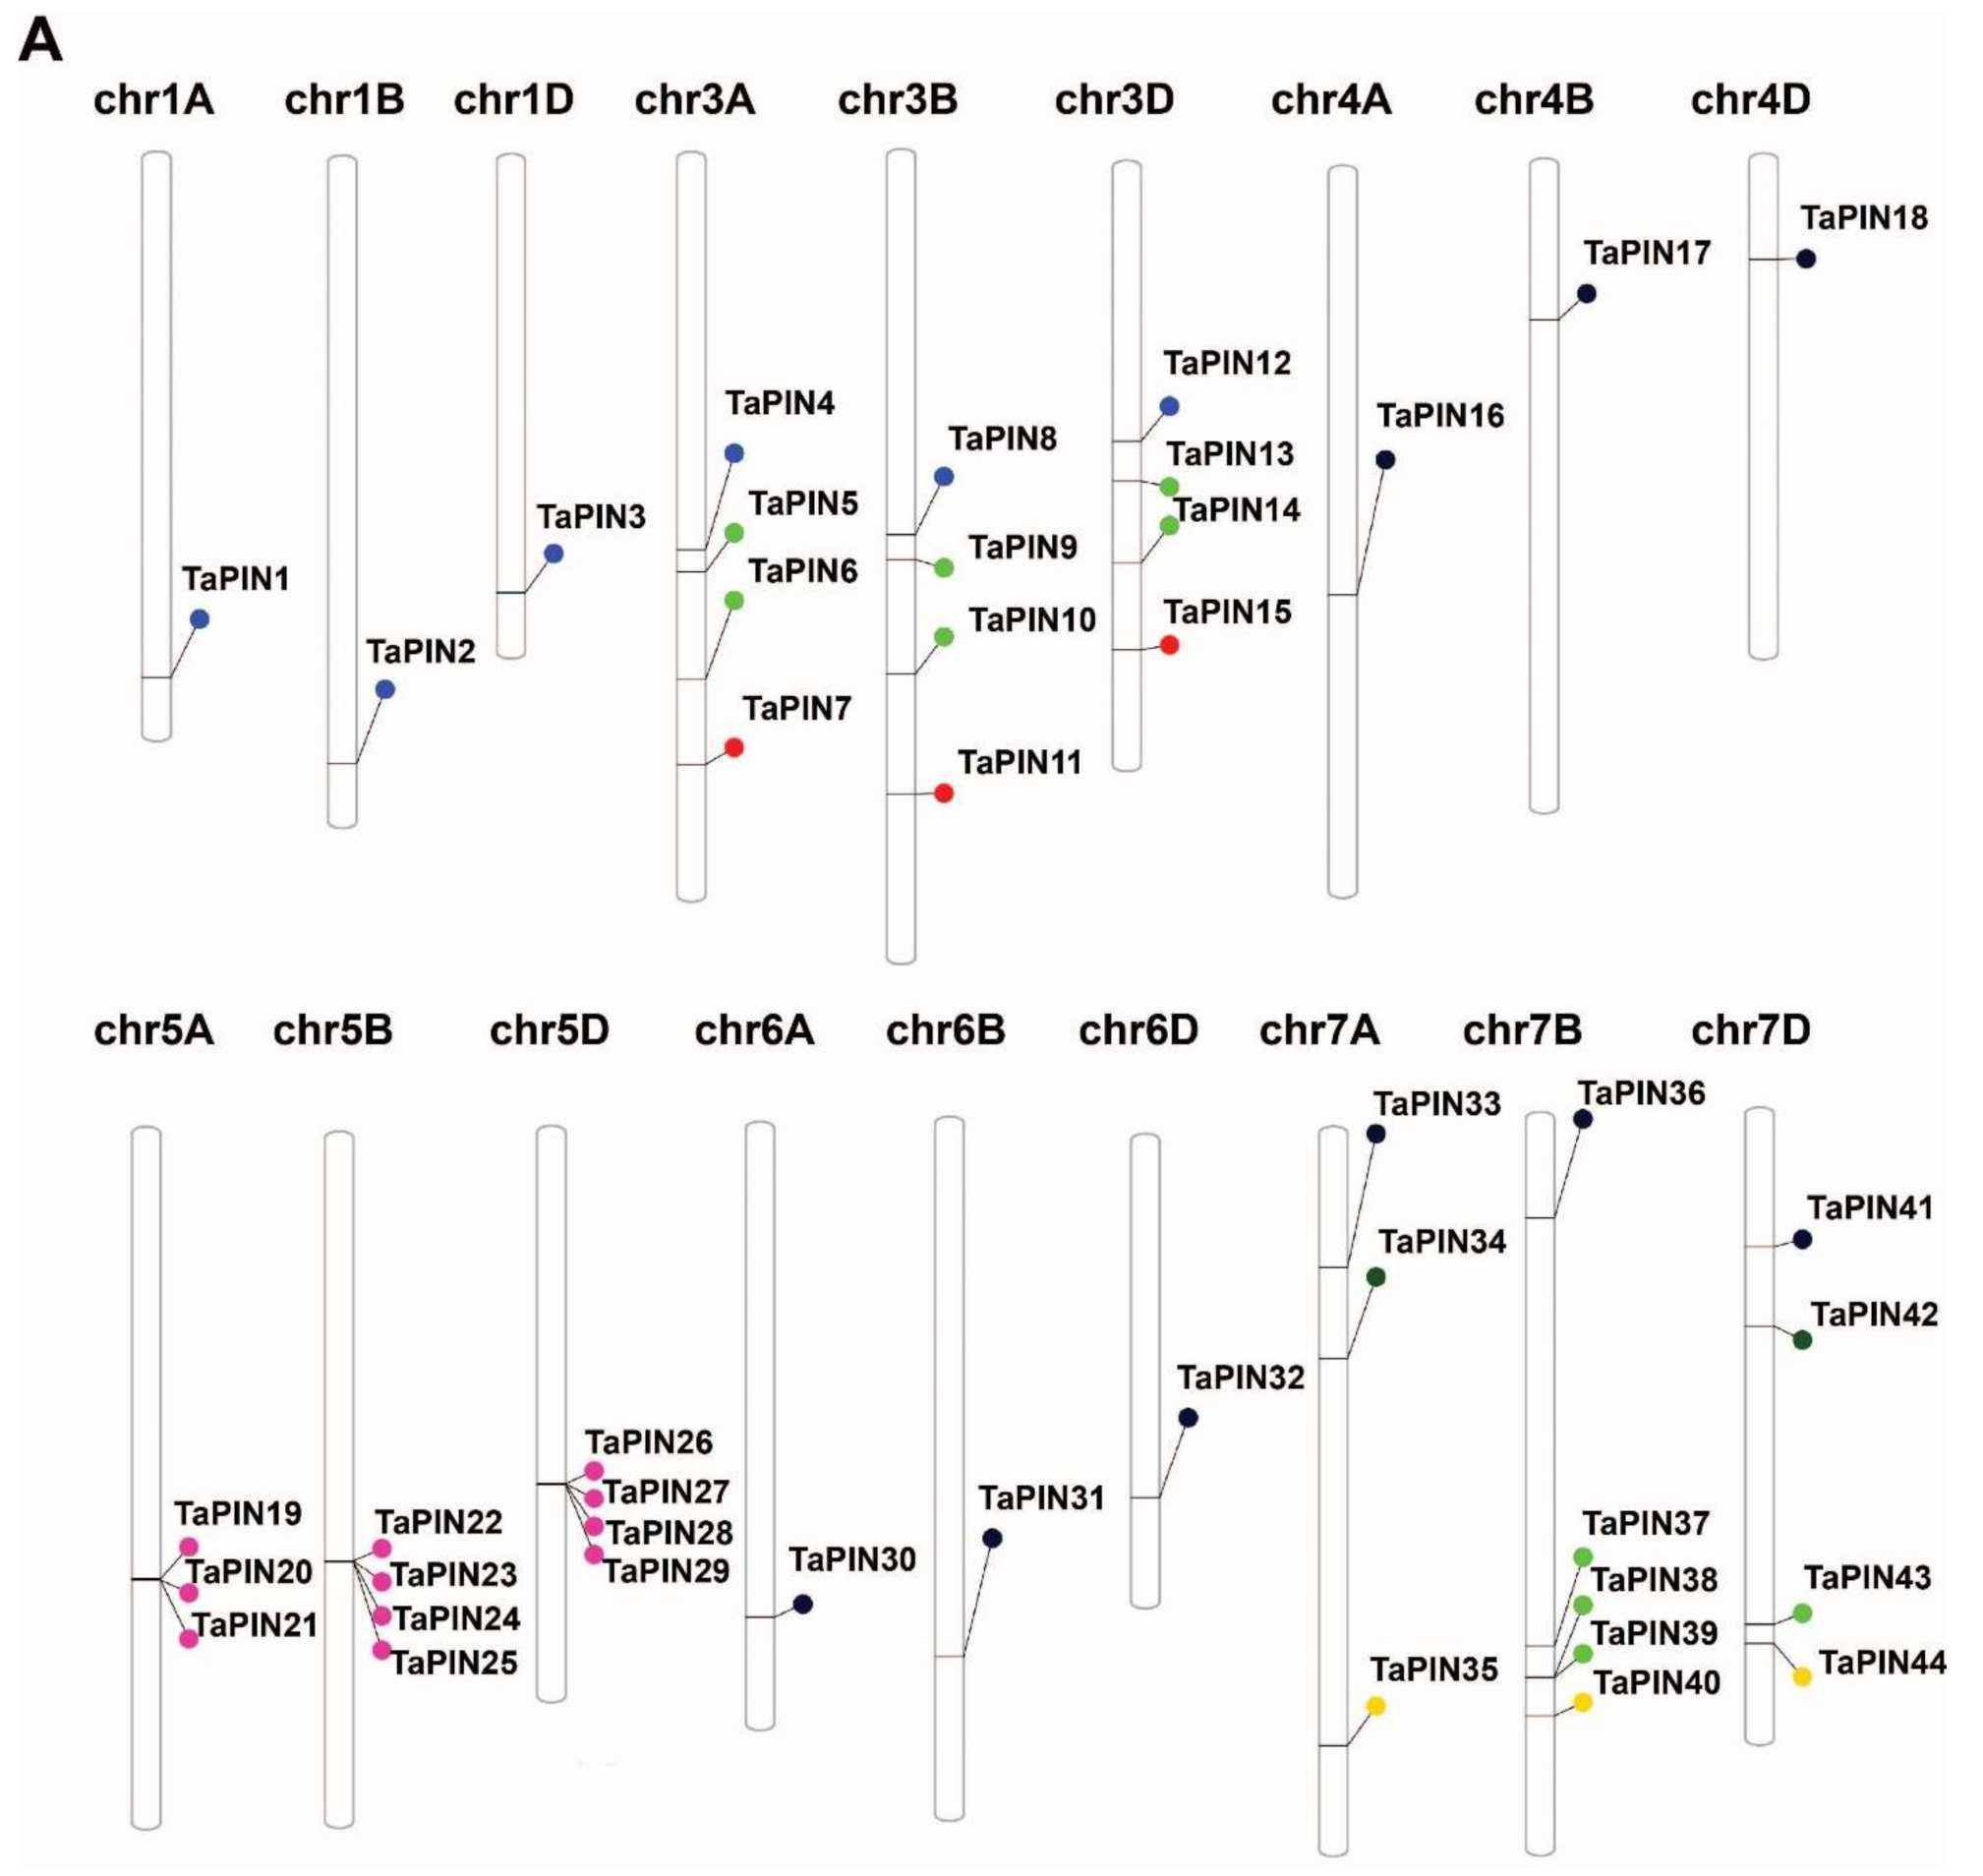
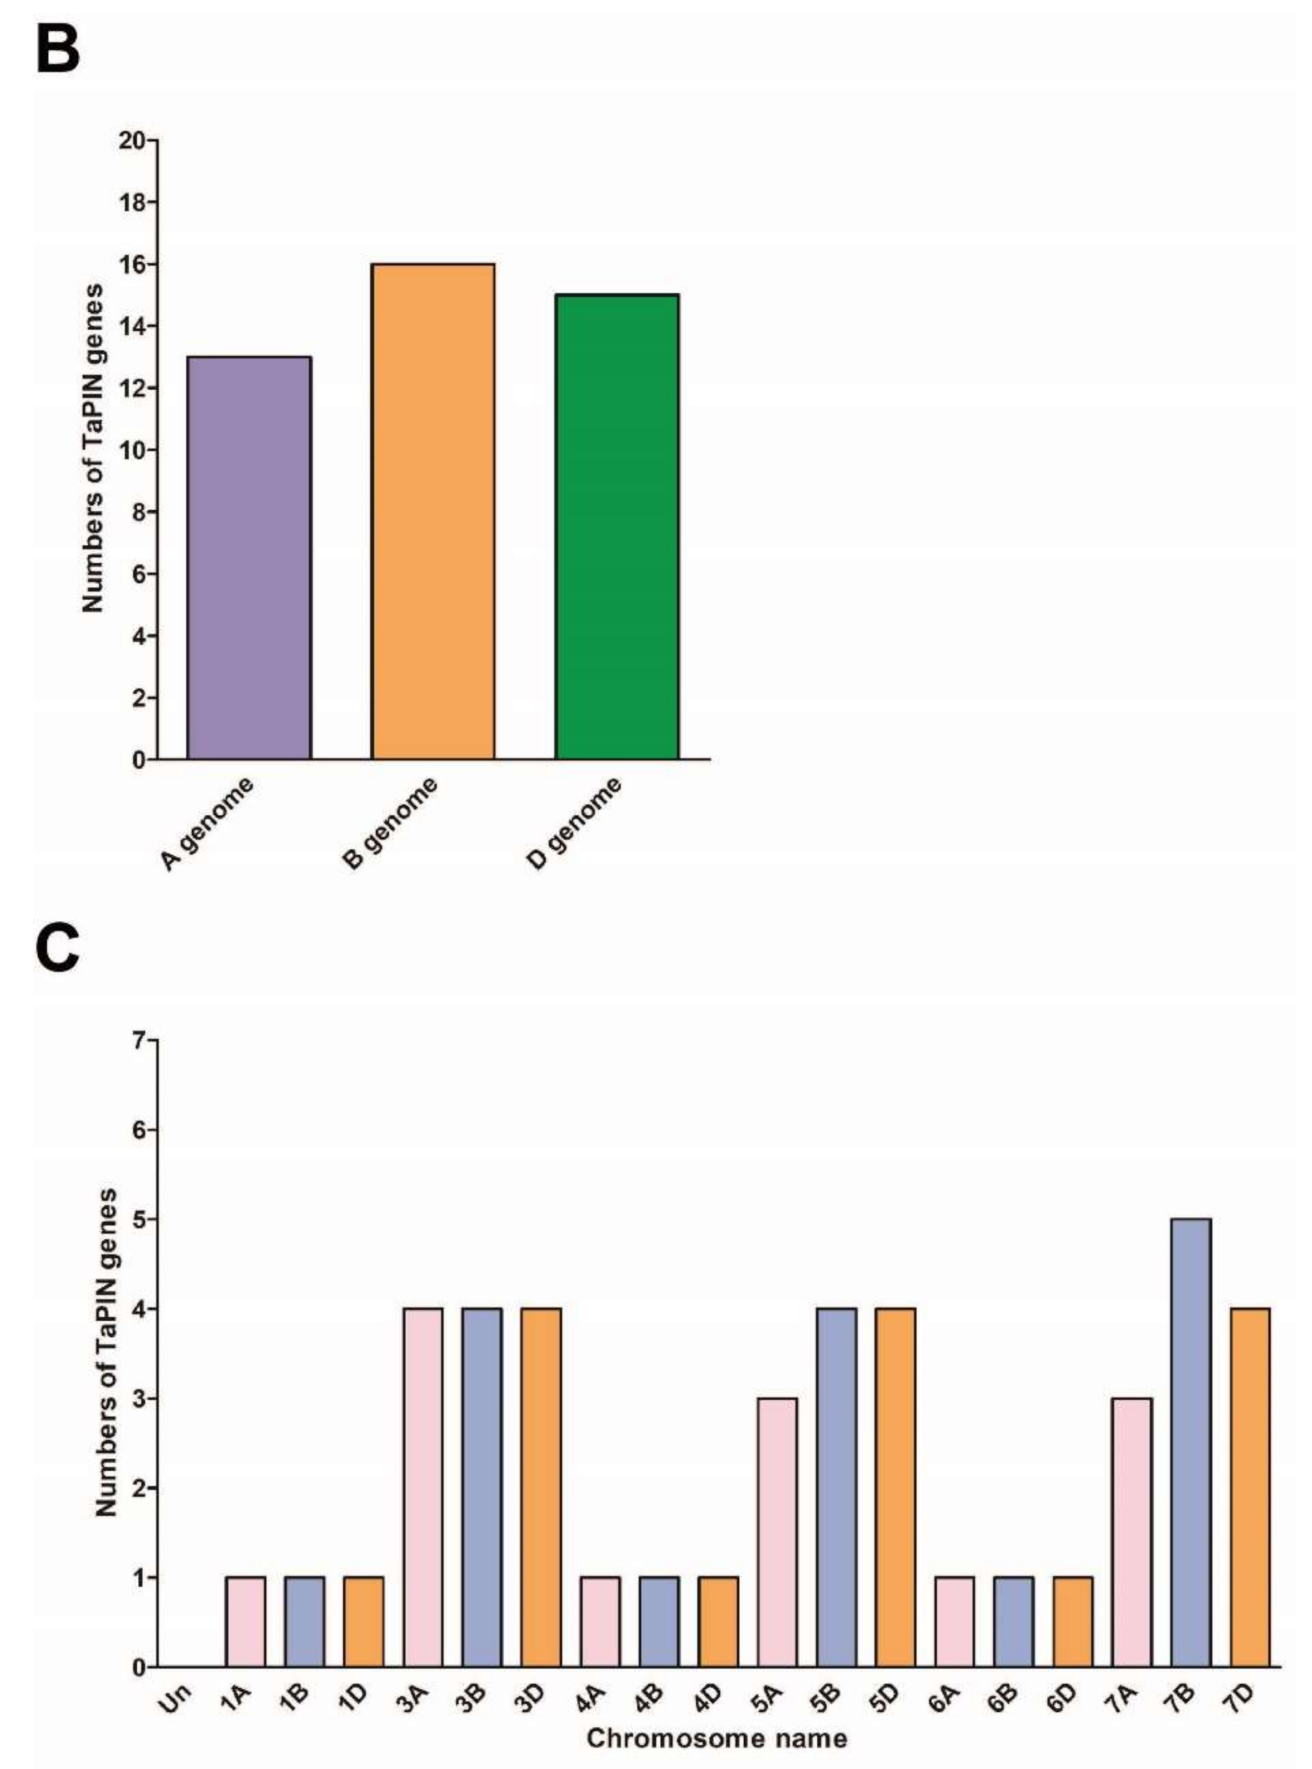
2.2. Chromosomal Distribution of TaPIN Genes

The genomic chromosomal distribution of the identified TaPIN genes in wheat was mapped to the corresponding chromosomes according to the chromosomal locations of PIN genes by the PhenGram online server. The TaPIN genes are present on the 18 wheat chromosomes (Figure 2A and Table 1). TaPIN genes displayed a slightly higher presence on the B and D subgenomes (Figure 2B). The maximum number of TaPIN genes, for instance, 16, was mapped on the chromosomes of the B subgenome. A subgenome had the lowest number of TaPIN genes, i.e., 13. The maximum number of TaPINs is located on chromosome 7B with five genes (Figure 2C). The minimum number of TaPINs is located on chromosome 1A, 1B, 1D, 4A, 4B, 4D, 6A, 6B and 6D, having only a single gene. Conversely, none of the TaPIN genes were found on chromosome 2. Overall, all the PIN family genes were evenly distributed on the three subgenomes of wheat.
In the context that wheat is hexapolyploid with large genomes, we further examined the duplication events in the TaPIN gene family. The phylogenetic analysis of the TaPIN genes also indicates several duplication events (Figure S3). We found that 30 PIN genes in T. aestivum participated in duplication events (Figure S4 and Table S2), which points out that the expansion of the PIN gene family in T. aestivum was caused mainly by whole-genome duplication or segmental duplication within genomes. To elucidate the selective pressure on the duplicated TaPIN genes, we calculated the non-synonymous (Ka) and synonymous substitutions (Ks), and the Ka/Ks ratios for the 15 TaPIN gene pairs (Table S2). The value of Ka/Ks = 1 denotes that genes experienced a neutral selection; <1 suggests a purifying or negative selection; and >1 indicates a positive selection [68]. The Ka/Ks values for all 15 gene pairs were less than 1, suggesting that TaPIN genes underwent a strong purifying or negative selection pressure, with slight changes after duplication. Thus, these results indicate the conserved evolution of TaPIN genes.
To further examine the synteny relationships of TaPIN genes with other wheat relatives and model plants such as B. distachyon, Ae. tauschii, T. dicoccoides, O. sativa and A. thaliana, the Multiple Collinearity Scan toolkit was used to find the orthologous genes between these plant species’ genomes (Figure 3 and Table S3). We identified 38, 31, 68, 40 and 36 orthologous gene pairs between TaPINs with other PIN genes in B. distachyon, Ae. tauschii, T. dicoccoides, O. sativa and A. thaliana, respectively. The results show that 30, 25, 42, 36 and 24 TaPIN genes were collinear with PIN genes in B. distachyon, Ae. tauschii, T. dicoccoides, O. sativa and A. thaliana, respectively. A few TaPIN genes had at least three pairs of orthologous genes, for instance, TaPIN1, TaPIN2, TaPIN3, TaPIN4, TaPIN8 and TaPIN12, which might have played a crucial role in the evolution of PIN genes. These results suggest that TaPIN genes in wheat might be originated from other plant species’ orthologous genes.

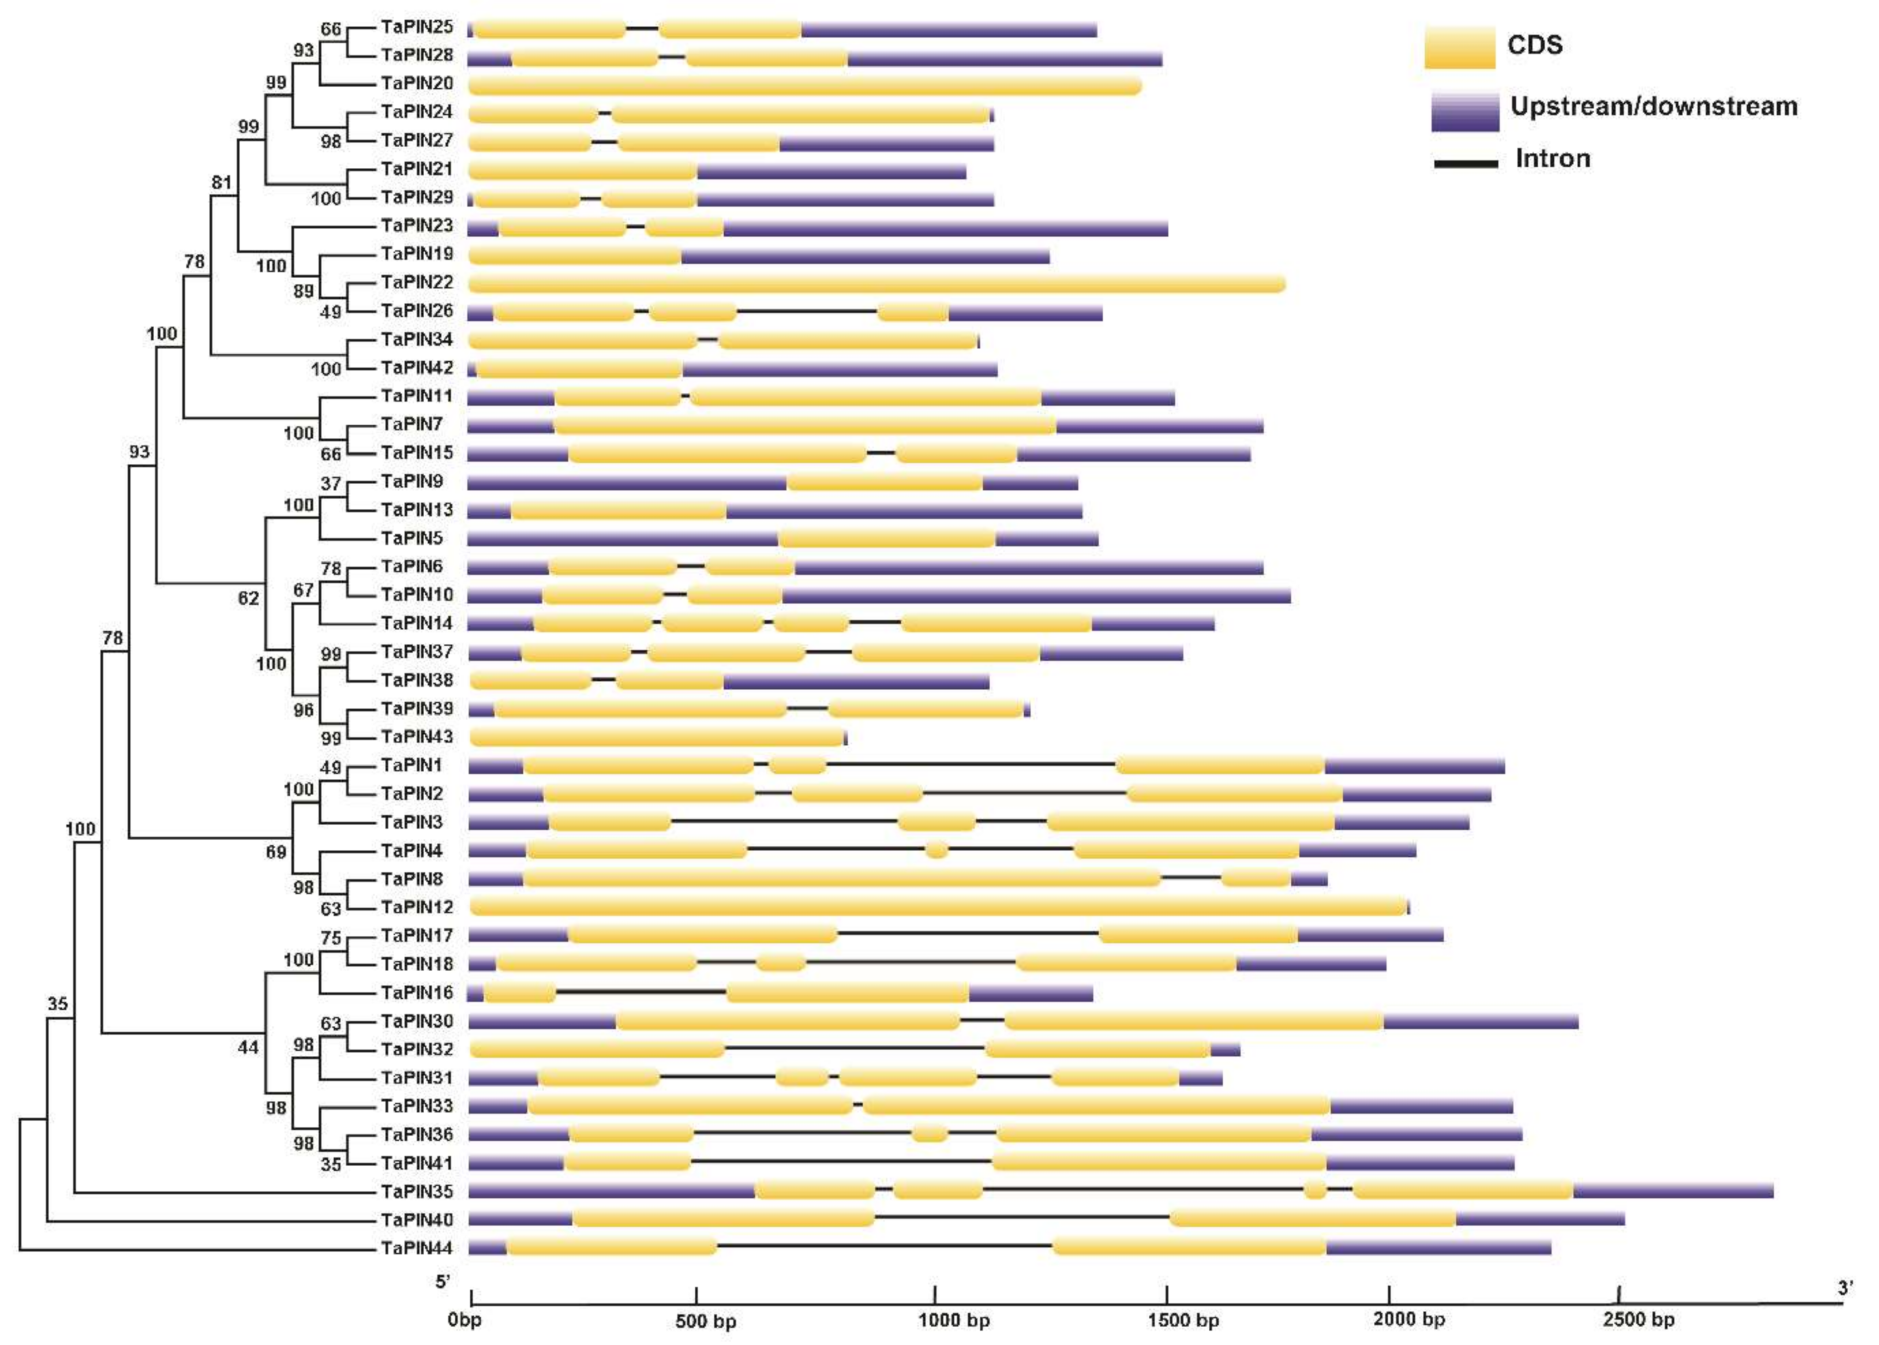
2.3. Gene Structure Analysis of TaPIN Genes

To understand the structural characteristics of the TaPIN genes, the exon–intron structures (Figure 4) and conserved motifs (Figure 5A,B) of TaPIN genes were analyzed. Gene structure analysis revealed that the TaPIN gene family varied greatly in terms of gene structure as most of the PIN genes contain one–three introns; however, some members of the TaPIN gene family are intronless such as TaPIN5, TaPIN7, TaPIN9, TaPIN12, TaPIN13, TaPIN19-21, TaPIN42 and TaPIN43. A maximum of three introns were found in TaPIN14 and TaPIN31 (Figure S5).

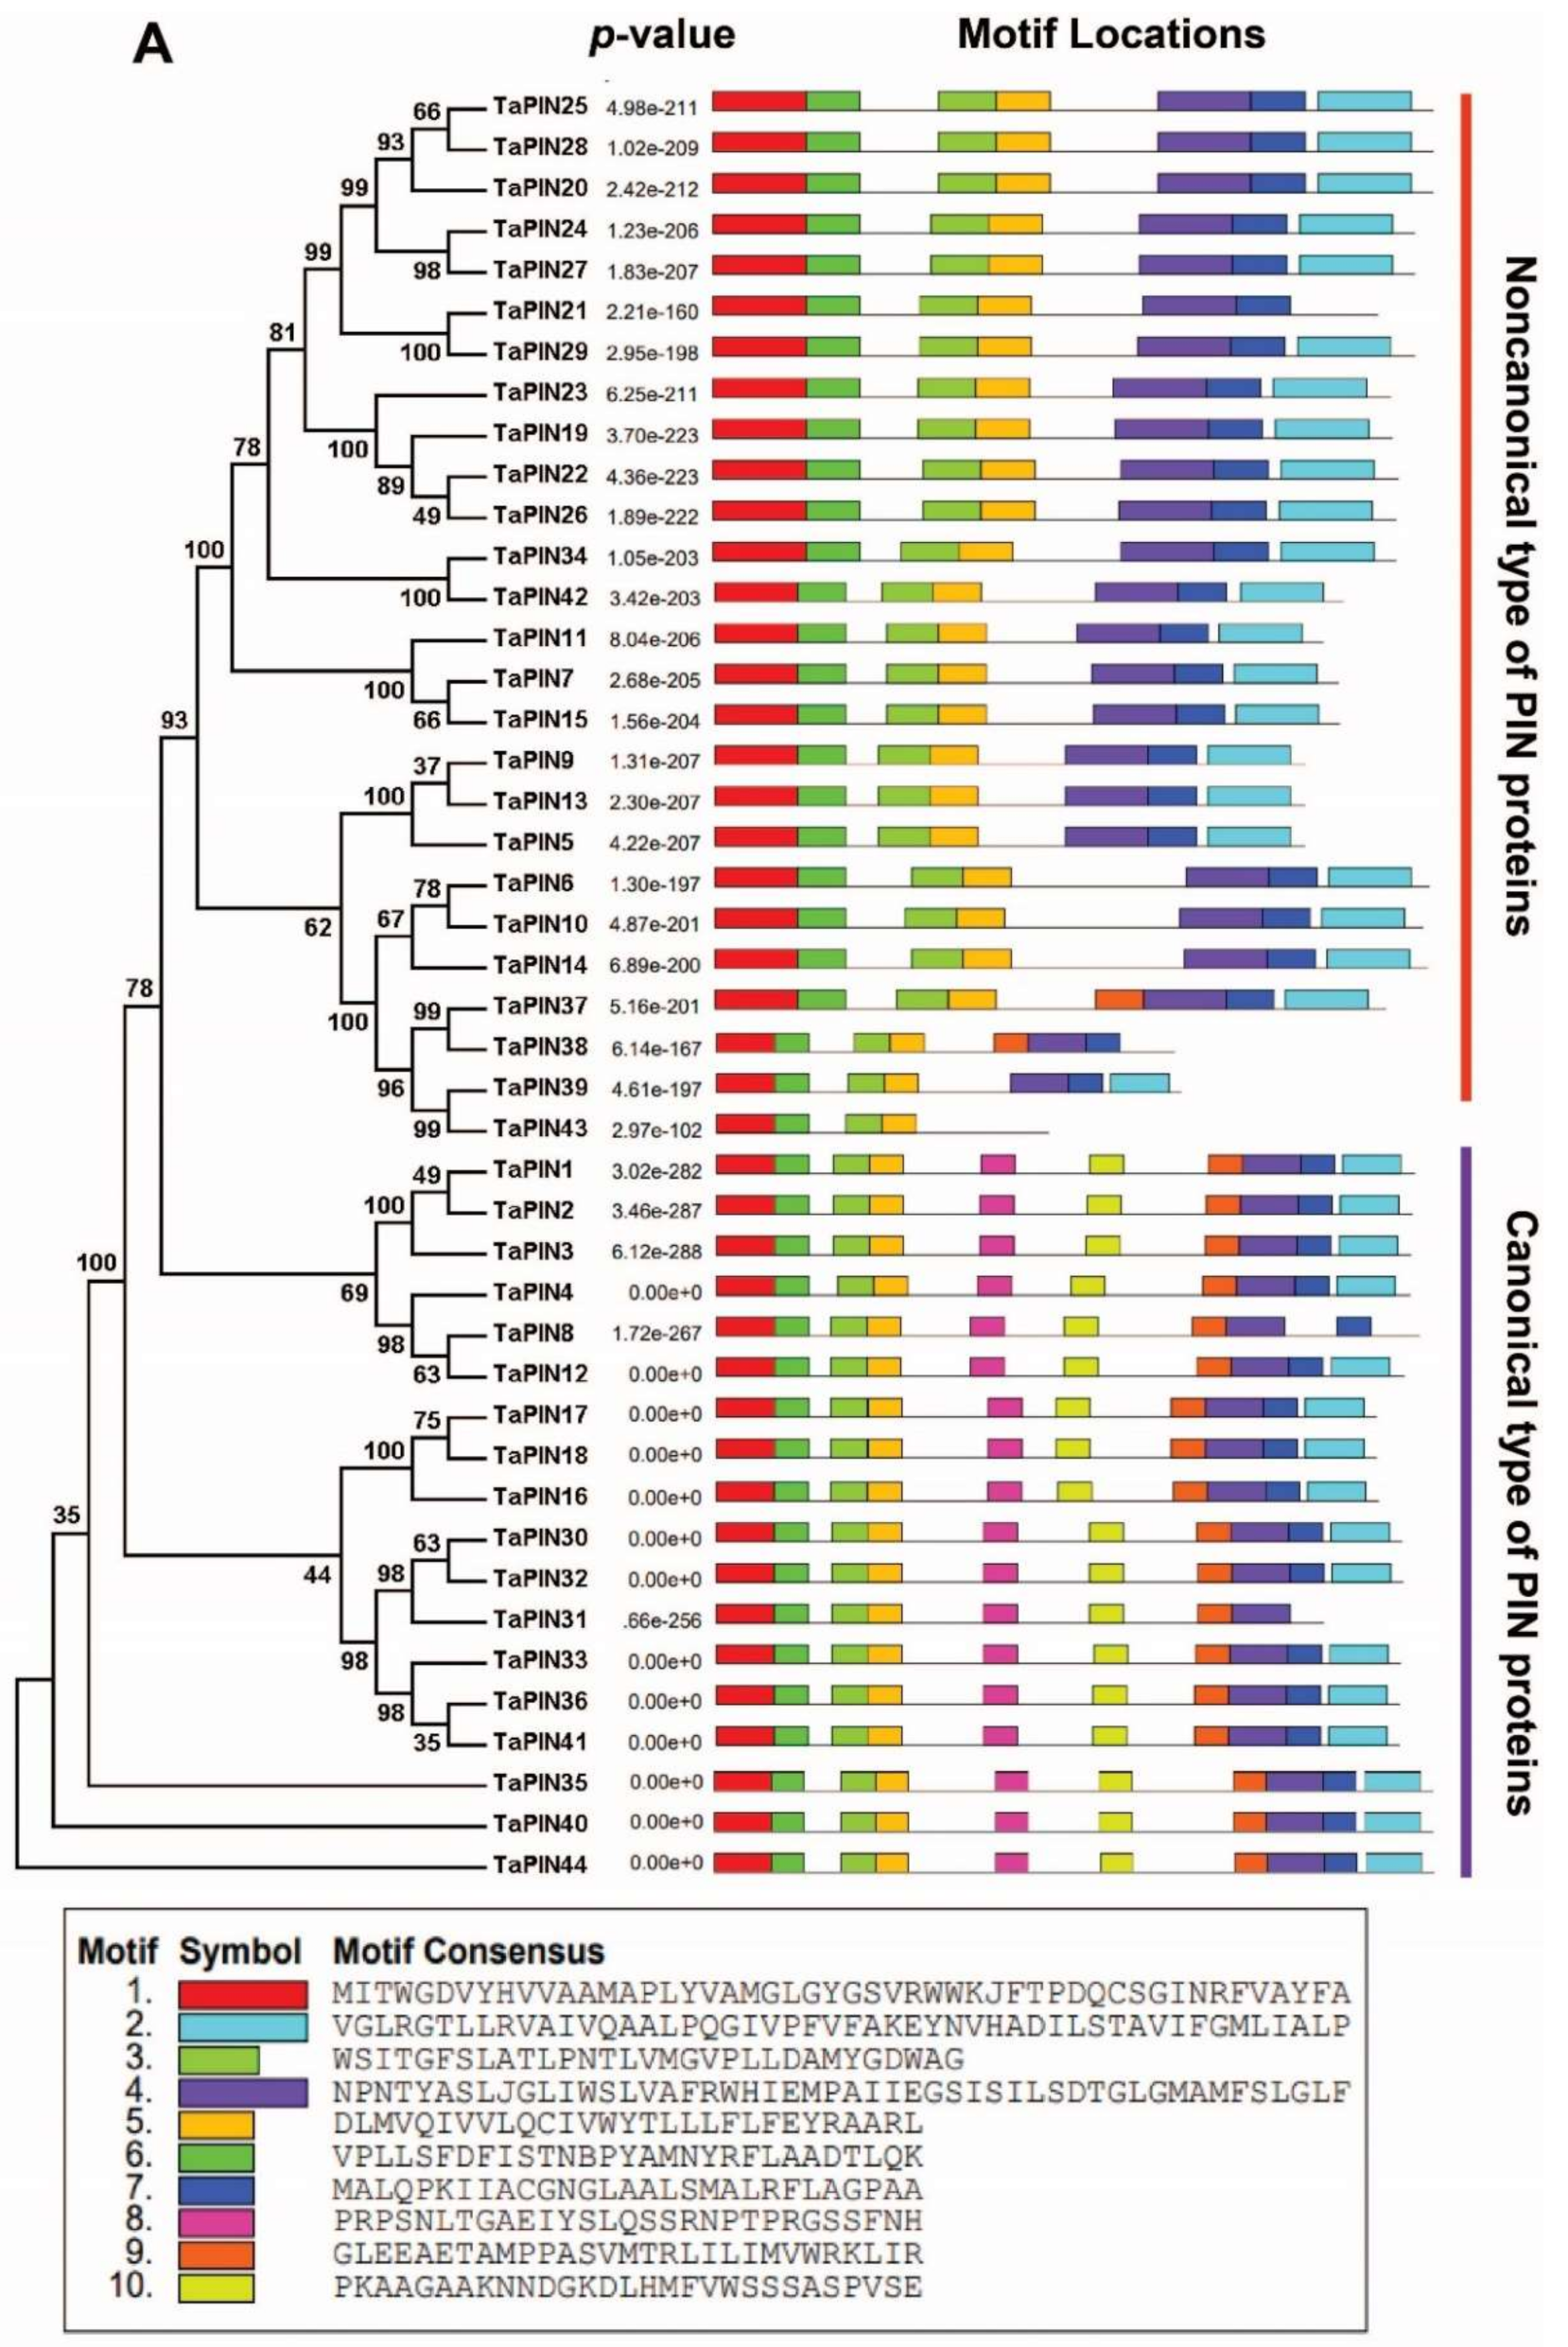
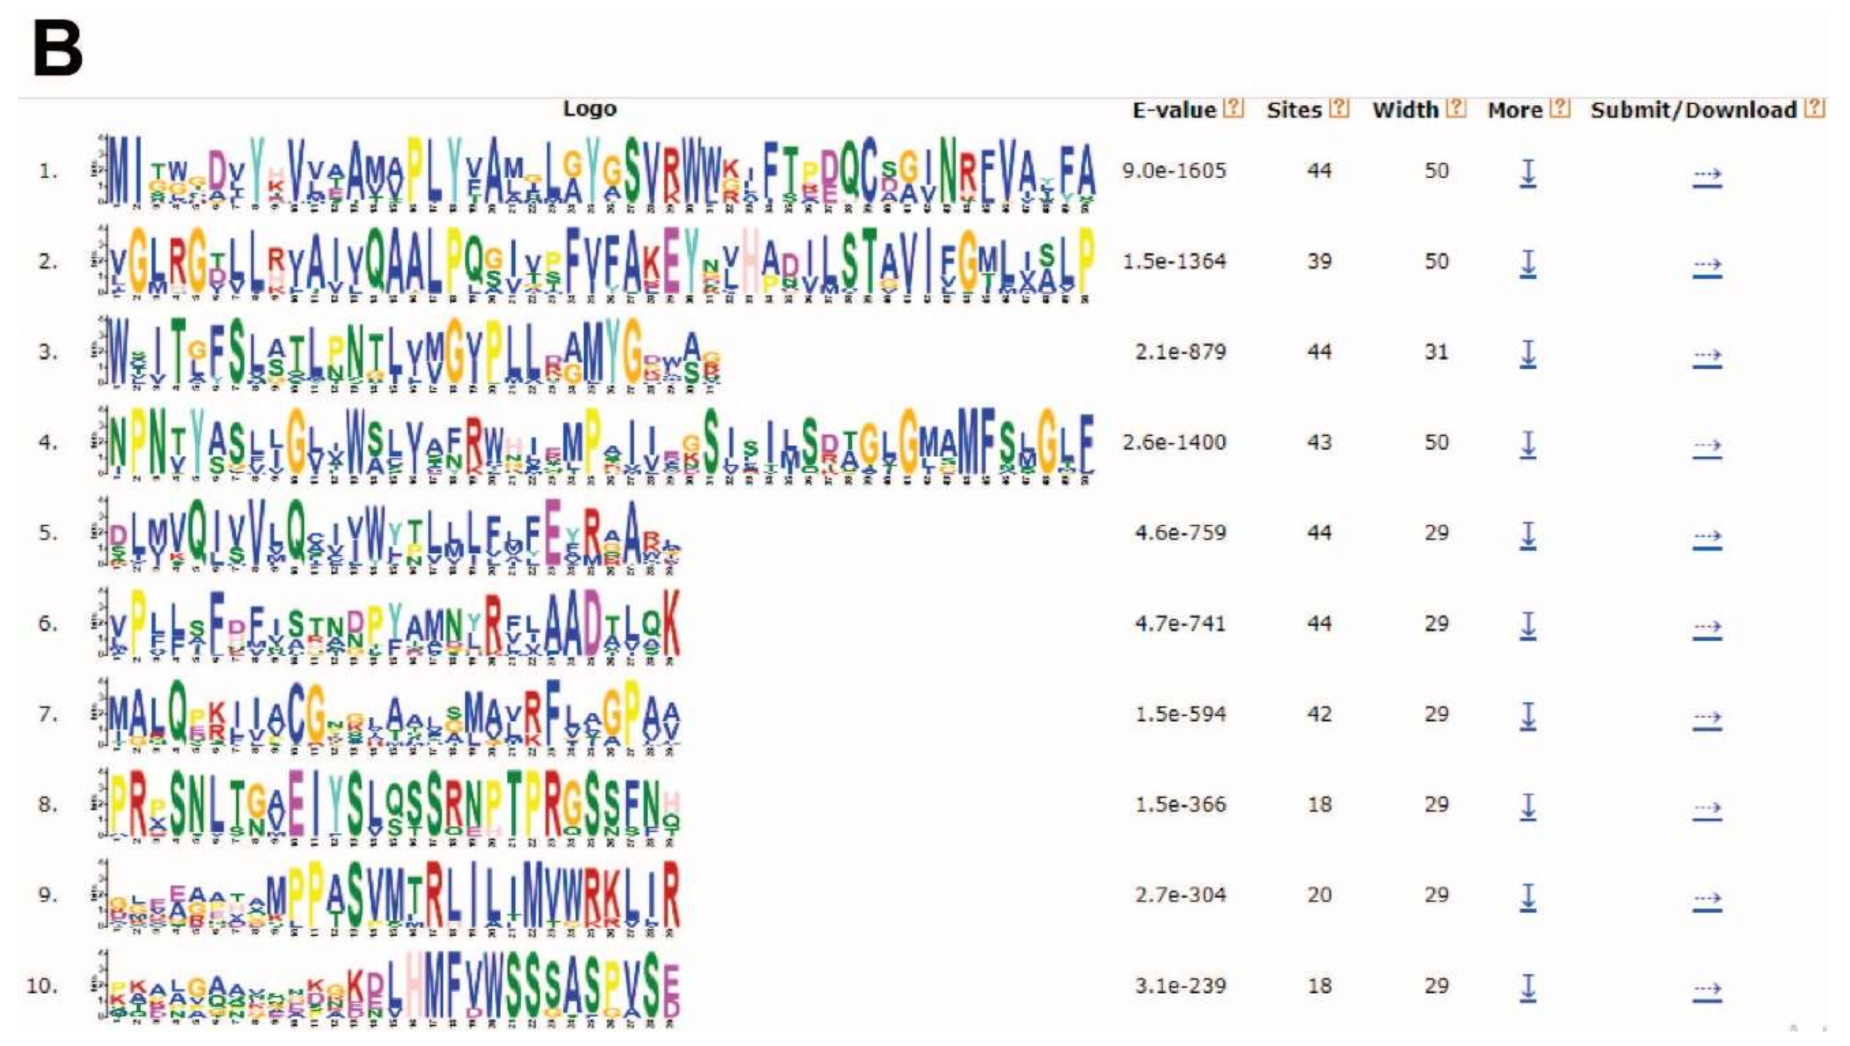
2.4. Conserved Motif Analysis of TaPIN Genes

Further, we also elucidated the conserved motifs of TaPIN genes using the MEME (Multiple Em for Motif Elicitation) online servers. Finally, 10 conserved motifs were identified in 44 TaPIN genes (Figure 5A,B). The TaPIN gene family was identified by the presence of a membrane transport domain (Pfam 03547), and all TaPINs had at least one membrane transport domain (Table S4) involved in auxin efflux, maintaining auxin homeostasis. In order to understand the molecular function of TaPIN genes in T. aestivum, three-dimensional (3D) protein models and transmembrane helices of all TaPINs were generated using the phyre2 server. TaPIN 3D protein structures contained α-helical bundles forming five to nine transmembrane helices (H1 to H9) (Figure 6A). The predicted transmembrane helices of the TaPIN proteins displayed a similar structure: a conserved amino and carboxy-terminal region of transmembrane segments and a divergent central region supposed to be a cytoplasmic domain (Figure S6), except for TaPIN5, TaPIN6, TaPIN7, TaPIN9, TaPIN10, TaPIN11, TaPIN13, TaPIN14, TaPIN15, TaPIN19-29, TaPIN34, TaPIN37, TaPIN38, TaPIN39, TaPIN42 and TaPIN43, which had a short central loop. In addition, multiple sequence alignment also revealed that all TaPIN proteins share a highly conserved N- and C-terminal and a variable central region (Figure 6B, Figures S6 and S7). These results will help to understand the substrate specificity and molecular function of TaPIN genes.

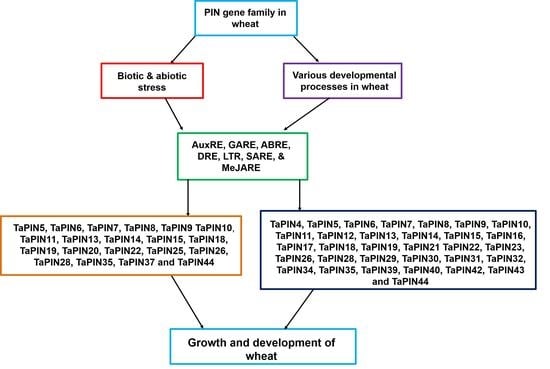
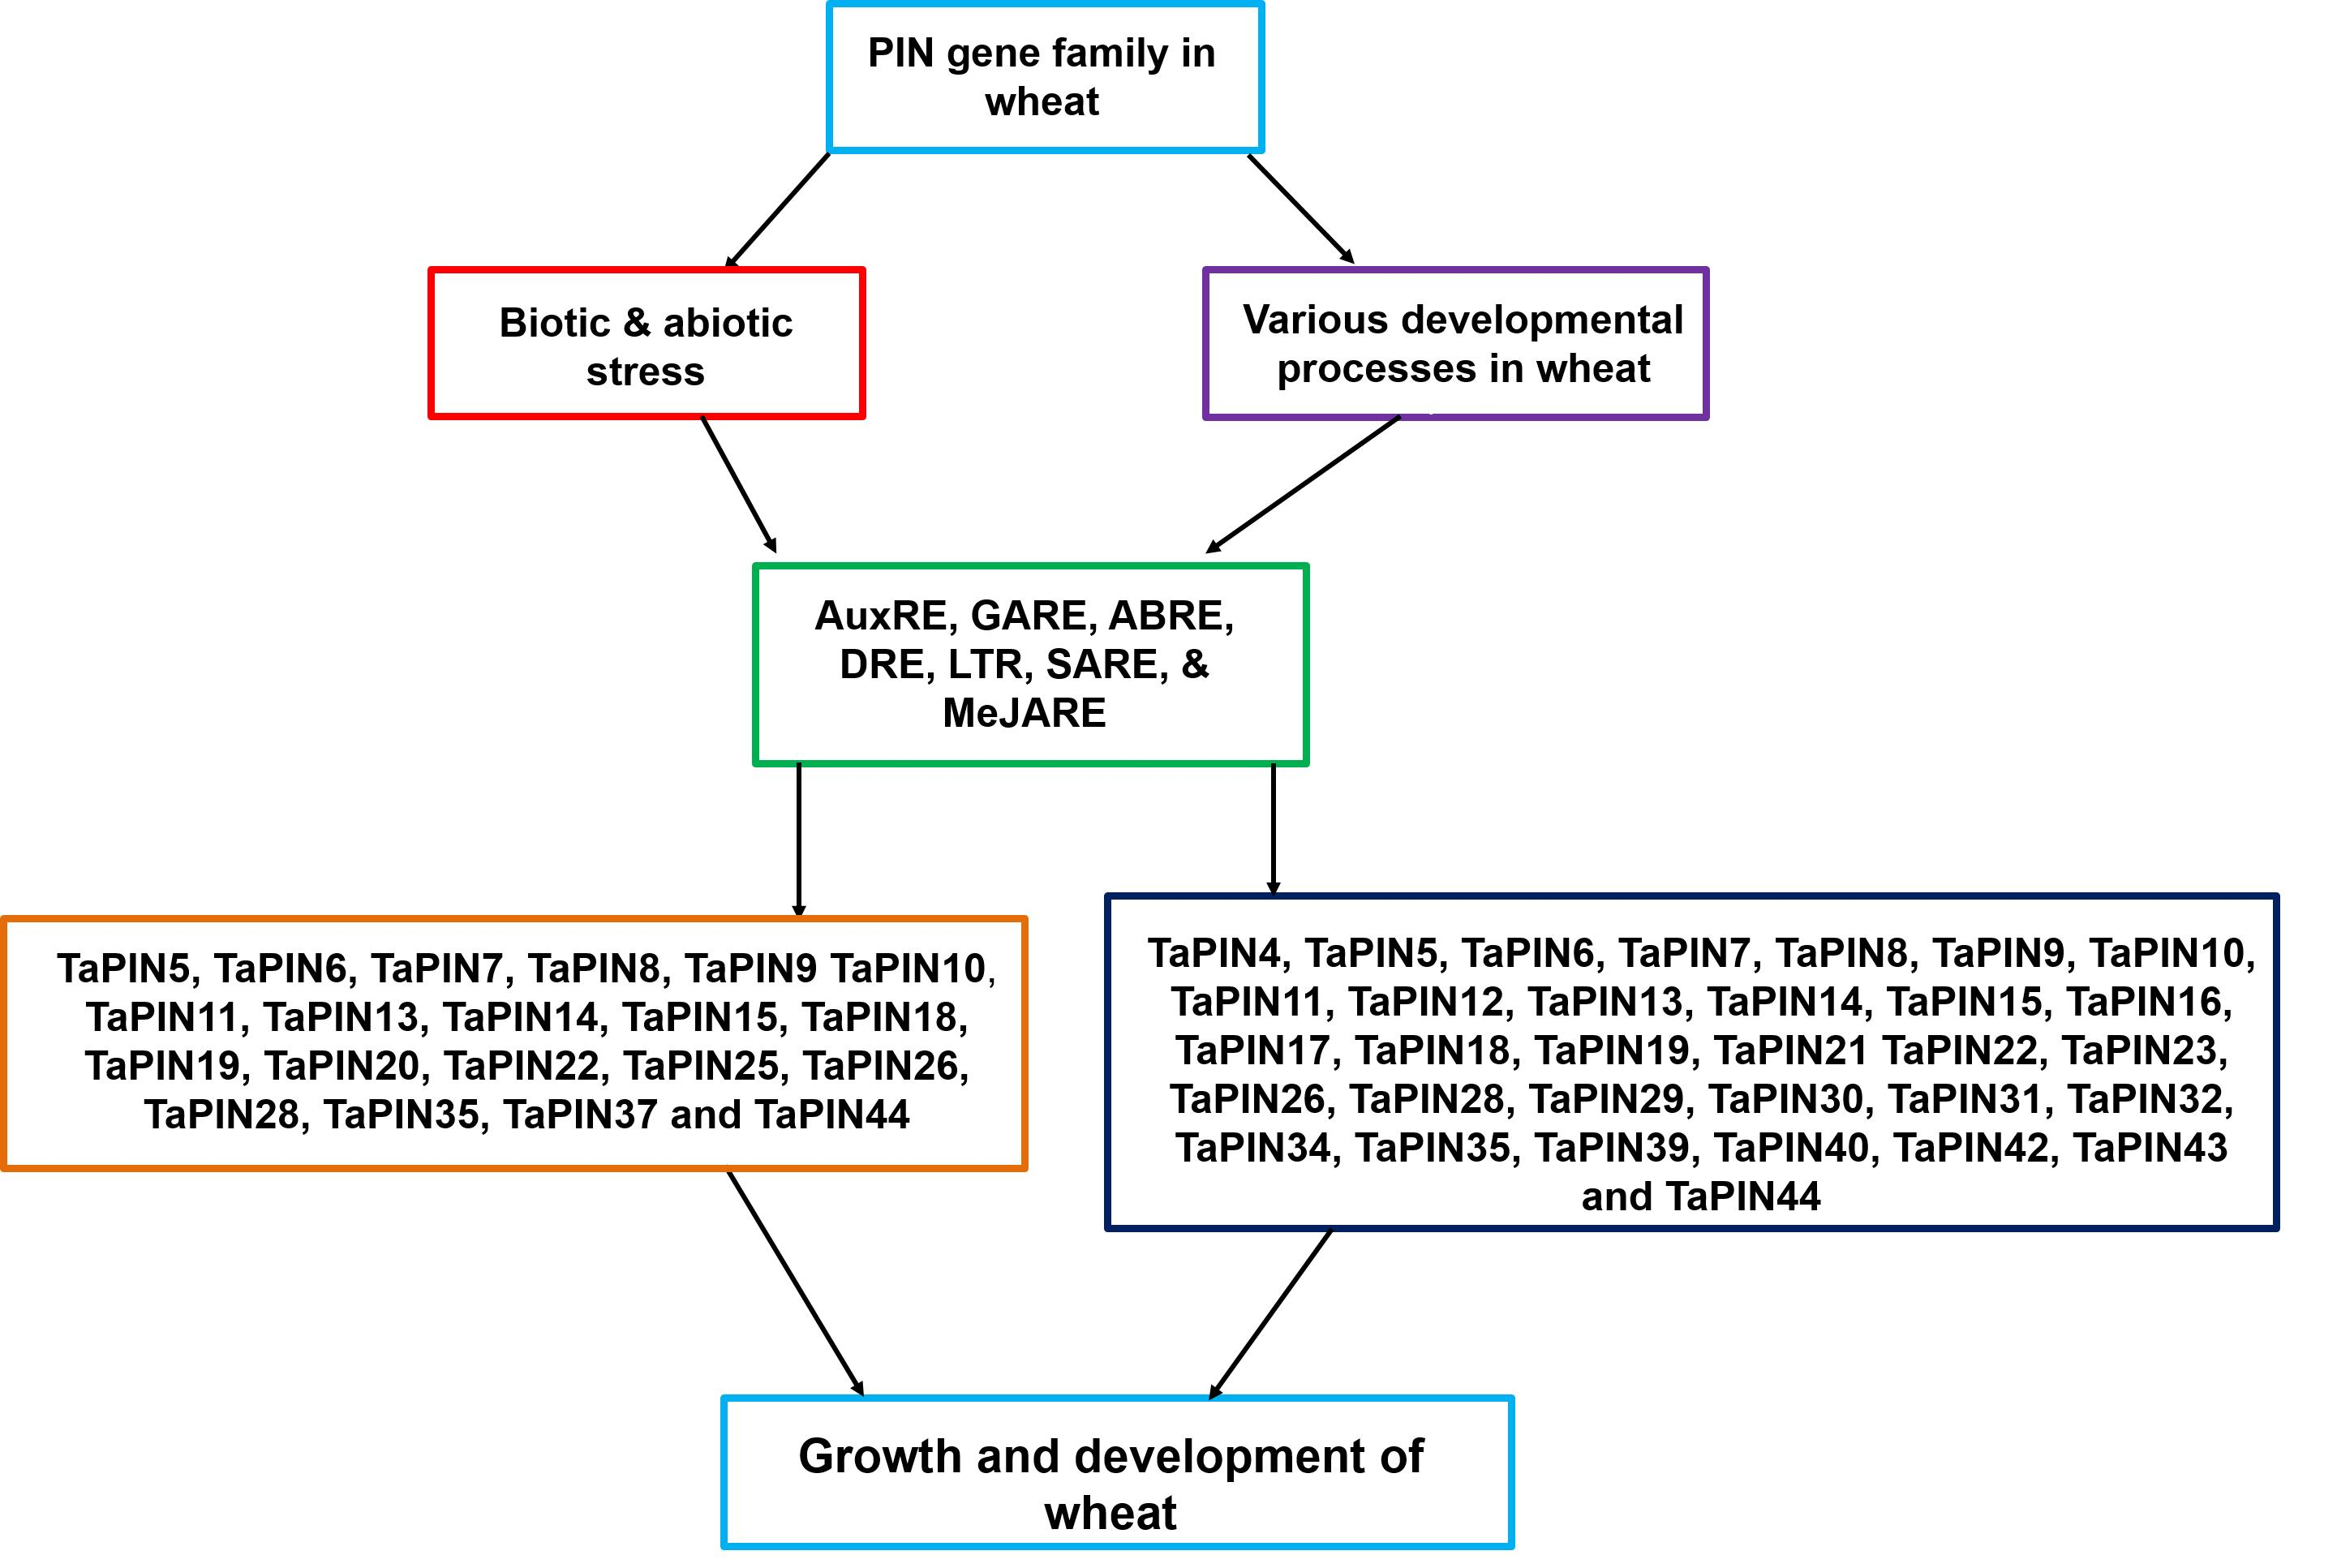
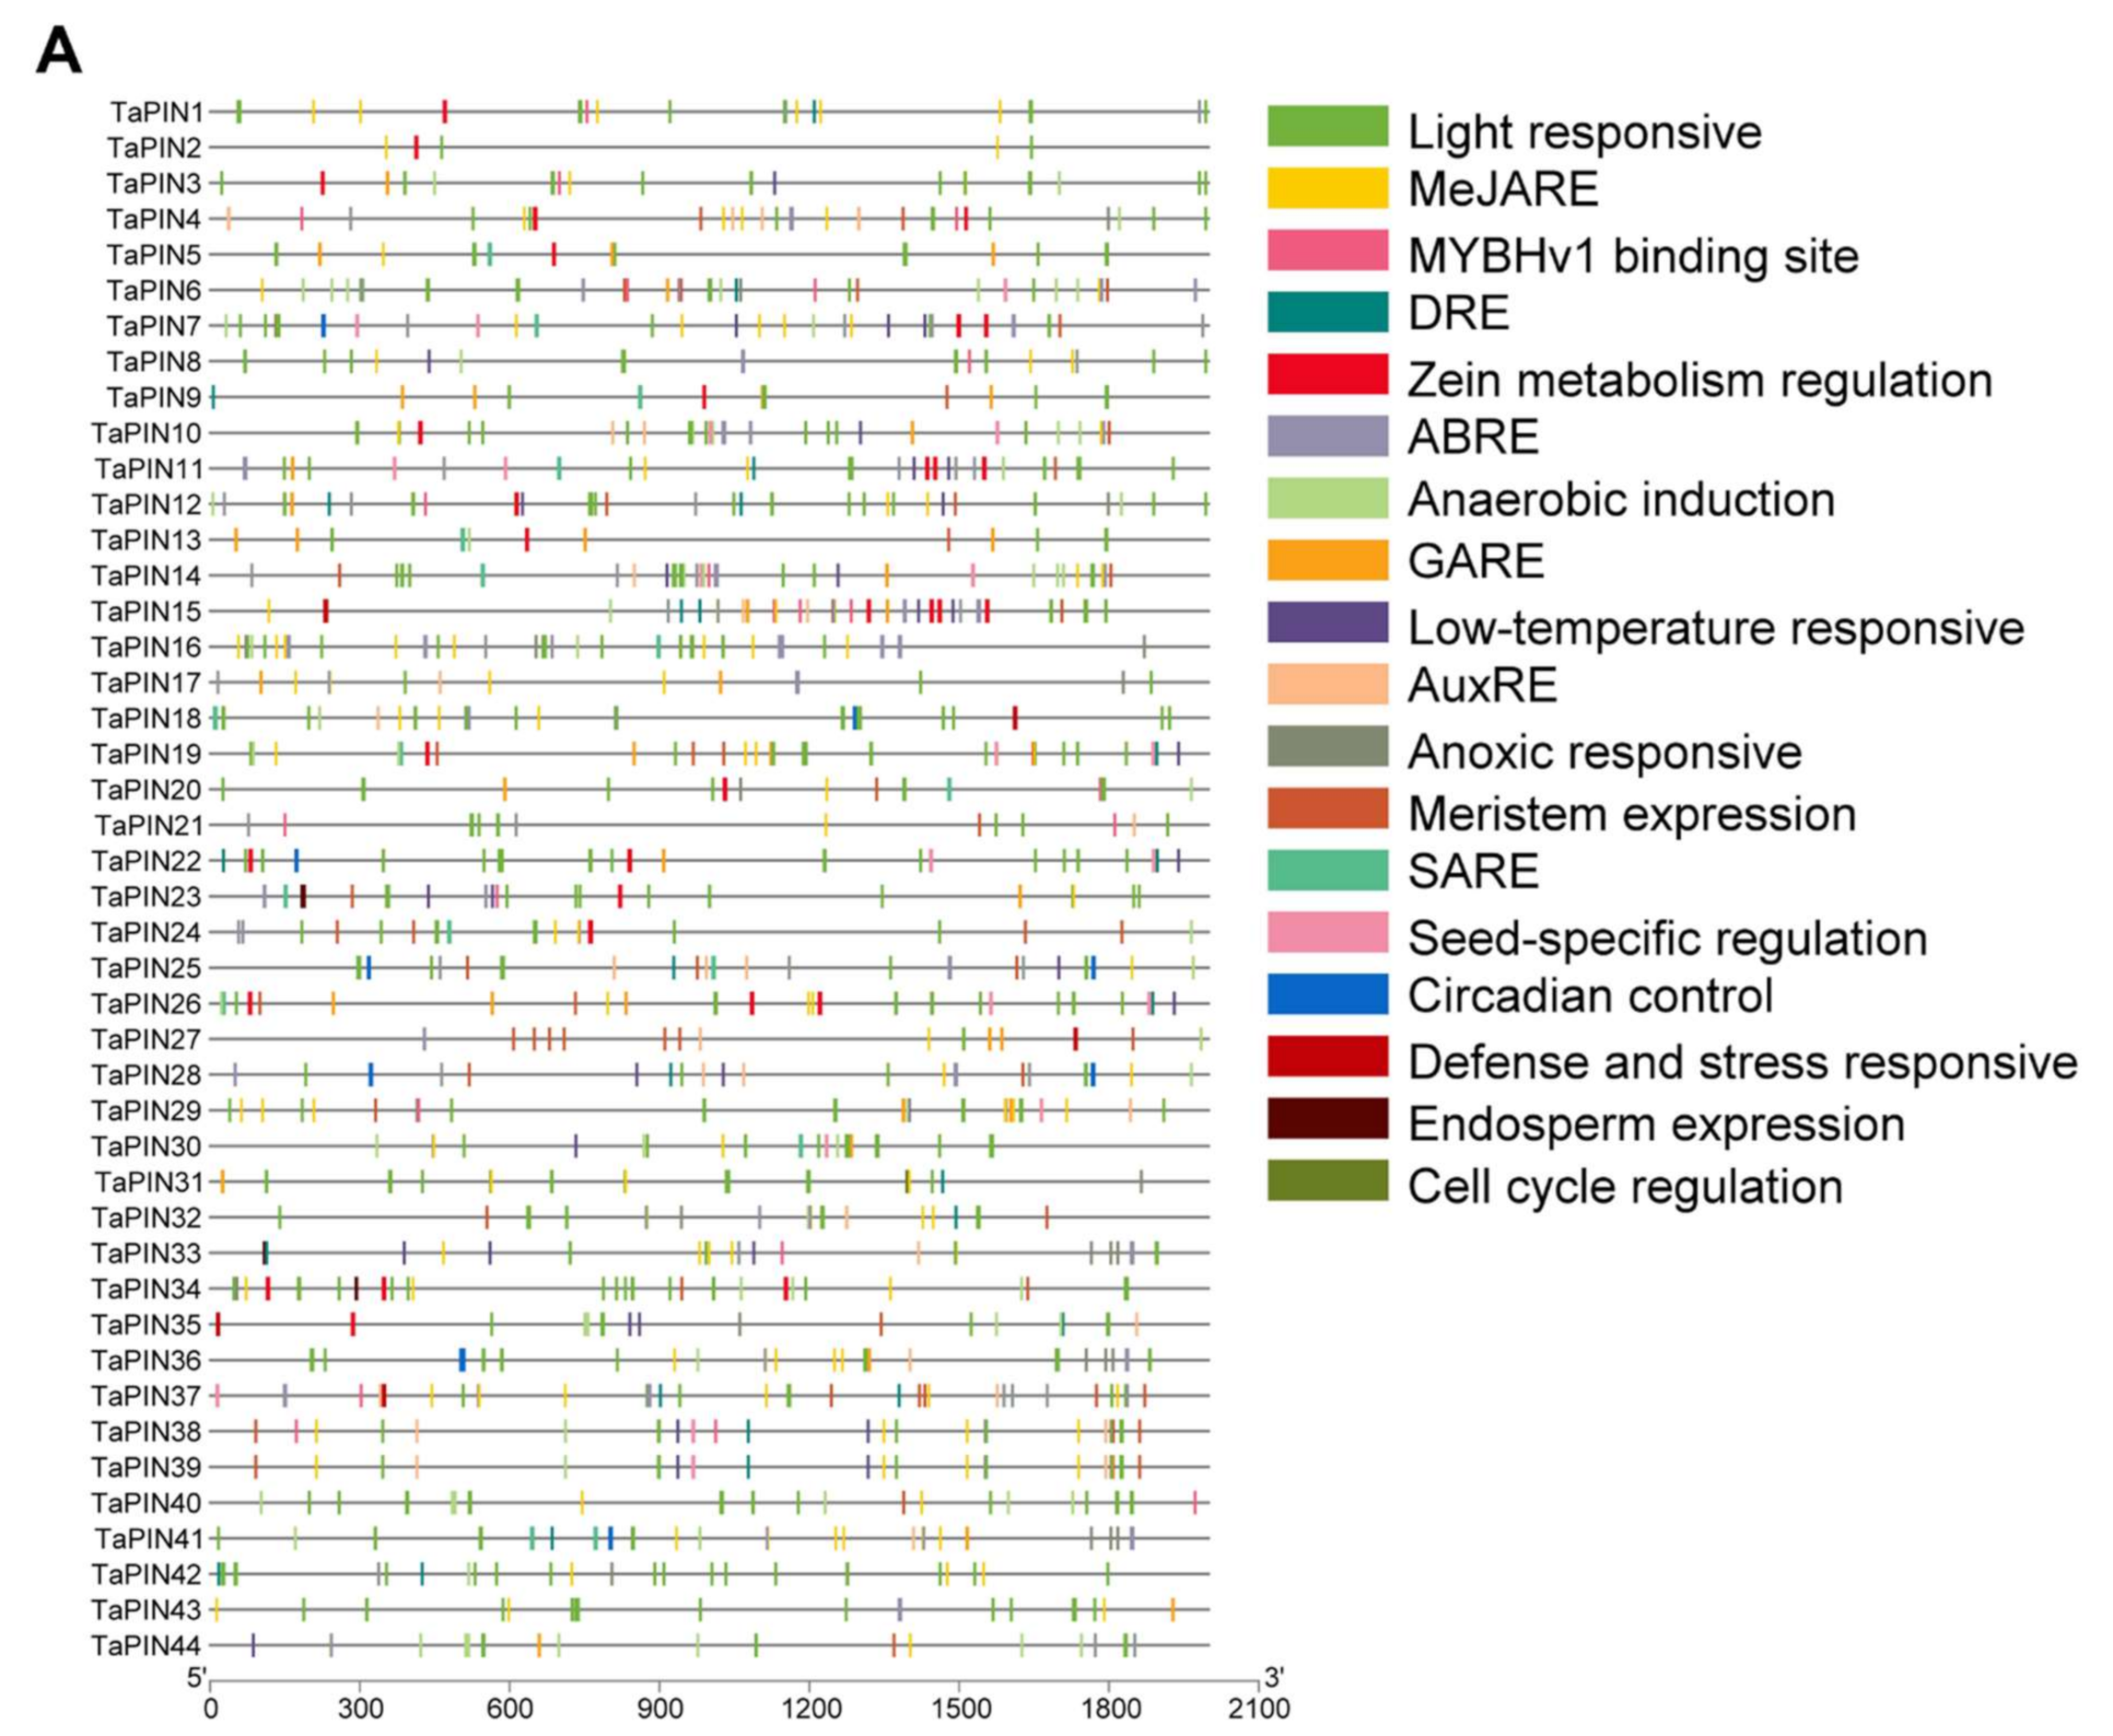
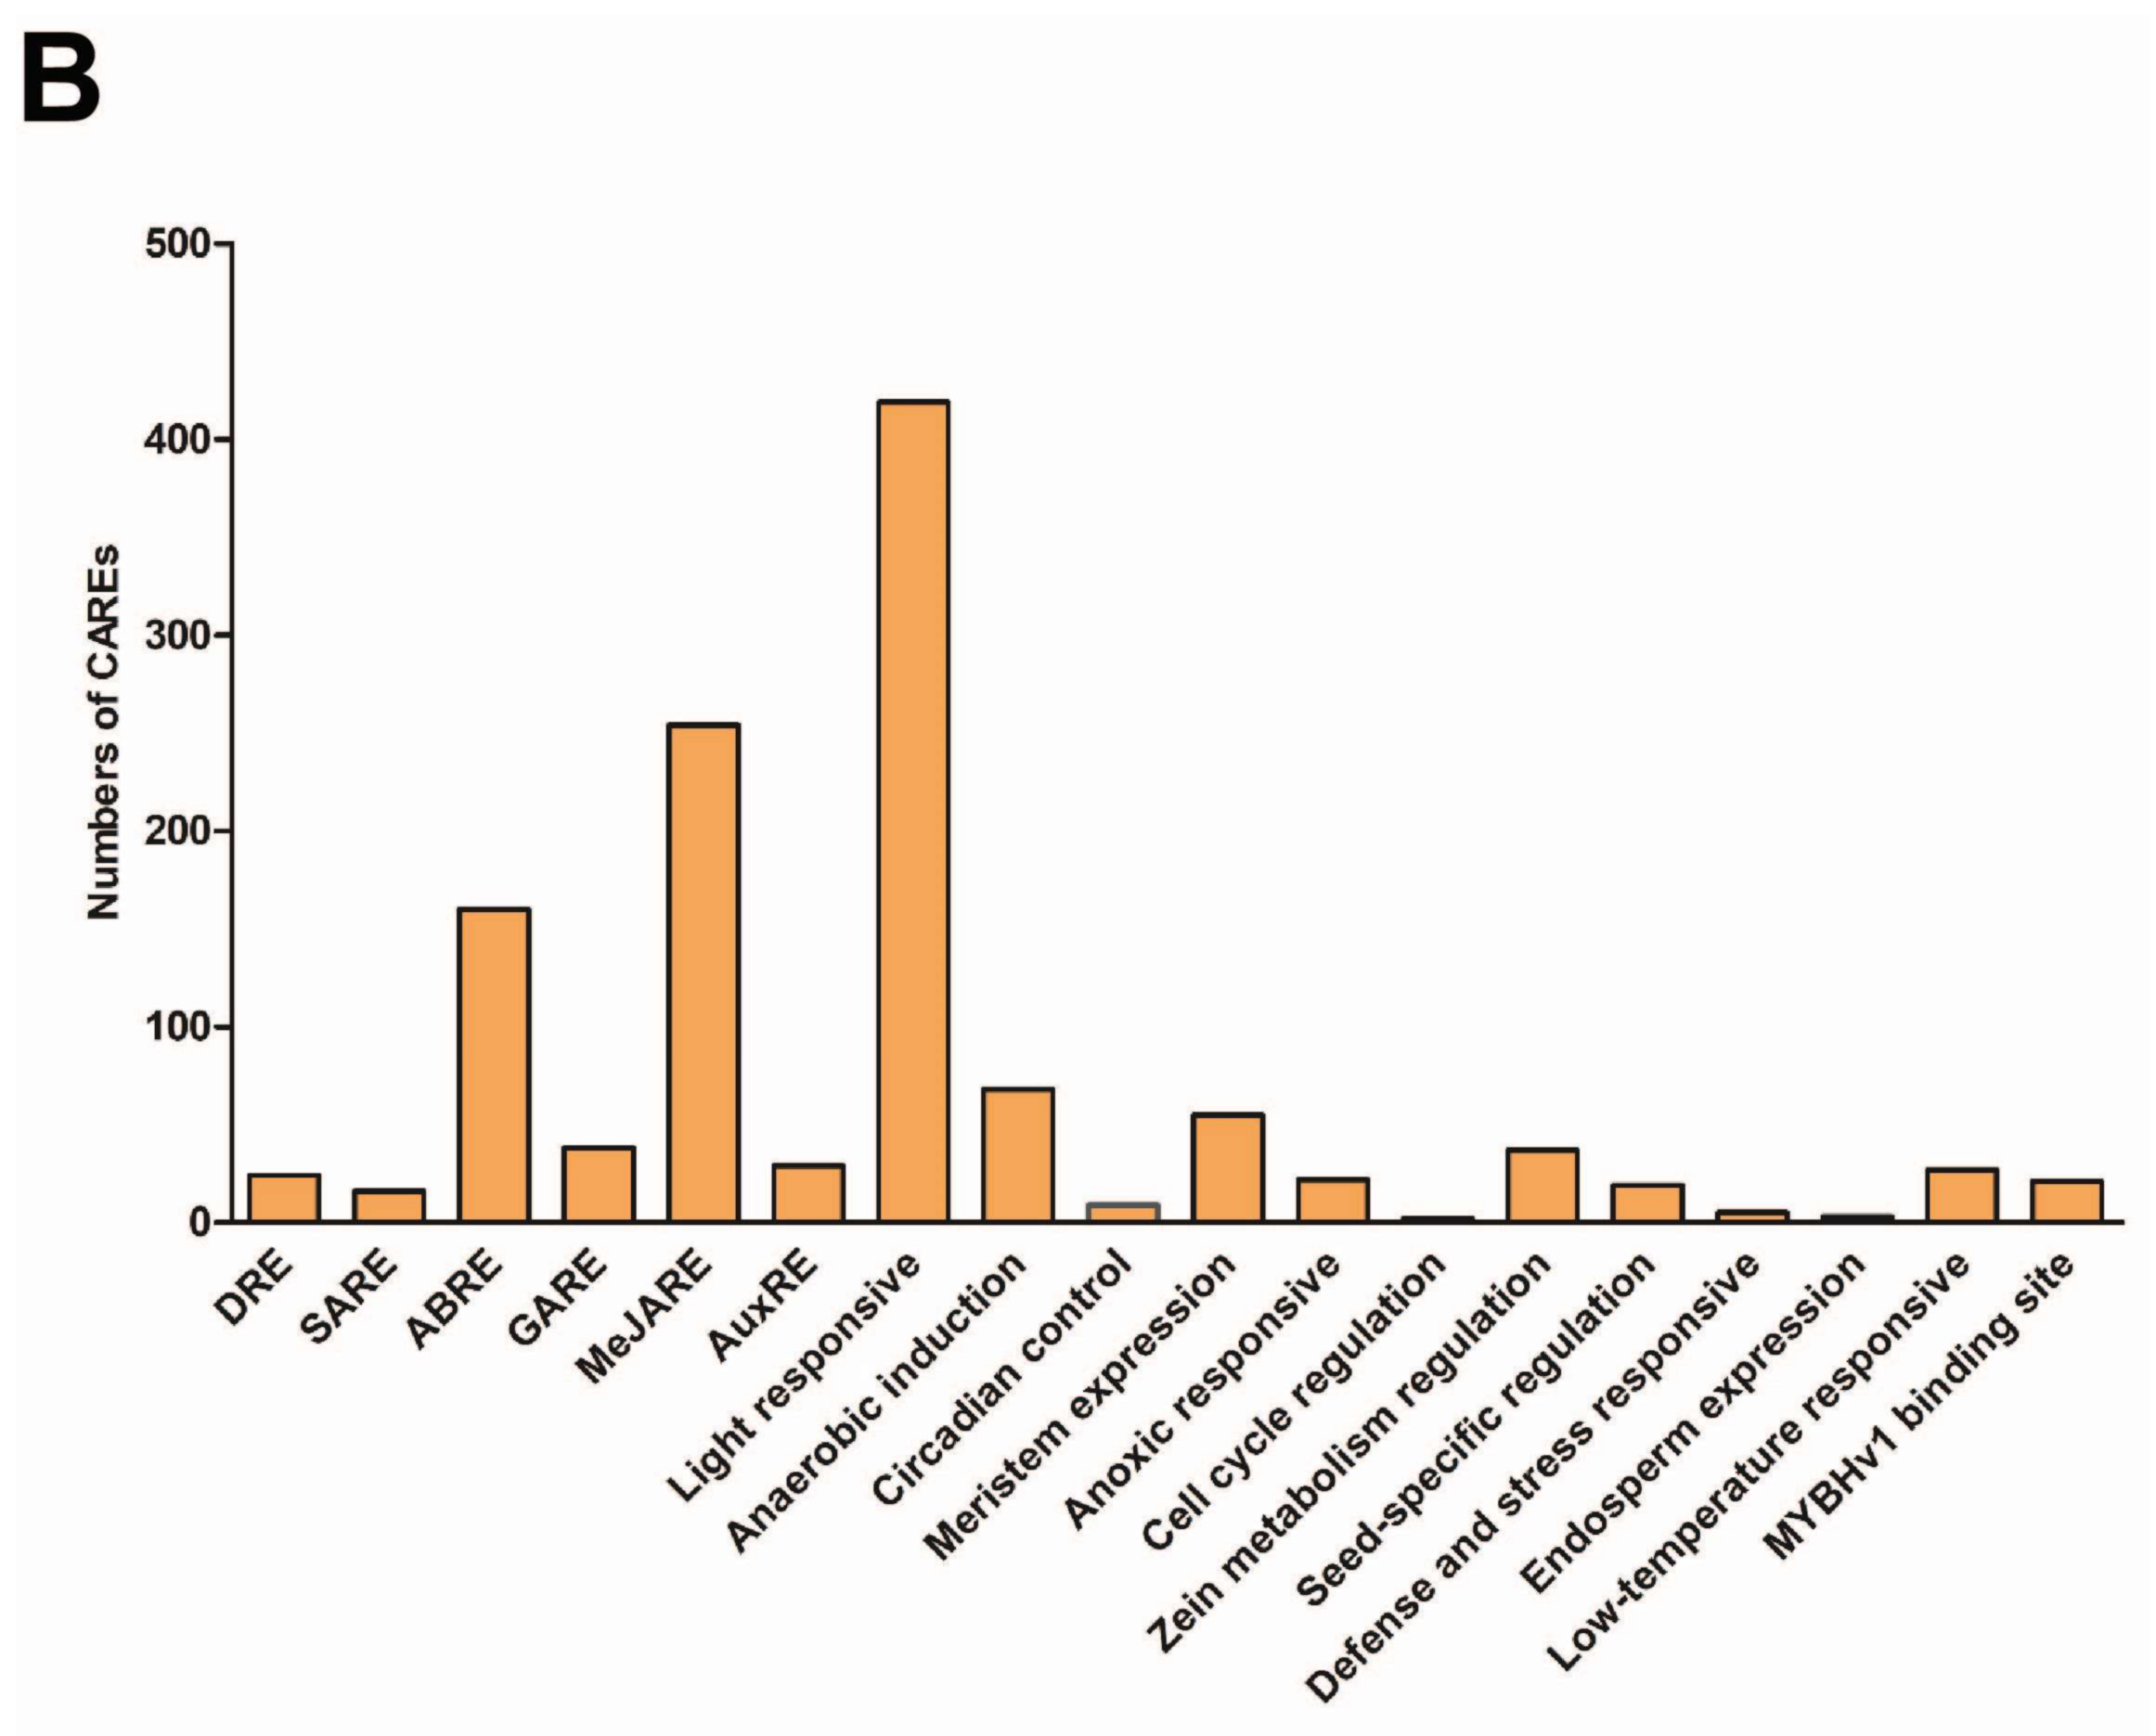
2.5. Putative Cis-acting Regulatory Elements (CAREs) Analysis of TaPIN Genes

To further understand the potential regulatory mechanism of TaPIN genes, and how these genes are regulated by phytohormone, various defense, and stress-responsive elements, the PlantCARE webserver was employed to find out putative cis-elements in the 2000 bp promoter region of TaPINs. A total of 18 unique CAREs were identified in the TaPIN gene family, including elements related to light responses, methyl jasmonate (MeJA), abscisic acid response, auxin response, salicylic acid response, defense, and stress responses (Figure 7A and Table S5). CAREs involved in light, MeJA, auxin, and abscisic acid responses were the most prevalent ones in the TaPIN gene family (Figure 7B). This suggests that TaPINs play an essential role in plant growth and developmental processes. Further, light-responsive CAREs were also abundant in the TaPIN gene family. These CAREs have been implicated in photosynthesis/non-photosynthesis-based light responses and circadian rhythm-mediated light responses.
TaPINs also had CAREs related to meristem expression and seed-specific regulation. The CAREs present in the TaPIN gene family suggest that they have been involved in diverse developmental processes that can be regulated by hormones, light, and various developmental stages. The presence of multiple putative CAREs in the TaPIN promoters indicates that these genes might be involved in a wide range of biological processes. Thus, these data provide valuable insights to understand the TaPIN gene family’s response to different stress, phytohormone, and other developmental processes.

2.6. Gene Ontology (GO) Enrichment of TaPIN Genes

Gene ontology helps to understand the function of genes by examining their similarity with other species’ genes of known function. All TaPINs were effectively annotated and assigned GO terms using AgriGO (Figure S8 and Table S6). TaPINs were also annotated using eggNOG-Mapper for further confirmation (Table S7), which returned similar results to AgriGO. In the biological process category, TaPIN genes are enriched in the signaling (GO:0023052) and meristem maintenance (GO:0010073) categories (Figure S8A). In the cellular component category, TaPINs showed enrichment in the membrane (GO:0016020) (Figure S8B). The prediction of subcellular localization was carried out by CELLO, and BUSCO (Table 1) also returned similar results. In the molecular function category, transporter activity (GO:0005215) was the most enriched category mainly involved in auxin transport activity (Figure S8C). Apart from signaling and meristem maintenance, the GO term enrichment also indicated multiple roles of TaPIN genes, including transport of auxin, ions, response to gravity, endogenous stimuli, tropism, embryonic specification pattern, axis specification, leaf formation, floral organ development, determination of bilateral symmetry, immune responses, and metabolism. Therefore, these results suggest that TaPIN genes play a crucial role in plant developmental processes.

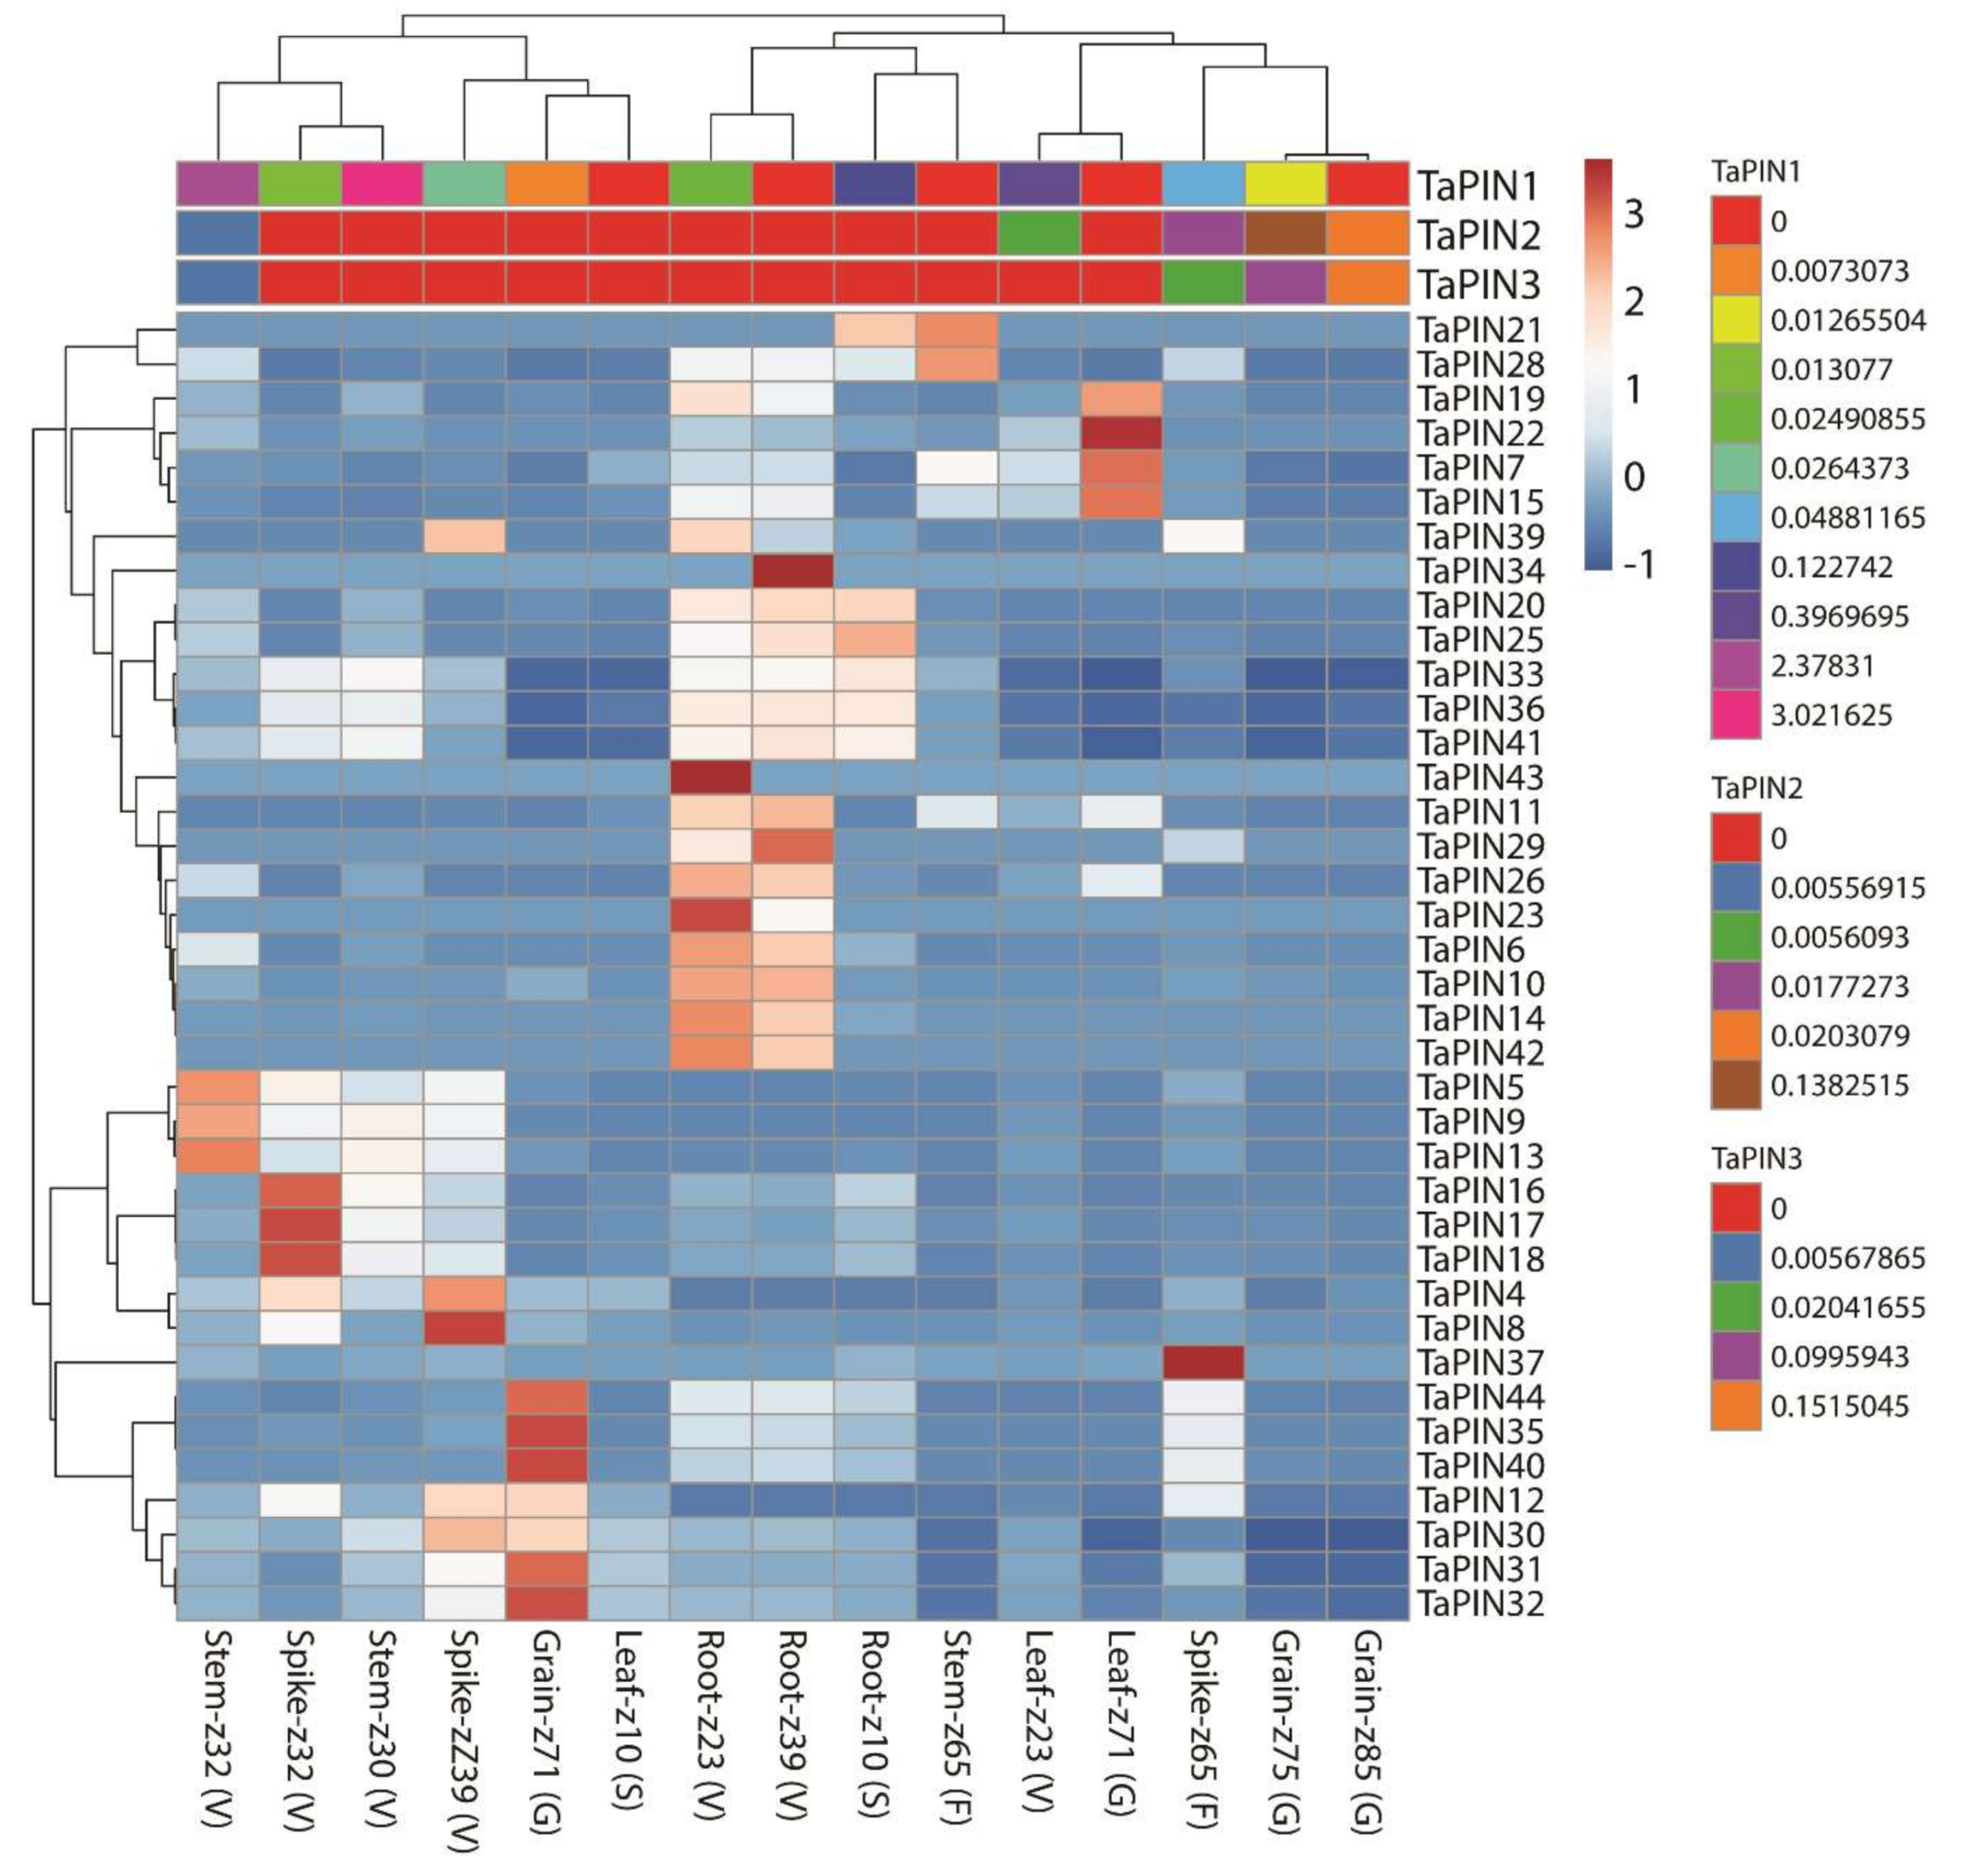
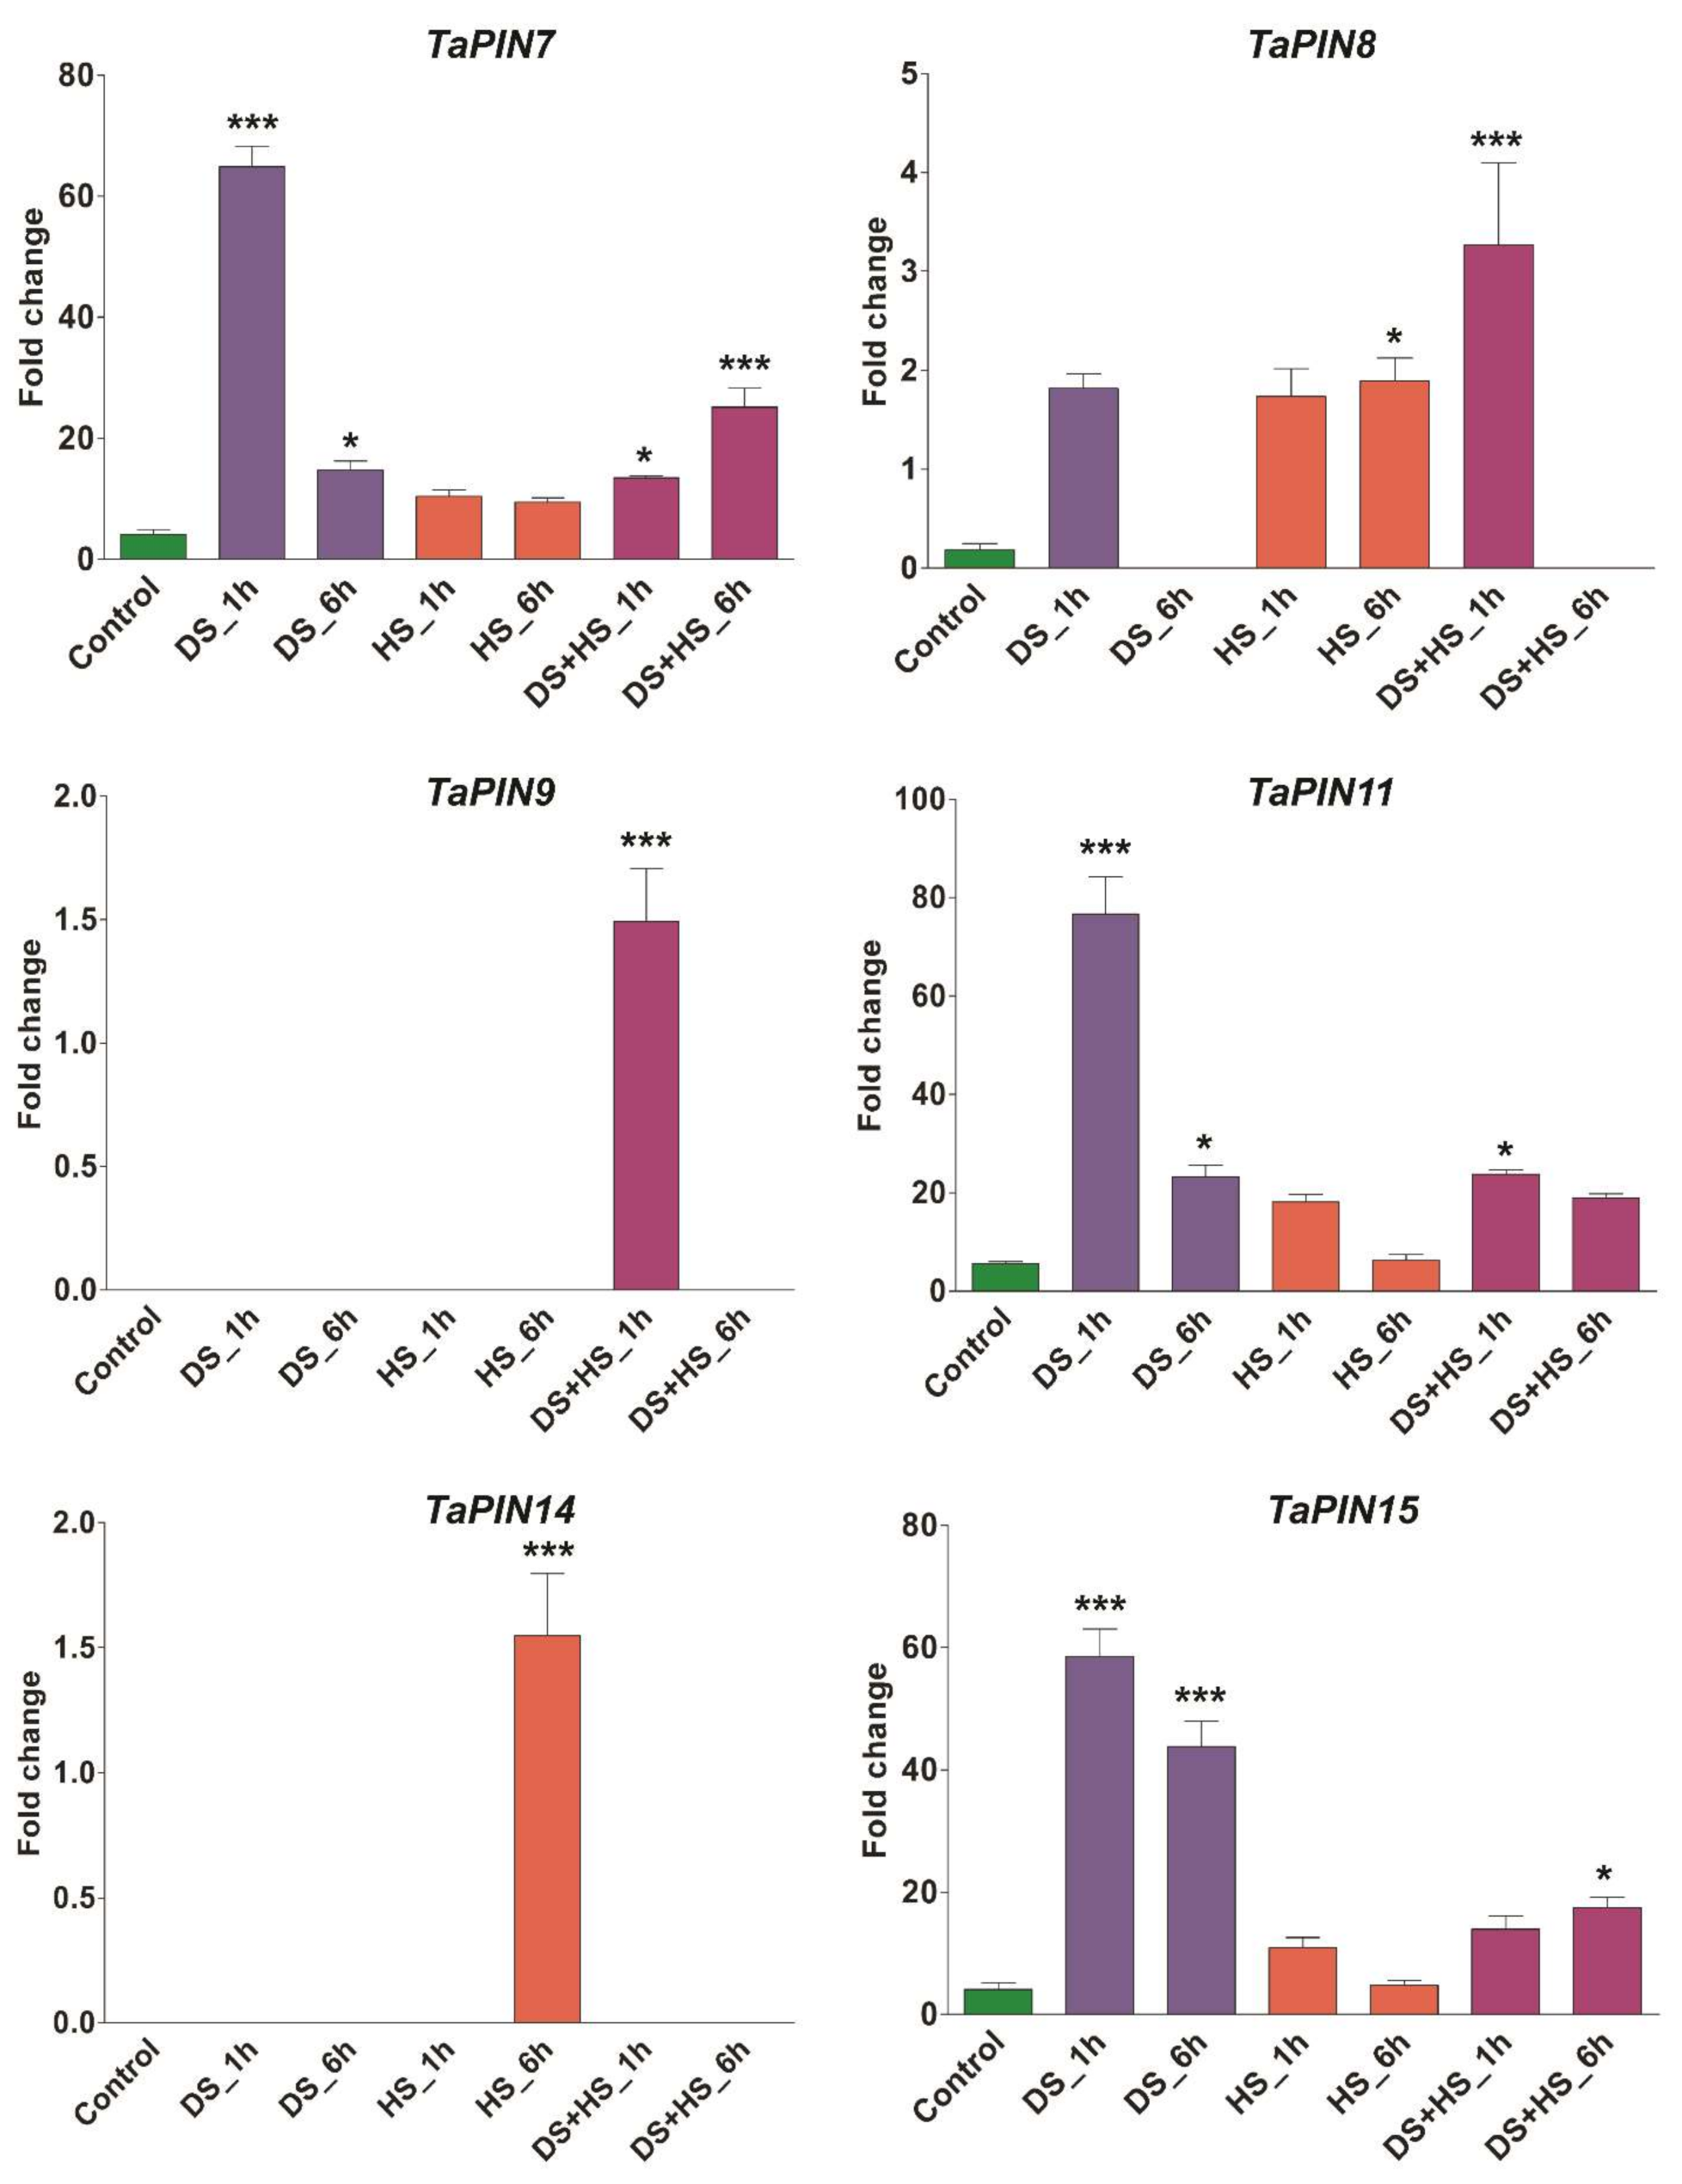
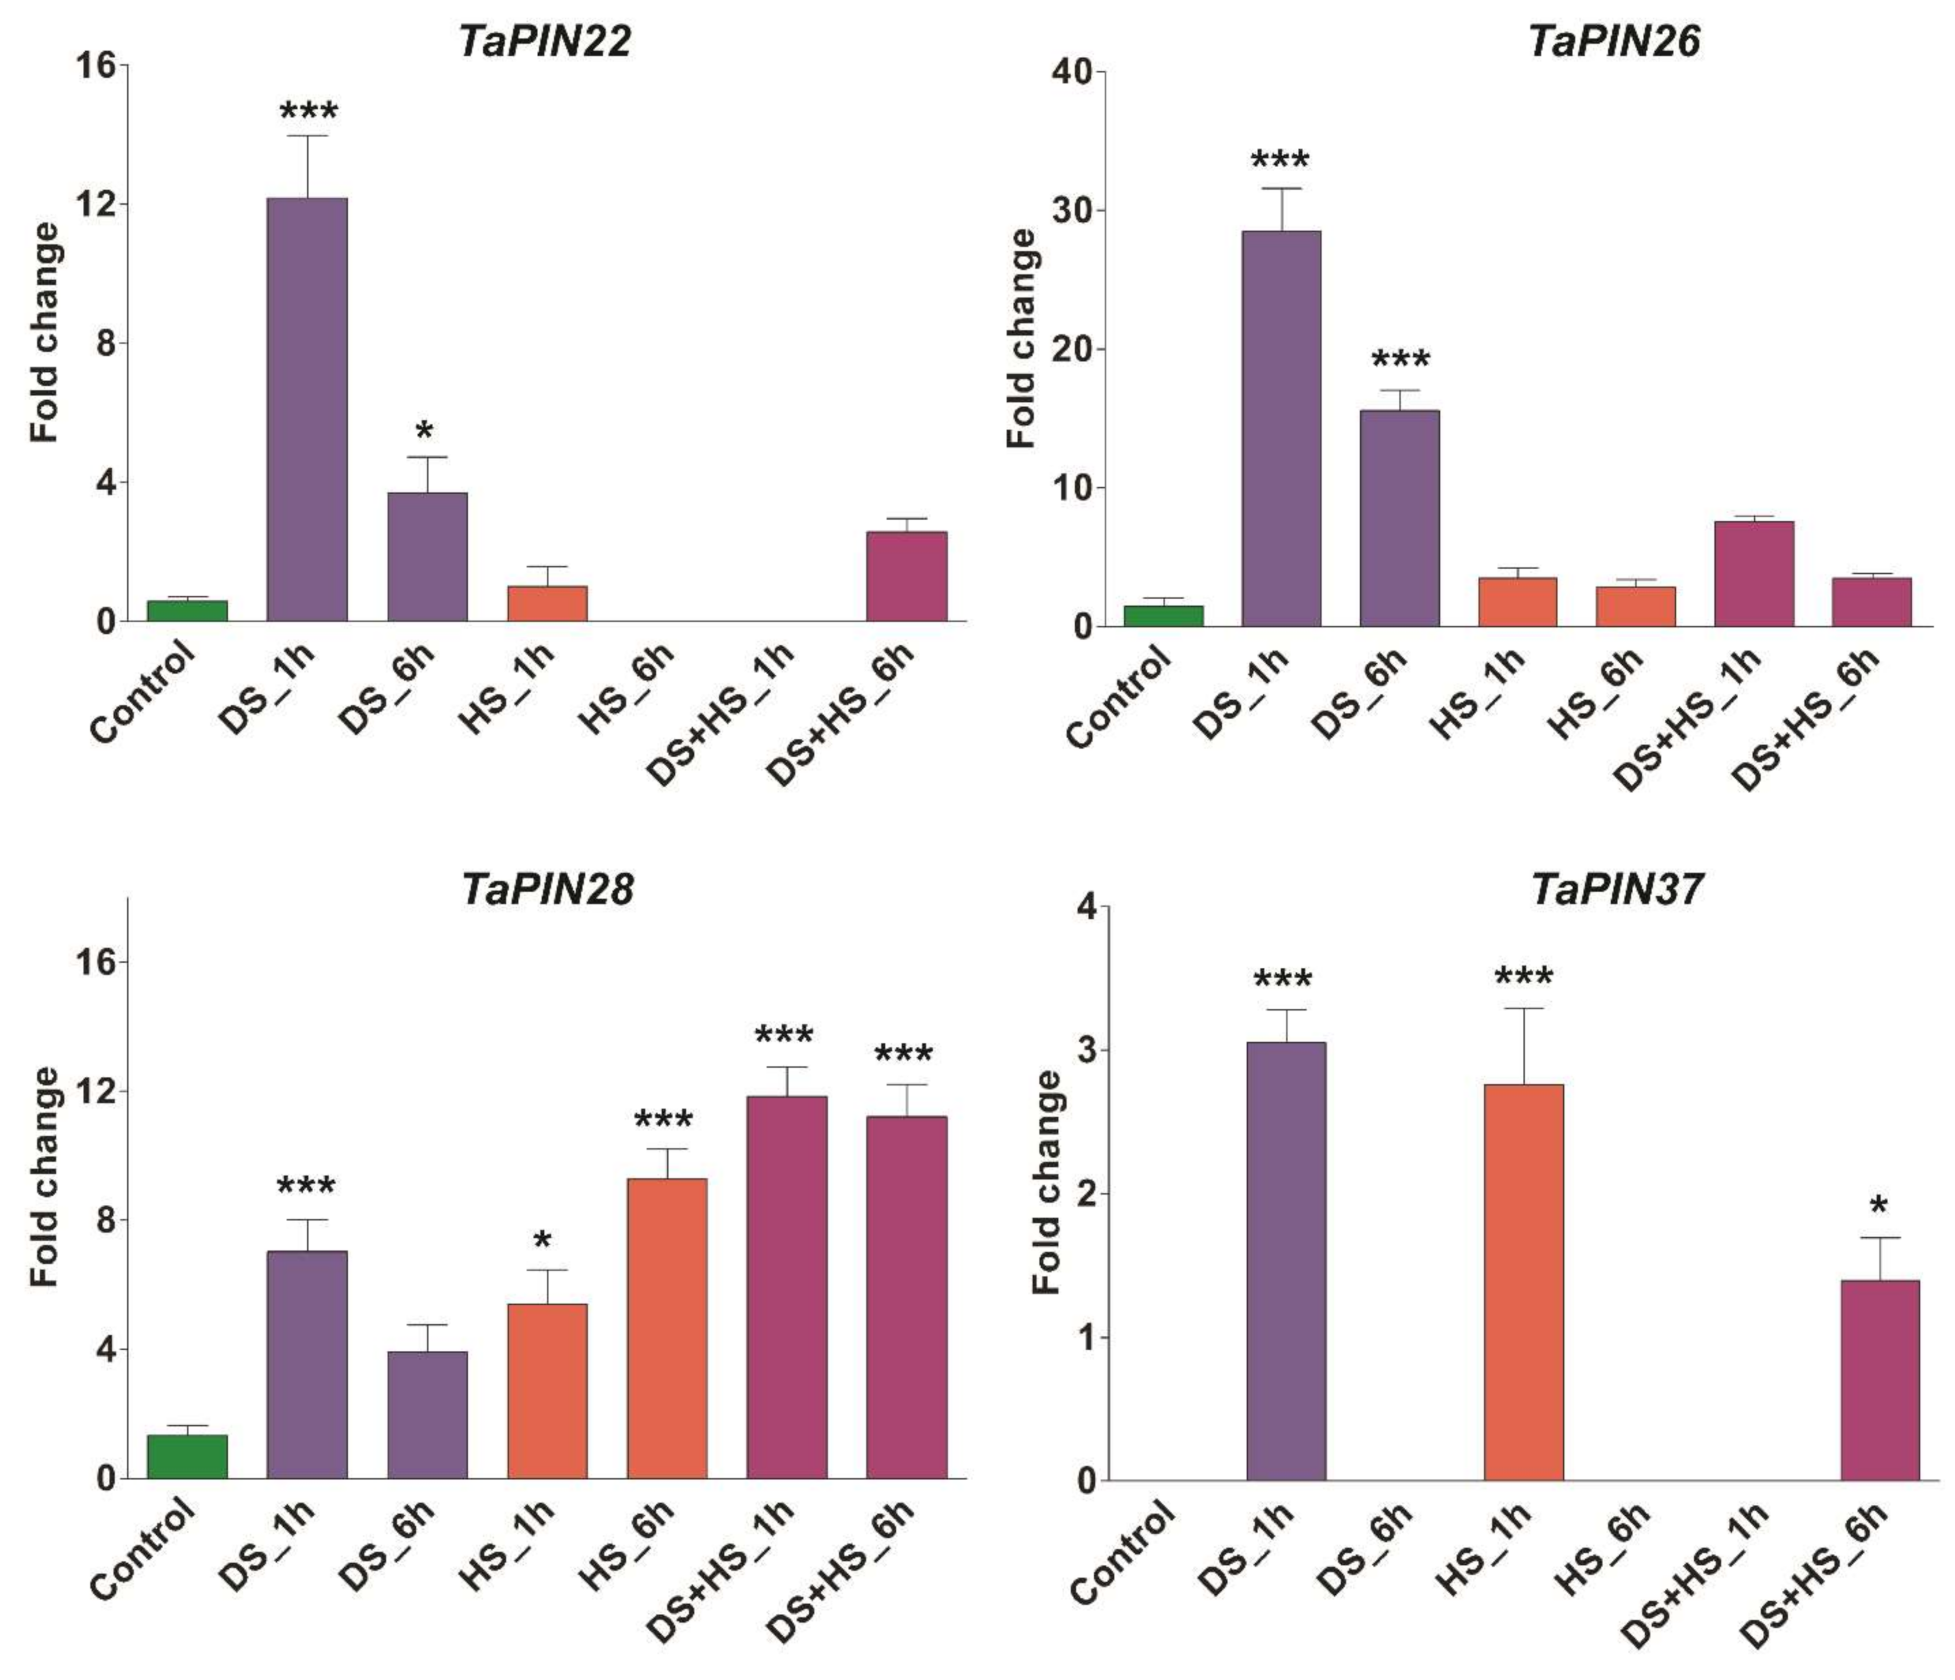
2.7. Expression Profiling of TaPIN Genes under Various Stress Conditions and Developmental Stages

To understand the expression pattern of TaPIN genes in various development stages and different stress conditions, we retrieved transcripts per million (TPM) values of all TaPINs from the wheat expression database. These TPM values were used to produce the principal component analysis (PCA) plot and heatmaps (Figure 8 and Figure 9). Five different tissues from the three different developmental time points were taken to determine the expression profiling of TaPINs in this study. The time points are represented on the Zadoks scale. Different TaPIN genes exhibited differential induction in the different tissues; for instance, TaPIN4, TaPIN8, TaPIN12, TaPIN30 and TaPIN39 displayed induction at the spike z39 stage, while TaPIN16, TaPIN17, TaPIN18 and TaPIN37 displayed induction at the spike z32 and spike z65 stages, respectively (Figure 8). The expression of TaPIN6, TaPIN10, TaPIN11, TaPIN14, TaPIN19, TaPIN23, TaPIN26, TaPIN39, TaPIN42 and TaPIN43 was elevated in roots at the z23 stage. TaPIN6, TaPIN10, TaPIN11, TaPIN14, TaPIN26, TaPIN29, TaPIN34 and TaPIN42 were also up-regulated in roots at the z39 stage. TaPIN7, TaPIN15, TaPIN19 and TaPIN22 showed induction at the leaf z71 stage.
In addition, TaPIN31, TaPIN32, TaPIN35, TaPIN40 and TaPIN44 expression was raised at the grain z71 stage. TaPIN5, TaPIN9, TaPIN13, TaPIN21 and TaPIN28 showed higher expression at stem z32 and z65 stages. These results demonstrate that different TaPINs might participate in the development of different tissues at different stages.
Expression profiling of TaPINs was also examined under three different stress conditions such as biotic (Septoria tritici blotch and powdery mildew) and abiotic stress (drought and heat stress). Several members of the TaPIN family were observed to be induced during biotic and abiotic stress (Figure S10). TaPIN5, TaPIN6 and TaPIN10 were highly induced upon Septoria infection, while the expression of TaPIN13, TaPIN18, TaPIN19, TaPIN20, TaPIN25, TaPIN35 and TaPIN44 was significantly elevated during powdery mildew infection. In the case of abiotic stress, the data indicate that the expression of some members of the TaPIN family such as TaPIN7, TaPIN11, TaPIN15, TaPIN22 and TaPIN26 was induced during the initial hours of drought stress. It seems that the TaPIN family is not involved in heat stress during the initial and late hours; only two TaPIN genes named TaPIN37 (1 h) and TaPIN14 (6 h) were induced during heat stress. However, the TaPIN8, TaPIN9 and TaPIN28 genes were up-regulated during the combined heat and drought stress (Figure S10). Expression patterns of some selected TaPIN genes were also verified by qRT-PCR. The qRT-PCR results show almost similar expression trends with slight variation (Figure 9). Overall, the expression pattern was consistent across the two different approaches. Collectively, these results demonstrate that TaPIN family members were involved in the response to drought and heat stress.

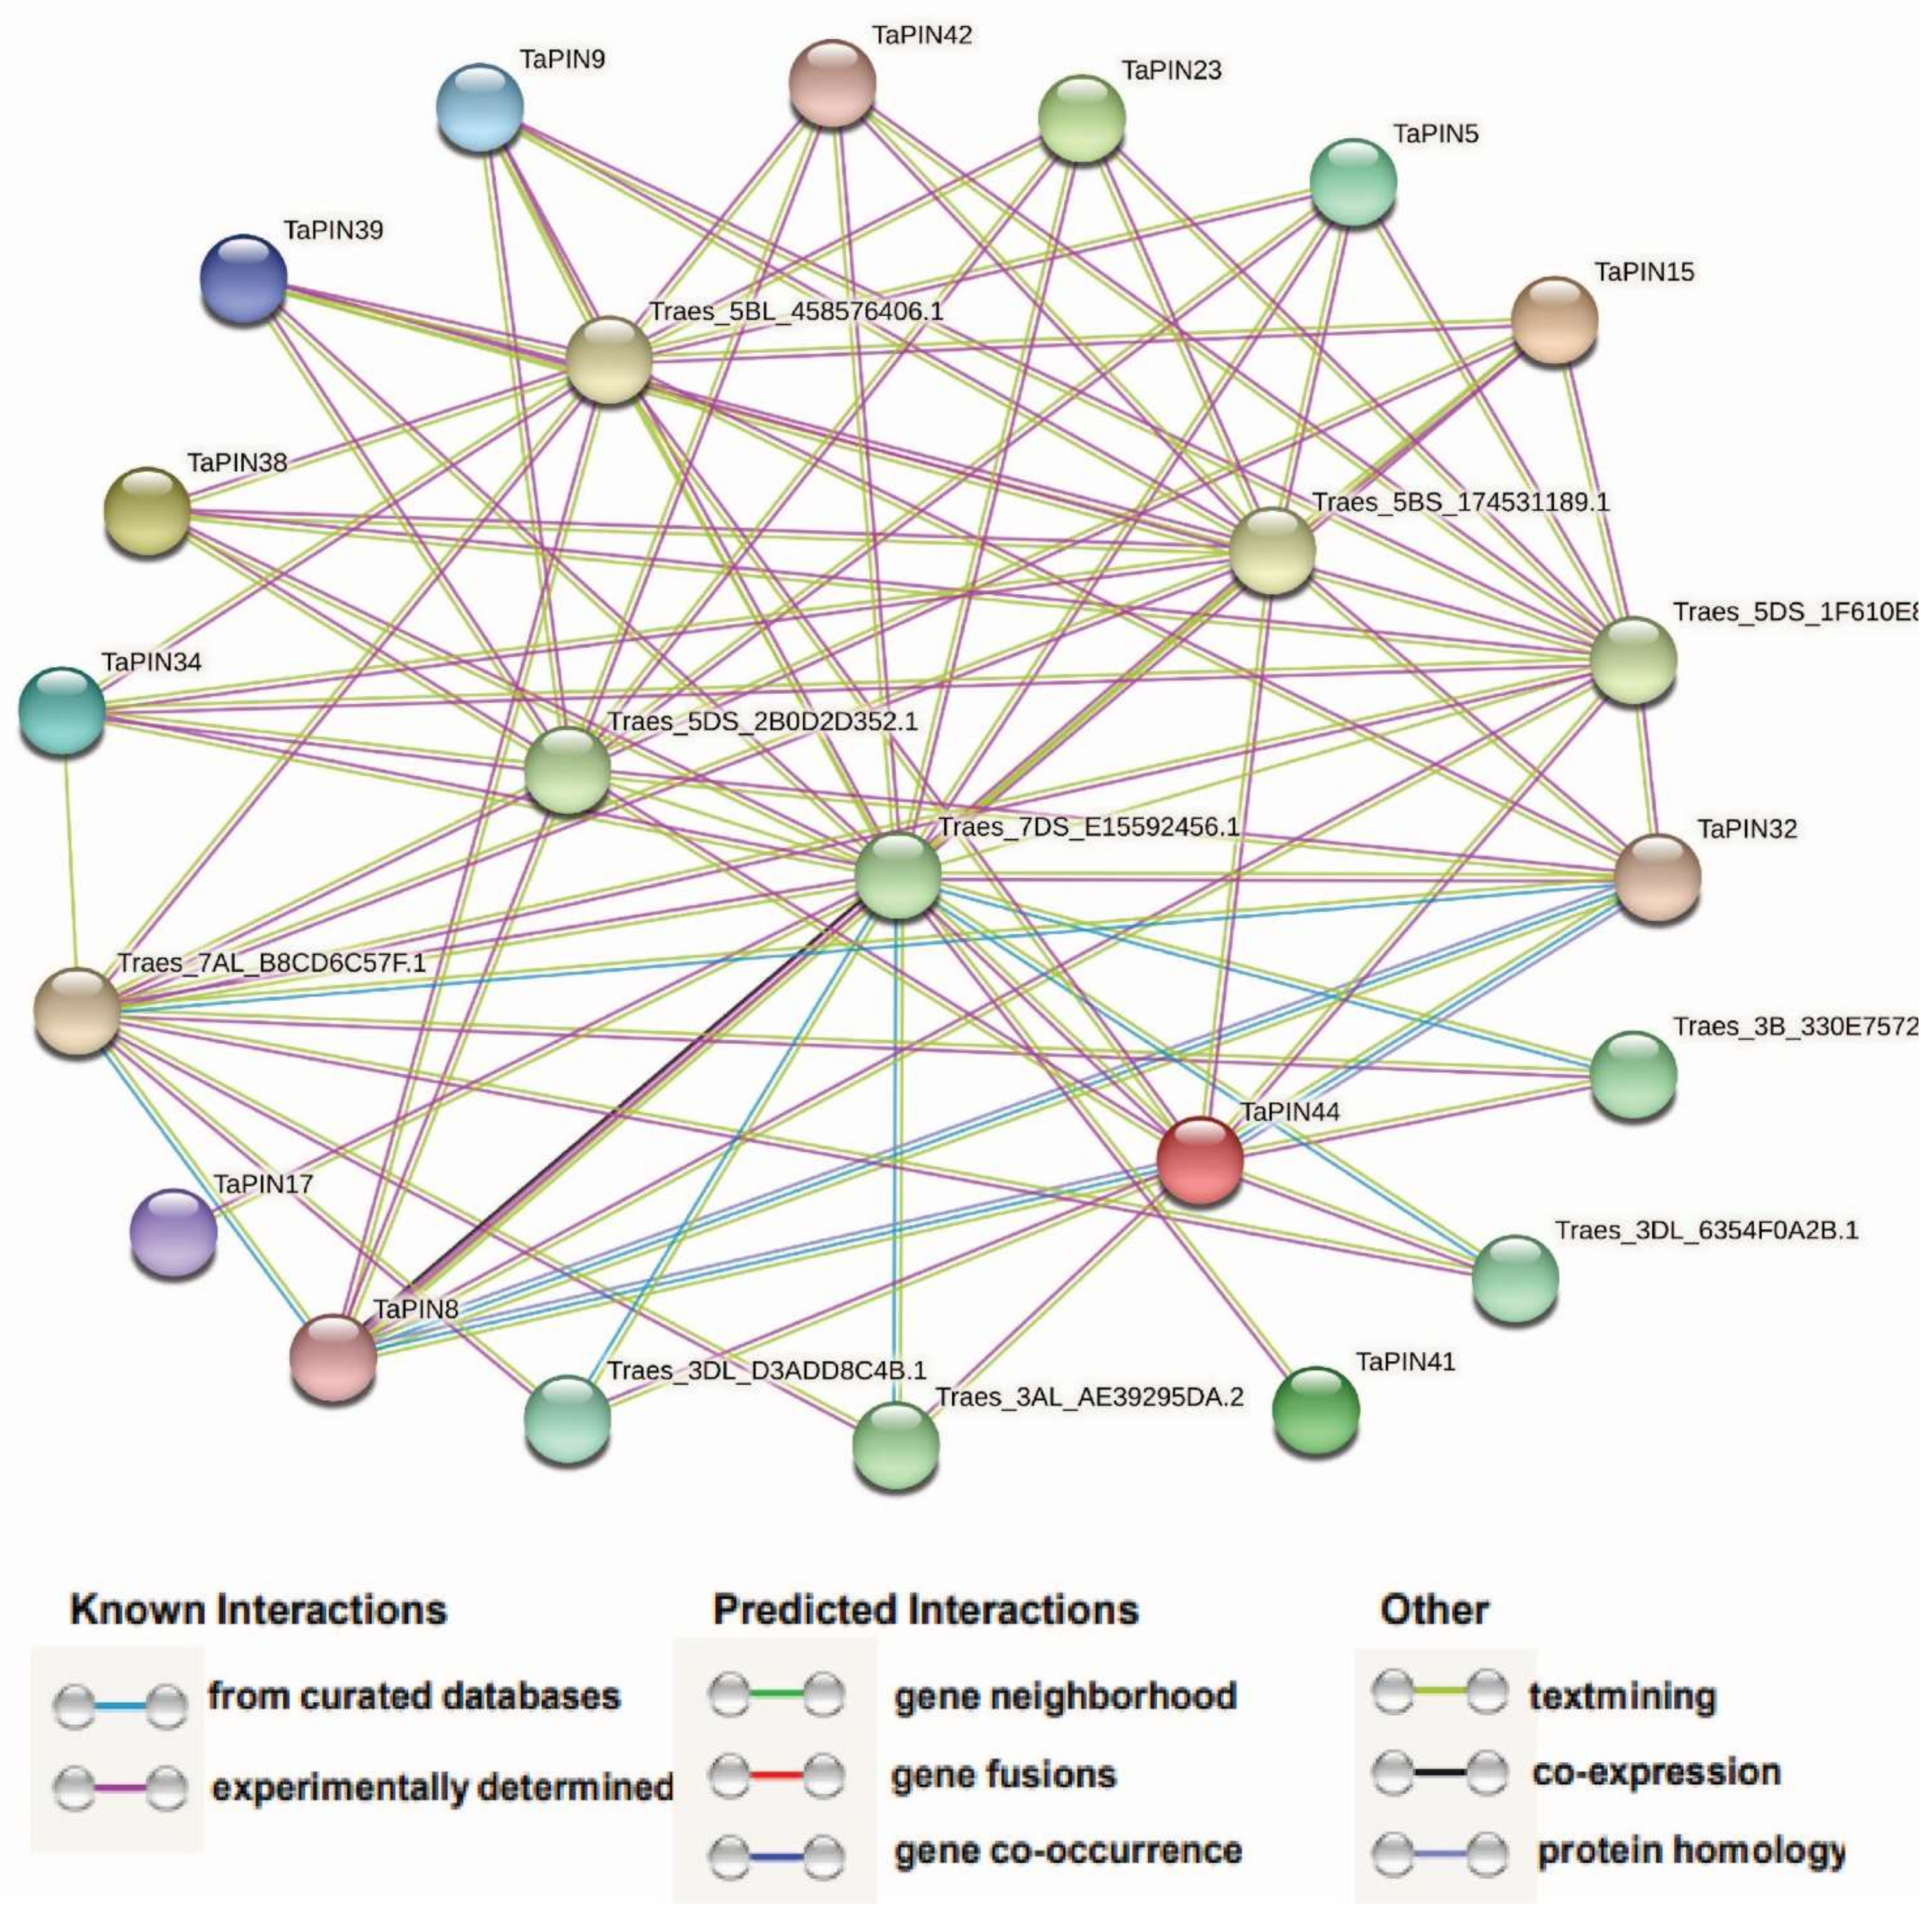
2.8. Protein–Protein Network Analysis of the TaPIN Family Genes

A network was constructed using the STRING database to investigate protein–protein interactions between TaPINs and other wheat proteins (Figure 10 and Table S8).
According to the predicted results, we identified thirteen TaPINs interacting with ten different T. aestivum proteins. TaPIN32 can interact with TaPIN8, TaPIN44, and six other T. aestivum proteins (Traes_5BL_458576406.1, Traes_5BS_174531189.1, Traes_5DS_1F610E80B.1, Traes_5DS_2B0D2D352.1, Traes_7DS_E15592456.1 and Traes_7AL_B8CD6C57F.1), which were ribosomal protein S6 kinase and protein kinase PINOID, a positive regulator of polar auxin transport through changes in the phosphorylation status of PIN proteins. Meanwhile, TaPIN44 can interact with TaPIN8 and nine other T. aestivum proteins (Traes_3AL_AE39295DA.2, Traes_3B_330E75723.1, Traes_3DL_6354F0A2B.1, Traes_3DL_D3ADD8C4B.1, Traes_5BL_458576406.1, Traes_5BS_174531189.1, Traes_5DS_1F610E80B.1, Traes_5DS_2B0D2D352.1 and Traes_7DS_E15592456.1), which were sorting nexin (SNX), ribosomal protein S6 kinase, protein kinase PINOID, and ABC transporter proteins. The sorting nexin (SNX) comprises a large group of proteins that are localized in the cytoplasm, which regulate intracellular trafficking through the lipid binding domain and protein–protein interactions with membrane-associated protein complexes. These results provided valuable information for the further functional characterization of TaPIN genes.

3. Discussion

3.1. Identification and Evolution of TaPIN Gene Family in Wheat

PINs are plant-specific transmembrane proteins involved in polar auxin transport [4,25,26,34]. PIN family proteins regulate multiple developmental processes, including morphogenesis, embryogenesis, organogenesis, and environmental stimuli [14,22,34,36,53,69,70]. PIN gene family members have been reported in several plant species [44,45,47,48,51,52,53]; however, to the best of our knowledge, this is the first time we identified the PIN genes in the wheat genome. Several studies demonstrated that PIN genes also existed in primitive land plants and expanded over the time of evolution [35,43]—a total of 44 TaPIN genes identified in the wheat genome (Table 1). The phylogenetic analysis revealed that the TaPIN gene family could be classified into seven groups or subfamilies. The phylogenetic analysis showed that the long or canonical PINs were clustered into groups I and II, while short or noncanonical PINs clustered into groups III, V, and VI, and groups IV, VI, and VII consisted of monocot-specific TaPINs (Figure 1). These genes possibly have the monocot-specific functions that might impact physiological and morphological establishment, such as phyllotaxy or development of the unique root system [71], although TaPIN genes were well allocated into the known group of Arabidopsis and rice PINs, suggesting that TaPINs might originate from a common ancestor. Further, the majority of the TaPINs exhibited orthologous relationships with Arabidopsis and rice PINs. The phylogenetic tree also showed that all groups have an expanded number of members (Figure 1), indicating that duplications of these TaPINS occurred during evolution.
Interestingly, none of the TaPIN family members were found with AtPIN6. Similar results were reported in rice and maize [45,47]. Thus, these results demonstrate that the short or noncanonical PINs evolved independently from the long or canonical PINs [43]. The overall evolution pattern showed lineage-specific expansion of the TaPIN gene family through the partial modification of the genome that might reinforce the adaption to internal and external stimuli [72,73].
The wheat PIN gene family is extensively expanded and had relatively more PINs compared to the previously reported PINs in A. thaliana, O. sativa, Z. mays, G. max and N. tabacum [36,47,49,51,74]. The gene duplication processes, including segmental, tandem, and whole-genome duplications, are the main driving forces for expanding the gene family in different plant species [75,76]. Chromosomal mapping of TaPIN genes revealed that the 44 TaPINs were not uniformly distributed on 21 chromosomes (Figure 2A,C). The gene number on each chromosome varied from one to five, with chromosomes 1A, 1B, 1D, 4A, 4B, 4D, 6A, 6B and 6D having a single gene, while chromosome 7A had three genes, chromosomes 3A, 3B, 3D, 5A, 5B, 5D and 7D contained four genes, and chromosome 7B had five genes. Gene duplication analysis showed 15 pairs of duplicated genes which shared high nucleotide sequence similarity. The duplicated pairs are TaPIN25:TaPIN28, TaPIN24:TaPIN27, TaPIN21:TaPIN29, TaPIN22:TaPIN26, TaPIN34:TaPIN42, TaPIN7:TaPIN15, TaPIN9:TaPIN13, TaPIN6:TaPIN10, TaPIN37:TaPIN38, TaPIN39:TaPIN43, TaPIN1:TaPIN2, TaPIN8:TaPIN12, TaPIN17:TaPIN18, TaPIN30:TaPIN32 and TaPIN36:TaPIN41. Further, the Ka/Ks ratios of 15 gene pairs were less than 1, revealing that TaPIN genes underwent a strong purifying selection pressure (Figure S4 and Table S2). The expansion of the TaPIN gene family might be due to the natural whole-genome duplication events. OsPIN1a-1d and three OsPIN5 are the results of segmental duplications in rice [47]. Gene duplication events were also reported in the three maize PINs, such as ZmPIN1a-1c [74]. Our gene duplication analysis revealed that the TaPIN gene duplication events were similar, as previously described in rice and maize. Therefore, these results demonstrate that whole-genome duplication and segmental duplications might play an important role in expanding and evolving the TaPIN genes.
To examine the synteny relationships of PIN genes in wheat and different plant species, we identified 31, 38, 68, 40 and 36 orthologous gene pairs between TaPINs with other PIN genes in Ae. tauschii, B. distachyon, T. dicoccoides, O. sativa and A. thaliana, respectively (Figure 3 and Table S3). In addition, B. distachyon, (BB, diploid) and Ae. tauschii (DD, diploid) were the natural foundations of the B and D subgenomes of hexaploid wheat. The synteny relationship revealed that eleven orthologous gene pairs between Ae. tauschii and a wheat D subgenome were located on the same chromosomes, with one on 1D, four on 3D, one on 4D, one on 5D, and four on 7D (Figure 3 and Table S3). Further, twenty-four orthologous gene pairs between T. dicoccoides and a wheat AABB subgenome were located on the same chromosomes, with one on 1A, four on 3A, one on 4A, two on 5A, one on 6A, two on 7A, one on 1B, four on 3B, one on 4B, two on 5B, one on 6B, and four on 7B (Figure 3 and Table S3). These results indicate that these PIN genes might be derived from Ae. tauschii and T. dicoccoides orthologous genes during hybridization events. Additionally, more orthologous gene pairs were identified between wheat and O. sativa and A. thaliana, which showed that TaPIN and other PIN genes in these plant species might have originated from a common ancestor during the evolutionary process.
The gene structure analysis of TaPINs demonstrated that the gene structure is highly conserved for most of the TaPIN genes. Twenty-three out of fourty-four TaPIN genes contain two exons (Figure 4). TaPIN14, TaPIN31 and TaPIN35 contain four exons, while TaPIN1, TaPIN2, TaPIN3, TaPIN4, TaPIN18, TaPIN26, TaPIN36 and TaPIN37 had three exons, and TaPIN5, TaPIN7, TaPIN9, TaPIN12, TaPIN13, TaPIN22, TaPIN42 and TaPIN43 had only a single exon. Intron size is a crucial factor that influences the gene size; for instance, the remarkable difference in gene size observed between the biggest gene TaPIN35 (2.8 kb) and the smallest gene TaPIN24 (1.1 kb) was due to the difference in the total intron length (1.1 kb vs. 0.1 kb). This conserved exon/intron organization of PIN genes was also found in other plant species [34,47,52,74,77]. In order to elucidate structural comparisons among TaPIN proteins, we identified the ten conversed motifs (Figure 5A,B). Conserved motif analysis also revealed two distinct types of motif compositions observed among the TaPIN proteins. We found that seven motifs were common in all the TaPIN proteins (Motif 1-7). Bennett et al. [43] classified the Arabidopsis PIN proteins into two groups: long or canonical PINs (AtPIN1-4 and AtPIN6-7) and short or noncanonical PINs (AtPIN5, AtPIN8). The TaPIN gene family consists of 18 members from long or canonical PINs (AtPIN1-4), including TaPIN1, TaPIN2, TaPIN3, TaPIN4, TaPIN8, TaPIN12, TaPIN16, TaPIN17, TaPIN18, TaPIN30, TaPIN31, TaPIN32, TaPIN33, TaPIN35, TaPIN36, TaPIN40, TaPIN41 and TaPIN44 (166 to 515 amino acids), while the short or noncanonical PINs comprise 26 members from groups AtPIN5 and AtPIN8 (168–256 amino acids). Further, TaPIN proteins share two highly conserved hydrophobic regions located at the N- and C-terminal and connected by a central hydrophilic loop (Figure S6). All TaPIN proteins have 8–10 transmembrane domains except for TaPIN43, which had only 5. In addition, multiple sequence alignment of TaPIN proteins also displayed conserved amino and carboxy-terminal regions of transmembrane segments with a variable central hydrophilic region (Figure S7). The length of the central hydrophilic region was approximately 350 amino acids for the long or canonical PIN members and 40–100 amino acids for the short or noncanonical PIN members. Thus, these results indicate that with the divergence of monocot and dicot plants, there had been significant changes in the number and the structure of PINs. Determination of the subcellular localization of TaPIN proteins will help understand the molecular function. Most of the TaPIN proteins were predicted to be located on the plasma membrane (Table 1). The plasma membrane-localized long PINs are involved in polar auxin transport, while ER-localized short PINs regulate intracellular auxin homeostasis [2,22,35,38]. Therefore, these results also suggest that PIN genes in wheat could have a similar function.

3.2. Expression Profiling of TaPIN Genes in Various Tissues and Developmental Stages Indicating Their Role in Plant Growth and Development

The cis-acting regulatory element is a non-coding DNA sequence that exists in the promoter region of genes. The distribution of different CAREs in promoter regions may reveal differences in the regulation and function of genes [78]. The identified CAREs elements in this study were classified into three main categories: phytohormone response, related to stress response, and growth and development (Figure 7). More than 10 CAREs were identified in the promoter region of each TaPIN (Table S5). A total of 19 cis-elements related to light response were detected, such as ATCT motif, Box 4, and AE-box (part of a conserved DNA module involved in light responsiveness), Box II, TCT-motif, GTGGC-motif, Gap-box, I-box, chs-CMA1a, chs-CMA2a, L-box, GATA-motif, and TCCC-motif (part of a light-responsive element), ACE and G-Box (cis-acting elements involved in light responsiveness), and Sp1, MRE, GT1-motif, and 3-AF1 binding site (light-responsive elements) [79,80]. We also predicted six cis-elements related to growth and development including CAT-box (meristem expression), RY-element (seed-specific regulation), CAAAGATATC-motif (circadian control), GCN4-motif (endosperm expression), MSA-like (cell cycle regulation), and O2-site (zein metabolism regulation) [81,82]. Further, we also examined the CARE related to hormone response in the promoter of TaPIN genes. ABRE is a cis-acting element involved in abscisic acid responsiveness, and the differential expression of PIN genes upon ABA treatment was shown in different plants [44,49,52,74]. The ABRE cis-elements were predicted in most TaPIN genes except TaPIN1, TaPIN2, TaPIN3, TaPIN5, TaPIN9, TaPIN13 and TaPIN26. Subsequently, we also found some other hormone-related cis-elements such as TCA-element (salicylic acid responsiveness), P-box and TATC-box (gibberellin-responsive element), CGTCA-motif (MeJA responsiveness), TGA-element, and AuxRR-core (auxin-responsive element) [83]. Moreover, other cis-elements have been implicated in diverse stress conditions, including MBS (drought inducibility), LTR (low-temperature responsiveness), and TC-rich repeats (defense and stress responsiveness), which were also predicted in the TaPIN promoters. Previous studies have shown that soybean PIN genes were differentially expressed upon ABA and auxin treatments [49]. The majority of the cotton PIN genes were responsive to auxin and salicylic acid in shoots and roots [44]. Similarly, all maize auxin transporter genes were also identified to be IAA-responsive and also showed different expression levels in diverse abiotic stresses [84]. Collectively, these results demonstrate that PIN gene family members in wheat might be regulated by a wide range of developmental processes, various hormones, and stress; of course, this needs to be confirmed in the future by experimental studies. These data will provide valuable insights to understand the TaPIN gene family in response to phytohormones, stress, and growth and development. Furthermore, the application of genome editing technology might lead to better understanding the function of TaPIN genes.
Several studies have demonstrated the role of PIN proteins in numerous developmental processes and in response to environmental stimuli [2,4,6,10,22,34,43]. Expression profiling of the TaPIN gene family revealed that TaPIN expression was observed in different tissues such as TaPIN6, TaPIN10, TaPIN11, TaPIN14, TaPIN19, TaPIN23, TaPIN26, TaPIN29, TaPIN34, TaPIN39, TaPIN42 and TaPIN43, which were elevated in roots (Figure 8). TaPIN4, TaPIN8, TaPIN12, TaPIN16, TaPIN17, TaPIN18, TaPIN30, TaPIN37 and TaPIN39 were highly expressed in the spike. Further, TaPIN7, TaPIN15, TaPIN19 and TaPIN22 showed induction in the leaf. In addition, TaPIN31, TaPIN32, TaPIN35, TaPIN40, and TaPIN44 expression was raised in the grain, while TaPIN5, TaPIN9, TaPIN13, TaPIN21 and TaPIN28 showed higher expression in the stem. The PIN proteins have been implicated in a variety of developmental processes, including leaf venation and vascular development, gravitropism, apical dominance, phototropism, embryo axis formation, and root development [4,5,6,8,10,18,26,70]. Different PIN proteins differentially catalyze auxin transport in the root hair cell of Arabidopsis [85]. AtqPIN1 and AtqSoPIN1 perform distinct functions and regulate auxin transport during bulbil formation in Agave tequilana [86]. Further, overexpression of the ABP1 altered PIN-mediated auxin transport in tobacco has been observed [56]. NtPIN4 regulates axillary bud growth in tobacco [51]. OsPIN1b regulates seminal root elongation in response to low phosphate and nitrogen in rice [57]. MtPIN1 and MtPIN3 regulate the shade avoidance response under various environments in M. truncatula [58]. Our gene ontology analysis also suggested multiple roles of TaPIN genes in the cell (Figure S8A–C). Therefore, this temporal and spatial expression pattern of TaPIN genes indicates that these PINs might have a function in different tissues and various developmental stages in wheat.

3.3. TaPIN Gene Family Members Respond to Biotic and Abiotic Stresses in Wheat

The PIN gene family plays a critical role in a plant’s adaptations to internal and external stimuli at both transcriptional and post-transcriptional levels. Our results also show that three TaPIN genes (TaPIN5, TaPIN6 and TaPIN10) were highly induced upon Septoria infection (Figure S10), while the expression of seven TaPIN genes (TaPIN13, TaPIN18, TaPIN19, TaPIN20, TaPIN25, TaPIN35 and TaPIN44) was significantly elevated during powdery mildew infection. Most of the TaPINs respond similarly to powdery mildew; this is why PM expression profiles cluster together (Figure S9B). Further, five TaPIN genes (TaPIN7, TaPIN11, TaPIN15, TaPIN22 and TaPIN26) responded to drought stress, only two TaPIN genes (TaPIN14 and TaPIN37) were induced during heat stress, and three TaPINs (TaPIN8, TaPIN9 and TaPIN28) responded to the combined heat and drought stress (Figure S10). Several PIN genes in sorghum, maize, and soybean were found to be responsive to different abiotic stresses such as drought and salt [49,52,74]. PIN genes may be commonly used in different plant species to adapt to various stress conditions. AtPIN2 is also required to maintain root growth under alkaline stress by altering the proton secretion in Arabidopsis [87]. Another study also showed that modulation in the intracellular trafficking of AtPIN2 and AtPIN3 was responsible for the impeded polar auxin transport in cold stress [88]. Moreover, expression profiling of TaPINs was further validated by qRT-PCR. The qRT-PCR results also exhibit a similar expression with slight variation (Figure 9). The expression pattern of TaPIN genes under biotic and abiotic stress revealed that they might be involved in the stress tolerance in wheat. Thus, these results demonstrate that wheat responds to diverse stresses through an intricate gene network, which requires coordinated regulation among the TaPINs.
Several studies have demonstrated that TaPIN interacts with other proteins to regulate diverse developmental processes, and hormonal and stress responses. P-glycoproteins 1 and 19 interact with PIN1, and PIN2 enhances auxin transport activity in Arabidopsis [13]. The serine/threonine-protein kinase PINOID (PID) catalyzes PIN phosphorylation, regulating the apical and basal PIN polarity in Arabidopsis [89]. Our STRING database predicted results also reveal that TaPIN32 might interact with TaPIN8 and TaPIN44 (Figure 10 and Table S8); however, TaPIN32 was co-expressed with TaPIN8 and TaPIN44 in the spike, in grain development, and under biotic stress (Figure 8 and Figure S10), suggesting that TaPIN8, TaPIN32 and TaPIN44 might perform essential functions in the spike and grain development and during powdery mildew infection through interacting with each other. The expression of TaPIN8 and TaPIN9 was significantly elevated in the combined drought and heat stress in 1 h, potentially interacting with Traes_5DS_2B0D2D352.1 (serine/threonine-protein kinase: PINOID), and PINOID specifically phosphorylates the PIN proteins, suggesting that it might regulate the localization of the wheat PIN protein and polar auxin transport through changes in the phosphorylation status during abiotic stress conditions (Figure S10). TaPIN genes also interacted with the ABC transporter and other auxin efflux carrier proteins. These results provide valuable information to further elucidate the precise biological functions of TaPIN genes to develop the high-yielding and stress-tolerant varieties in wheat.
Moreover, based on the expression profiling of TaPIN genes, we proposed a possible working model in Figure S11 to show the functions of the TaPIN genes in a variety of biological processes in wheat.
This model demonstrates that endogenous and external stimuli stimulated the expression of TaPIN genes. These signals were sensed by the different cis-regulatory elements and regulate the expression and functions of TaPIN genes implicated in various plant developmental processes and stress conditions, which eventually affect the growth and tolerance mechanism against diverse stress conditions. In summary, our work provides valuable information about the TaPIN gene family, TaPINs’ functions in the various plant developmental processes, and their response to hormones and stress. Therefore, this study provides putative candidate genes for improving plant growth and stress tolerance and also facilitates a better understanding of the various developmental processes in common wheat.

4. Materials and Methods

4.1. Identification of PIN Genes in the Wheat Genome

To perform genome-wide analysis in bread wheat, genome data (IWGSC) were retrieved from the Ensembl Plants website (http://plants.ensembl.org/index.html accessed on 10 May 2021). Two methods were used to identify putative PIN genes in wheat. In the first approach, we made a local database of the protein sequences of bread wheat in BioEdit v7.2.6 [90]. The twenty PIN genes from Arabidopsis and rice were used to identify putative PIN genes in bread wheat in the local database using BLASTp. The e-value of 10−5 and > 100-bit scores were kept cut-off to identify putative PIN genes, and, finally, the BLASTp output was tabulated. In the second approach, the protein sequences of PINs from other plant species were downloaded from Ensembl hosts the latest wheat assembly from the IWGSC (RefSeq v1.0) (http://plants.ensembl.org/index.html accessed on 10 May 2021), and a BLASTp search was executed against the T. aestivum proteome with bit-score > 100 and an e-value cut-off of 10−5. Based on both above methods, putative PIN candidates were selected. After removing redundant results, the remaining sequences were further verified for the existence of transmembrane domains using other databases: Simple Modular 132 Architecture Research Tool tool (SMART, http://smart.emblheidelberg.de/ accessed on 10 May 2021), InterPro (https://www.ebi.ac.uk/interpro) NCBI CDD (https://0-www-ncbi-nlm-nih-gov.brum.beds.ac.uk/Structure/cdd/cdd.shtml accessed on 10 May 2021), and HMMscan (https://www.ebi.ac.uk/Tools/hmmer/search/hmmscan accessed on 10 May 2021), and the sequences lacking transmembrane domains were removed. Finally, the protein sequences with PIN-related domains were taken and named sequentially according to their locations on the chromosomes.

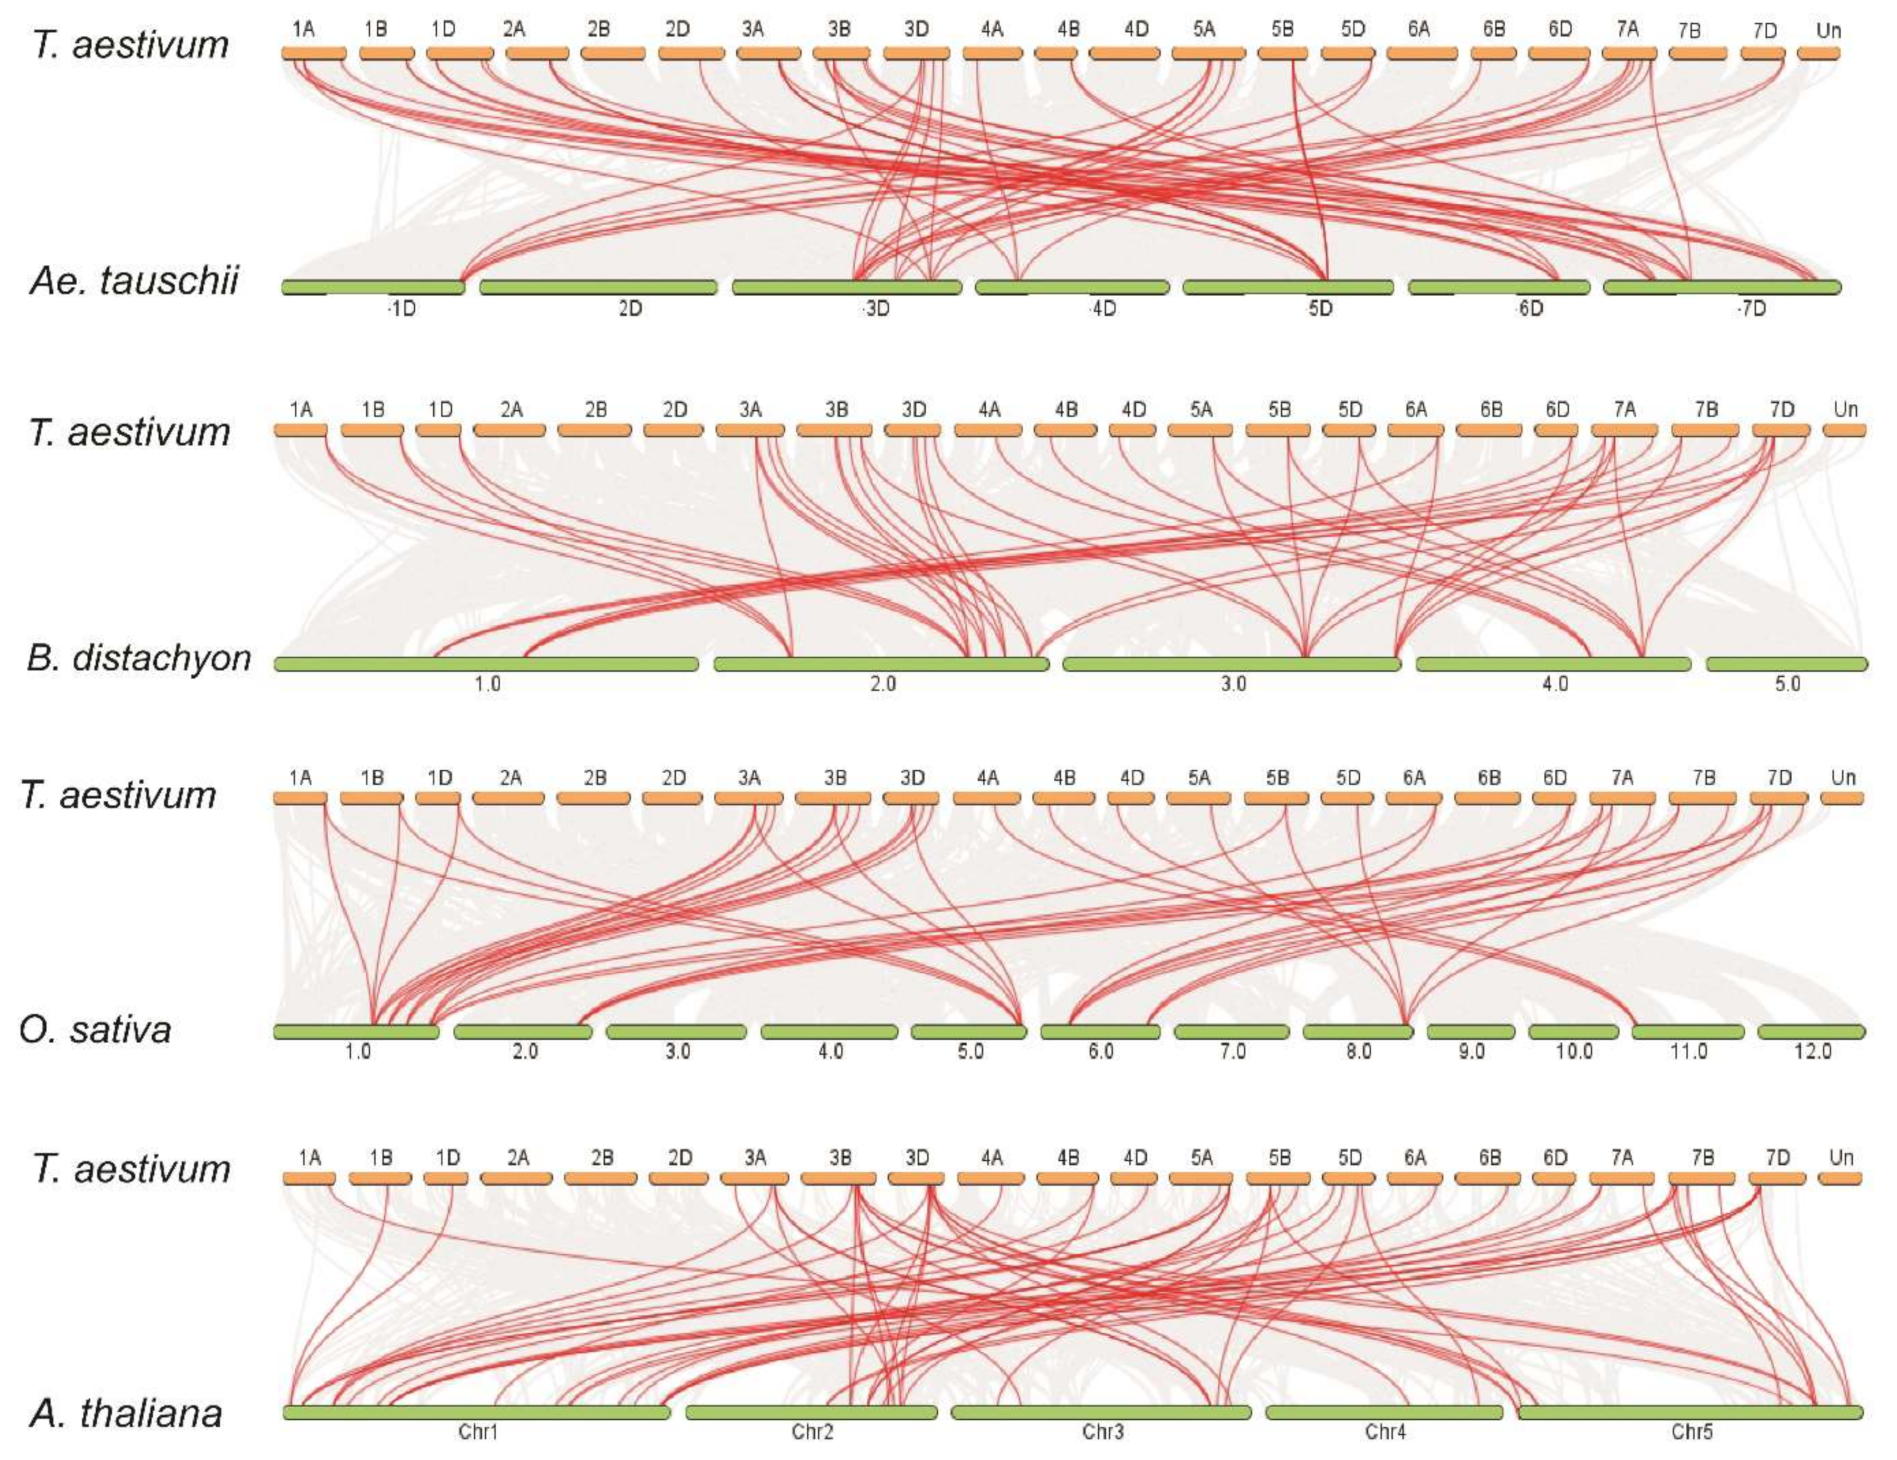
4.2. Chromosome Localization and Gene Duplication

For the distribution on chromosomes, genomic positions of PIN genes were downloaded from the Ensembl Plants BioMart (http://plants.ensembl.org/biomart/martview accessed on 11 May 2021). The PIN genes were named with a ‘Ta’ prefix and numbered in ascending order with their increasing position on the chromosome. PhenoGram (http://visualization.ritchielab.org/phenograms/plot accessed on 11 May 2021) was used to represent TaPIN genes on the wheat chromosomes. MCScanX tool kit was used to investigate gene duplication events within species and similarity between PIN genes in wheat and other plant species [91]. The non-synonymous substitution rate (Ka), synonymous substitution rate (Ks), and the Ka/Ks ratio were calculated using TBtools [92].

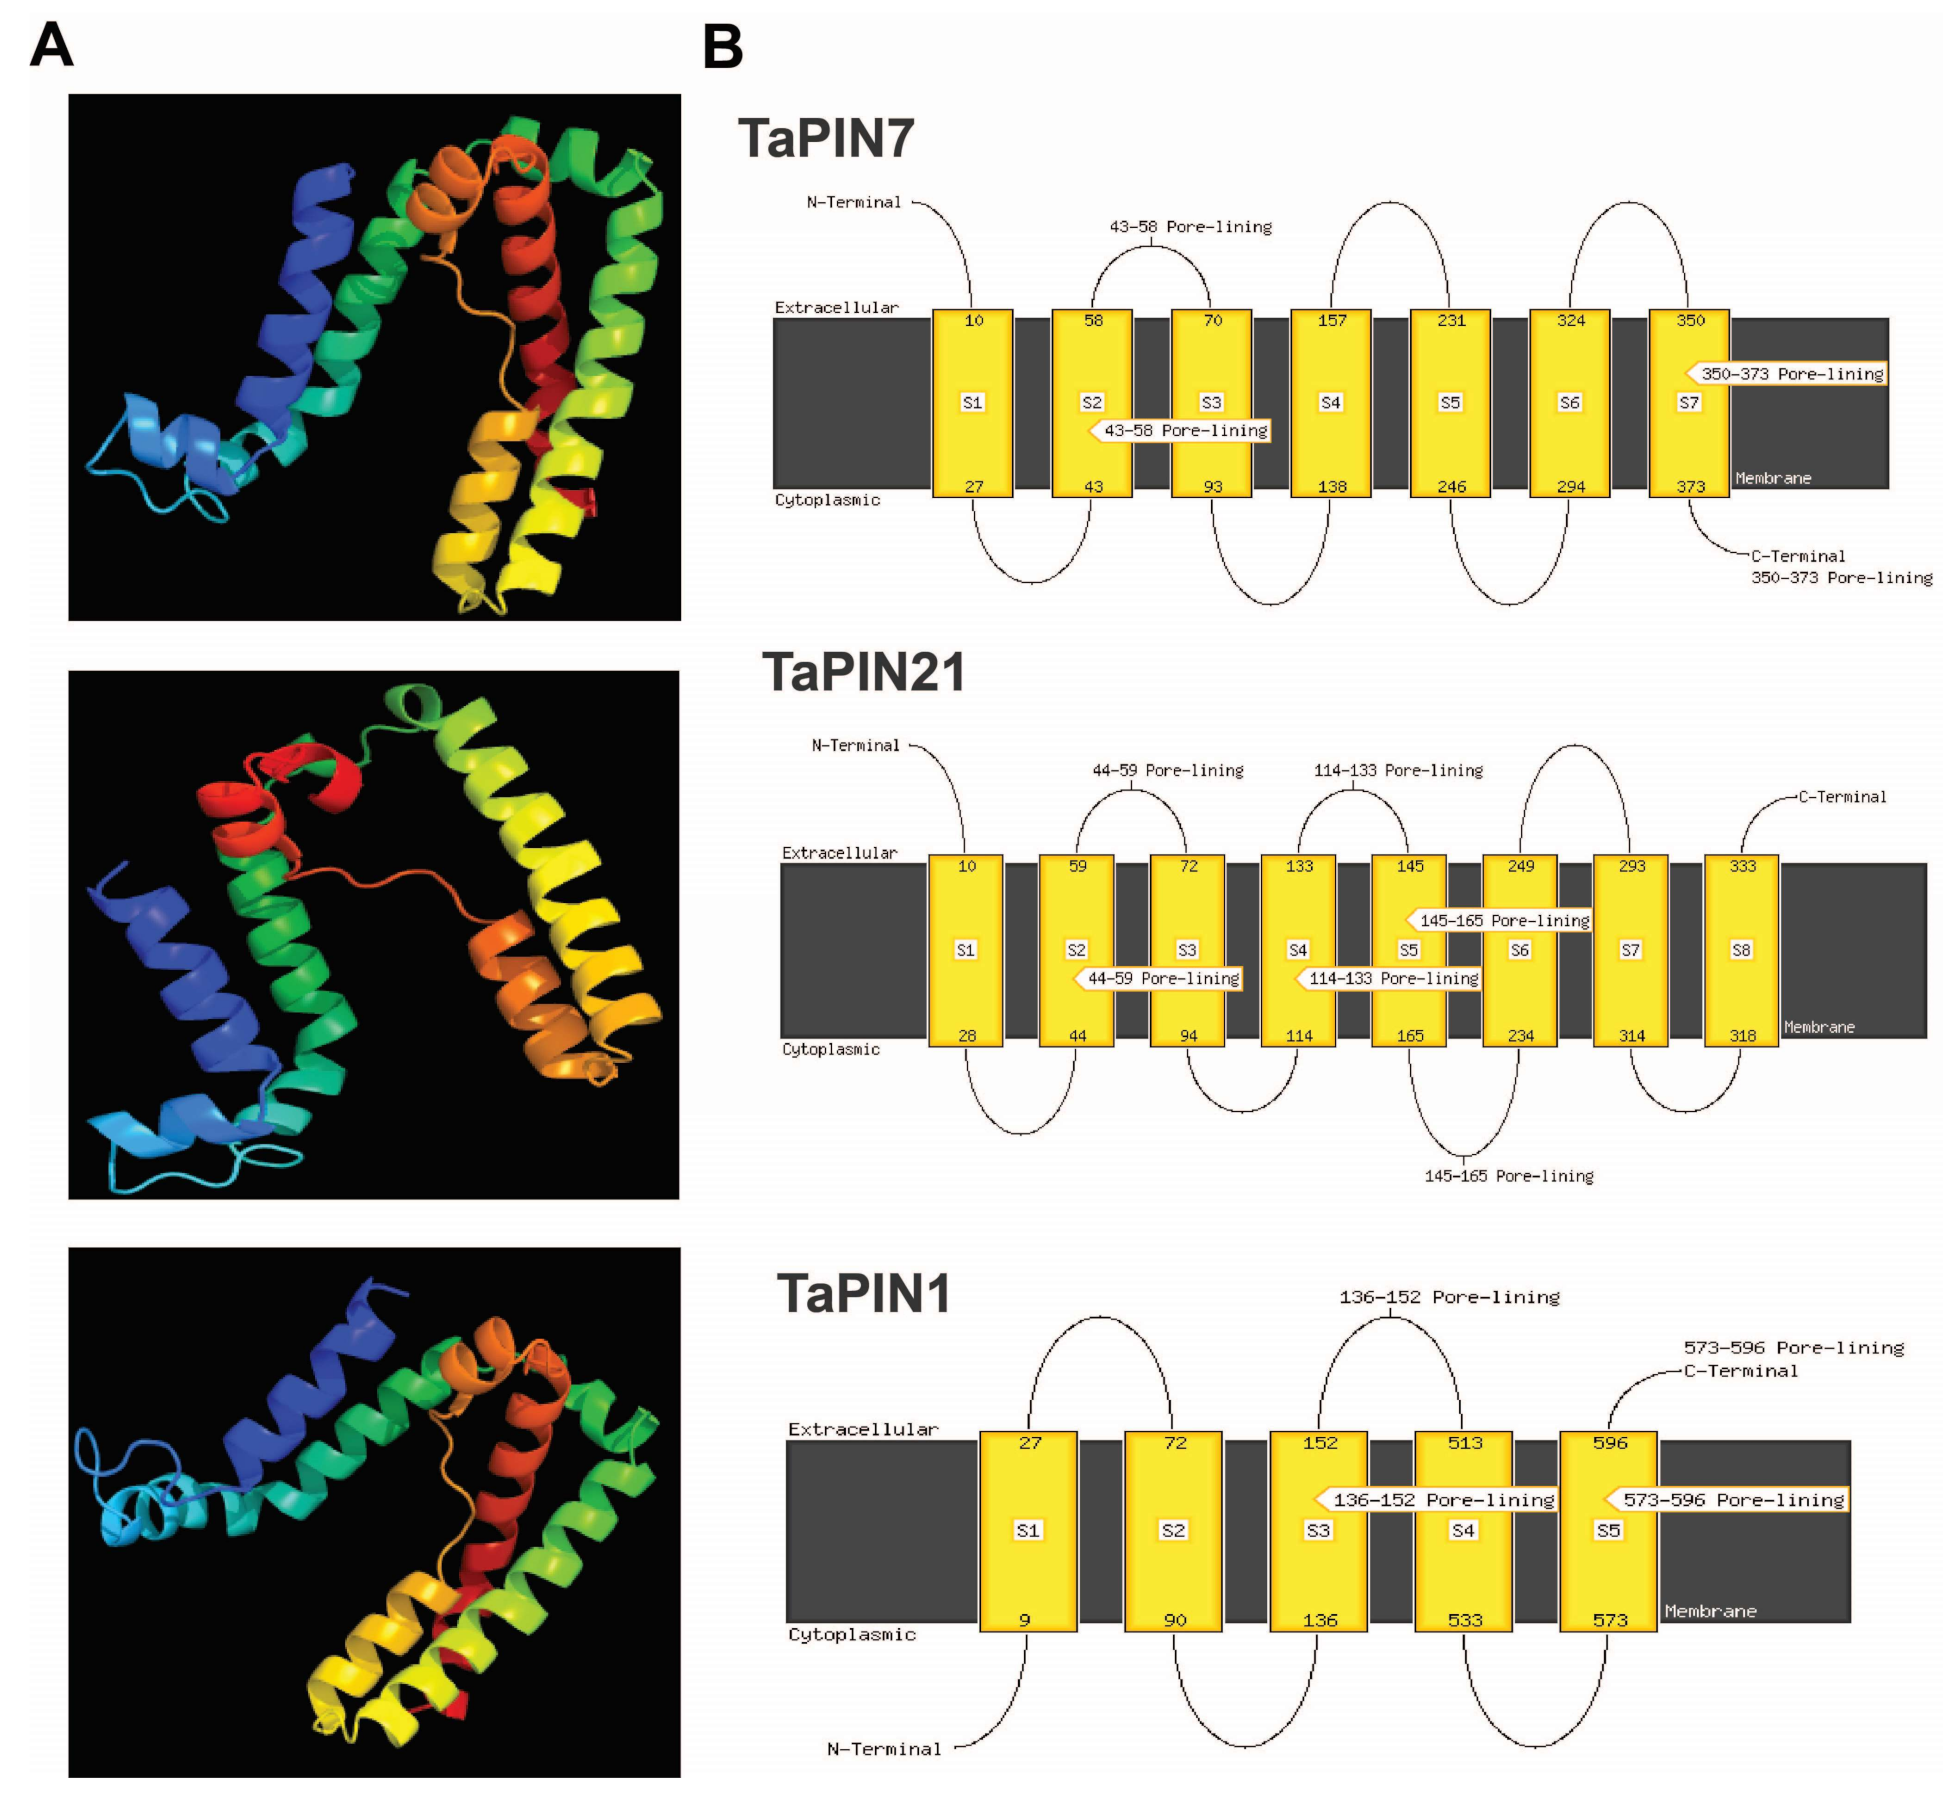
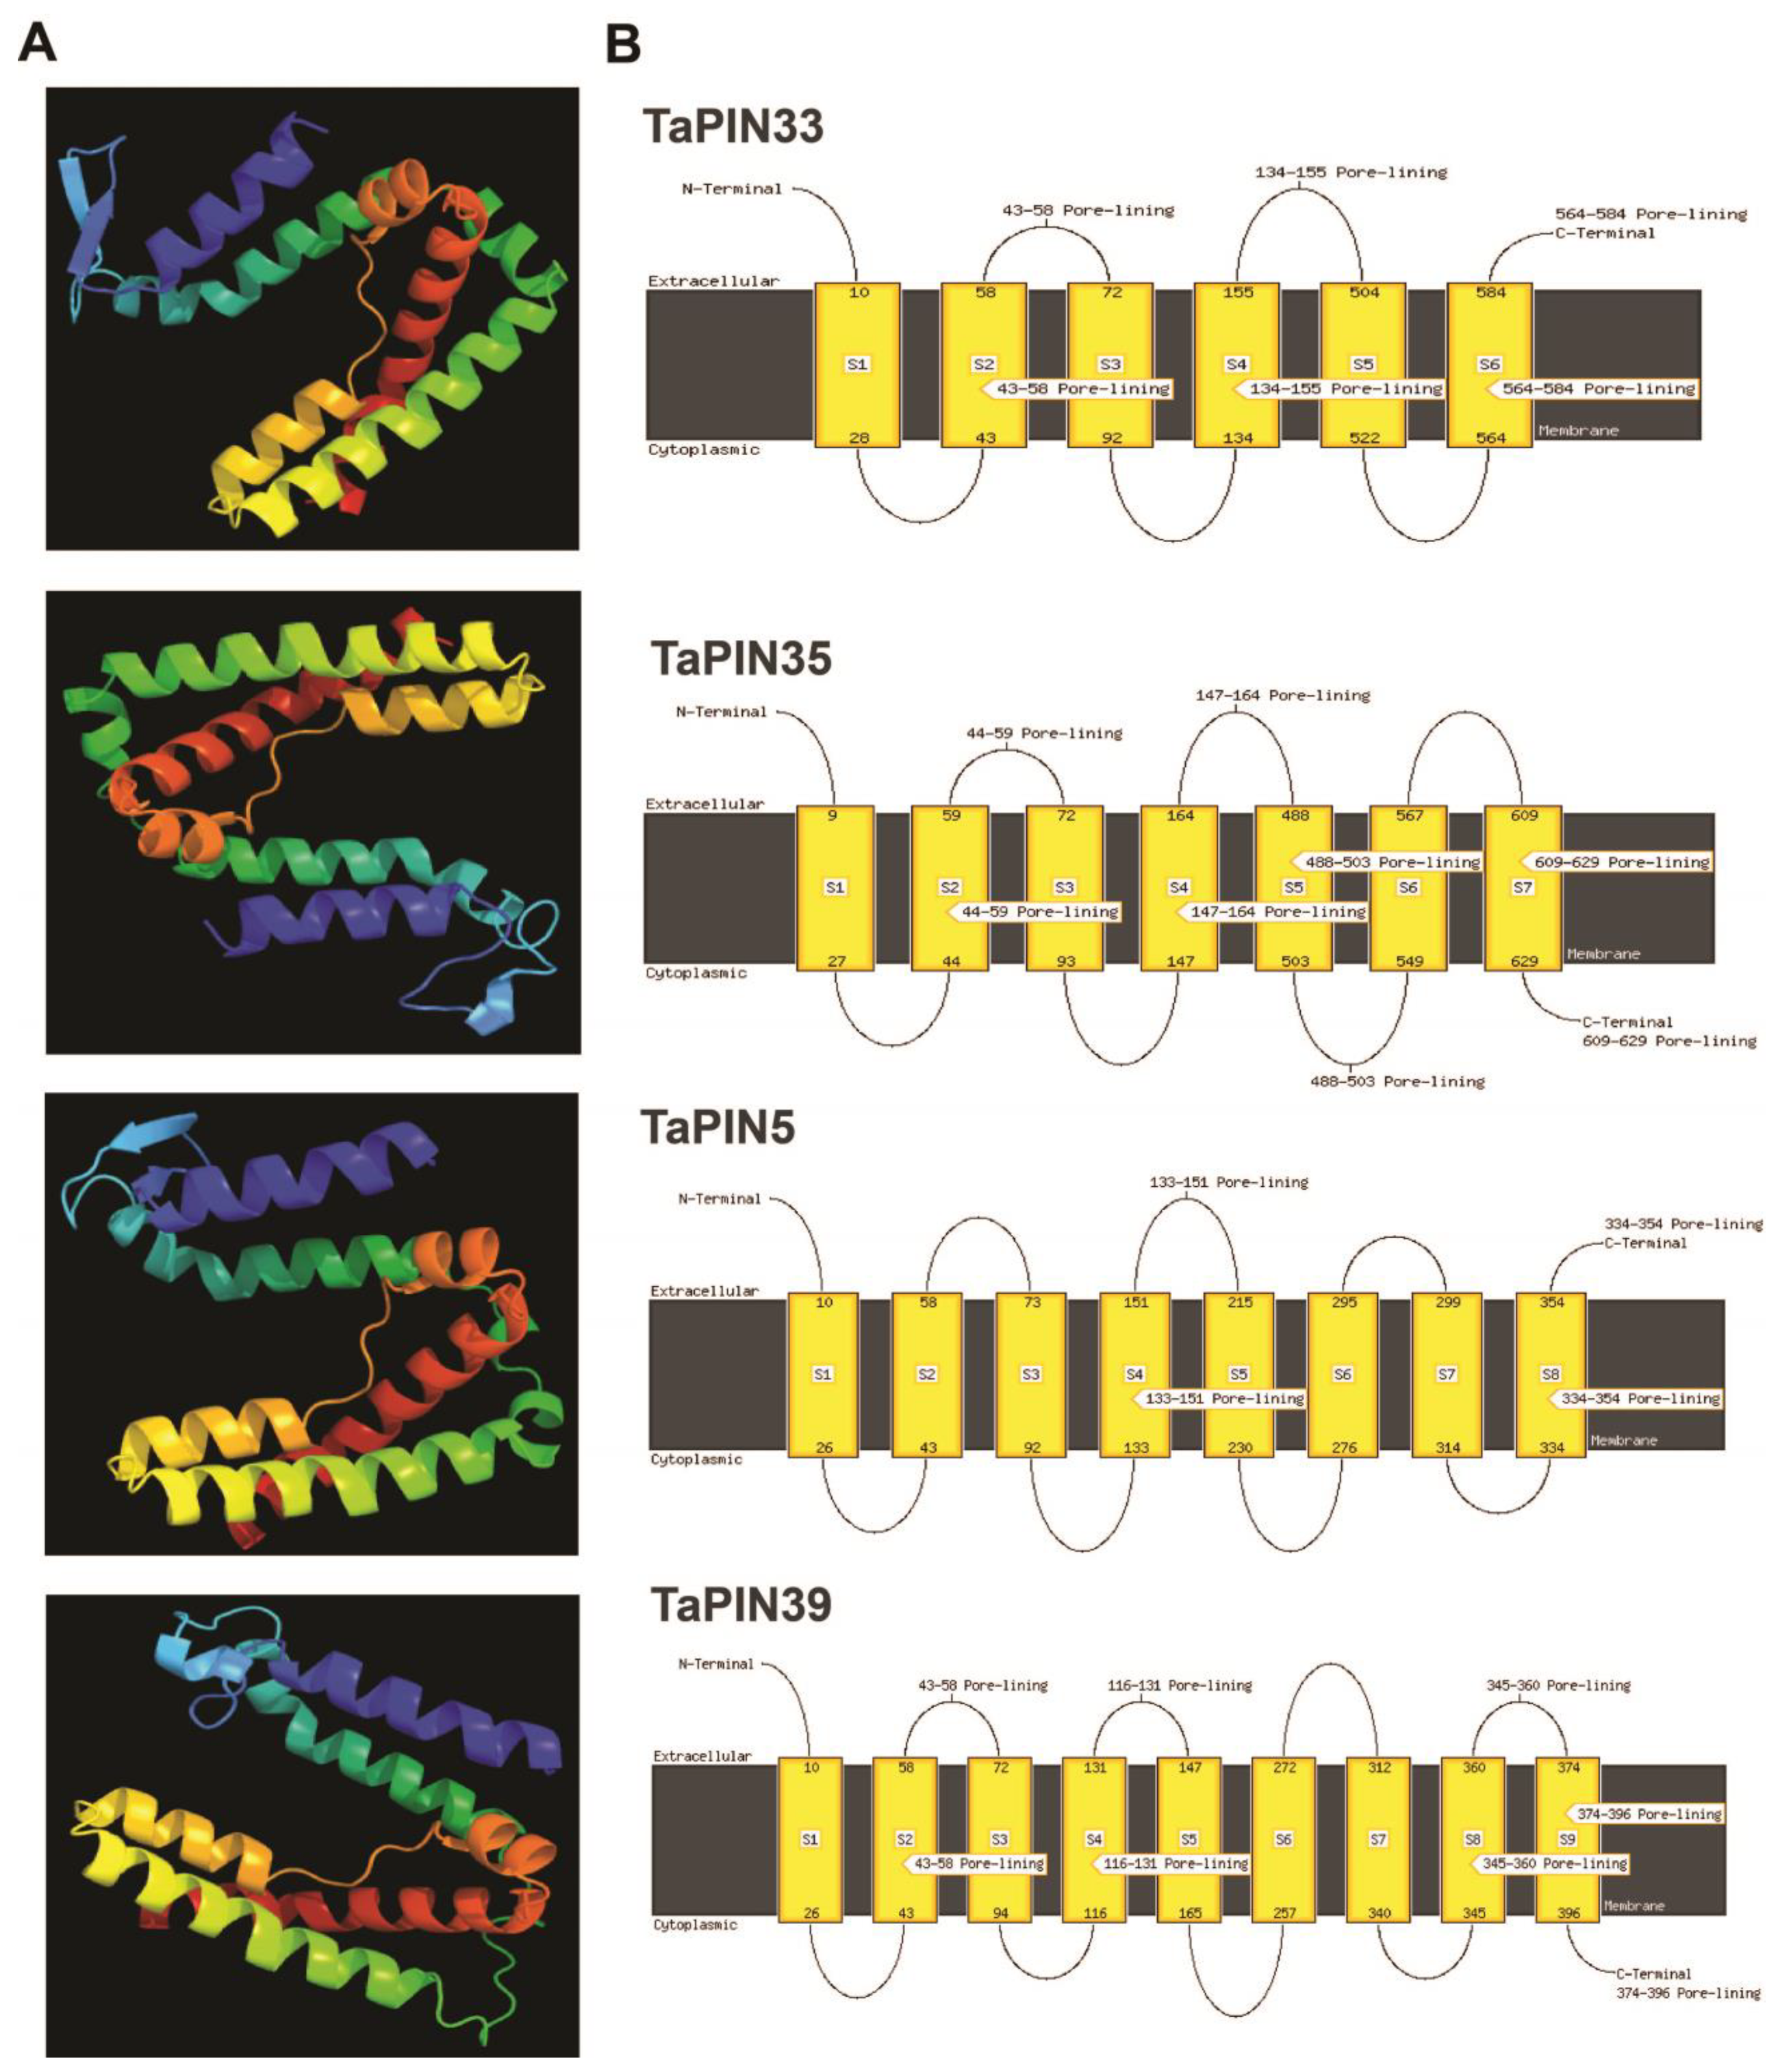
4.3. Physico-Chemical Characteristics, Subcellular Localization, the Transmembrane Domain, and 3D Structure

The protein characteristics, including the isoelectric point, lengths, and molecular weight of TaPIN proteins, were evaluated using the isoelectric point calculator [93,94] and ExPASy (https://web.expasy.org/compute_pi/ accessed on 12 May 2021). Subcellular localization was predicted using CELLO (http://cello.life.nctu.edu.tw/ accessed on 12 May 2021). The transmembrane helix and topology of the TaPINs were analyzed using SOSUI (http://www.cbs.dtu.dk, http://harrier.nagahama-i-bio.ac.jp accessed on 12 May 2021), TMHMM (http://www.cbs.dtu.dk/services/TMHMM/ accessed on 12 May 2021), and MEMSAT-SVM available in the Phyre2 server. The three-dimensional (3D) structure of TaPINs was produced using the Phyre2 server (http://www.sbg.bio.ic.ac.uk/phyre2/html/page.cgi?id=index).

4.4. Gene Structure, Gene Ontology, and Motif Analysis

The CDS and genomic and protein sequences of wheat PIN genes were retrieved from the Ensembl Plants BioMart (http://plants.ensembl.org/biomart/martview). Intron and exon positions and untranslated regions were visualized using the Gene Structure Display Server 2.0 (http://gsds.gao-lab.org/). For gene ontology, TaPIN protein sequences were used to predict gene ontology terms using agriGO [95] and EggNOG (http://eggnogdb.embl.de/#/app/emapper). The conserved motifs in the TaPINs were elucidated using the MEME tool (http://meme-suite.org/tools/meme) with default settings.

4.5. Cis-acting Regulatory Elements (CAREs) Analysis and Protein Interaction Network

To identify CAREs, 2000 bp upstream sequences of PIN genes were downloaded from Ensembl Plants and analyzed using the PlantCARE online server (http://bioinformatics.psb.ugent.be/webtools/plantcare/html/ accessed on 15 May 2021). The number of occurrences for each CARE motif was counted for TaPIN genes, and the most commonly occurring CAREs were used to produce Figure 7 in TBtools [92]. The TaPIN protein interaction network was examined using the STRING online server (https://string-db.org/cgi accessed on 15 May 2021).

4.6. Expression Profiling of TaPIN Genes

Transcripts per million (TPM) values for five tissues (leaf, stem, root, spike and grain) and under diverse stress conditions were retrieved from Wheat Expression Browser (http://www.wheat-expression.com/ accessed on 16 May 2021). Heatmaps and principal component analysis (PCA) plots were produced using clustvis (https://biit.cs.ut.ee/clustvis/) and TBtools software [92].

4.7. Plant Material, Growth Conditions, Drought, and Heat Treatment

Seeds of wheat were sown on soil in plastic pots and reared in a greenhouse. Ten-day-old wheat seedlings were acclimatized for two days in growth chamber conditions. They were further subjected to drought and high-temperature stress (37 °C) for 1 h and 6 h. Controls were kept at 25 °C. The drought- and high temperature-stressed seedlings were collected for RNA extraction and stored at −80 °C.

4.8. RNA Isolation and Real-Time PCR

RNA was isolated from control, drought-, and heat-treated plants as described by [96,97]. To remove the genomic DNA contamination from RNA, samples were treated with DNase-I (Takara Bio. Inc., Shiga, Japan) at 37 °C for 30 min. cDNA was prepared using the iScriptTM cDNA synthesis kit (Bio-Rad, Hercules, CA, USA) at 46 °C for 20 min. cDNA was quantified using a NanoDrop (ND-1000, NanoDrop Technologies, Wilmington, DE, United States). Quantitative real-time PCR (qRT-PCR) was performed using the Applied Biosystems 7500 Fast Real-Time PCR (Applied Biosystems, Massachusetts, United States). Each qRT-PCR reaction was carried out with three technical replicates and repeated three times. The fold change was calculated based on mean 2ΔΔCT values [98]. Finally, this value was used for plotting graphs. Wheat actin (AB181991) was used as the internal control to normalize the data. Primer pairs were designed using PrimerQuest Tool (https://sg.idtdna.com/PrimerQuest/Home/Index accessed on 17 May 2021), and primers used in this work are listed in Table S9.

5. Conclusions

Bread wheat is an important cereal crop and staple food worldwide. Thus, all plant scientists have been concentrated on increasing yield, and on improving the quality and stress tolerance in wheat. The PIN gene family is involved in plant growth and development. In the present study, we identified and characterized the PIN gene family in wheat. Expression profiling showed the role of TaPINs in various developmental stages and stress conditions. The outcome of this study will be helpful to understand the role of PINs in plant developmental processes and diverse stress conditions and their sequential execution to increase yield and develop stress-tolerant varieties of wheat.

Supplementary Materials

The following are available online at https://0-www-mdpi-com.brum.beds.ac.uk/article/10.3390/ijms22147396/s1, Figure S1. Molecular weight (kDa) vs. isoelectric point plots of TaPIN genes, Figure S2. Distribution of TaPINs in the different groups of the phylogenetic tree, Figure S3. Phylogenetic analysis of TaPIN genes. A phylogenetic tree was constructed using MEGAX with the neighbor joining (NJ) method and 1000 bootstrap replications. Black asterisk indicates the duplicated genes, Figure S4. Chromosomal distribution and duplicated PIN gene pairs in wheat. Duplicated PIN gene pairs are connected by lines with distinct colors. The figure was generated using TBtools, Figure S5. Distribution of the number of introns of TaPINs genes in different groups of the phylogenetic tree, Figure S6. The predicted transmembrane helices of the TaPIN proteins. The transmembrane domains were identified using TMHMM2 (www.cbs.dtu.dk/services/TMHMM/) and SOSUI software tools (http://www.cbs.dtu.dk, http://harrier.nagahama-i-bio.ac.jp). The red peaks represent the predicted transmembrane domain, and blue color line indicates the central hydrophobic loop of proteins, Figure S7. Alignment of the TaPINs protein sequences. The highly conserved regions of the TaPIN proteins are underlined with black color. Colored and shaded amino acids are chemically similar residues. Dashes indicate gaps introduced to maximize the alignment of homologous region, Figure S8. Gene ontology term distribution of TaPIN gene family predicted using AgriGO. A. Biological process. B. Cellular component. C. Molecular function, Figure S9. PCA plots displaying grouping of different (A) developmental stages (B) and biotic and abiotic stress conditions based on the TaPIN expression pattern, Figure S10. Heatmap representing the expression pattern of TaPIN genes in different stress conditions. TPM values were directly used to construct the heatmap. DS: drought stress, HS: heat stress, h: hour, d: days. PM: powdery mildew, Figure S11. A possible function of TaPIN gene family in various plant developmental processes and diverse stress conditions. ABA: abscisic acid; MeJA: methyl jasmonate; SA: salicylic acid; JA: jasmonic acid; MAP: mitogen-activated protein kinase; ARF: auxin response factors; MYB: myeloblastosis; NAC: no apical meristem; ZF: zinc finger; HSF: heat shock factors, Table S1. PIN proteins from Arabidopsis, rice, and wheat used to generate phylogenetic tree, Table S2. Ratio of Ka/Ks and distribution of duplicate wheat PIN genes, Table S3. Orthologous relationships of TaPIN genes with other PIN genes in B. distachyon, Ae. tauschii, T. dicoccoides, O. sativa and A. thaliana, Table S4. Domain organization of TaPIN genes predicted using pfam with default parameters, Table S5. Cis-regulatory elements present in the TaPIN gene promoter region, Table S6. Significant GO terms predicted by AgriGo analysis, Table S7. Gene annotation using eggNOGmapper, Table S8. The protein–protein interaction network between TaPIN and other proteins in wheat, Table S9. qRT-PCR primers of TaPIN genes.

Author Contributions

M.K. and M.S.K. designed and wrote the manuscript; M.K. acquired funding; M.K., M.S.K. and S.-M.C. supervised the study; B.S.K., P.D., D.S., A.S., S.K.B., G.S.G., A.A.K., H.-U.K., M. and S.-M.C. provided valuable feedback for this study. All authors have read and agreed to the published version of the manuscript.

Funding

M.K. would like to thank Dongguk University 2020 for funding.

Institutional Review Board Statement

Not applicable.

Informed Consent Statement

Not applicable.

Data Availability Statement

Not applicable.

Conflicts of Interest

Authors declare no conflict of interest.

References

  1. Benjamins, R.; Scheres, B. Auxin: The looping star in plant development. Annu. Rev. Plant Biol. 2008, 59, 443–465. [Google Scholar] [CrossRef]
  2. Ganguly, A.; Park, M.; Kesawat, M.S.; Cho, H.-T. Functional Analysis of the Hydrophilic Loop in Intracellular Trafficking of Arabidopsis PIN-FORMED Proteins. Plant Cell 2014, 26, 1570–1585. [Google Scholar] [CrossRef] [PubMed] [Green Version]
  3. Zhao, Y. Essential Roles of Local Auxin Biosynthesis in Plant Development and in Adaptation to Environmental Changes. Annu. Rev. Plant. Biol. 2018, 69, 417–435. [Google Scholar] [CrossRef] [PubMed]
  4. Dubey, S.M.; Serre, N.B.; Oulehlová, D.; Vittal, P.; Fendrych, M. No Time for Transcription—Rapid Auxin Responses in Plants. Cold Spring Harb. Perspect. Biol. 2021, 13, a039891. [Google Scholar] [CrossRef] [PubMed]
  5. Bennett, M.J.; Marchant, A.; Green, H.G.; May, S.; Ward, S.P.; Millner, P.A.; Walker, A.; Schulz, B.; Feldmann, K.A.; Bennett, M.J.; et al. Arabidopsis AUX1 Gene: A Permease-Like Regulator of Root Gravitropism. Science 1996, 273, 948–950. [Google Scholar] [CrossRef] [PubMed]
  6. Levernier, N.; Pouliquen, O.; Forterre, Y. An Integrative Model of Plant Gravitropism Linking Statoliths Position and Auxin Transport. Front. Plant. Sci. 2021, 12, 12. [Google Scholar] [CrossRef]
  7. Heisler, M.; Ohno, C.; Das, P.; Sieber, P.; Reddy, G.V.; Long, J.A.; Meyerowitz, E.M. Patterns of Auxin Transport and Gene Expression during Primordium Development Revealed by Live Imaging of the Arabidopsis Inflorescence Meristem. Curr. Biol. 2005, 15, 1899–1911. [Google Scholar] [CrossRef] [Green Version]
  8. Scarpella, E.; Marcos, D.; Friml, J.; Berleth, T. Control of leaf vascular patterning by polar auxin transport. Genes Dev. 2006, 20, 1015–1027. [Google Scholar] [CrossRef] [Green Version]
  9. Leyser, O. Auxin Distribution and Plant Pattern Formation: How Many Angels Can Dance on the Point of PIN? Cell 2005, 121, 819–822. [Google Scholar] [CrossRef] [Green Version]
  10. Friml, J.; Vieten, A.; Sauer, M.; Weijers, D.; Schwarz, H.; Hamann, T.; Offringa, R.; Jürgens, G. Efflux-dependent auxin gra-dients establish the apical–basal axis of Arabidopsis. Nature 2003, 426, 147–153. [Google Scholar] [CrossRef]
  11. Dubrovsky, J.G.; Sauer, M.; Napsucialy-Mendivil, S.; Ivanchenko, M.G.; Friml, J.; Shishkova, S.; Celenza, J.; Benkova, E. Auxin acts as a local morphogenetic trigger to specify lateral root founder cells. Proc. Natl. Acad. Sci. USA 2008, 105, 8790–8794. [Google Scholar] [CrossRef] [Green Version]
  12. Mattsson, J.; Ckurshumova, W.; Berleth, T. Auxin Signaling in Arabidopsis Leaf Vascular Development. Plant. Physiol. 2003, 131, 1327–1339. [Google Scholar] [CrossRef] [PubMed] [Green Version]
  13. Blakeslee, J.J.; Bandyopadhyay, A.; Peer, W.A.; Makam, S.N.; Murphy, A.S. Relocalization of the PIN1 Auxin Efflux Facilitator Plays a Role in Phototropic Responses. Plant. Physiol. 2004, 134, 28–31. [Google Scholar] [CrossRef] [PubMed] [Green Version]
  14. Palme, K.; Dovzhenko, A.; Ditengou, F.A. Auxin transport and gravitational research: Perspectives. Protoplasma 2006, 229, 175–181. [Google Scholar] [CrossRef] [PubMed]
  15. Ellis, C.M.; Nagpal, P.; Young, J.C.; Hagen, G.; Guilfoyle, T.J.; Reed, J.W. AUXIN RESPONSE FACTOR1 and AUXIN RE-SPONSE FACTOR2 regulate senescence and floral organ abscission in Arabidopsis thaliana. Development 2005, 132, 4563–4574. [Google Scholar] [CrossRef] [PubMed] [Green Version]
  16. Stone, B.B.; Stowe-Evans, E.L.; Harper, R.M.; Celaya, R.B.; Ljung, K.; Sandberg, G.; Liscum, E. Disruptions in AUX1-Dependent Auxin Influx Alter Hypocotyl Phototropism in Arabidopsis. Mol. Plant. 2008, 1, 129–144. [Google Scholar] [CrossRef] [PubMed] [Green Version]
  17. Bainbridge, K.; Guyomarc’H, S.; Bayer, E.; Swarup, R.; Bennett, M.; Mandel, T.; Kuhlemeier, C. Auxin influx carriers stabilize phyllotactic patterning. Genes Dev. 2008, 22, 810–823. [Google Scholar] [CrossRef] [PubMed] [Green Version]
  18. Swarup, K.; Benková, E.; Swarup, R.; Casimiro, I.; Peret, B.; Yang, Y.; Parry, G.; Nielsen, E.; De Smet, I.; Vanneste, S.; et al. The auxin influx carrier LAX3 promotes lateral root emergence. Nat. Cell Biol. 2008, 10, 946–954. [Google Scholar] [CrossRef]
  19. Jones, A.; Kramer, E.M.; Knox, K.; Swarup, R.; Bennett, M.J.; Lazarus, C.M.; Leyser, H.M.O.; Grierson, C.S. Auxin transport through non-hair cells sustains root-hair development. Nat. Cell Biol. 2008, 11, 78–84. [Google Scholar] [CrossRef] [Green Version]
  20. Friml, J.; Benková, E.; Blilou, I.; Wisniewska, J.; Hamann, T.; Ljung, K.; Woody, S.; Sandberg, G.; Scheres, B.; Jürgens, G.; et al. AtPIN4 Mediates Sink-Driven Auxin Gradients and Root Patterning in Arabidopsis. Cell 2002, 108, 661–673. [Google Scholar] [CrossRef] [Green Version]
  21. Dal Bosco, C.; Dovzhenko, A.; Palme, K. Intracellular auxin transport in pollen: PIN8, PIN5 and PILSPlant Signal. Behavior 2012, 7, 1504–1505. [Google Scholar]
  22. Zhou, J.-J.; Luo, J. The PIN-FORMED Auxin Efflux Carriers in Plants. Int. J. Mol. Sci. 2018, 19, 2759. [Google Scholar] [CrossRef] [PubMed] [Green Version]
  23. Reinhardt, D.; Mandel, T.; Kuhlemeier, C. Auxin regulates the initiation and radial position of plant lateral organs. Plant. Cell 2000, 12, 507–518. [Google Scholar] [CrossRef] [PubMed] [Green Version]
  24. Benková, E.; Michniewicz, M.; Sauer, M.; Teichmann, T.; Seifertová, D.; Jürgens, G.; Friml, J. Local, Efflux-Dependent Auxin Gradients as a Common Module for Plant Organ Formation. Cell 2003, 115, 591–602. [Google Scholar] [CrossRef] [Green Version]
  25. Petrasek, J.; Friml, J. Auxin transport routes in plant development. Development 2009, 136, 2675–2688. [Google Scholar] [CrossRef] [Green Version]
  26. Konstantinova, N.; Korbei, B.; Luschnig, C. Auxin and Root Gravitropism: Addressing Basic Cellular Processes by Exploiting a Defined Growth Response. Int. J. Mol. Sci. 2021, 22, 2749. [Google Scholar] [CrossRef]
  27. Bartel, B. Auxin Biosynthesis. Annu. Rev. Plant. Biol. 1997, 48, 51–66. [Google Scholar] [CrossRef]
  28. Zhao, Y. Auxin Biosynthesis and Its Role in Plant Development. Annu. Rev. Plant. Biol. 2010, 61, 49–64. [Google Scholar] [CrossRef] [Green Version]
  29. Vanneste, S.; Friml, J. Auxin: A Trigger for Change in Plant Development. Cell 2009, 136, 1005–1016. [Google Scholar] [CrossRef]
  30. Swarup, R.; Péret, B. AUX/LAX family of auxin influx carriers—An overview. Front. Plant. Sci. 2012, 3, 225. [Google Scholar] [CrossRef] [Green Version]
  31. Vieten, A.; Vanneste, S.; Wiśniewska, J.; Benková, E.; Benjamins, R.; Beeckman, T.; Luschnig, C.; Friml, J. Functional redun-dancy of PIN proteins is accompanied by auxin-dependent cross-regulation of PIN expression. Development 2005, 132, 4521–4531. [Google Scholar] [CrossRef] [PubMed] [Green Version]
  32. Geisler, M.; Murphy, A.S. The ABC of auxin transport: The role of p-glycoproteins in plant development. FEBS Lett. 2005, 580, 1094–1102. [Google Scholar] [CrossRef] [Green Version]
  33. Yang, H.; Murphy, A.S. Functional expression and characterization of Arabidopsis ABCB, AUX 1 and PIN auxin transporters inSchizosaccharomyces pombe. Plant. J. 2009, 59, 179–191. [Google Scholar] [CrossRef]
  34. Křeček, P.; Skůpa, P.; Libus, J.; Naramoto, S.; Tejos, R.; Friml, J.; Zazimalova, E. The PIN-FORMED (PIN) protein family of auxin transporters. Genome Biol. 2009, 10, 249. [Google Scholar] [CrossRef] [Green Version]
  35. Adamowski, M.; Friml, J. PIN-Dependent Auxin Transport: Action, Regulation, and Evolution. Plant. Cell 2015, 27, 20–32. [Google Scholar] [CrossRef] [PubMed] [Green Version]
  36. Paponov, I.; Teale, W.D.; Trebar, M.; Blilou, I.; Palme, K. The PIN auxin efflux facilitators: Evolutionary and functional perspectives. Trends Plant. Sci. 2005, 10, 170–177. [Google Scholar] [CrossRef] [PubMed]
  37. Zažímalová, E.; Murphy, A.S.; Yang, H.; Hoyerová, K.; Hošek, P. Auxin transporters—why so many? Cold Spring Harb. Perspect. Biol. 2010, 2, a001552. [Google Scholar] [CrossRef] [PubMed] [Green Version]
  38. Abdollahi Sisi, N.; Růžička, K. ER-Localized PIN Carriers: Regulators of Intracellular Auxin Homeostasis. Plants 2020, 9, 1527. [Google Scholar] [CrossRef] [PubMed]
  39. Friml, J. Subcellular trafficking of PIN auxin efflux carriers in auxin transport. Eur. J. Cell Biol. 2010, 89, 231–235. [Google Scholar] [CrossRef]
  40. Mravec, J.; Skůpa, P.; Bailly, A.; Hoyerová, K.; Křeček, P.; Bielach, A.; Petrášek, J.; Zhang, J.; Gaykova, V.; Stierhof, Y.-D. Subcellular homeostasis of phytohormone auxin is mediated by the ER-localized PIN5 transporter. Nature 2009, 459, 1136–1140. [Google Scholar] [CrossRef]
  41. Ding, Z.; Wang, B.; Moreno, I.; Dupláková, N.; Simon, S.; Carraro, N.; Reemmer, J.; Pěnčík, A.; Chen, X.; Tejos, R.; et al. ER-localized auxin transporter PIN8 regulates auxin homeostasis and male gametophyte development in Arabidopsis. Nat. Commun. 2012, 3, 941. [Google Scholar] [CrossRef] [Green Version]
  42. Simon, S.; Skůpa, P.; Viaene, T.; Zwiewka, M.; Tejos, R.; Klíma, P.; Čarná, M.; Rolčík, J.; De Rycke, R.; Moreno, I. PIN6 auxin transporter at endoplasmic reticulum and plasma membrane mediates auxin homeostasis and organogenesis in Arabidopsis. New Phytol. 2016, 211, 65–74. [Google Scholar] [CrossRef] [PubMed]
  43. Bennett, T. PIN proteins and the evolution of plant development. Trends Plant. Sci. 2015, 20, 498–507. [Google Scholar] [CrossRef] [PubMed]
  44. He, P.; Zhao, P.; Wang, L.; Zhang, Y.; Wang, X.; Xiao, H.; Yu, J.; Xiao, G. The PIN gene family in cotton (Gossypium hirsutum): Genome-wide identification and gene expression analyses during root development and abiotic stress responses. BMC Genom. 2017, 18, 507. [Google Scholar] [CrossRef] [PubMed] [Green Version]
  45. Forestan, C.; Varotto, S. The Role of PIN Auxin Efflux Carriers in Polar Auxin Transport and Accumulation and Their Effect on Shaping Maize Development. Mol. Plant. 2012, 5, 787–798. [Google Scholar] [CrossRef] [PubMed] [Green Version]
  46. Zhang, C.; Yuan, Q.; Zhao, T.; Xiao, D.; Xu, X. Genome-wide identification and expression analysis of the PIN gene family during abiotic stress in tomato (Solanum lycopersium). Int. J. Agric. Biol. 2018, 20, 2481–2490. [Google Scholar]
  47. Wang, J.-R.; Hu, H.; Wang, G.-H.; Li, J.; Chen, J.-Y.; Wu, P. Expression of PIN genes in rice (Oryza sativa L.): Tissue specificity and regulation by hormones. Mol. Plant. 2009, 2, 823–831. [Google Scholar] [CrossRef]
  48. Liu, B.; Zhang, J.; Wang, L.; Li, J.; Zheng, H.; Chen, J.; Lu, M. A survey of Populus PIN-FORMED family genes reveals their diversified expression patterns. J. Exp. Bot. 2014, 65, 2437–2448. [Google Scholar] [CrossRef]
  49. Wang, Y.; Chai, C.; Valliyodan, B.; Maupin, C.; Annen, B.; Nguyen, H.T. Genome-wide analysis and expression profiling of the PIN auxin transporter gene family in soybean (Glycine max). BMC Genom. 2015, 16, 951. [Google Scholar] [CrossRef] [Green Version]
  50. Pattison, R.; Catalá, C. Evaluating auxin distribution in tomato (Solanum lycopersicum) through an analysis of the PIN and AUX/LAX gene families. Plant. J. 2012, 70, 585–598. [Google Scholar] [CrossRef]
  51. Xie, X.; Qin, G.; Si, P.; Luo, Z.; Gao, J.; Chen, X.; Zhang, J.; Wei, P.; Xia, Q.; Lin, F.; et al. Analysis of Nicotiana tabacum PIN genes identifies NtPIN4 as a key regulator of axillary bud growth. Physiol. Plant. 2017, 160, 222–239. [Google Scholar] [CrossRef]
  52. Shen, C.; Bai, Y.; Wang, S.; Zhang, S.; Wu, Y.; Chen, M.; Jiang, D.; Qi, Y. Expression profile of PIN, AUX/LAX and PGP auxin transporter gene families in Sorghum bicolor under phytohormone and abiotic stress. FEBS J. 2010, 277, 2954–2969. [Google Scholar] [CrossRef]
  53. Yang, C.; Wang, D.; Zhang, C.; Kong, N.; Ma, H.; Chen, Q. Comparative Analysis of the PIN Auxin Transporter Gene Family in Different Plant Species: A Focus on Structural and Expression Profiling of PINs in Solanum tuberosum. Int. J. Mol. Sci. 2019, 20, 3270. [Google Scholar] [CrossRef] [Green Version]
  54. Xu, M.; Zhu, L.; Shou, H.; Wu, P. A PIN1 Family Gene, OsPIN1, involved in Auxin-dependent Adventitious Root Emergence and Tillering in Rice. Plant. Cell Physiol. 2005, 46, 1674–1681. [Google Scholar] [CrossRef]
  55. Carraro, N.; Forestan, C.; Canova, S.; Traas, J.; Varotto, S. ZmPIN1a and ZmPIN1b Encode Two Novel Putative Candidates for Polar Auxin Transport and Plant Architecture Determination of Maize. Plant. Physiol. 2006, 142, 254–264. [Google Scholar] [CrossRef] [PubMed] [Green Version]
  56. Čovanová, M.; Sauer, M.; Rychtář, J.; Friml, J.; Petrášek, J.; Zažímalová, E. Overexpression of the auxin binding protein1 modulates PIN-dependent auxin transport in tobacco cells. PLoS ONE 2013, 8, e70050. [Google Scholar] [CrossRef] [PubMed] [Green Version]
  57. Sun, H.; Feng, F.; Liu, J.; Zhao, Q. Nitric Oxide Affects Rice Root Growth by Regulating Auxin Transport Under Nitrate Supply. Front. Plant. Sci. 2018, 9, 659. [Google Scholar] [CrossRef] [PubMed]
  58. Zhang, Y.; Hartinger, C.; Wang, X.; Friml, J. Directional auxin fluxes in plants by intramolecular domain–domain coevolution of PIN auxin transporters. New Phytol. 2020, 227, 1406–1416. [Google Scholar] [CrossRef]
  59. Kesawat, M.S.; Das, B.K.; Bhaganagare, G.R. Manorama Genome-wide identification, evolutionary and expression analyses of putative Fe–S biogenesis genes in rice (Oryza sativa). Genome 2012, 55, 571–583. [Google Scholar] [CrossRef]
  60. Gill, B.S.; Appels, R.; Botha, A.-M.; Buell, C.R.; Bennetzen, J.L.; Chalhoub, B.; Chumley, F.; Dvořák, J.; Iwanaga, M.; Keller, B.; et al. A Workshop Report on Wheat Genome Sequencing: International Genome Research on Wheat Consortium. Genetics 2004, 168, 1087–1096. [Google Scholar] [CrossRef] [PubMed] [Green Version]
  61. The International Wheat Genome Sequencing Consortium (IWGSC); Appels, R.; Eversole, K.; Stein, N.; Feuillet, C.; Keller, B.; Rogers, J.; Pozniak, C.J.; Choulet, F.; Distelfeld, A.; et al. Shifting the limits in wheat research and breeding using a fully annotated reference genome. Science 2018, 361, eaar7191. [Google Scholar] [CrossRef] [PubMed] [Green Version]
  62. Kumar, P.; Yadava, R.; Gollen, B.; Kumar, S.; Verma, R.K.; Yadav, S. Nutritional contents and medicinal properties of wheat: A review. Life Sci. Med. Res. 2011, 22, 1–10. [Google Scholar]
  63. Chen, Y.; Liu, T.; Tian, X.; Wang, X.; Li, M.; Wang, S.; Wang, Z. Effects of plastic film combined with straw mulch on grain yield and water use efficiency of winter wheat in Loess Plateau. Field Crop. Res. 2015, 172, 53–58. [Google Scholar] [CrossRef]
  64. Duan, Y.; Tao, X.; Zhao, H.; Xiao, X.; Li, M.; Wang, J.; Zhou, M. Activity of Demethylation Inhibitor Fungicide Metconazole on Chinese Fusarium graminearum Species Complex and Its Application in Carbendazim-Resistance Management of Fusarium Head Blight in Wheat. Plant. Dis. 2019, 103, 929–937. [Google Scholar] [CrossRef] [PubMed]
  65. Afzal, F.; Chaudhari, S.K.; Gul, A.; Farooq, A.; Ali, H.; Nisar, S.; Sarfraz, B.; Shehzadi, K.J.; Mujeeb-Kazi, A. Bread Wheat (Triticum aestivum L.) Under Biotic and Abiotic Stresses: An Overview. In Crop Production and Global Environmental Issues; Hakeem, K., Ed.; Springer: Cham, Switzerland, 2015; pp. 293–317. [Google Scholar] [CrossRef]
  66. Kumar, R.; Masthigowda, M.H.; Kaur, A.; Bhusal, N.; Pandey, A.; Kumar, S.; Mishra, C.; Singh, G.P. Identification and characterization of multiple abiotic stress tolerance genes in wheat. Mol. Biol. Rep. 2020, 47, 8629–8643. [Google Scholar] [CrossRef] [PubMed]
  67. Fleury, D.; Jefferies, S.; Kuchel, H.; Langridge, P. Genetic and genomic tools to improve drought tolerance in wheat. J. Exp. Bot. 2010, 61, 3211–3222. [Google Scholar] [CrossRef] [Green Version]
  68. Yang, Z.; Nielsen, R. Mutation-Selection Models of Codon Substitution and Their Use to Estimate Selective Strengths on Codon Usage. Mol. Biol. Evol. 2008, 25, 568–579. [Google Scholar] [CrossRef] [Green Version]
  69. Sauer, M.; Kleine-Vehn, J. PIN-FORMED and PIN-LIKES auxin transport facilitators. Development 2019, 146, 15. [Google Scholar] [CrossRef] [Green Version]
  70. Sauer, M.; Grebe, M. Plant cell biology: PIN polarity maintained. Curr. Biol. 2021, 31, R449–R451. [Google Scholar] [CrossRef] [PubMed]
  71. Palovaara, J.; Hallberg, H.; Stasolla, C.; Luit, B.; Hakman, I. Expression of a gymnosperm PIN homologous gene correlates with auxin immunolocalization pattern at cotyledon formation and in demarcation of the procambium during Picea abies somatic embryo development and in seedling tissues. Tree Physiol. 2010, 30, 479–489. [Google Scholar] [CrossRef] [Green Version]
  72. Jordan, I.K.; Makarova, K.S.; Spouge, J.L.; Wolf, Y.I.; Koonin, E.V. Lineage-Specific Gene Expansions in Bacterial and Archaeal Genomes. Genome Res. 2001, 11, 555–565. [Google Scholar] [CrossRef] [PubMed] [Green Version]
  73. Lespinet, O.; Wolf, Y.I.; Koonin, E.V.; Aravind, L. The role of lineage-specific gene family expansion in the evolution of eu-karyotes. Genome Res. 2002, 12, 1048–1059. [Google Scholar] [CrossRef] [PubMed] [Green Version]
  74. Forestan, C.; Farinati, S.; Varotto, S. The maize PIN gene family of auxin transporters. Front. Plant. Sci. 2012, 3, 16. [Google Scholar] [CrossRef] [PubMed] [Green Version]
  75. Lawton-Rauh, A. Evolutionary dynamics of duplicated genes in plants. Mol. Phylogenetics Evol. 2003, 29, 396–409. [Google Scholar] [CrossRef]
  76. Moore, R.C.; Purugganan, M.D. The early stages of duplicate gene evolution. Proc. Natl. Acad. Sci. USA 2003, 100, 15682–15687. [Google Scholar] [CrossRef] [Green Version]
  77. Roumeliotis, E.; Kloosterman, B.; Oortwijn, M.; Visser, R.G.F.; Bachem, C.W.B. The PIN family of proteins in potato and their putative role in tuberization. Front. Plant. Sci. 2013, 4, 524. [Google Scholar] [CrossRef] [PubMed] [Green Version]
  78. Hernandez-Garcia, C.M.; Finer, J.J. Identification and validation of promoters and cis-acting regulatory elements. Plant. Sci. 2014, 217–218, 109–119. [Google Scholar] [CrossRef] [Green Version]
  79. Roy, A.L.; Sen, R.; Roeder, R.G. Enhancer–promoter communication and transcriptional regulation of Igh. Trends Immunol. 2011, 32, 532–539. [Google Scholar] [CrossRef] [PubMed] [Green Version]
  80. Roy, A.L.; Singer, D.S. Core promoters in transcription: Old problem, new insights. Trends Biochem. Sci. 2015, 40, 165–171. [Google Scholar] [CrossRef] [PubMed] [Green Version]
  81. Zhang, Y.; Wong, C.-H.; Birnbaum, R.; Li, G.; Favaro, R.; Ngan, C.Y.; Lim, J.; Tai, E.; Poh, H.M.; Wong, E.; et al. Chromatin connectivity maps reveal dynamic promoter–enhancer long-range associations. Nat. Cell Biol. 2013, 504, 306–310. [Google Scholar] [CrossRef] [Green Version]
  82. Cheng, Y.; Tang, Q.; Li, Y.; Zhang, Y.; Zhao, C.; Yan, J.; You, H. Folding/unfolding kinetics of G-quadruplexes upstream of the P1 promoter of the human BCL-2 oncogene. J. Biol. Chem. 2019, 294, 5890–5895. [Google Scholar] [CrossRef] [PubMed]
  83. Banerjee, J.; Sahoo, D.K.; Dey, N.; Houtz, R.L.; Maiti, I.B. An intergenic region shared by At4g35985 and At4g35987 in Arabidopsis thaliana is a tissue specific and stress inducible bidirectional promoter analyzed in transgenic Arabidopsis and to-bacco plants. PLoS ONE 2013, 8, e79622. [Google Scholar]
  84. Yue, R.; Tie, S.; Sun, T.; Zhang, L.; Yang, Y.; Qi, J.; Yan, S.; Han, X.; Wang, H.; Shen, C. Genome-Wide Identification and Expression Profiling Analysis of ZmPIN, ZmPILS, ZmLAX and ZmABCB Auxin Transporter Gene Families in Maize (Zea mays L.) under Various Abiotic Stresses. PLoS ONE 2015, 10, e0118751. [Google Scholar] [CrossRef] [PubMed]
  85. Ganguly, A.; Lee, S.H.; Cho, M.; Lee, O.R.; Yoo, H.; Cho, H.-T. Differential Auxin-Transporting Activities of PIN-FORMED Proteins in Arabidopsis Root Hair Cells. Plant. Physiol. 2010, 153, 1046–1061. [Google Scholar] [CrossRef] [Green Version]
  86. Juárez, M.J.A.; Cárdenas, R.H.; Villa, J.N.S.; O’Connor, D.; Sluis, A.; Hake, S.; Ordaz-Ortiz, J.; Terry, L.; Simpson, J. Functionally different PIN proteins control auxin flux during bulbil development in Agave tequilana. J. Exp. Bot. 2015, 66, 3893–3905. [Google Scholar] [CrossRef] [Green Version]
  87. Xu, W.; Jia, L.; Baluška, F.; Ding, G.; Shi, W.; Ye, N.; Zhang, J. PIN2 is required for the adaptation of Arabidopsis roots to alkaline stress by modulating proton secretion. J. Exp. Bot. 2012, 63, 6105–6114. [Google Scholar] [CrossRef] [Green Version]
  88. Shibasaki, K.; Uemura, M.; Tsurumi, S.; Rahman, A. Auxin Response in Arabidopsis under Cold Stress: Underlying Molecular Mechanisms. Plant. Cell 2010, 21, 3823–3838. [Google Scholar] [CrossRef] [Green Version]
  89. Kleine-Vehn, J.; Huang, F.; Naramoto, S.; Zhang, J.; Michniewicz, M.; Offringa, R.; Friml, J. PIN Auxin Efflux Carrier Polarity Is Regulated by PINOID Kinase-Mediated Recruitment into GNOM-Independent Trafficking in Arabidopsis. Plant. Cell 2010, 21, 3839–3849. [Google Scholar] [CrossRef] [Green Version]
  90. Hall, T.A. BioEdit: A User-Friendly Biological Sequence Alignment Editor and Analysis Program. For Windows 95/98/NT, Nucleic Acids Symposium Series; Information Retrieval Ltd.: London, UK, 1999; pp. 95–98. [Google Scholar]
  91. Wang, Y.; Tang, H.; DeBarry, J.; Tan, X.; Li, J.; Wang, X.; Lee, T.-H.; Jin, H.; Marler, B.; Guo, H.; et al. MCScanX: A toolkit for detection and evolutionary analysis of gene synteny and collinearity. Nucleic Acids Res. 2012, 40, e49. [Google Scholar] [CrossRef] [Green Version]
  92. Chen, C.; Chen, H.; Zhang, Y.; Thomas, H.R.; Frank, M.H.; He, Y.; Xia, R. TBtools: An Integrative Toolkit Developed for Interactive Analyses of Big Biological Data. Mol. Plant. 2020, 13, 1194–1202. [Google Scholar] [CrossRef]
  93. Kozlowski, L.P. IPC–isoelectric point calculator. Biol. Direct 2016, 11, 55. [Google Scholar] [CrossRef] [Green Version]
  94. Kozlowski, L.P. IPC 2.0: Prediction of isoelectric point and pKa dissociation constants. Nucleic Acids Res. 2021, 49, W285–W292. [Google Scholar] [CrossRef] [PubMed]
  95. Tian, T.; Liu, Y.; Yan, H.; You, Q.; Yi, X.; Du, Z.; Xu, W.; Su, Z. AgriGO v2. 0: A GO analysis toolkit for the agricultural community, 2017 update. Nucleic Acids Res. 2017, 45, W122–W129. [Google Scholar] [CrossRef] [PubMed]
  96. Kim, D.K.; Kesawat, M.S.; Hong, C.B. One gene member of the ADP-ribosylation factor family is heat-inducible and enhances seed germination in Nicotiana tabacum. Genes Genom. 2017, 39, 1353–1365. [Google Scholar] [CrossRef]
  97. Kesawat, M.S.; Kim, D.K.; Zeba, N.; Suh, M.C.; Xia, X.; Hong, C.B. Ectopic RING zinc finger gene from hot pepper induces totally different genes in lettuce and tobacco. Mol. Breed. 2018, 38, 70. [Google Scholar] [CrossRef] [Green Version]
  98. Rao, X.; Huang, X.; Zhou, Z.; Lin, X. An improvement of the 2(−ΔΔCT) method for quantitative real-time polymerase chain reaction data analysis. Biostat. Bioinform. Biomath. 2013, 3, 71–85. [Google Scholar]
Figure 1. Phylogenetic analysis of PIN proteins among wheat (44), Arabidopsis (8), and rice (12) using MEGAX by the neighbor joining method.
Ijms 22 07396 g001
Figure 2. Genomic distribution of identified PIN genes on the 21 chromosomes of wheat and within the three subgenomes. (A) Schematic representations of the chromosomal distribution of PIN genes on the 21 chromosomes of wheat and the name of the gene on the right side. The colored round circle on the chromosomes indicates the position of the PIN genes. The chromosome numbers of the three subgenomes are indicated at the top of each bar. (B) Distribution of PIN genes in the three subgenomes. (C) Distribution of PIN genes across 21 chromosomes.
Ijms 22 07396 g002aIjms 22 07396 g002b
Figure 3. Syntenic relationships of TaPIN genes between Aegilops tauschii, Brachypodium distachyon, Oryza sativa and Arabidopsis thaliana. The gray lines in the background represent the collinear blocks within Triticum aestivum and other plant genomes, while the red lines highlight the syntenic PIN gene pairs.
Ijms 22 07396 g003
Figure 4. Exon–intron organization of the TaPIN genes. Yellow boxes represent exons, untranslated regions (UTRs) are indicated by blue boxes, and black lines represent introns. The lengths of the boxes and lines are scaled based on gene length. The exon and intron sizes can be estimated using the scale at the bottom.
Ijms 22 07396 g004
Figure 5. Conserved motifs of TaPIN genes elucidated by MEME. (A) Colored boxes representing different conserved motifs having different sequences and sizes. (B) Sequence logo conserved motif of the wheat PIN proteins. The overall height of each stack represents the degree of conservation at this position, while the height of the individual letters within each stack indicates the relative frequency of the corresponding amino acids.
Ijms 22 07396 g005aIjms 22 07396 g005b
Figure 6. Predicted 3D structures and transmembrane helix of seven selected TaPIN proteins. (A) Three-dimensional structure and (B) TM helix of seven TaPINs representing each group of a phylogenetic tree. The cytoplasmic and extracellular sides of the membrane are labeled, and the start and end of each transmembrane helix are indicated with a number.
Ijms 22 07396 g006aIjms 22 07396 g006b
Figure 7. Putative cis-acting regulatory elements (CAREs) of the TaPIN gene family. The CAREs analysis was performed with the 2 kb upstream region using the PlantCARE online server. (A) Hormone-responsive elements, stress-responsive elements, growth and development-related elements, light-responsive elements, and other elements with unknown functions are shown by different colors. (B) Most commonly occurring CAREs in TaPINs.
Ijms 22 07396 g007aIjms 22 07396 g007b
Figure 8. Heatmap representing the expression pattern of TaPIN genes in various developmental stages. TPM values were directly used to create the heatmap.
Ijms 22 07396 g008
Figure 9. Quantitative real-time PCR analysis of selected TaPIN genes in response to drought and heat stress to verify RNA seq data. The wheat actin gene was used as the internal control to standardize the RNA samples for each reaction. Asterisk indicates significant differences compared with control over bars representing results of Tukey HSD test at the <0.05 and <0.001 levels (* p < 0.05 and *** p < 0.001). Error bars show standard deviation. Data are mean ± SD (n = 3).
Ijms 22 07396 g009aIjms 22 07396 g009b
Figure 10. Protein–protein interaction analysis of TaPINs proteins. Protein–protein interaction network produced by STRINGV9.1, where each node represents a protein and each edge represents an interaction, colored by evidence type.
Ijms 22 07396 g010
Table 1. Nomenclature and characteristics of the putative PIN-FORMED (PIN) proteins in wheat.
Proposed Gene NameGene IDGenomic LocationOrientationCDS Length (bp)Intron NumberProtein Length (aa)Molecular Weight (kDa)Isoelectric Point (pI)GRAVYPredicted Subcellular Localization
TaPIN1TraesCS1A02G4154001A:574359017–574359996Reverse1800259963.578.6320.354Plasma membrane
TaPIN2TraesCS1B02G4454001B:665407466–665408862Reverse1794259763.378.9890.297Plasma membrane
TaPIN3TraesCS1D02G4229001D:478154308–478155466Reverse1791259663.189.120.321Plasma membrane
TaPIN4TraesCS3A02G2315003A:432041807–432043538Forward1788259563.726.6190.325Plasma membrane
TaPIN5TraesCS3A02G2437003A:456920851–456922269Reverse1074035739.198.6030.795Plasma membrane
TaPIN6TraesCS3A02G3313003A:575870221–575871321Reverse1299143245.988.8190.554Plasma membrane
TaPIN7TraesCS3A02G4267003A:669623930–669624178Reverse1134037740.559.1610.699Plasma membrane
TaPIN8TraesCS3B02G2607003B:418660347–418660613Forward1830160965.387.540.243Plasma membrane
TaPIN9TraesCS3B02G2765003B:446634435–446635854Forward1074035739.168.6030.809Plasma membrane
TaPIN10TraesCS3B02G3615003B:572835666–572837001Reverse1287142845.749.0640.537Plasma membrane
TaPIN11TraesCS3B02G4629003B:705706664–705706909Reverse1107136839.78.9980.675Plasma membrane
TaPIN12TraesCS3D02G2219003D:302847280–302848826Reverse1773059062.696.4650.319Plasma membrane
TaPIN13TraesCS3D02G2477003D:346727914–346729331Forward1074035739.18.6030.809Plasma membrane
TaPIN14TraesCS3D02G3248003D:437732979–437734144Reverse1296343145.928.6890.592Plasma membrane
TaPIN15TraesCS3D02G4216003D:533875425–533875673Reverse1137137840.499.1470.714Plasma membrane
TaPIN16TraesCS4A02G1881004A:466939085–466940349Reverse1707156860.788.3610.336Plasma membrane
TaPIN17TraesCS4B02G1301004B:170928310–170929402Forward1701156660.558.3740.328Plasma membrane
TaPIN18TraesCS4D02G1253004D:109470858–109471950Forward1701256660.598.3610.327Plasma membrane
TaPIN19TraesCS5A02G2845005A:492633348–492636528Reverse1098036538.678.280.714Plasma membrane
TaPIN20TraesCS5A02G2857005A:493780035–493782506Forward1164038741.368.860.559Plasma membrane
TaPIN21TraesCS5A02G2860005A:493815389–493817262Reverse1074035737.928.9480.606Plasma membrane
TaPIN22TraesCS5B02G2835005B:469121420–469124421Reverse1107036838.848.280.699Plasma membrane
TaPIN23TraesCS5B02G2836005B:469292031–469299978Reverse1095136438.967.5190.621Plasma membrane
TaPIN24TraesCS5B02G2849005B:470436673–470438746Forward1134137740.518.1490.606Plasma membrane
TaPIN25TraesCS5B02G2850005B:470512790–470515294Forward1164138741.479.0170.517Plasma membrane
TaPIN26TraesCS5D02G2918005D:389457955–389460969Reverse1104236738.878.8680.672Plasma membrane
TaPIN27TraesCS5D02G2930005D:390372139–390374171Forward1134137740.48.1470.621Plasma membrane
TaPIN28TraesCS5D02G2931005D:390418535–390421740Forward1164138741.488.8380.537Plasma membrane
TaPIN29TraesCS5D02G2933005D:390504794–390506554Forward1134137740.039.0590.634Plasma membrane
TaPIN30TraesCS6A02G3086006A:543394829–543395365Forward1767158863.768.2360.174Plasma membrane
TaPIN31TraesCS6B02G3373006B:593711958–593712494Forward1566352156.797.4070.011Plasma membrane
TaPIN32TraesCS6D02G2878006D:397082369–397082905Forward1770158963.868.2360.164Plasma membrane
TaPIN33TraesCS7A02G1906007A:148415130–148415675Forward1764158764.028.6520.176Plasma membrane
TaPIN34TraesCS7A02G2588007A:250325040–250326673Reverse1104136739.238.1260.654Plasma membrane
TaPIN35TraesCS7A02G4924007A:681011797–681013386Reverse1899163267.39.2560.254Plasma membrane
TaPIN36TraesCS7B02G0955007B:109702420–109702965Forward1761258663.98.6520.183Plasma membrane
TaPIN37TraesCS7B02G3315007B:586716404–586721044Forward1221240643.876.6190.536Plasma membrane
TaPIN38TraesCS7B02G3592007B:621295197–621300495Forward1182139341.635.9290.478Plasma membrane
TaPIN39TraesCS7B02G3593007B:621396217–621403628Reverse1200139942.837.9830.589Plasma membrane
TaPIN40TraesCS7B02G3981007B:664108583–664110165Forward1899163267.269.2560.252Plasma membrane
TaPIN41TraesCS7D02G1916007D:146862944–146863489Forward1761158663.868.6520.183Plasma membrane
TaPIN42TraesCS7D02G2597007D:235396162–235396730Reverse1143038040.58.1330.669Plasma membrane
TaPIN43TraesCS7D02G4469007D:567514947–567515186Reverse858028530.226.4560.496Plasma membrane
TaPIN44TraesCS7D02G4788007D:589514264–589515825Forward1902163367.419.3230.248Plasma membrane
ID: identity; bp: base pair; aa: amino acids; pI: isoelectric point; MW: molecular weight; kDa: kilodalton.
Table 2. Number of PIN proteins in different plant species.
Plant SpeciesGenome Size (Approx.)Coding GenesPIN Genes
Triticum aestivum (6n)17 Gb107,89144
Oryza sativa (2n)500 Mb37,96012
Arabidopsis thaliana (2n)135 MB27,6558
Zea mays (2n)2.4 Gb39,59114
Glycine max (2n)1.15 Gb55,89723
Nicotiana tabacum (4n)4.5 Gb61,52629
Publisher’s Note: MDPI stays neutral with regard to jurisdictional claims in published maps and institutional affiliations.

