Article

Genome-Wide Identification of GRAS Gene Family and Their Responses to Abiotic Stress in Medicago sativa

1
College of Grassland Science and Technology, China Agricultural University, Beijing 100193, China
2
Key Laboratory of Pratacultural Science, Beijing Municipality, China Agricultural University, Beijing 100193, China
*
Authors to whom correspondence should be addressed.
Int. J. Mol. Sci. 2021, 22(14), 7729; https://0-doi-org.brum.beds.ac.uk/10.3390/ijms22147729
Submission received: 31 May 2021 / Revised: 15 July 2021 / Accepted: 16 July 2021 / Published: 20 July 2021
(This article belongs to the Special Issue Biological Networks of Specialized Metabolites and Plants)

Abstract

:
Alfalfa (Medicago sativa) is a high-quality legume forage crop worldwide, and alfalfa production is often threatened by abiotic environmental stresses. GRAS proteins are important transcription factors that play a vital role in plant development, as well as in response to environmental stress. In this study, the availability of alfalfa genome “Zhongmu No.1” allowed us to identify 51 GRAS family members, i.e., MsGRAS. MsGRAS proteins could be classified into nine subgroups with distinct conserved domains, and tandem and segmental duplications were observed as an expansion strategy of this gene family. In RNA-Seq analysis, 14 MsGRAS genes were not expressed in the leaf or root, 6 GRAS genes in 3 differentially expressed gene clusters were involved in the salinity stress response in the leaf. Moreover, qRT-PCR results confirmed that MsGRAS51 expression was induced under drought stress and hormone treatments (ABA, GA and IAA) but down-regulated in salinity stress. Collectively, our genome-wide characterization, evolutionary, and expression analysis suggested that the MsGRAS proteins might play crucial roles in response to abiotic stresses and hormonal cues in alfalfa. For the breeding of alfalfa, it provided important information on stress resistance and functional studies on MsGRAS and hormone signaling.

1. Introduction

Transcription factors (TFs) as regulatory proteins could bind to specific DNA sequences (cis-acting elements), which might be located in the promoters of target genes, and play a vital role in plant development, as well as in response to abiotic stresses, such as drought, salt, chilling and heat [1]. The GRAS transcription factors are proposed to be plant-specific regulation proteins, which are supported by their possession of certain structural features [2]. The GRAS family was defined, after GAI (gibberellic acid insensitive), RGA (repressor of GA1–3 mutant), and scarecrow (SCR) were identified as family members. GAI and RGA play a vital role in the gibberellin-dependent signal transduction process, and SCR is involved in regulating the radial tissue differentiation in roots [3,4,5]. Typically, the GRAS protein sequences consist of 400–700 amino acids (aa), including a highly conserved C-terminal and a variable N-terminal. Its C-terminal is composed of five conserved domains, namely SAW, LRI, LRII, PFYRE, and VHIID [2,6]. The N-terminal is the functional component of the GRAS protein, as its IDRs (intrinsically disordered regions) could bind with different other proteins [7].
Recently, the GRAS gene family have received genome-wide characterization in various plant species, such as Arabidopsis thaliana [8], rice (Oryza sativa) [9], soybean (Glycine max) [10], tomato (Solanum lycopersicum) [11], pepper (Capsicum annuum) [12], Medicago truncatula [13], Camellia sinensis [14], and tartary buckwheat (Fagopyrum tataricum) [15]. According to the conserved motifs and sequence similarity, the GRAS family members in model plants have been separated into eight distinct subfamilies, including DELLA, SCL3 (Scarecrow-like), SCR, SHR (Short-root), LAS (Lateral suppressor), PAT1 (phytochrome A signal transduction 1) [16], HAM (Hairy meristem), and LISCL [9]. The GRAS gene families have been identified, and their subfamily classification is different in multiple plants. For example, the Chinese cabbage GRAS family contains 48 genes, which are divided into 8 subfamilies according to Arabidopsis classification [17]. The 47 GRAS genes in tartary buckwheat were classified into 10 subfamilies: LISCL, HAM, DELLA, SCR, PAT1, SCL4/7, LAS, SHR, SCL3, and DLT [15]. A total of 50 CaGRAS members were identified in the pepper genome and divided into 10 subfamilies [12]. There are 150 GRAS proteins in the Gossypium hirsutum genome. G-GRAS, out of 15 subfamilies, is a unique one in cotton [18]. A total of 116 GmGRAS genes could be categorized into 9 subfamilies, with 1 gene of GmGRAS55 unclassified in G. max [10]. Notably, 37 GRAS genes were grouped into up to 17 GRAS subfamilies in Lagenaria siceraria [19].
GRAS proteins drew a lot of research attention, especially in 5 major directions, i.e., gibberellic acid (GA) signaling, plant development, and stress responses. Firstly, DELLA proteins, as key GRAS negative regulators, regulate gene expression of the positive regulators in GA signaling, such as GA 20-oxidase, GA receptor, and a transcriptional regulator of SCARECROW-LIKE3 (SCL3), and enable the regulation of GA feedback [20]. GAs could induce the degradation of repressors DELLA proteins, which are encoded by GAI, RGA, RGL1, RGL2, and RGL3 in Arabidopsis, with a conserved N-terminal domain named “DELLA” [4,21,22,23]. Secondly, GRAS family members are involved in diverse fundamental processes of plant growth and development. For example, the combination of SHR and SCR proteins forms a SCR/SHR complex, which is involved in the formation of the root radial pattern [3]. LAS protein participates in the growth and development of collateral buds in Arabidopsis [24]. The reduced expression level of GRAS2 (PAT1 subfamily) resulted in the decreased weight in tomatoes [25]. In the ham mutant with a loss of GRAS family member of HAM in Petunia hybrida, shoot meristems differentiate post-embryonically as continuations of the subtending stem [26]. Silencing the SLFSR gene in tomato can significantly prolong the shelf-life of fruit, decrease the rate of cell degradation, and reduce the expression level of cell wall modification-related genes [27], while overexpression of SLGRAS24 inhibits cell division and expansion in the early development of tomato fruit [28]. Thirdly, GRAS proteins are considered to act as key regulators to participate in various abiotic stress. For instance, the PESCL7 gene of poplar (Populus euphratica) was overexpressed in A. thaliana, and it showed a stronger tolerance to salt and drought stress, with increased enzyme activity, in transgenic seedlings [29]. The GRAS transcription factor BrLAS from Brassica rapa is involved in drought stress tolerance in transgenic Arabidopsis [30].
The alfalfa genome assemblies of “Zhongmu No.1”, “XinJiangDaYe”, and “M. sativa spp. caerulea voucher” [31,32,33] were released in 2020, and it is more convenient to screen the entire GRAS gene family, considering the important role of GRAS proteins in plants and the lack of previous GRAS gene family information in alfalfa. In this study, we systematically determined 51 GRAS transcription factors in alfalfa, based on the best assembly of “Zhongmu No.1”, and classified them into 9 major groups. We carried out a comprehensive analysis on phylogenetic construction, conserved motif, chromosomal distribution, gene structure, intron/exon organization, and protein structure. Furthermore, the expression profiles of the GRAS members showed a significant difference under salinity and drought stress treatments. We selected six MsGRAS genes to confirm their expression response to abiotic stresses and hormone treatments via qRT-PCR experiment. The results provided a basis for further investigating the roles of MsGRAS proteins and stress breeding in alfalfa.

2. Results

2.1. Identification and Multiple Sequence Analysis of GRAS Genes in Alfalfa

We firstly retrieved 32 GRAS proteins (AtGRAS) in A. thaliana from the TAIR website (https://www.arabidopsis.org/ accessed on 11 September 2020). In order to obtain the GRAS protein of alfalfa, we used the Arabidopsis AtGRAS proteins as a query in a BLASTP search against the M. sativa genome of “Zhongmu No.1” [33], which was downloaded from the FIGSHARE database (https://figshare.com/ accessed on 11 September 2020). Subsequently, the online bioinformatics tool of Batch Web CD Search Tool (BWCDST) on the NCBI website (https://0-www-ncbi-nlm-nih-gov.brum.beds.ac.uk/Structure/bwrpsb/bwrpsb.cgi accessed on 11 September 2020) identified about 51 sequences containing the conserved GRAS domain. The 51 putative MsGRAS proteins were finally determined using the Pfam database (http://pfam.xfam.org/ accessed on 11 September 2020), based on the conserved GRAS domain (PF03514.13), and used for further analysis (Table S1). The 51 alfalfa GRAS genes were mapped onto eight alfalfa chromosomes (Chr1–8) and named based on their chromosomal locations (Figure 1a). The alfalfa GRAS genes display uneven distributions across the whole eight chromosomes. Chr1 and Chr6 contained one (1.9%, i.e., MsG0180004788.01 (MsGRAS1)) and two (3.9%, MsG0680032758.01 (MsGRAS36) and MsG0680033030.01 (MsGRAS37)) MsGRAS genes, respectively. By contrast, most of the GRAS protein are localized on Chr2 (n = 10, 19.6%), Chr3 (n = 5, 9.8%), Chr4 (n = 10, 19.6%), Chr5 (n = 9, 17.6%), Chr7 (n = 6, 11.8%), and Chr8 (n = 8, 15.7%). In this study, we found that 12 pairs of GRAS genes were evidence of tandem duplication events, and clustered into 5 regions on alfalfa Chr2 (MsRAS2/3, MsRAS3/4, MsRAS7/8, MsRAS8/9, MsRAS10/11), Chr4 (MsRAS20/21), Chr5 (MsRAS29/30, MsRAS30/32, MsRAS31/33, MsRAS32/33), Chr7 (MsRAS39/40), and Chr8 (MsRAS47/48). In addition to tandem duplication events, three segmental duplication events were also identified for ten MsGRAS genes, i.e., MsGRAS1 vs. MsGRAS43, MsGRAS7/10 vs. MsGRAS18/19/20, and MsGRAS28 vs. MsGRAS47/48, which are located on chromosomes of 1, 2, 4, 5, 7, and 8 (Figure 1b).
We carried out a collinearity analysis on MsGRAS genes with those in a monocotyledonous plant of rice (Oryza sativa) and three dicotyledonous plants of Arabidopsis, soybean, and M. truncatula (Figure 2), to further understand the collinearity of the MsGRAS genes. MsGRAS genes displayed various numbers of syntenic lines with four species. A total of 36 MsGRAS genes showed a syntenic relationship with those in soybean, and 28 corresponding orthologs were identified between M. sativa and M. truncatula. Meanwhile, only 6 and 12 MsGRAS genes showed syntenic relationships with those in O. sativa and A. thaliana, respectively (Figure 2 and Table S2).
Sequence analyses revealed that the size of the MsGRAS proteins vary greatly in length, from 98 aa (MsGRAS24) to 1002 aa (MsGRAS12). The proteins molecular weight ranged from 23.44 kD (MsGRAS49) to 112.7 kD (MsGRAS12), and the isoelectric point (pI) ranged from 4.77 (MsGRAS45) to 9.24 (MsGRAS15). Subcellular localization prediction by WoLF PSORT tool showed that 33 MsGRAS proteins are located in the nucleus, 12 in the cytoplasmic, and 6 in the chloroplast (Table 1), while TargetP prediction results were all “Other”, rather than chloroplast or mitochondria. The results showed that MsGRAS protein might function in diverse microcellular environments.
The online MEME search tool was used to further look into the conversation of MsGRAS proteins, and 10 distinct conserved motifs (named as motif 1–10) were found (Figure 3a,b and Table S3). Based on the alignment of predicted GRAS domain sequences, we found that most of the MsGRAS proteins (94%) contained motifs of 4, 6, and 7, and 2 copies of motif 7 were separated by motifs of 2 and 3 in MsGRAS18. Four protein pairs of MsGRAS2/3, MsGRAS7/8, MsGRAS10/11, and MsGRAS39/40 shared identical motif patterns, and MsGRAS24 held only three motifs of 1, 5, and 10. Multiple sequence alignments showed that most of the MsGRAS proteins possess the N-terminal and the highly conserved C-terminal, and the conserved domains located in the C-terminal included VHIID, LHRI, and SAW. Among the whole MsGRAS proteins, 47 MsGRAS contain VHIID and LHRI domains, and 49 proteins contain SAW domains (Figure 4 and Figures S1–S3). The motifs were located in the four GRAS domains, including LHRI (motif1, motif5, motif6, motif10), VHIID (motif3, motif7), PFYRE (motif2, motif8), and SAW (motif4, motif9), and shared across almost all MsGRAS members. We further found that MsGRAS24 with the gene ID of MsG0480021771.01.T01 is wrongly annotated in the alfalfa genome reference of “Zhongmu No.1”. Based on our unpublished PacBio sequencing dataset for a pool of root, stem, leaf, etc., in alfalfa “Zhongmu No.1”, one full-length transcript was retrieved for this gene (Table S1), and based on the genomic coordinates of this transcript, its gene annotation and structure were updated without long introns (Figure 3c).

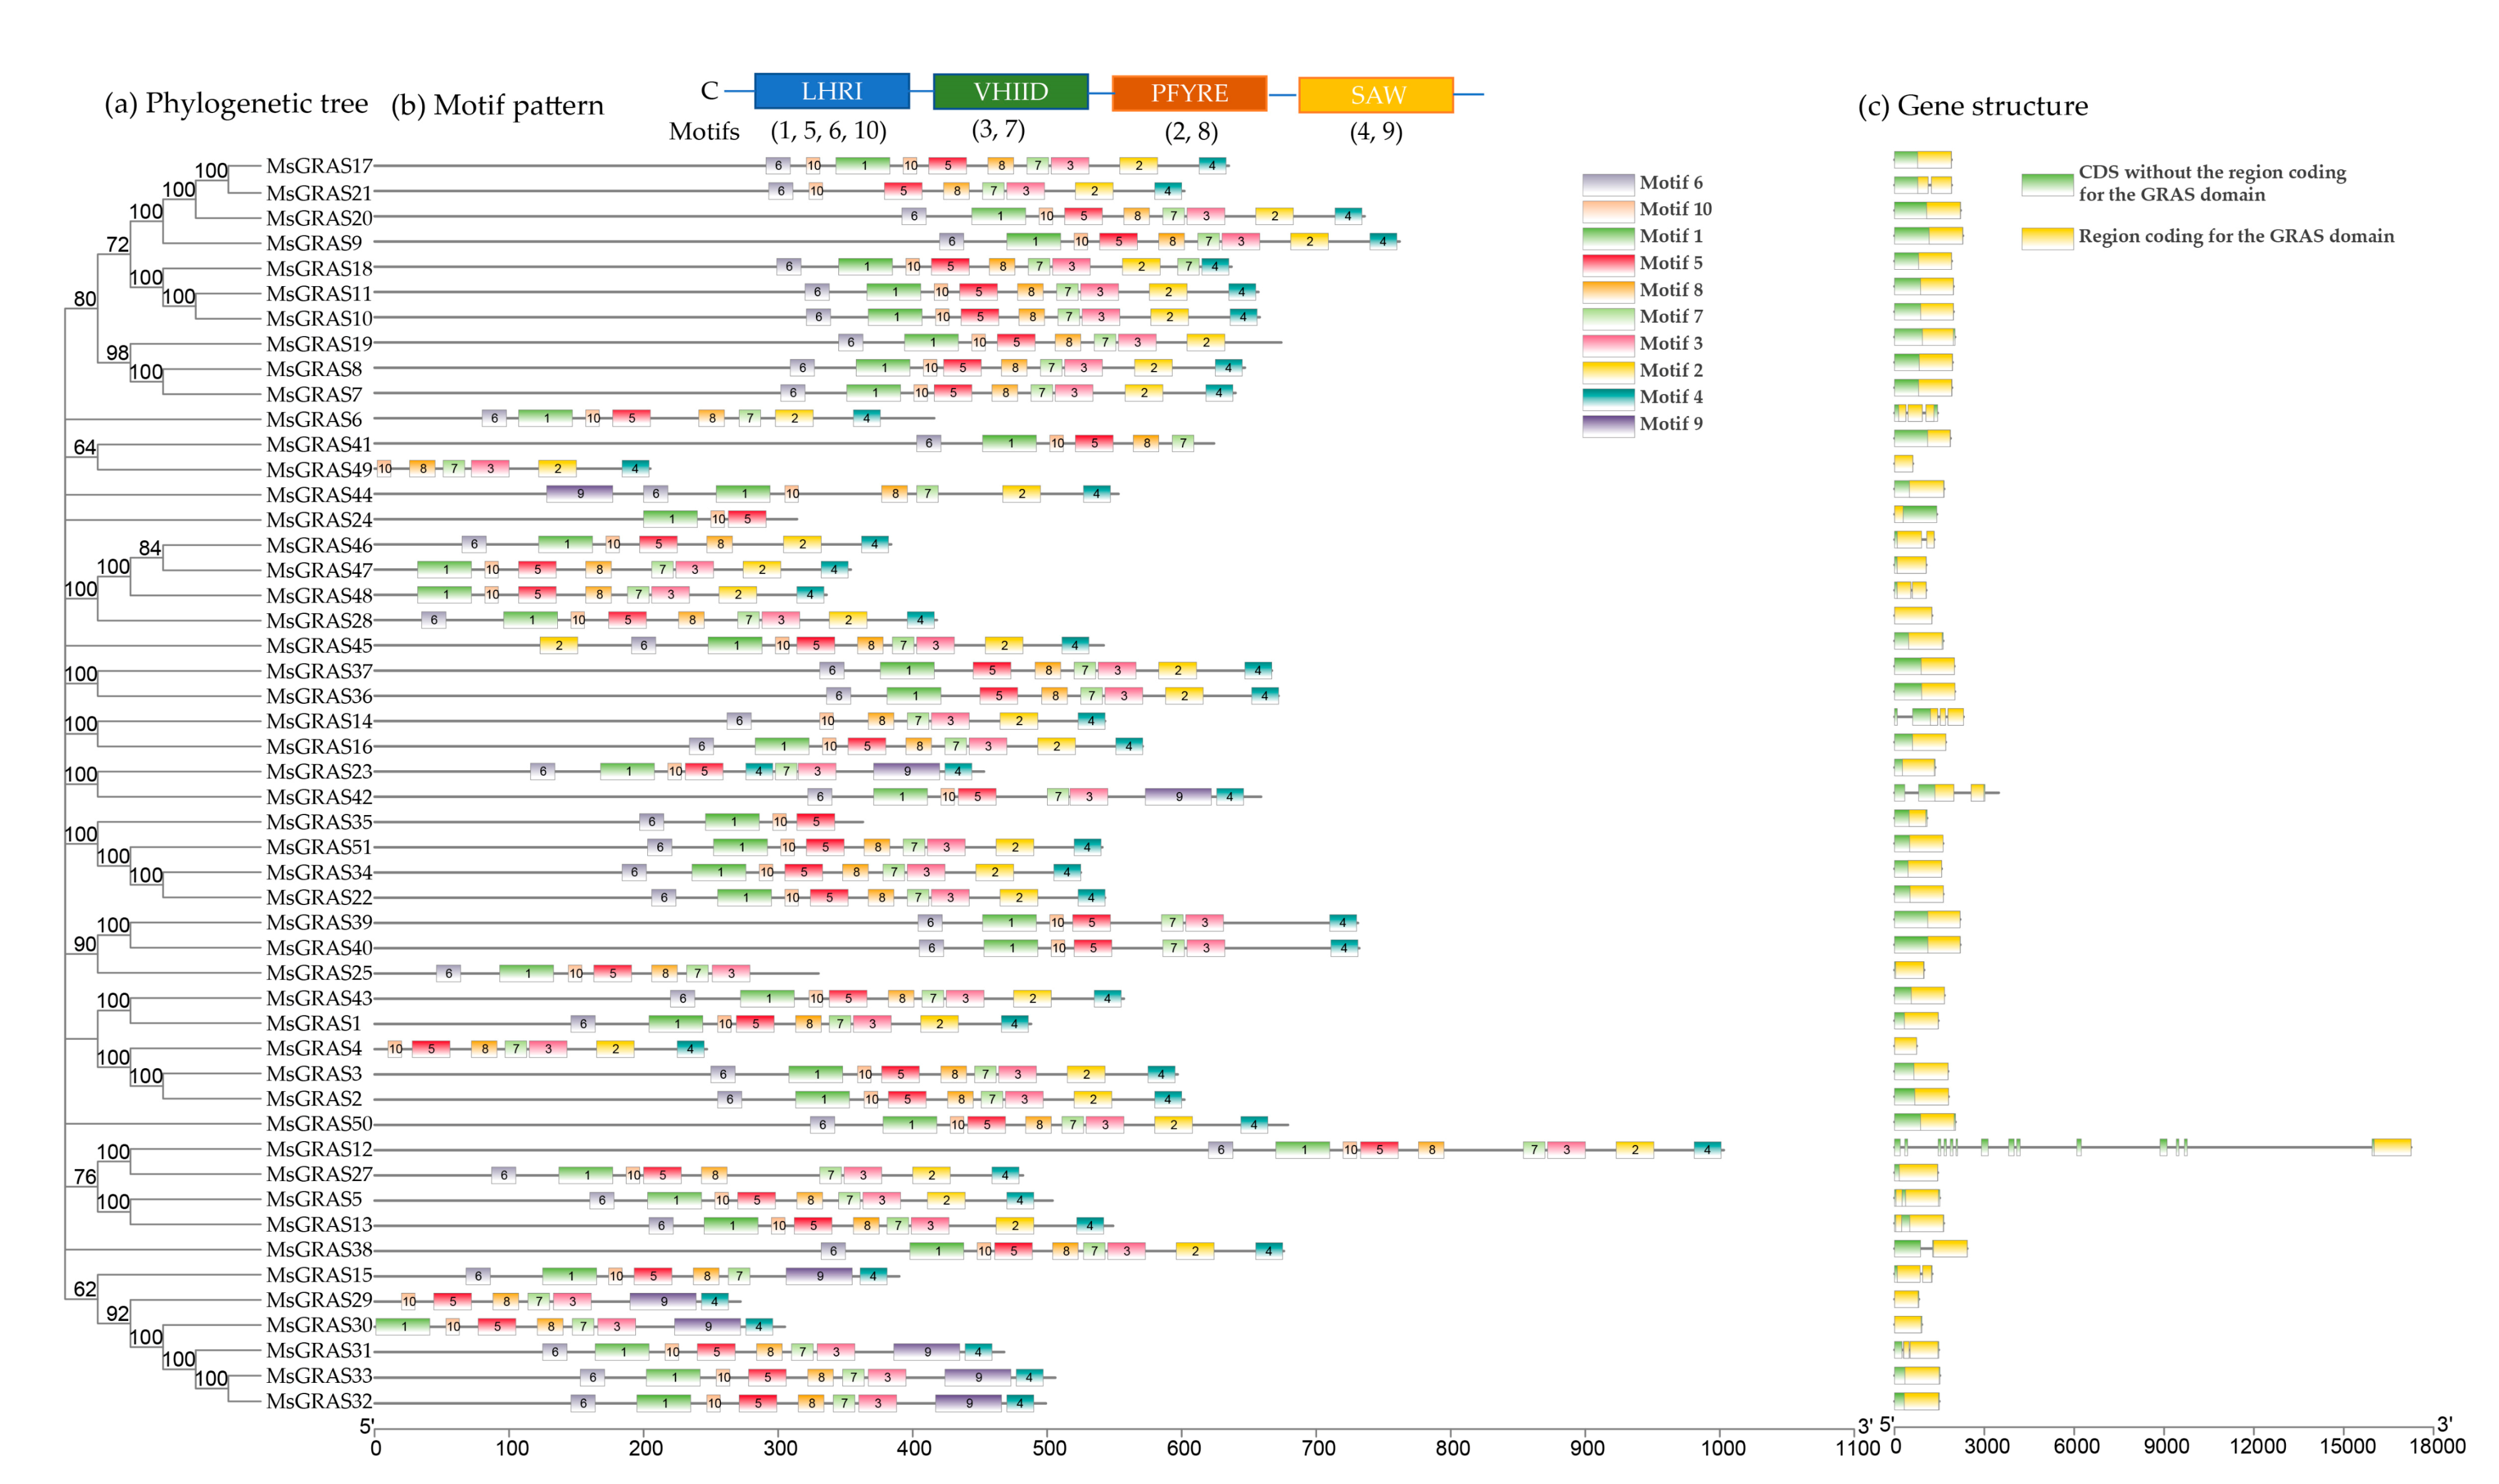
2.2. Phylogenetic Analysis and Classification of GRAS Members

To fully uncover the evolutionary history of the GRAS gene family in alfalfa, 51 MsGRAS genes were compared with 32 and 59 GRAS genes in Arabidopsis (https://www.arabidopsis.org/index.jsp accessed on 5 October 2020) and M. truncatula (http://www.medicagohapmap.org/ accessed on 5 October 2020), respectively, and an unrooted phylogenetic tree was constructed using the neighbor-joining method in MEGAX. Based on the phylogenetic tree (Figure 5), all 51 MsGRAS proteins could be grouped into 9 subfamilies (SCL3, HAM, DELLA, SCR, LAS, LISCL, SHR, PAT1, and SCL4/7), which is consistent with the previous studies on A. thaliana [9] and M. truncatula [13]. A total of 4, 2, 10, 2, 1, 16, 7, 8, and 1 MsGRAS genes corresponded to subfamilies of SCL3, HAM, DELLA, SCR, LAS, LISCL, SHR, PAT1, and SCL4/7, respectively (Figure 5). The LISCL subfamily herein contained 16 members and was the largest MsGRAS gene subfamily in this study.

2.3. Transcriptome Analysis of the Alfalfa Leaves under Abiotic Stress

To investigate the expression profiles of MsGRAS members under abiotic stresses (salt and drought), we downloaded publicly available leaf and root transcriptome data from NCBI (Bioproject PRJNA657410 and PRJNA525327) [35] and conducted RNA-seq analysis. The alfalfa plant was treated with salt stress for 3 (L3 for leaf and R3 for root) and 27 h (L27 for leaf and R27 for root) with the control (L0 for leaf and R0 for root), while drought stress was also applied for roots under drought stress (RD). In root tissue, 35 MsGRAS genes were expressed in R0 (Table S4), and the expression of 4 and 5 MsGRAS genes changed significantly in R3 and R27, respectively, including MsGRAS51/13. In leaf tissue, 29 MsGRAS genes were expressed in L0 (Table S4), and the expression levels of 17 and 19 MsGRAS genes increased in L3 and L27, respectively (Figure 6, Table S4). Actually, 14 MsGRAS genes were not expressed in both root and leaf. Under the drought stress, 13 MsGRAS genes were insensitive, and about 41% of MsGRAS genes showed significant differences, of which eight genes belonged to the PAT1 subgroup.
Furthermore, we performed a differential expression analysis of all genes in alfalfa leaves under salinity stress compared with the control groups. A set of differentially expressed genes (DEGs) for each salinity stress treatment were determined according to their significance with a cutoff of p-value < 0.05 and |log2(fold change)| > 1 (Table S5 and Figure 7a). The result showed that a total of 1090, 1975, and 929 DEGs, in response to NaCl treatments, were detected in the three comparisons (L0 vs. L3, L0 vs. L27, L3 vs. L27), respectively. The DEGs with down-regulated ones in L0 vs. L27 were significantly more than those in L0 vs. L3. Compared to the control, there were 526 up-regulated and 564 down-regulated DEGs under 3 h salinity stress, whereas 837 up-regulated and 1138 down-regulated DEGs in response to 27 h NaCl treatment in alfalfa leaves. A total of 929 DEGs were detected in L3 vs. L27, including 534 up-regulated and 395 down-regulated ones. The Venn diagram further showed that 141 DEGs were common in the three comparisons (Figure 7b). These results suggested that the alfalfa plant was more sensitive to salinity stress for a longer time, e.g., 27 h in this case, with more DEGs.
To trace the partners of MsGRAS genes in salinity response, we analyzed the co-expression of these DEGs and divided them into 12 clusters. A total six MsGRAS genes were placed in three clusters, i.e., MsGRAS37 in cluster 1; MsGRAS5, MsGRAS13, and MsGRAS51 in cluster 5; MsGRAS27 and MsGRAS50 in cluster 7 (Figure 7c). In cluster 1, the gene expression decreased rapidly at 3 h of salt stress treatment and maintained at 27 h. The gene expression in cluster 5 did not change significantly at 3 h and showed an obvious down-regulation trend at 27 h, while the gene expression pattern in cluster 7 is up at 27 h.
To identify functions of salinity-responsive partners of MsGRAS genes in alfalfa, we conducted GO term enrichment analysis on DEGs in cluster 1, cluster 5, and cluster 7 in leaf. In the GO enrichment graph, the p-value is sorted from small to large to indicate the significance of the enrichment degree (Figure 8a). The GO enrichment results showed that the majority of DEGs in cluster 1 were involved in molecular function categories, including ‘catalytic activity’, ‘transferase activity’, ‘transferase activity transferring glycosyl groups’, and ‘DNA binding’. The DEGs in cluster 5 were involved mostly in molecular functions, including ‘catalytic activity’, ‘oxidoreductase activity’, ‘cofactor binding’, and ‘transferase activity’. Those in cluster 7 were mainly enriched in terms of ‘lysine methyltransferase activity’, ‘transcription factor activity’, and ‘protein heterodimerization activity’. The expression of MsGRAS5, MsGRAS13, MsGRAS37, and MsGRAS51, which belong to the DELLA and PAT1 subfamilies, decreased significantly at 27 h (Figure 8d), which indicated the role of DELLA and PAT1 proteins in response to salt stress.

2.4. Validation of Expression Profiles of MsGRAS Genes under Abiotic Stress and Hormone Treatments

Among all 51 MsGRAS genes, expressions of 6 (MsGRAS5, MsGRAS13, MsGRAS27, MsGRAS37, MsGRAS50, and MsGRAS51) were highly induced by salinity and drought stresses. We designed primers for the six selected genes and conducted qRT-PCR experiments in leaf tissues (Table S6). The gene expression profiles of the six selected genes were generally consistent with the RNA-seq data (Figure 8d and Table S7). The results showed that upon salinity treatment, MsGRAS50 expression was significantly induced (p < 0.01), while the other four MsGRAS genes’ expression was down-regulated significantly. Under drought stress, the expression of MsGRAS51 increased gradually. After 72 h of treatment, MsGRAS51 expression was about 20 times that of the control, implying its putative roles in stress tolerance. Interestingly, the expression of three genes (MsGRAS5, MsGRAS13, and MsGRAS50) were only up-regulated at 12 h. However, MsGRAS27 showed no significant influence in both salt and drought treatment (Figure 9).
Previous studies have demonstrated that GRAS genes are key regulators of germination [21], seedling growth [2], lateral root development, and shoot meristem maintenance [6]. Plant hormones have been widely reported for their roles in the regulation of various aspects of plant growth. Upon drought and salinity stress, gene expression profiles showed that MsGRAS genes play a vital role in response to abiotic stress. We further verified the expression profiles of 6 selected MsGRAS genes in alfalfa seedlings under exogenous ABA, GA, and IAA treatments by qRT-PCR. We found that the hormone treatments resulted in a wide variety of MsGRAS gene expression profiles (Figure 10, Table S8). It showed that MsGRAS5 was not responsive to ABA, and the other five genes’ expression, with one up- and four down-regulated, was significantly different from the control. Four MsGRAS genes showed significantly different expressions after treatments of both GA and IAA. The up-regulated expression levels of MsGRAS51 responded to all three hormones. It suggested that the MsGRAS TFs played vital roles in response to ABA, GA, and IAA stress signaling. Under GA treatment for 72 h, MsGRAS50 was significantly up-regulated, with >800 folds of the control. MsGRAS5 as DELLA protein showed a significant response to gibberellin treatment and no expression at all at 24 h. The expression levels of six MsGRAS genes varied obviously in response to hormone treatments, suggesting that the MsGRAS genes have been involved in different pathways in alfalfa seedlings.

3. Discussion

The plant-specific GRAS proteins are involved in the regulation of plants developmental and physiological processes, such as seed germination, fruit ripening, and various biotic and abiotic stresses [27,28,29,36]. To date, several attempts have been undertaken to group members of the GRAS family into subfamilies that reflect their evolutionary history in a large number of plant species, such as A. thaliana [9], M. truncatula [13], G. max [10], tomato [11], Chinese cabbage [17], C. annuum [12], and G. hirsutum [18]. In contrast, alfalfa, as a member of the forage crops, is one of the most important hay and silage productions worldwide. It is difficult to screen the GRAS family members in alfalfa, as alfalfa is an autotetraploid, open-pollinated legume with a high level of heterozygosity in the genome [37,38]. A total of 51 GRAS genes in alfalfa were more than those in Arabidopsis (32) [9], Chrysanthemum morifolium (23) [39], p. mume (45) [40], castor bean (46) [41], cabbage (48) [17], similar to those in pepper (50) [12] and tomato (53) [11], but less than those in Populus (106) [42], soybean (117) [10], and G. hirsutum (150) [18]. MsGRAS gene members are divided into nine subfamilies, including SCL4/7 with MsGRAS35 and MtGRAS39 (Figure 5). However, in M. truncatula, MtGRAS39 was classified into the LAS subfamily rather than SCL4/7. It is noted that our subfamilies in alfalfa are the same as those in soybean [10] and Arabidopsis [9].

3.1. Duplication of MsGRAS Genes

In this investigation, the identified MsGRAS genes are unevenly distributed on eight chromosomes of the alfalfa genome. Notably, Chr2 and Chr4 contained most of MsGRAS genes (20 genes), which mainly originated from all of the nine subfamilies, and Chr1 is the “cold” region, including only one MsGRAS gene (Figure 1a). In M. truncatula, Chr2 and Chr4 are also the “hot” regions, with 15 MtGRAS genes [13]. Furthermore, based on the distribution of MsGRAS in chromosomes, we discovered the gene duplication events. Gene loss and replication events greatly promote the evolution of species, providing raw materials for generating novel gene functions and expanding gene families [43]. Most plants have experienced one or more rounds of ancient polyploidy, such as Arabidopsis, which had undergone two recent whole-genome duplications [44]. It is speculated that gene replication may be one of the main factors for the number variation of GRAS family members. We discovered 12 pairs of MsGRAS genes as evidence of tandem duplication events on five chromosomes (Chr2, Chr4, Chr5, Chr7, and Chr8), among which six belonged to the LISCL subfamily, and three segmental duplication events for ten MsGRAS genes (Figure 1b). It seems that tandem duplication contributed more to M. sativa GRAS expansion than segmental duplication. For example, LISCL subfamily expansion in alfalfa is also found in M. truncatula [13]. Segmental duplication and tandem duplication are considered to represent principal evolutionary patterns in plants. Segmental duplications are produced by polyploidy and chromosomal rearrangement because of numerous duplicated chromosomal blocks in plant genomes [45]. Interestingly, almost all genes in MsGRAS families have no introns. In the GRAS gene family, the higher percentage of intronless genes, the closer the evolutionary relationship of the GRAS members [46]. Intron deficiency is common in other large gene families, for example, DEAD-box RNA helicases, small auxin-up RNAs (SAUR) gene family, and the F-box transcription factor family [47,48,49]. Intronless genes are also common in prokaryote genomes, but there are three explanations for the appearance of intronless genes in eukaryote genomes, i.e., horizontal gene transfer, intronless gene reverse transcription, and intronless gene replication [46]. In addition, the GRAS domain proteins were discovered in bacteria [50], and thus, horizontal gene transfer from ancient prokaryote genomes might be a possibility to explain the abundant intronless genes in the plant GRAS gene family.

3.2. Expression and Function of MsGRAS Genes

The GRAS members in the same subfamily commonly exhibit functional similarities. Structural analysis provides a clue to locate which subgroup of GRAS is of ancient origin [51]. All of the ten predicted alfalfa DELLA proteins (MsGRAS5, MsGRAS13, MsGRAS15, MsGRAS26, MsGRAS29, MsGRAS30, MsGRAS31, MsGRAS32, MsGRAS33, and MsGRAS38) were classified into the DELLA subgroup, together with the Arabidopsis DELLA proteins of AtGAI, AtRGA, AtRGL1, AtRGL2, and AtRGL3. In Arabidopsis, the DELLA family consists of GAI, RGA, RGL1, RGL2, and RGL3 [4,21,23,52]. To date, the functions of the AtGAI and AtRGA proteins have been clearly illuminated in Arabidopsis, and DELLA protein, as a putative transcriptional regulator, is a subbranch of the GRAS gene family, playing a negative regulatory role in gibberellin (GA) signal transduction [53]. DELLA proteins restrain the development of plants, whereas GA relieves plants of DELLA-mediated growth restraint [54,55]. After GA treatment, the expression of MsGRAS5 significantly changed, especially without expression at 24 h, indicating its potential role in gibberellin regulation in alfalfa.
It is known that GRAS proteins might interact with each other in a pathway. The GRAS family transcription factors of SCR and SHR are involved in root tissue formation, and the two subfamilies AtSHR and AtSCR, were considered to function importantly in maintaining stem and root cell meristem [12,56]. As a positive regulator, SCL3 acts to integrate and maintain a functional GA pathway by eliminating the negative regulation of DELLA to control the dynamic balance of GA in root development for cell elongation [57]. In this study, the SCL3 subfamily contained four MsGRAS proteins (MsGRAS12, 24, 27, and 45), which is implying a similar function in root development. In addition, LISCLs are of the largest GRAS subfamily in alfalfa and involved in the regulation of microsporogenesis in Lilium longiflorum [43], while LAS proteins act as branching regulators, which is required to establish axillary meristems at a distance to the SAM during vegetative development [24,58,59].

3.3. Possible Functions of MsGRAS Members

The gene expression profiles could provide key clues to predict their possible functions. As a broad-spectrum phytohormone, ABA is involved not only in regulating plant growth and development but also in coordinating in many aspects of stress signal transduction pathways during abiotic stresses. ABA mediates many stress responses and activation of genes involved in tolerance adjustment [60]. When plants are subjected to biotic and abiotic stress, cells are prone to oxidative stress, which is due to the increase of the content of reactive oxygen species (ROS) [61]. The phytohormone GA is known to play an important role in regulating a diverse array of developmental processes, such as seed development and germination, organ elongation, and control of flowering time. The GRAS subfamily has been reported to function as repressors of gibberellin (GA) signaling [2]. A previous study reported that DELLA proteins thus repressed ROS accumulation, interrupts ROS-induced cell death, and hence enhance plant biotic and abiotic stress tolerance [62].
Recent studies have shown that GRAS genes have multiple functions in plant abiotic stress tolerance. The rice GRAS transcription factor gene OsGRAS23 was induced by osmotic stress, and overexpression of this gene enhanced the drought resistance in transgenic rice plants by regulating the expression of stress-responsive genes [63]. In M. sativa, MsGRAS37 and MsGRAS51 showed a high expression level under PEG treatment. Moreover, the expression levels of several MsGRAS genes (e.g., MsGRAS5/13/50/51) were dramatically regulated by salinity stresses. It suggested they played critical roles in the abiotic stress tolerance in M. sativa. In our study, the expression of MsGRAS51 significantly responded to all the treatments of hormone and stress, indicating a potential regulatory role in alfalfa development and stress resistance.

4. Materials and Methods

4.1. Plant Materials

In this study, the seeds of M. sativa cultivar Zhongmu No.1 were harvested in the autumn of 2019 at the Gansu Forage and Pasture Research Station of the China Agricultural University (attitude 39°37′ N, longitude 98°30′ E; elevation 1480 m). M. sativa seeds were placed on moistened filter paper in dishes and then sustained in a growth chamber with 16 h light/8 h dark at 20 °C constant temperature. Seven-day-old seedlings were then subjected to different experiments. For each experiment, all samples were immediately frozen in liquid nitrogen and stored at −80 °C for RNA extraction.
For the expression analyses of GRAS genes’ response to different treatments, the seven-day-old seedlings were transferred into the flasks with 1/2 MS liquid medium and grew in a controlled growth chamber under 16/8 h light/dark regime at 20 °C. After the third leaf was fully expanded, the plants were supplied with 1 mmol·L−1 IAA, 1 mmol·L−1 GA3, 1 mmol·L−1 ABA, 15% PEG6000, and 300 mmol·L−1 NaCl to the 1/2 MS liquid medium, respectively. For each treatment, the whole plant was collected at 0, 2, 24, and 72 h with a triplicate.

4.2. RNA Extraction and Gene Expression Analysis

The total plant RNAs were extracted using the HUA YUE YANG total RNA Extraction kit (Beijing, China), according to the manufacturer’s instructions. RNA was used as a template for the synthesis of first-strand cDNA. Complementary DNA was generated with reverse transcriptase (TransGen Biotech, Beijing, China) at 42 °C for 15 min, 85 °C for 5 s. Quantitative real-time PCR (qRT-PCR) was conducted according to the instructions of 2 × RealStar Green Fast Mixture (GeneStar, Beijing, China) on CFX96 TouchTM RT-PCR system (Biorad, Los Angeles, CA, USA). The gene-specific primer sequences for qRT-PCR determination are provided in Table S6. Ms-Actin was used as the internal control. Three technical repetitions for each sample were performed, and the relative expression data were calculated according to the 2−ΔΔCT method. Student t-test was performed by Graphpad Prism 7 (https://www.graphpad.com/scientific software/prism/ accessed on 5 April 2021). All the error bars were standard deviations (SD) from three biological replicates.

4.3. Identification of GRAS Genes in M. sativa

The M. sativa “Zhongmu No.1” genome information [31] was downloaded from the figshare website (https://figshare.com/articles/dataset/Medicago_sativa_genome_and_annotation_files/ accessed on 11 September 2020). The 32 GRAS protein sequences of Arabidopsis retrieved from the TAIR (https://www.arabidopsis.org/ accessed on 11 September 2020) were used as a query to obtain the possible GRAS proteins in M. sativa genome by BlastP search with a cutoff E-value of 1.0 × 10⁻¹⁰. Furthermore, the GRAS protein sequences of M. sativa were aligned using the HMM model of the HMMER3.0 (http://hmmer.org/ accessed on 11 September 2020) (National Institutes of Health, Bethesda, MD, USA), with an E-value of 0.001 and the removal of redundant sequences. The Hidden Markov Model (HMM) profile (PF03514.13) was used to identify the putative GRAS domain in the Pfam database (http://pfam.xfam.org/ accessed on 11 September 2020) [64].

4.3.1. Chromosomal Distribution and Gene Duplication Events Analysis

The chromosomal locations of 51 GRAS genes were obtained from the M. sativa genomic annotation file GFF3 (general feature format). We draw the chromosomal distribution image of MsGRAS genes through the TBtools software [65]. The 51 putative GRAS genes were renamed according to their chromosomal locations. The detection and identification of gene duplication events in MsGRAS genes were performed using multiple collinear scanning toolkits (MCScanX) [66] with an E-value set to 10−5.

4.3.2. Sequence Analyses and Structural Characterization of MsGRAS Genes

The tools from the ExPASy website (https://web.expasy.org/protparam/ accessed on 11 September 2020) (SIB Swiss Institute of Bioinformatics) were used to analyze the basic physical and chemical characteristics, such as sequence length, molecular weight, and isoelectric point of the identified GRAS proteins. The subcellular localization of MsGRAS was predicted on the WoLF PSORT (http://wolfpsort.org accessed on 10 July 2021). The exon-intron structures of MsGRAS genes were drawn based on the CDS and the corresponding full-length sequence by using TBtools software [65]. The conserved motifs in MsGRAS proteins were analyzed through the MEME software [67]. The parameters were set as follows: motif width as 15–50 amino acids (aa) and the number of motifs as 10.

4.4. Phylogenetic and Collinearity Analysis of MsGRAS Genes

We downloaded the GRAS proteins of Arabidopsis and M. truncatula from the phytozome (https://phytozome.jgi.doe.gov/pz/portal.html accessed on 5 October 2020), which were used for the phylogenetic analysis of GRAS proteins in plants. Multiple sequence alignments of the 142 GRAS genes were performed using the ClustalX software (https://clustalx.software.informer.com/2.1/# version 2.1, accessed on 5 October 2020) with default parameters. The phylogenetic tree based on the alignment was constructed using MEGA-X [34] by neighbor-joining (NJ) method, and the reliability of the obtained trees was assessed with a bootstrap value of 1000. The phylogenetic tree was visualized and illustrated using the online tool EvolView [68] (http://www.evolgenius.info/evolview/# version 3.0, accessed on 5 October 2020). The syntenic relationship between MsGRAS genes and GRAS genes from Arabidopsis, rice, M. truncatula, and soybean were determined by using Dual Synteny Plotter (Plant Genome Mapping Laboratory, University of Georgia, Athens, GA, USA, http://chibba.pgml.uga.edu/mcscan2/# version 2.0, accessed on 5 October 2020) software and was visualized by TBtools software (HuaZhong Agricultural University, Wuhan, China).

5. Conclusions

We screened 51 MsGRAS genes in the alfalfa genome of “Zhongmu No.1” and grouped them into nine subfamilies, which all shared the conversed GRAS domain. We also identified the conserved domain patterns and phylogenetic relationships of these MsGRAS proteins. Our current systematic studies provided gene expression atlas for MsGRAS genes. These results provide comprehensive information towards better understanding the molecular basis and impact of GRAS gene families on the response of alfalfa to treatments of hormones and stress. Considering that the detailed regulatory mechanisms underlining GRAS genes are still not clear in M. sativa, it will be of great interest to elucidate individual MsGRAS genes in the near future. For instance, MsGRAS51 might contribute to abiotic stress tolerance in M. sativa, and MsGRAS50 may play an important role in the gibberellin signal transduction pathway. Nevertheless, it provided important information about the GRAS family and a framework for breeding on stress-resistance and hormone signaling transduction in alfalfa.

Supplementary Materials

The following are available online at https://0-www-mdpi-com.brum.beds.ac.uk/article/10.3390/ijms22147729/s1, Figure S1: LHRI domain of 51 MsGRAS proteins based on sequence alignment. The most conserved GRAS domain of LHRI was boxed in red; Figure S2: SAW domain of 51 MsGRAS proteins based on sequence alignment. The most conserved GRAS domain of SAW was boxed in red; Figure S3: PFYRE domain of 51 MsGRAS proteins based on sequence alignment. The most conserved GRAS domain of PFYRE was boxed in red; Table S1: Nucleotide and amino acid sequences of MsGRAS; Table S2: The collinearity relationships of the MsGRAS genes in four species; Table S3: Analysis and distribution of conserved motifs in MsGRAS proteins; Table S4: The relative expression level of 51 MsGRAS genes under various treatments of abiotic stress and treatment time; Table S5: Gene expression level of 51 MsGRAS genes in root and leaf tissues under treatments of salt stress; Table S6: The six gene-specific primer pairs used for qRT-PCR validation; Table S7: Expression levels of six MsGRAS genes under drought, salt, exogenous ABA, GA and IAA treatments by qRT-PCR; Table S8: Expression data of 51 MsGRAS genes in public RNA-seq datasets under stress treatments.

Author Contributions

H.Z. performed stress treatments, data analysis, gene expression analysis, and wrote the manuscript; X.L. prepared the figures. X.W., M.S. and R.S. collected the data; S.J. and P.M. designed the experiments, supervised this work, and edited the manuscript. All authors have read and agreed to the published version of the manuscript.

Funding

This research was funded by the China Agriculture Research System of MOF and MARA, National Natural Science Foundation (31971754), and the Chinese Universities Scientific Fund (2019TC257 and 2020TC189).

Institutional Review Board Statement

Not applicable.

Informed Consent Statement

Not applicable.

Data Availability Statement

RNA-seq raw data used in this study was downloaded from the SRA database in NCBI with the Bioproject accession numbers of PRJNA657410 and PRJNA525327.

Acknowledgments

Special thanks to Xiqing Ma for his helps on taking care of greenhouse and Zhicheng Jia for his assistance on analyzing data, in China Agricultural University.

Conflicts of Interest

The authors have no conflict of interest to declare in relationship to this article.

References

  1. Riano-Pachon, D.M.; Ruzicic, S.; Dreyer, I.; Mueller-Roeber, B. PlnTFDB: An integrative plant transcription factor database. BMC Bioinform. 2007, 8, 42. [Google Scholar] [CrossRef] [Green Version]
  2. Hirsch, S.; Oldroyd, G.E. GRAS-domain transcription factors that regulate plant development. Plant Signal. Behav. 2009, 4, 698–700. [Google Scholar] [CrossRef] [PubMed] [Green Version]
  3. Di Laurenzio, L.; Wysocka-Diller, J.; Malamy, J.E.; Pysh, L.; Helariutta, Y.; Freshour, G.; Hahn, M.G.; Feldman, K.A. The SCARECROW gene regulates an asymmetric cell division that is essential for generating the radial organization of the Arabidopsis root. Cell 1996, 86, 423–433. [Google Scholar] [CrossRef] [Green Version]
  4. Silverstone, A.L.; Ciampaglio, C.N.; Sun, T.P. The Arabidopsis RGA gene encodes a transcriptional regulator repressing the gibberellin signal transduction pathway. Plant Cell 1998, 10, 156–169. [Google Scholar] [CrossRef] [PubMed] [Green Version]
  5. Pysh, L.D.; Wysocka-Diller, J.W.; Camilleri, C.; Bouchez, D.; Benfey, P.N. The GRAS gene family in Arabidopsis: Sequence characterization and basic expression analysis of the SCARECROW-LIKE genes. Plant J. 1999, 18, 111–119. [Google Scholar] [CrossRef] [PubMed]
  6. Bolle, C. The role of GRAS proteins in plant signal transduction and development. Planta 2004, 218, 683–692. [Google Scholar] [CrossRef] [PubMed]
  7. Sun, X.; Jones, W.T.; Rikkerink, E.H. GRAS proteins: The versatile roles of intrinsically disordered proteins in plant signalling. Biochem. J. 2012, 442, 1–12. [Google Scholar] [CrossRef] [Green Version]
  8. Lee, M.-H.; Kim, B.; Song, S.-K.; Heo, J.-O.; Yu, N.-I.; Lee, S.A.; Kim, M.; Kim, D.G.; Sohn, S.O.; Lim, C.E. Large-scale analysis of the GRAS gene family in Arabidopsis thaliana. Plant Mol. Biol. 2008, 67, 659–670. [Google Scholar] [CrossRef] [Green Version]
  9. Tian, C.G.; Wan, P.; Sun, S.H.; Li, J.Y.; Chen, M.S. Genome-wide analysis of the GRAS gene family in rice and Arabidopsis. Plant Mol. Biol. 2004, 54, 519–532. [Google Scholar] [CrossRef] [PubMed]
  10. Wang, L.; Ding, X.; Gao, Y.; Yang, S. Genome-wide identification and characterization of GRAS genes in soybean (Glycine max). BMC Plant Biol. 2020, 20, 415. [Google Scholar] [CrossRef]
  11. Huang, W.; Xian, Z.; Kang, X.; Tang, N.; Li, Z. Genome-wide identification, phylogeny and expression analysis of GRAS gene family in tomato. BMC Plant Biol. 2015, 15, 209. [Google Scholar] [CrossRef] [Green Version]
  12. Liu, B.; Sun, Y.; Xue, J.; Jia, X.; Li, R. Genome-wide characterization and expression analysis of GRAS gene family in pepper (Capsicum annuum L.). PeerJ 2018, 6, e4796. [Google Scholar] [CrossRef] [Green Version]
  13. Zhang, H.; Cao, Y.; Shang, C.; Li, J.; Wang, J.; Wu, Z.; Ma, L.; Qi, T.; Fu, C.; Bai, Z.; et al. Genome-wide characterization of GRAS family genes in Medicago truncatula reveals their evolutionary dynamics and functional diversification. PLoS ONE 2017, 12, e0185439. [Google Scholar] [CrossRef]
  14. Wang, Y.X.; Liu, Z.W.; Wu, Z.J.; Li, H.; Wang, W.L.; Cui, X.; Zhuang, J. Genome-wide identification and expression analysis of GRAS family transcription factors in tea plant (Camellia sinensis). Sci. Rep. 2018, 8, 3949. [Google Scholar] [CrossRef] [PubMed] [Green Version]
  15. Liu, M.; Huang, L.; Ma, Z.; Sun, W.; Wu, Q.; Tang, Z.; Bu, T.; Li, C.; Chen, H. Genome-wide identification, expression analysis and functional study of the GRAS gene family in Tartary buckwheat (Fagopyrum tataricum). BMC Plant Biol. 2019, 19, 342. [Google Scholar] [CrossRef] [Green Version]
  16. Bolle, C.; Koncz, C.; Chua, N.H. PAT1, a new member of the GRAS family, is involved in phytochrome a signal transduction. Genes Dev. 2000, 14, 1269–1278. [Google Scholar]
  17. Song, X.M.; Liu, T.K.; Duan, W.K.; Ma, Q.H.; Ren, J.; Wang, Z.; Li, Y.; Hou, X.L. Genome-wide analysis of the GRAS gene family in Chinese cabbage (Brassica rapa ssp. pekinensis). Genomics 2014, 103, 135–146. [Google Scholar] [CrossRef] [Green Version]
  18. Zhang, B.; Liu, J.; Yang, Z.E.; Chen, E.Y.; Zhang, C.J.; Zhang, X.Y.; Li, F.G. Genome-wide analysis of GRAS transcription factor gene family in Gossypium hirsutum L. BMC Genom. 2018, 19, 348. [Google Scholar] [CrossRef] [PubMed]
  19. Sidhu, N.S.; Pruthi, G.; Singh, S.; Bishnoi, R.; Singla, D. Genome-wide identification and analysis of GRAS transcription factors in the bottle gourd genome. Sci. Rep. 2020, 10, 14338. [Google Scholar] [CrossRef] [PubMed]
  20. Yoshida, H.; Ueguchi-Tanaka, M. DELLA and SCL3 balance gibberellin feedback regulation by utilizing indeterminate domain proteins as transcriptional scaffolds. Plant Signal. Behav. 2014, 9, e29726. [Google Scholar] [CrossRef] [PubMed] [Green Version]
  21. Lee, S.C.; Cheng, H.; King, K.E.; Wang, W.F.; He, Y.W.; Hussain, A.; Lo, J.; Harberd, N.P.; Peng, J.R. Gibberellin regulates Arabidopsis seed germination via RGL2, a GAI/RGA-like gene whose expression is up-regulated following imbibition. Genes Dev. 2002, 16, 646–658. [Google Scholar] [CrossRef] [Green Version]
  22. Wen, C.K.; Chang, C. Arabidopsis RGL1 encodes a negative regulator of gibberellin responses. Plant Cell 2002, 14, 87–100. [Google Scholar] [CrossRef] [Green Version]
  23. Peng, J.; Carol, P.; Richards, D.E.; King, K.E.; Cowling, R.J.; Murphy, G.P.; Harberd, N.P. The Arabidopsis GAI gene defines a signaling pathway that negatively regulates gibberellin responses. Genes Dev. 1997, 11, 3194–3205. [Google Scholar] [CrossRef] [PubMed] [Green Version]
  24. Greb, T.; Clarenz, O.; Schafer, E.; Muller, D.; Herrero, R.; Schmitz, G.; Theres, K. Molecular analysis of the lateral suppressor gene in Arabidopsis reveals a conserved control mechanism for axillary meristem formation. Genes Dev. 2003, 17, 1175–1187. [Google Scholar] [CrossRef] [PubMed] [Green Version]
  25. Li, M.; Wang, X.; Li, C.; Li, H.; Zhang, J.; Ye, Z. Silencing GRAS2 reduces fruit weight in tomato. J. Integr. Plant Biol. 2018, 60, 498–513. [Google Scholar] [CrossRef] [PubMed] [Green Version]
  26. Stuurman, J.; Jaggi, F.; Kuhlemeier, C. Shoot meristem maintenance is controlled by a GRAS-gene mediated signal from differentiating cells. Genes Dev. 2002, 16, 2213–2218. [Google Scholar] [CrossRef] [PubMed] [Green Version]
  27. Zhang, L.; Zhu, M.; Ren, L.; Li, A.; Chen, G.; Hu, Z. The SlFSR gene controls fruit shelf-life in tomato. J. Exp. Bot. 2018, 69, 2897–2909. [Google Scholar] [CrossRef] [PubMed] [Green Version]
  28. Huang, W.; Peng, S.; Xian, Z.; Lin, D.; Hu, G.; Yang, L.; Ren, M.; Li, Z. Overexpression of a tomato miR171 target gene SlGRAS24 impacts multiple agronomical traits via regulating gibberellin and auxin homeostasis. Plant Biotechnol. J. 2017, 15, 472–488. [Google Scholar] [CrossRef]
  29. Ma, H.S.; Liang, D.; Shuai, P.; Xia, X.L.; Yin, W.L. The salt- and drought-inducible poplar GRAS protein SCL7 confers salt and drought tolerance in Arabidopsis thaliana. J. Exp. Bot. 2010, 61, 4011–4019. [Google Scholar] [CrossRef] [Green Version]
  30. Li, P.; Zhang, B.; Su, T.; Li, P.; Xin, X.; Wang, W.; Zhao, X.; Yu, Y.; Zhang, D.; Yu, S.; et al. BrLAS, a GRAS transcription factor from Brassica rapa, is involved in drought stress tolerance in transgenic Arabidopsis. Front. Plant Sci. 2018, 9, 1792. [Google Scholar] [CrossRef] [Green Version]
  31. Chen, H.; Zeng, Y.; Yang, Y.; Huang, L.; Tang, B.; Zhang, H.; Hao, F.; Liu, W.; Li, Y.; Liu, Y.; et al. Allele-aware chromosome-level genome assembly and efficient transgene-free genome editing for the autotetraploid cultivated alfalfa. Nat. Commun. 2020, 11, 2494. [Google Scholar] [CrossRef]
  32. Li, A.; Liu, A.; Du, X.; Chen, J.-Y.; Yin, M.; Hu, H.-Y.; Shrestha, N.; Wu, S.-D.; Wang, H.-Q.; Dou, Q.-W. A chromosome-scale genome assembly of a diploid alfalfa, the progenitor of autotetraploid alfalfa. Hortic. Res. 2020, 7, 1–12. [Google Scholar] [CrossRef]
  33. Shen, C.; Du, H.; Chen, Z.; Lu, H.; Zhu, F.; Chen, H.; Meng, X.; Liu, Q.; Liu, P.; Zheng, L.; et al. The chromosome-level genome sequence of the autotetraploid alfalfa and resequencing of core germplasms provide genomic resources for alfalfa research. Mol. Plant 2020, 13, 1250–1261. [Google Scholar] [CrossRef]
  34. Sudhir, K.; Glen, S.; Li, M.; Christina, K.; Koichiro, T. MEGA X: Molecular evolutionary genetics analysis across computing platforms. Mol. Biol. Evol. 2018, 35, 1547–1549. [Google Scholar]
  35. Gruber, M.Y.; Xia, J.; Yu, M.; Steppuhn, H.; Wall, K.; Messer, D.; Sharpe, A.G.; Acharya, S.N.; Wishart, D.S.; Johnson, D.; et al. Transcript analysis in two alfalfa salt tolerance selected breeding populations relative to a non-tolerant population. Genome 2017, 60, 104–127. [Google Scholar] [CrossRef] [PubMed]
  36. Lu, X.; Liu, W.; Xiang, C.; Li, X.; Wang, Q.; Wang, T.; Liu, Z.; Zhang, J.; Gao, L.; Zhang, W. Genome-wide characterization of GRAS family and their potential roles in cold tolerance of cucumber (Cucumis sativus L.). Int. J. Mol. Sci. 2020, 21, 3857. [Google Scholar] [CrossRef]
  37. Wang, Z.; Wang, X.; Zhang, H.; Ma, L.; Zhao, H.; Jones, C.S.; Chen, J.; Liu, G. A genome-wide association study approach to the identification of candidate genes underlying agronomic traits in alfalfa (Medicago sativa L.). Plant Biotechnol. J. 2020, 18, 611–613. [Google Scholar] [CrossRef]
  38. Li, X.; Brummer, E.C. Applied genetics and genomics in alfalfa breeding. Agronomy 2012, 2, 40–61. [Google Scholar] [CrossRef] [Green Version]
  39. Gao, T.W.; Zhang, W.W.; Song, A.P.; An, C.; Xin, J.J.; Jiang, J.F.; Guan, Z.Y.; Chen, F.D.; Chen, S.M. Phylogenetic and transcriptional analysis of chrysanthemum GRAS transcription factors. Biol. Plant. 2018, 62, 711–720. [Google Scholar] [CrossRef]
  40. Lu, J.; Wang, T.; Xu, Z.; Sun, L.; Zhang, Q. Genome-wide analysis of the GRAS gene family in Prunus mume. Mol. Genet. Genom. 2015, 290, 303–317. [Google Scholar] [CrossRef]
  41. Xu, W.; Chen, Z.; Ahmed, N.; Han, B.; Cui, Q.; Liu, A. Genome-wide identification, evolutionary analysis, and stress responses of the GRAS gene family in castor beans. Int. J. Mol. Sci. 2016, 17, 1004. [Google Scholar] [CrossRef] [Green Version]
  42. Liu, X.; Widmer, A. Genome-wide comparative analysis of the GRAS gene family in Populus, Arabidopsis and Rice. Plant Mol. Biol. Report. 2014, 32, 1129–1145. [Google Scholar] [CrossRef]
  43. Moore, R.C.; Purugganan, M.D. The early stages of duplicate gene evolution. Proc. Natl. Acad. Sci. USA 2003, 100, 15682–15687. [Google Scholar] [CrossRef] [PubMed] [Green Version]
  44. Tang, H.; Wang, X.; Bowers, J.E.; Ming, R.; Alam, M.; Paterson, A.H. Unraveling ancient hexaploidy through multiply-aligned angiosperm gene maps. Genome Res. 2008, 18, 1944–1954. [Google Scholar] [CrossRef] [PubMed] [Green Version]
  45. Cannon, S.B.; Mitra, A.; Baumgarten, A.; Young, N.D.; May, G. The roles of segmental and tandem gene duplication in the evolution of large gene families in Arabidopsis thaliana. BMC Plant Biol. 2004, 4, 10. [Google Scholar] [CrossRef] [PubMed] [Green Version]
  46. Zou, M.; Guo, B.; He, S. The roles and evolutionary patterns of intronless genes in deuterostomes. Comp. Funct. Genom. 2011, 2011, 8. [Google Scholar] [CrossRef] [PubMed]
  47. Jain, M.; Nijhawan, A.; Arora, R.; Agarwal, P.; Ray, S.; Sharma, P.; Kapoor, S.; Tyagi, A.K.; Khurana, J.P. F-box proteins in rice. Genome-wide analysis, classification, temporal and spatial gene expression during panicle and seed development, and regulation by light and abiotic stress. Plant Physiol. 2007, 143, 1467–1483. [Google Scholar] [CrossRef] [PubMed] [Green Version]
  48. Jain, M.; Tyagi, A.K.; Khurana, J.P. Genome-wide analysis, evolutionary expansion, and expression of early auxin-responsive SAUR gene family in rice (Oryza sativa). Genomics 2006, 88, 360–371. [Google Scholar] [CrossRef] [PubMed] [Green Version]
  49. Aubourg, S.; Kreis, M.; Lecharny, A. The DEAD box RNA helicase family in Arabidopsis thaliana. Nucleic Acids Res. 1999, 27, 628–636. [Google Scholar] [CrossRef] [Green Version]
  50. Zhang, D.; Iyer, L.M.; Aravind, L. Bacterial GRAS domain proteins throw new light on gibberellic acid response mechanisms. Bioinformatics 2012, 28, 2407–2411. [Google Scholar] [CrossRef] [Green Version]
  51. Li, M.Y.; Xu, Z.S.; Tian, C.; Huang, Y.; Wang, F.; Xiong, A.S. Genomic identification of WRKY transcription factors in carrot (Daucus carota) and analysis of evolution and homologous groups for plants. Sci. Rep. 2016, 6, 1–17. [Google Scholar] [CrossRef] [PubMed] [Green Version]
  52. Dill, A.; Jung, H.S.; Sun, T.P. The DELLA motif is essential for gibberellin-induced degradation of RGA. Proc. Natl. Acad. Sci. USA 2001, 98, 14162–14167. [Google Scholar] [CrossRef] [PubMed] [Green Version]
  53. King, K.E.; Moritz, T.; Harberd, N.P. Gibberellins are not required for normal stem growth in Arabidopsis thaliana in the absence of GAI and RGA. Genetics 2001, 159, 767–776. [Google Scholar] [CrossRef] [PubMed]
  54. Harberd, N.P. Relieving DELLA restraint. Science 2003, 299, 1853–1854. [Google Scholar] [CrossRef]
  55. Achard, P.; Vriezen, W.H.; Van Der Straeten, D.; Harberd, N.P. Ethylene regulates Arabidopsis development via the modulation of DELLA protein growth repressor function. Plant Cell 2003, 15, 2816–2825. [Google Scholar] [CrossRef] [Green Version]
  56. Aoyanagi, T.; Ikeya, S.; Kobayashi, A.; Kozaki, A. Gene regulation via the combination of transcription factors in the indeterminate domain and GRAS families. Genes 2020, 11, 613. [Google Scholar] [CrossRef] [PubMed]
  57. Heo, J.O.; Chang, K.S.; Kim, I.A.; Lee, M.H.; Lee, S.A.; Song, S.K.; Lee, M.M.; Lim, J. Funneling of gibberellin signaling by the GRAS transcription regulator scarecrow-like 3 in the Arabidopsis root. Proc. Natl. Acad. Sci. USA 2011, 108, 2166–2171. [Google Scholar] [CrossRef] [Green Version]
  58. Liang, W.H.; Shang, F.; Lin, Q.T.; Lou, C.; Zhang, J. Tillering and panicle branching genes in rice. Gene 2014, 537, 1–5. [Google Scholar] [CrossRef] [PubMed]
  59. Schumacher, K.; Schmitt, T.; Rossberg, M.; Schmitz, G.; Theres, K. The Lateral suppressor (Ls) gene of tomato encodes a new member of the VHIID protein family. Proc. Natl. Acad. Sci. USA 1999, 96, 290–295. [Google Scholar] [CrossRef] [Green Version]
  60. Agarwal, P.; Jha, B. Transcription factors in plants and ABA dependent and independent abiotic stress signalling. Biol. Plant. 2010, 54, 201–212. [Google Scholar] [CrossRef]
  61. Suzuki, N.; Koussevitzky, S.; Mittler, R.; Miller, G. ROS and redox signalling in the response of plants to abiotic stress. Plant Cell Environ. 2012, 35, 259–270. [Google Scholar] [CrossRef] [PubMed]
  62. Navarro, L.; Bari, R.; Achard, P.; Lison, P.; Nemri, A.; Harberd, N.P.; Jones, J.D. DELLAs control plant immune responses by modulating the balance of jasmonic acid and salicylic acid signaling. Curr. Biol. 2008, 18, 650–655. [Google Scholar] [CrossRef] [PubMed]
  63. Xu, K.; Chen, S.; Li, T.; Ma, X.; Liang, X.; Ding, X.; Liu, H.; Luo, L. OsGRAS23, a rice GRAS transcription factor gene, is involved in drought stress response through regulating expression of stress-responsive genes. BMC Plant Biol. 2015, 15, 141. [Google Scholar] [CrossRef] [PubMed] [Green Version]
  64. Finn, R.D.; Bateman, A.; Clements, J.; Coggill, P.; Eberhardt, R.Y.; Eddy, S.R.; Heger, A.; Hetherington, K.; Holm, L.; Mistry, J.; et al. Pfam: The protein families database. Nucleic Acids Res. 2014, 42, D222–D230. [Google Scholar] [CrossRef] [PubMed] [Green Version]
  65. Chen, C.; Chen, H.; Zhang, Y.; Thomas, H.R.; Frank, M.H.; He, Y.; Xia, R. TBtools: An integrative toolkit developed for interactive analyses of big biological data. Mol. Plant 2020, 13, 1194–1202. [Google Scholar] [CrossRef] [PubMed]
  66. Wang, Y.; Tang, H.; Debarry, J.D.; Tan, X.; Li, J.; Wang, X.; Lee, T.H.; Jin, H.; Marler, B.; Guo, H.; et al. MCScanX: A toolkit for detection and evolutionary analysis of gene synteny and collinearity. Nucleic Acids Res. 2012, 40, e49. [Google Scholar] [CrossRef] [Green Version]
  67. Bailey, T.L.; Boden, M.; Buske, F.A.; Frith, M.; Grant, C.E.; Clementi, L.; Ren, J.; Li, W.W.; Noble, W.S. MEME SUITE: Tools for motif discovery and searching. Nucleic Acids Res. 2009, 37, W202–W208. [Google Scholar] [CrossRef]
  68. Subramanian, B.; Gao, S.; Lercher, M.J.; Hu, S.; Chen, W.H. Evolview v3: A webserver for visualization, annotation, and management of phylogenetic trees. Nucleic Acids Res. 2019, 47, W270–W275. [Google Scholar] [CrossRef]
Figure 1. Chromosomal distribution and duplication events of MsGRAS proteins. (a) The tandem duplicated genes are marked by black arc trajectory. (b) The segmentally duplicated genes are connected by red lines, referring to the ten genes highlighted in green.
Ijms 22 07729 g001
Figure 2. Syntenic analysis of MsGRAS genes in M. sativa in comparison with those in four plant species (M. truncatula, G. max, O. sativa, and A. thaliana).
Ijms 22 07729 g002
Figure 3. Phylogenetic relationship, motif pattern, and gene structure of MsGRAS genes. (a) Phylogenetic tree of MsGRAS was constructed based on the full-length sequences of proteins using MEGA-X [34] based on the neighbor-joining (NJ) method. Bootstrap values for 1000 replicates were shown above the lines. (b) The motifs of M. sativa GRAS proteins predicted by MEME and plotted in TBtools. The motifs of 1–10 are displayed in different colored boxes. The protein length can be estimated using the scale at the bottom. The schematic of four conservative domains at the C-terminal regions of the MsGRAS members was combinations of motifs. (c) Gene structure of MsGRAS genes. Region coding for the GRAS domain (yellow) was determined in Batch Web CD Search Tool (BWCDST) on the NCBI website and plotted in TBtools software. “CDS without the region coding for the GRAS domain” (green), where the coding region does not cover the GRAS domain, are plotted based on the alfalfa genome annotation. gff file, which was input into TBtools together with hit export from BWCDST.
Ijms 22 07729 g003
Figure 4. VHIID domain of 51 MsGRAS proteins based on sequence alignment. The most conserved GRAS domain of VHIID was boxed in red.
Ijms 22 07729 g004
Figure 5. Phylogenetic analysis of GRAS proteins. The phylogenetic tree was generated by the neighbor-joining method derived from Clustal X alignment of GRAS amino acid sequences from M. truncatula, Arabidopsis, and M. sativa, respectively. Protein IDs are marked in colors for the three species, i.e., M. truncatula in green, Arabidopsis in red, and M. sativa in blue.
Ijms 22 07729 g005
Figure 6. Gene expression profiles of GRAS members in M. sativa. R3/L3/27: The roots (R) or leaves (L) were treated for 3 or 27 h under salinity stress; RD: Roots under drought stress. The color scale represents log10 expression values.
Ijms 22 07729 g006
Figure 7. Analysis of differential expression and cluster analysis under salt stress in M. sativa. (a) Comparisons of DEGs in alfalfa leaf tissue in response to salinity stress. The blue means up-regulation, orange means down-regulation. (b) Venn diagram of DEGs in three comparisons. L0 is the control group of leaf and L3 and L27 indicate salinity treatments on a leaf for 3 and 27 h, respectively. (c) Clustering of DEGs. A total of 12 clusters were achieved, and 6 MsGRAS genes were found in three ones, labeled with a red star.
Ijms 22 07729 g007
Figure 8. GO enrichment analysis of DEGs shared by clusters of 1, 5, 7 and the relative expression of MsGRAS genes of #5, 13, 27, 37, 50, 51. (a) Cluster 1 of GO enrichment. (b) Cluster 5 of GO enrichment. (c) Cluster 7 of GO enrichment. (d) Expression profiles of MsGRAS genes of #5, 13, 27, 37, 50, 51 from RNA-seq data (* p < 0.05, Student’s t-test).
Ijms 22 07729 g008
Figure 9. Expression profiles of six selected MsGRAS genes in response to salt and drought stress treatments. Expression levels are normalized to Ms-ACTIN, and error bars indicate standard deviation among three biological replicates. Asterisks indicate the corresponding genes were significantly up-regulated or down-regulated compared with the control (* p < 0.05, ** p < 0.01, *** p < 0.001; Student’s t-test).
Ijms 22 07729 g009
Figure 10. Expression of MsGRAS genes in response to three hormones of ABA, GA, and IAA. Expression levels are normalized to Ms-ACTIN, and error bars indicate standard deviation among three biological replicates. Asterisks indicate the corresponding genes were significantly up-regulated or down-regulated compared with the control (* p < 0.05, ** p < 0.01, *** p < 0.001; Student’s t-test).
Ijms 22 07729 g010
Table 1. Properties and predicted locations of MsGRAS proteins.
Gene NameGene Id in “Zhongmu No.1” AssemblyIsoelectric PointMolecular Weight (Da)Amino AcidsSubcellular LocalizationExpressed in RootExpressed in Leaf
MsGRAS1MsG0180004788.01.T016.4155,671.46487NucleusNoNo
MsGRAS2MsG0280007861.01.T015.1468,709.99601NucleusYesNo
MsGRAS3MsG0280007862.01.T015.1668,262.82596NucleusYesNo
MsGRAS4MsG0280007863.01.T015.3727,925.1246NucleusNoNo
MsGRAS5MsG0280009128.01.T015.4756,013.31503CytoplasmicYesYes
MsGRAS6MsG0280010628.01.T015.9646,813.87415CytoplasmicYesNo
MsGRAS7MsG0280011038.01.T015.4273,172.09639NucleusNoYes
MsGRAS8MsG0280011039.01.T015.1473,950.9646NucleusYesYes
MsGRAS9MsG0280011040.01.T015.4786,165.78761NucleusYesYes
MsGRAS10MsG0280011041.01.T015.2674,730.24657NucleusYesYes
MsGRAS11MsG0280011042.01.T015.5174,363.63656NucleusYesNo
MsGRAS12MsG0380012325.01.T016.16112,665.071002NucleusNoNo
MsGRAS13MsG0380015272.01.T01560,086.79548CytoplasmicYesYes
MsGRAS14MsG0380015408.01.T014.9361,268.48542NucleusYesYes
MsGRAS15MsG0380015569.01.T019.2442,996.71389NucleusYesYes
MsGRAS16MsG0380016451.01.T015.0964,121.06570NucleusYesYes
MsGRAS17MsG0480020975.01.T015.972,561.93634NucleusYesYes
MsGRAS18MsG0480020976.01.T015.9971,593.66636NucleusYesYes
MsGRAS19MsG0480021018.01.T015.6276,258.96673NucleusYesYes
MsGRAS20MsG0480021019.01.T015.2483,755.65735NucleusYesYes
MsGRAS21MsG0480021020.01.T015.568,897.38601NucleusYesYes
MsGRAS22MsG0480021642.01.T015.2361,704.47542NucleusYesYes
MsGRAS23MsG0480021764.01.T015.350,123.6452NucleusYesYes
MsGRAS24MsG0480021771.01.T015.9111,053.7998NucleusNoYes
MsGRAS25MsG0480021850.01.T015.236,549.71329ChloroplastYesYes
MsGRAS26MsG0480023446.01.T015.5843,284.82377CytoplasmicNoNo
MsGRAS27MsG0580024328.01.T015.5254,028.86481CytoplasmicYesYes
MsGRAS28MsG0580024757.01.T016.147,251.93417CytoplasmicNoNo
MsGRAS29MsG0580027451.01.T056.6130,294.32271ChloroplastNoNo
MsGRAS30MsG0580027451.01.T046.5234,146.74304ChloroplastNoNo
MsGRAS31MsG0580027451.01.T015.0352,231.82467NuclearNoNo
MsGRAS32MsG0580027451.01.T034.8655,748.52498CytoplasmicNoNo
MsGRAS33MsG0580027451.01.T024.8456,619.51505CytoplasmicNoNo
MsGRAS34MsG0580029906.01.T015.1359,194.08524CytoplasmicYesYes
MsGRAS35MsG0580030094.01.T01640,152.43362NucleusYesYes
MsGRAS36MsG0680032758.01.T016.4174,615.66671ChloroplastYesYes
MsGRAS37MsG0680033030.01.T016.6274,073.15666ChloroplastYesYes
MsGRAS38MsG0780037085.01.T015.6175,040.53676NucleusNoNo
MsGRAS39MsG0780037984.01.T015.681,306.47730NucleusYesYes
MsGRAS40MsG0780037985.01.T015.481,430.55731NucleusYesYes
MsGRAS41MsG0780038783.01.T015.9369,852.63623NucleusYesYes
MsGRAS42MsG0780039578.01.T016.1973,091.07658NucleusYesYes
MsGRAS43MsG0780041365.01.T015.5864,634.64556NucleusNoNo
MsGRAS44MsG0880042740.01.T015.7261,482.27552NucleusYesNo
MsGRAS45MsG0880044171.01.T014.7761,196.24541CytoplasmicYesNo
MsGRAS46MsG0880045957.01.T015.6643,074.96383CytoplasmicYesNo
MsGRAS47MsG0880045975.01.T025.4239,808.08353CytoplasmicNoNo
MsGRAS48MsG0880045975.01.T015.537,882335CytoplasmicNoNo
MsGRAS49MsG0880045989.01.T014.9823,447.59204NuclearNoNo
MsGRAS50MsG0880046208.01.T015.5175,345.09678ChloroplastYesNo
MsGRAS51MsG0880047717.01.T015.8160,581.39540NucleusYesYes
Publisher’s Note: MDPI stays neutral with regard to jurisdictional claims in published maps and institutional affiliations.

