
Necrostatin-1 Supplementation to Islet Tissue Culture Enhances the In-Vitro Development and Graft Function of Young Porcine Islets


 and
and 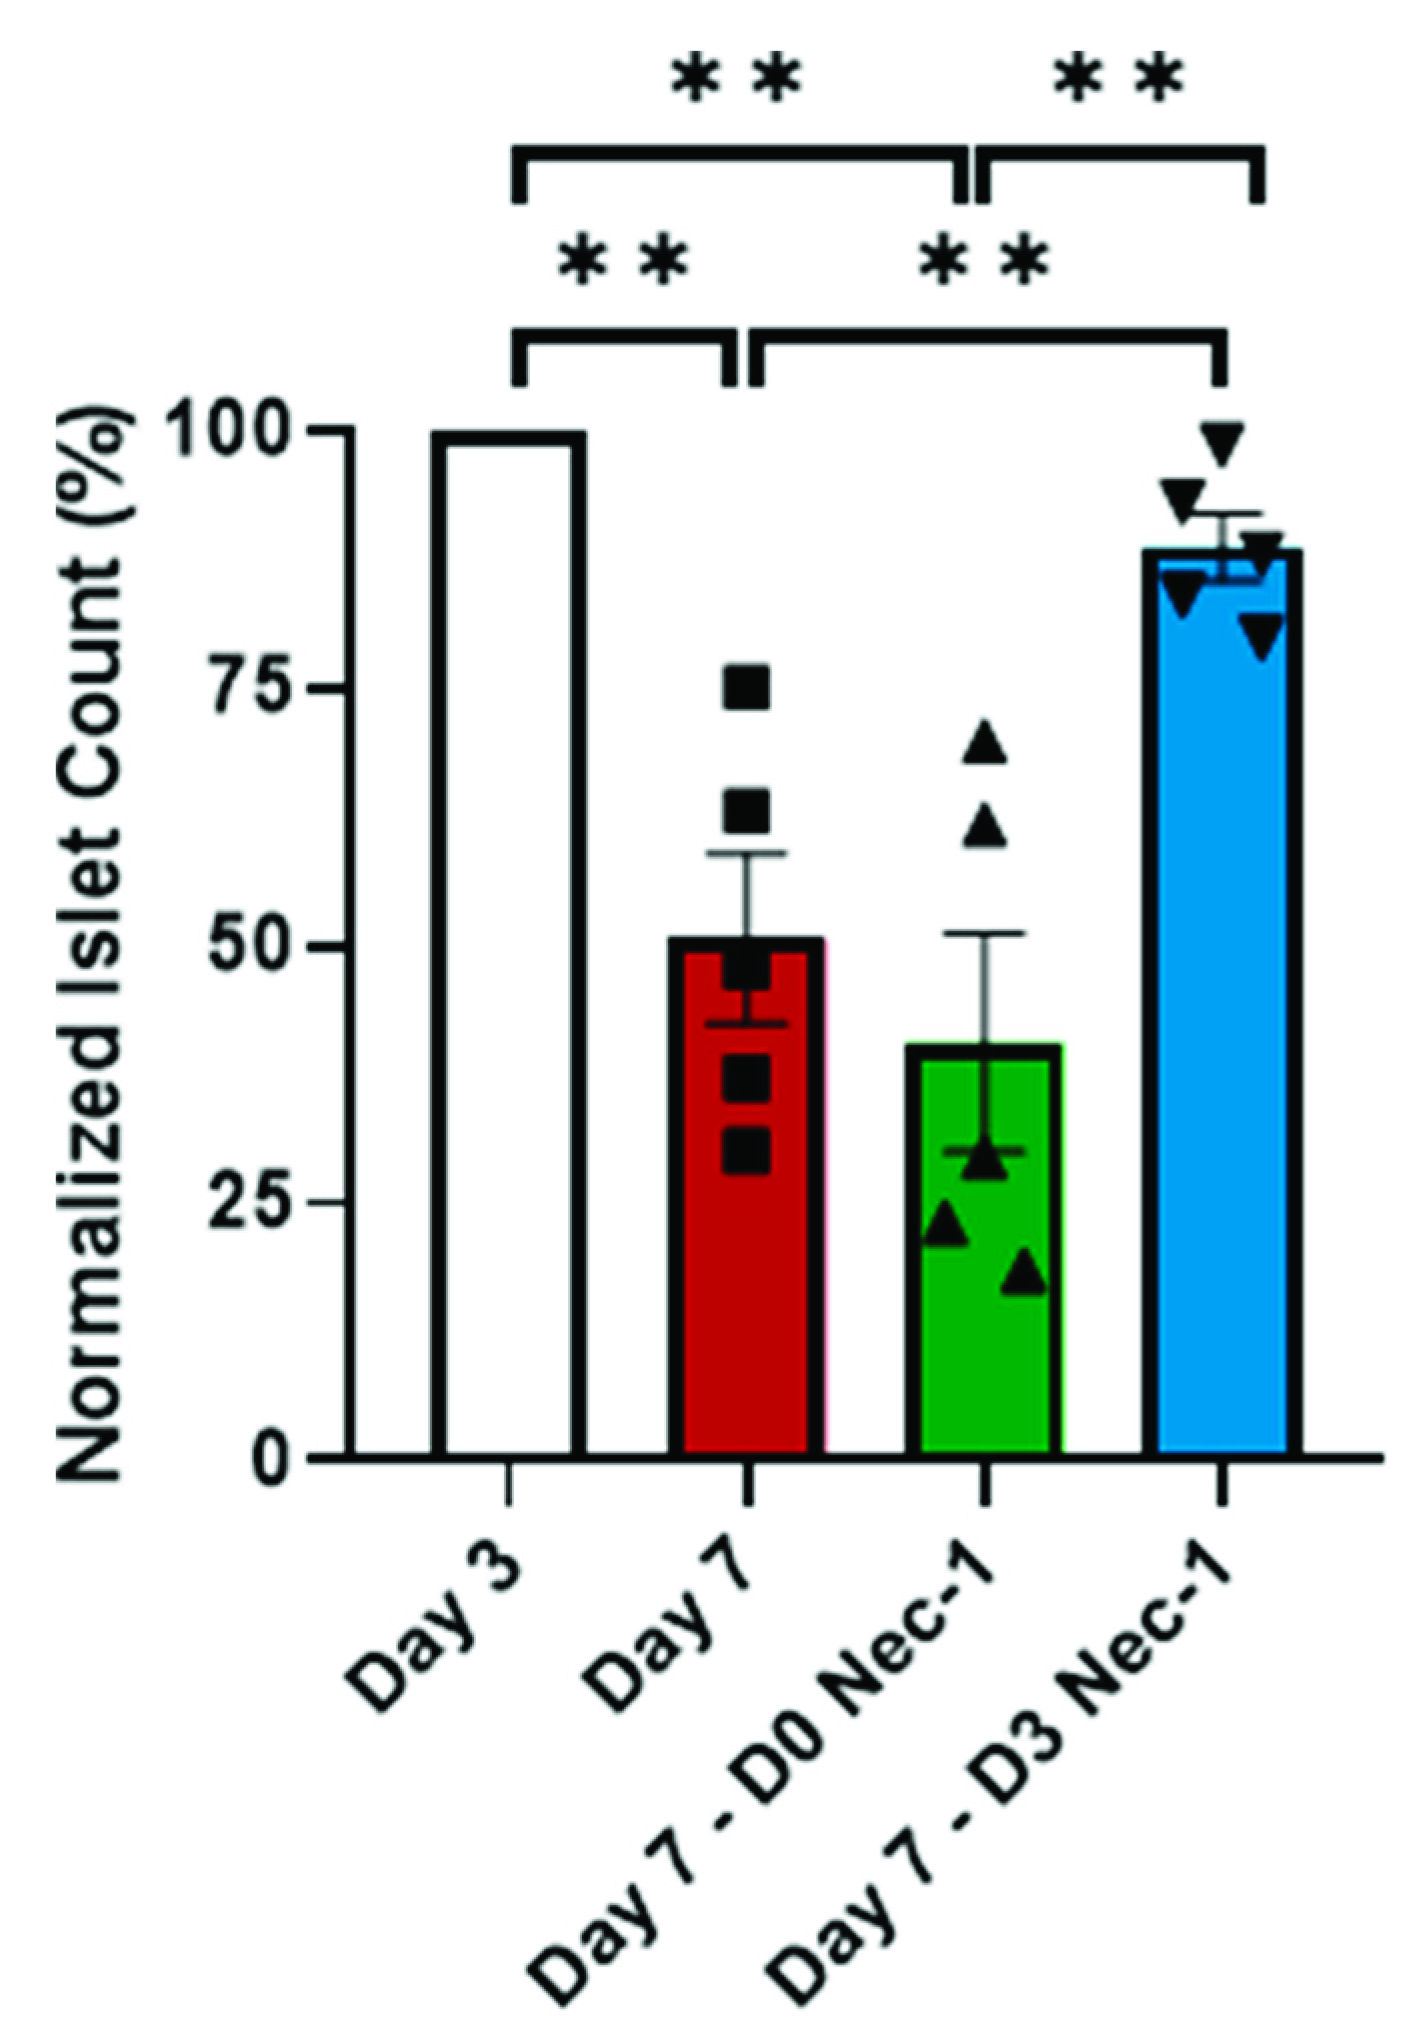
Abstract
:1. Introduction
2. Results
2.1. Nec-1 Supplementation on Day 3 of Tissue Culture Improves Islet Recovery
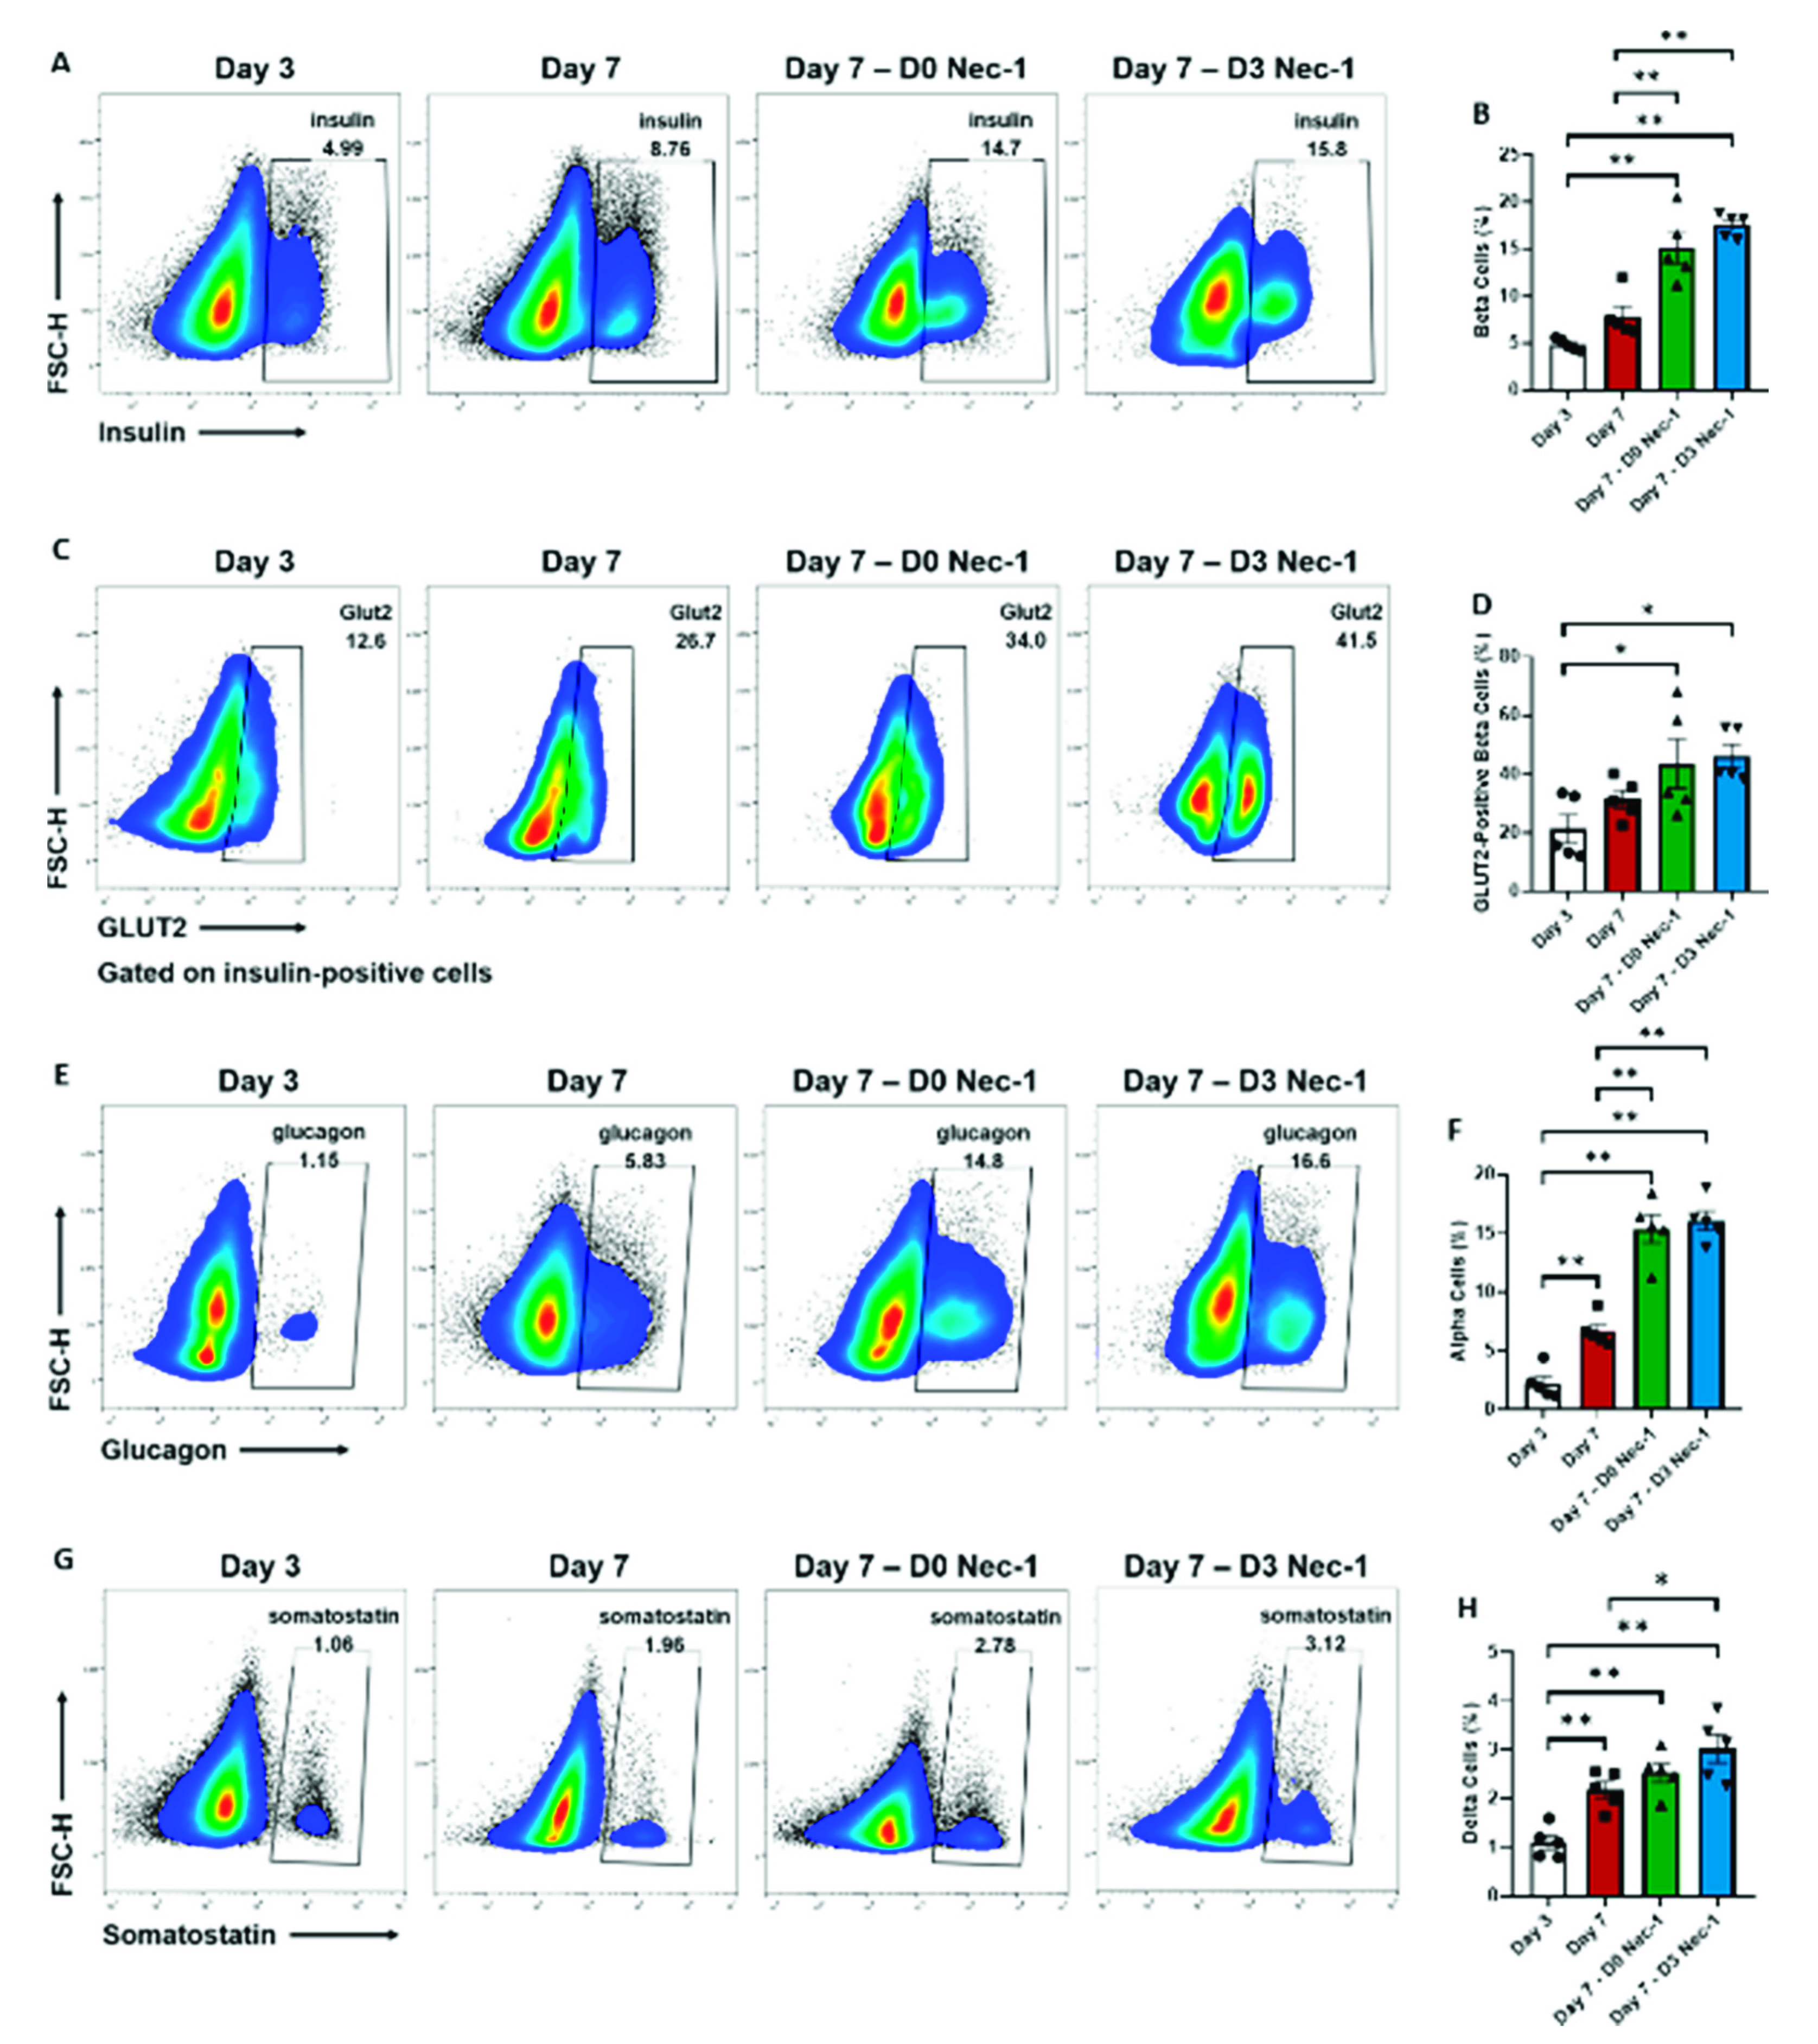
2.2. Nec-1 Supplementation on Day 3 of Tissue Culture Enhances the Development of Islet Endocrine Cells and Upregulates the Expression of GLUT2 in Beta Cells
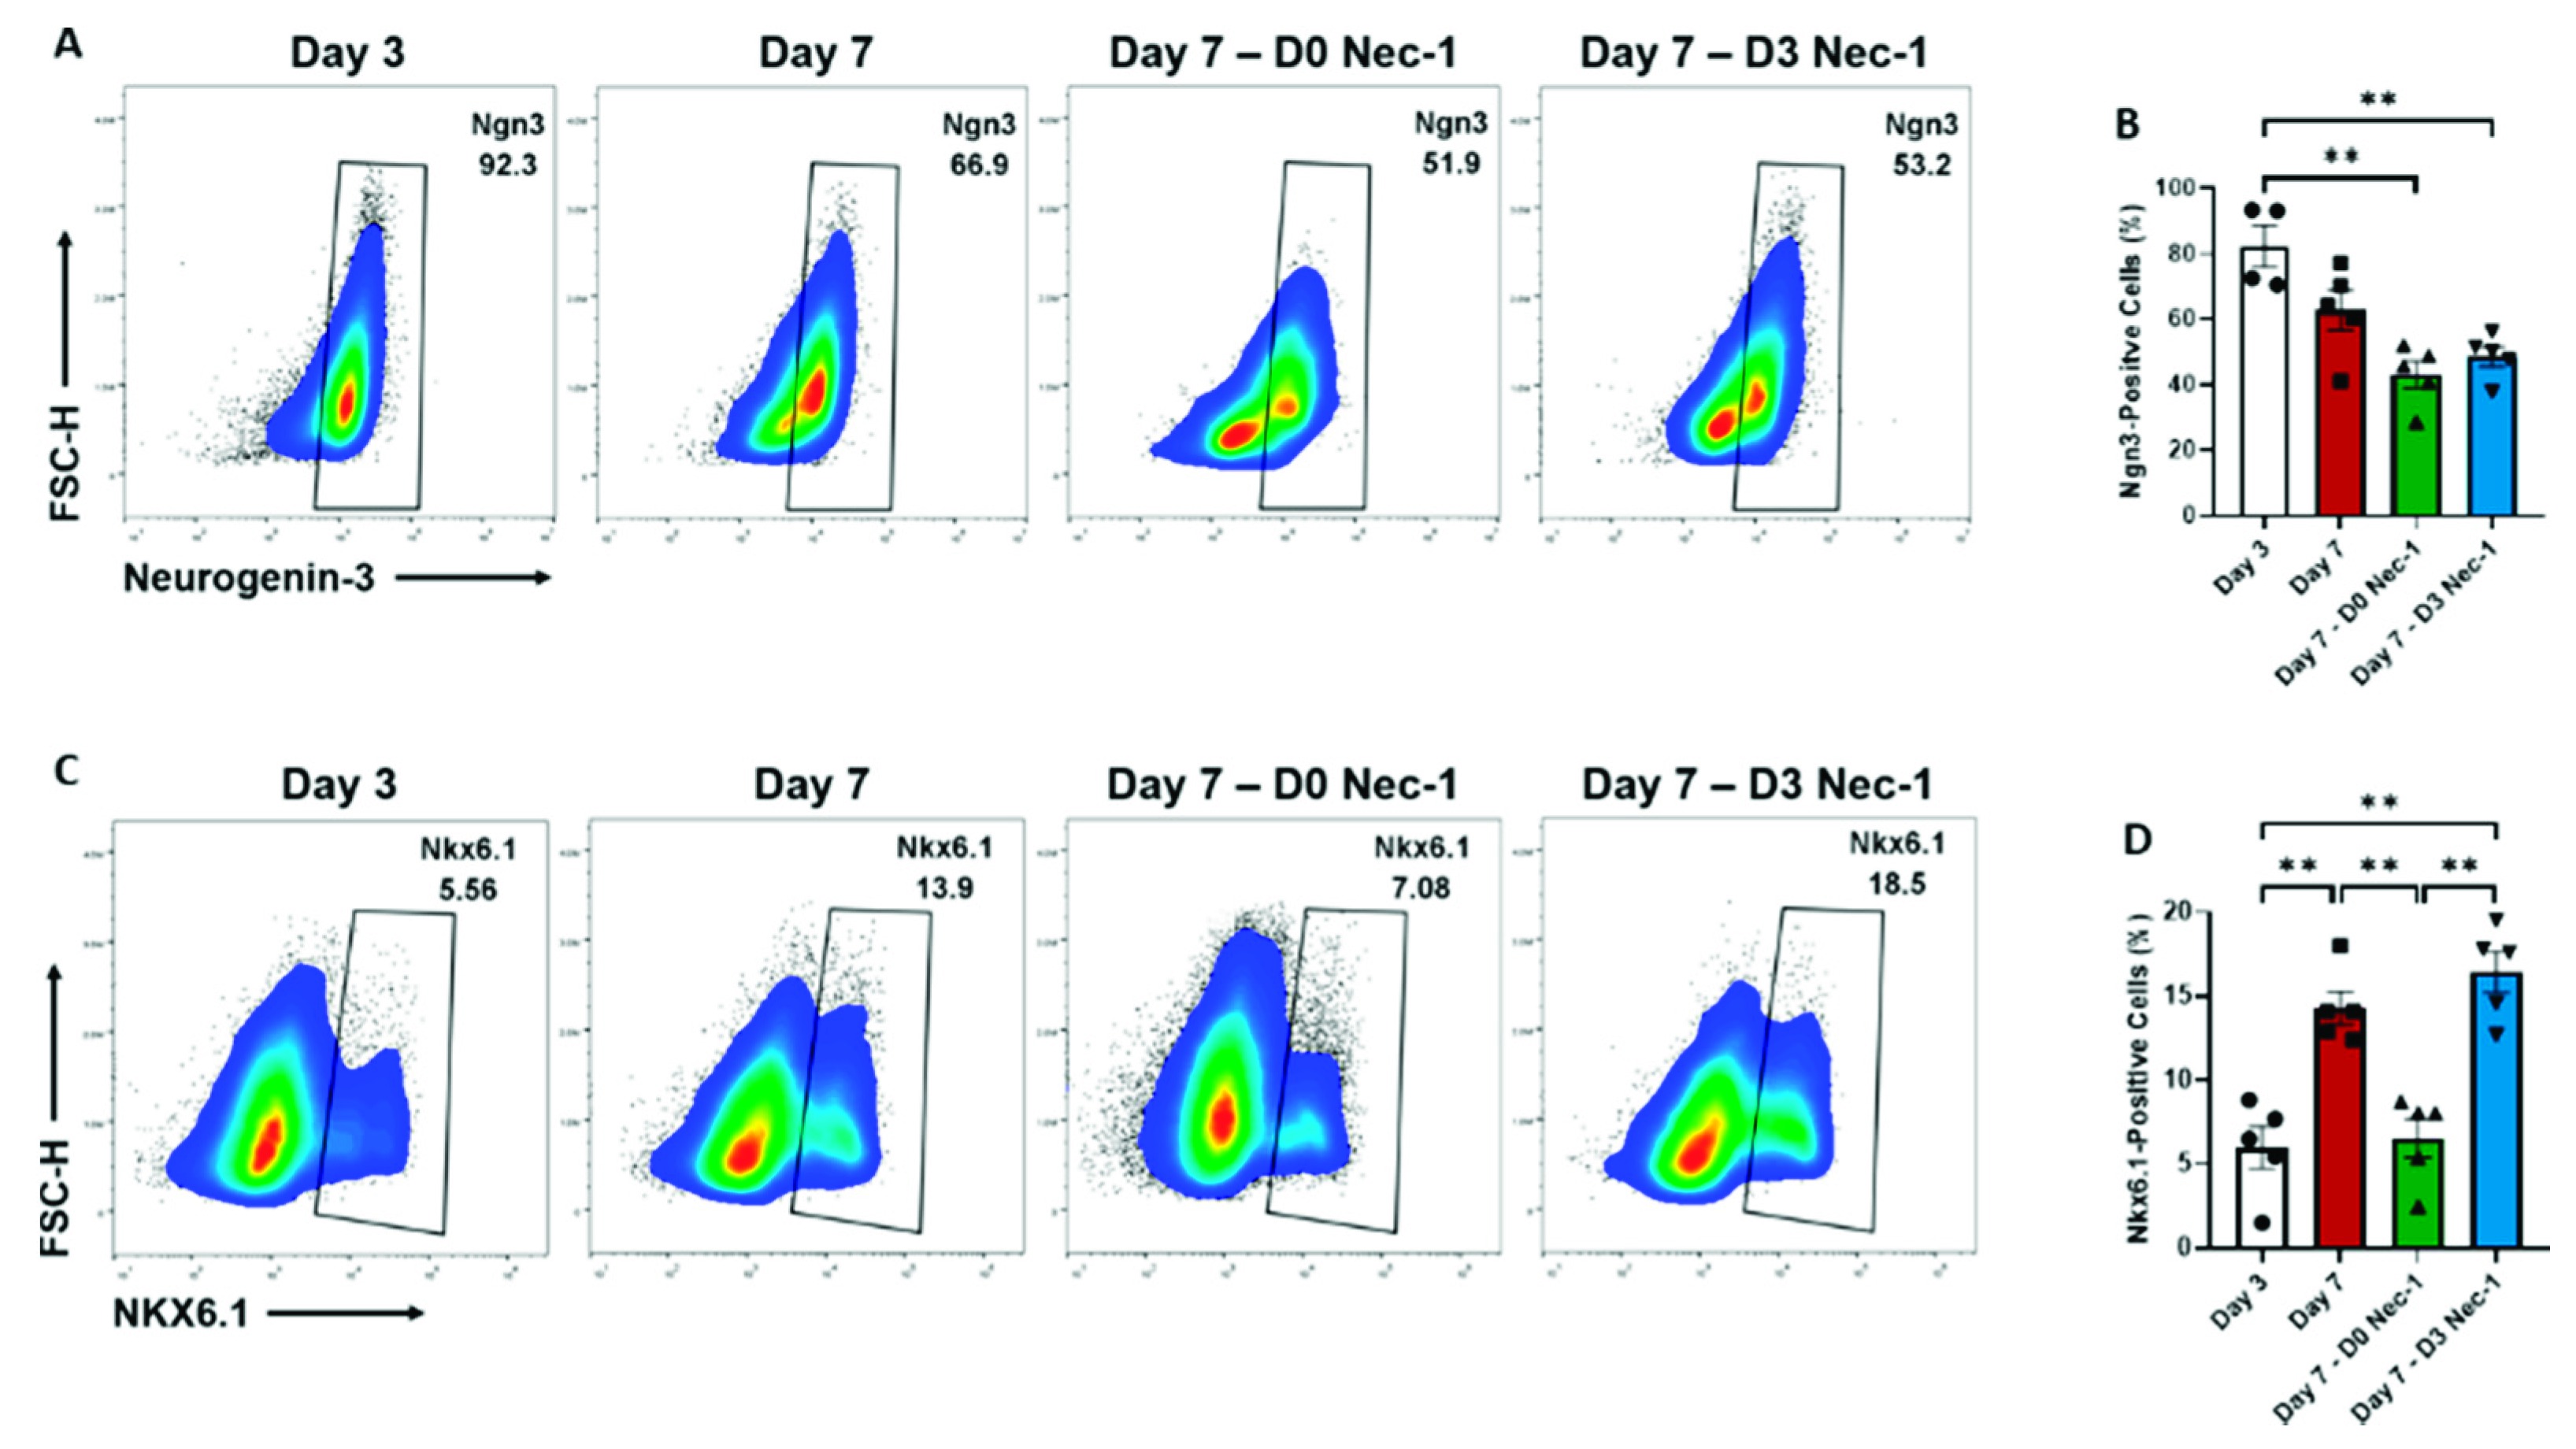
2.3. Nec-1 Supplementation on Day 3 of Tissue Culture Improves the Differentiation of Pancreatic Progenitor Cells
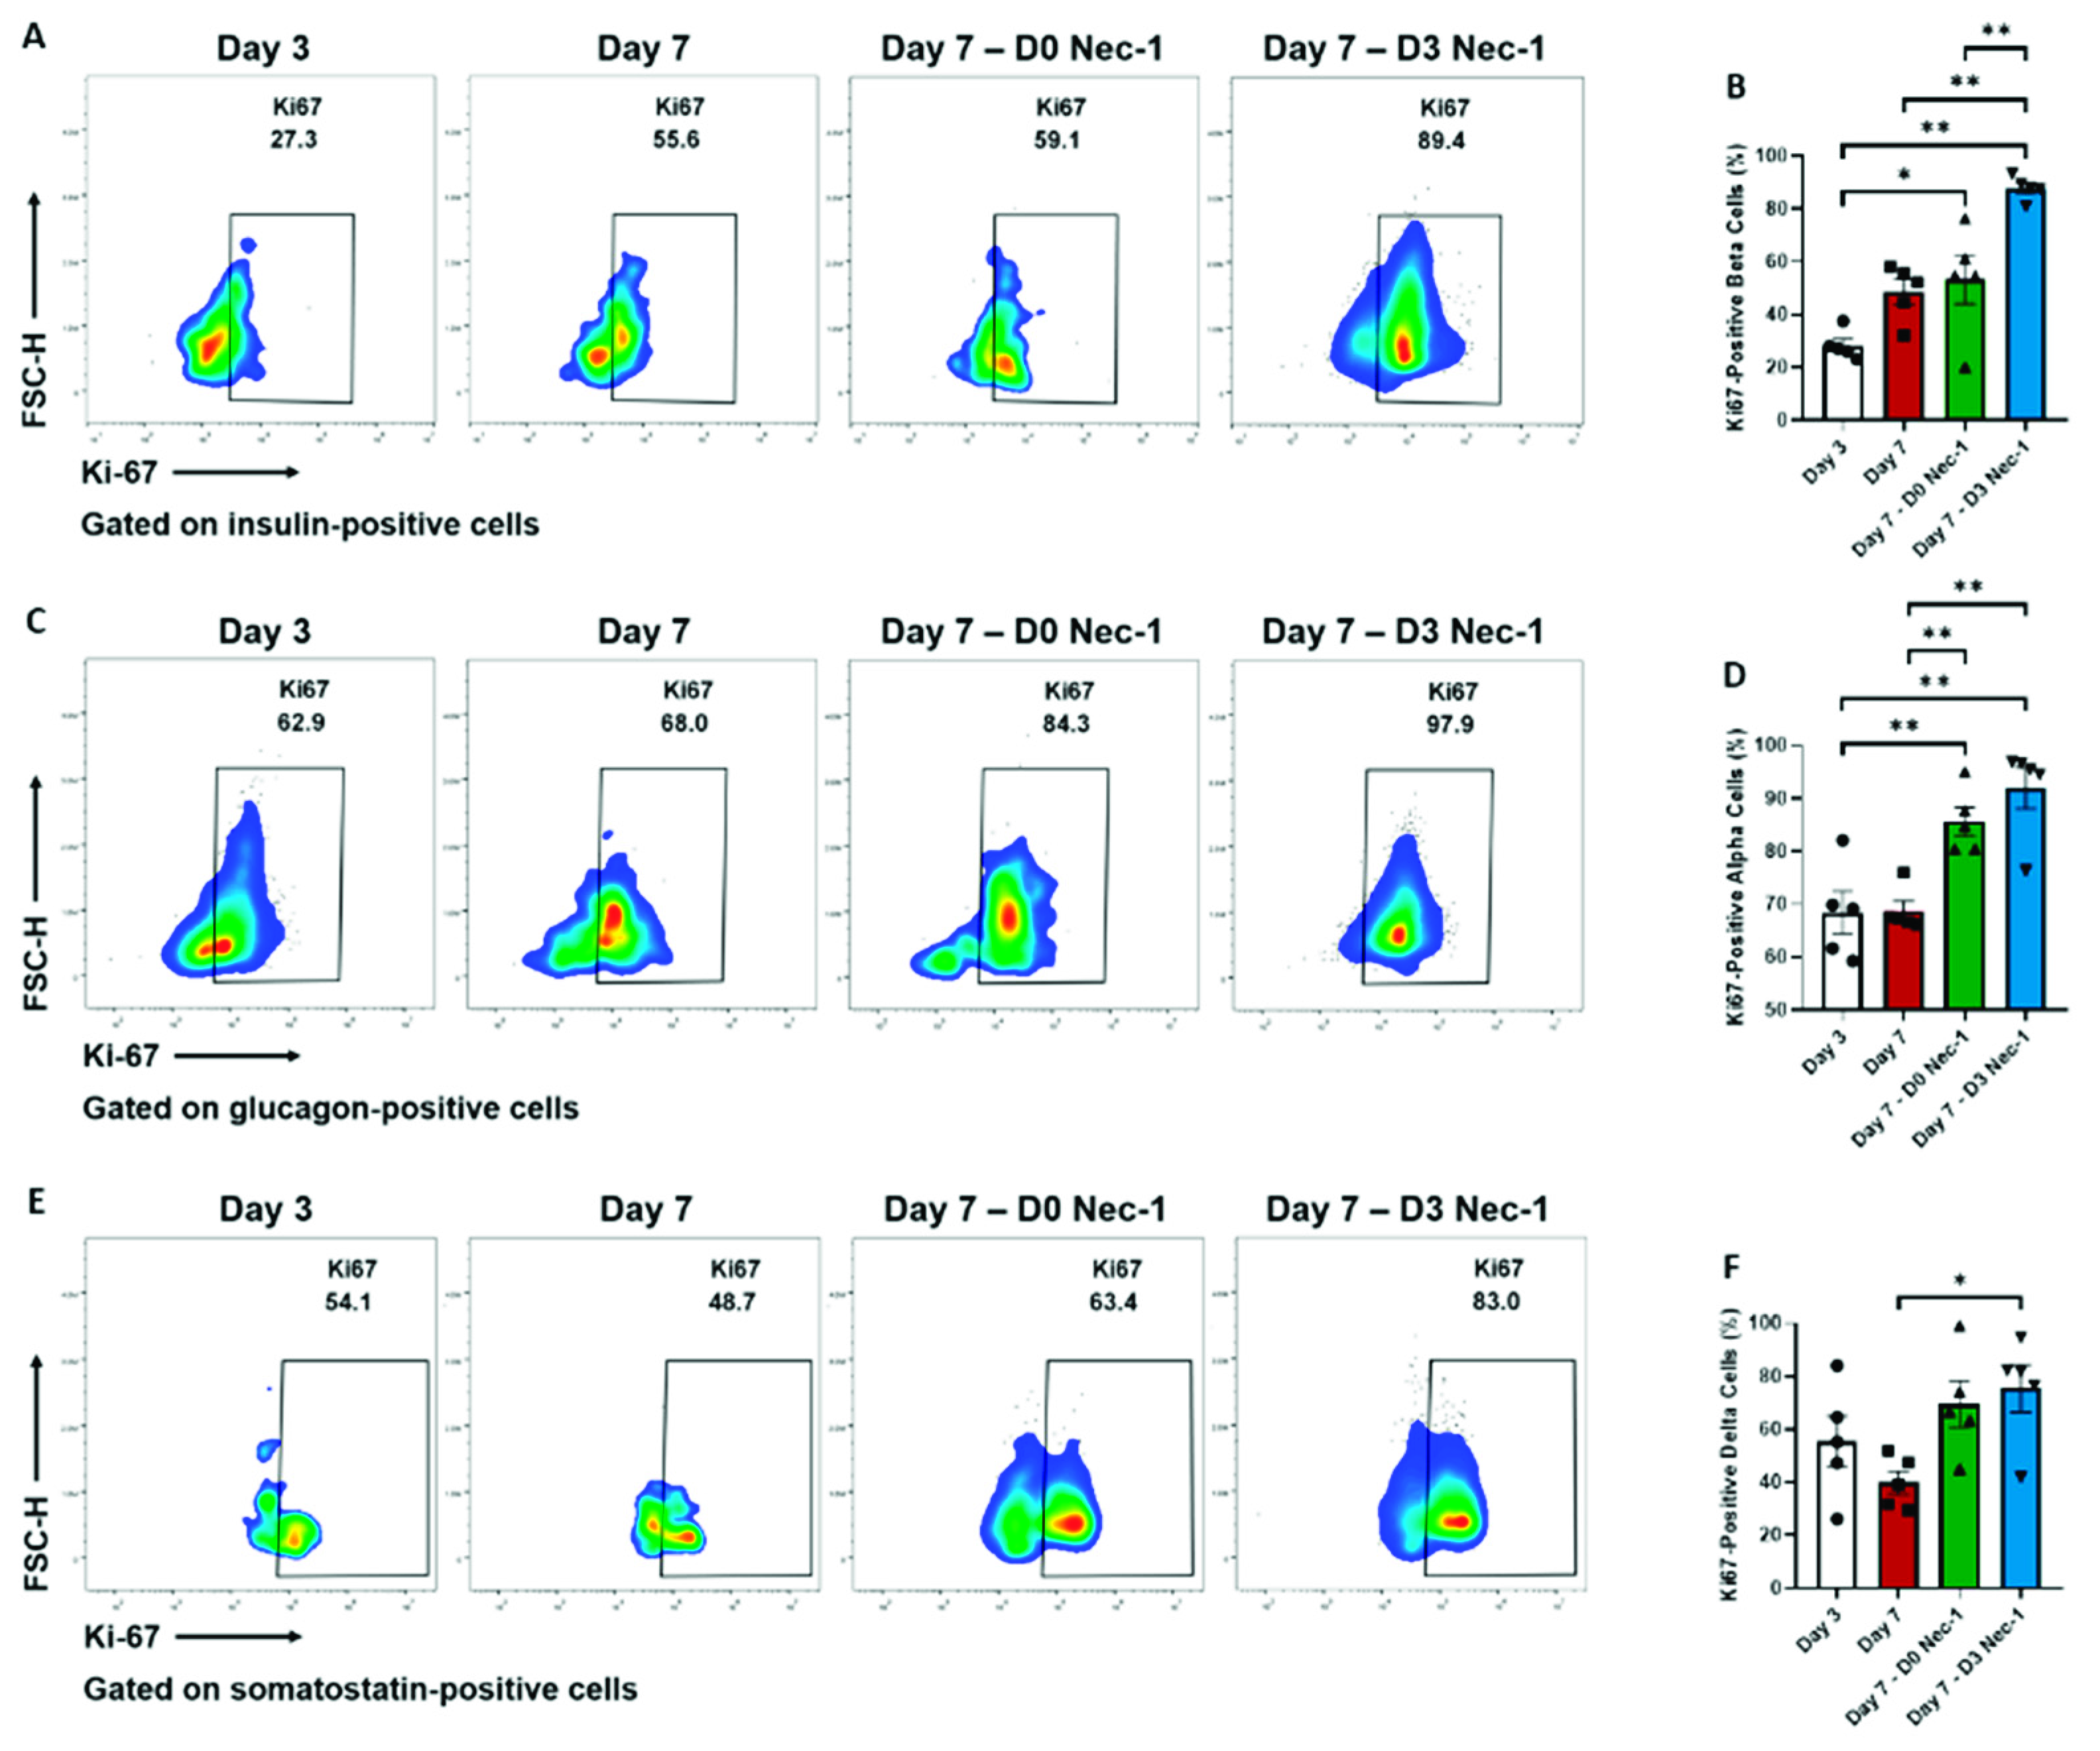
2.4. Nec-1 Supplementation on Day 3 of Tissue Culture Stimulates the Proliferation of Islet Endocrine Cells
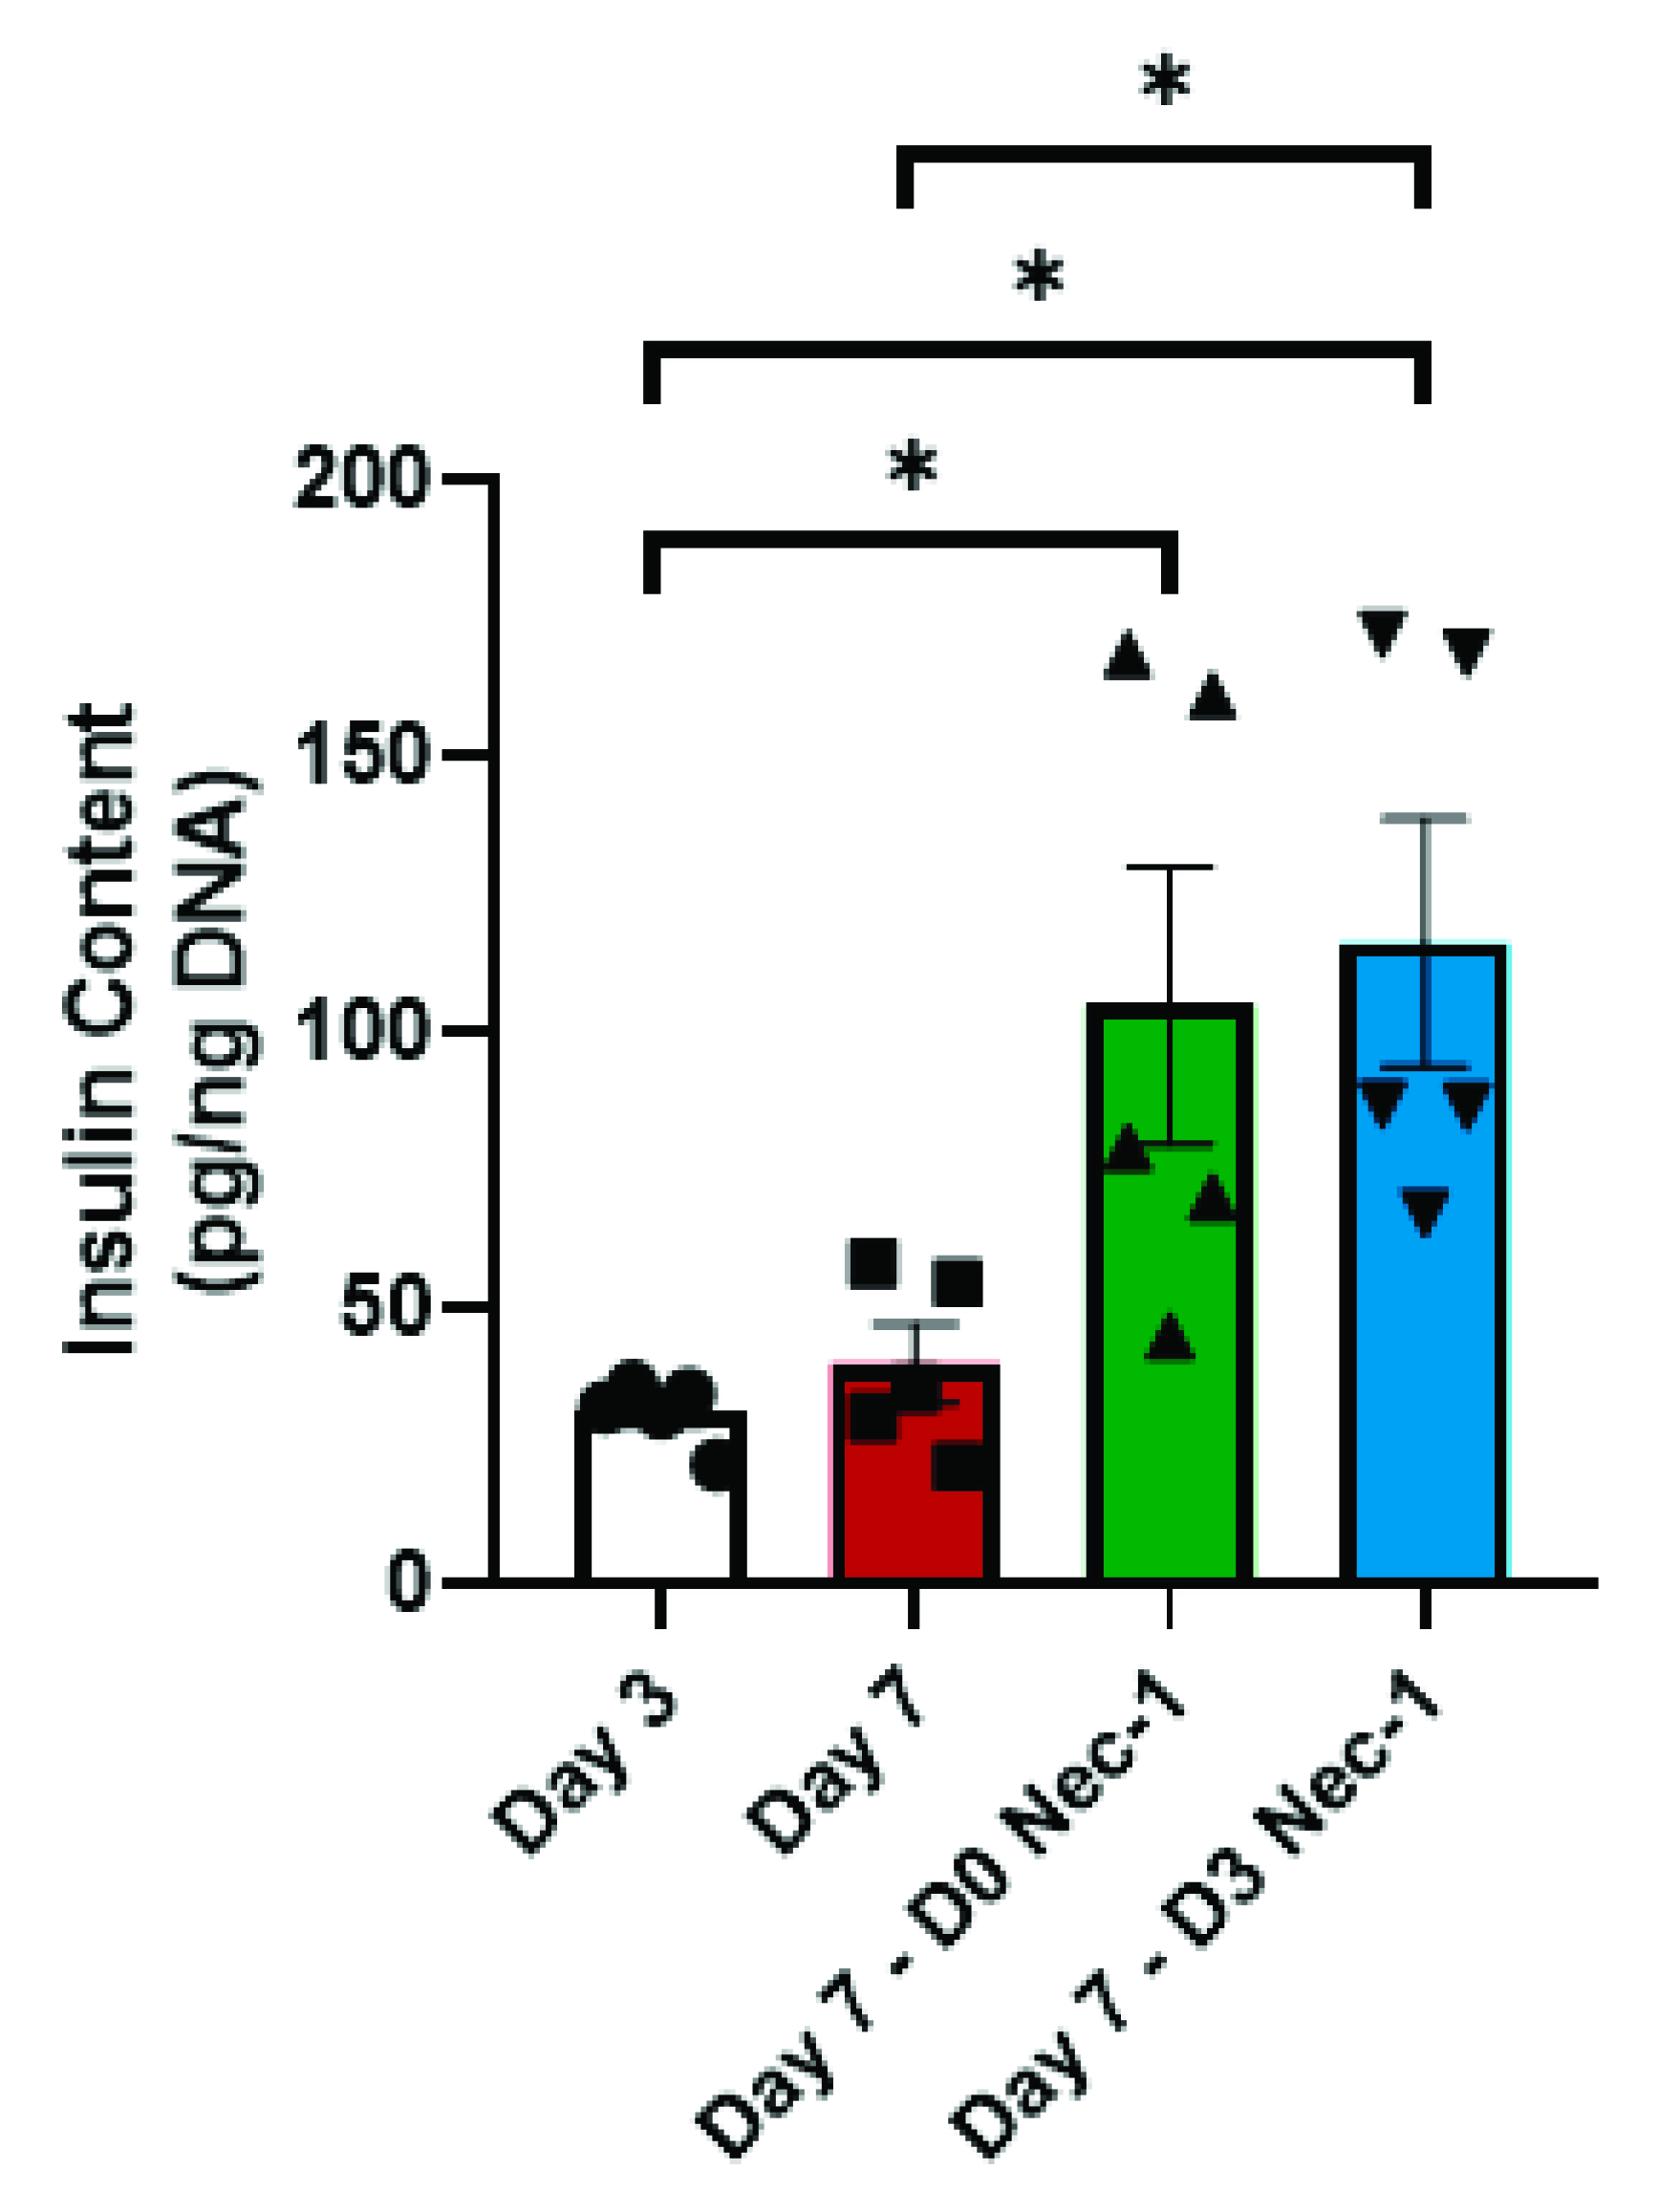
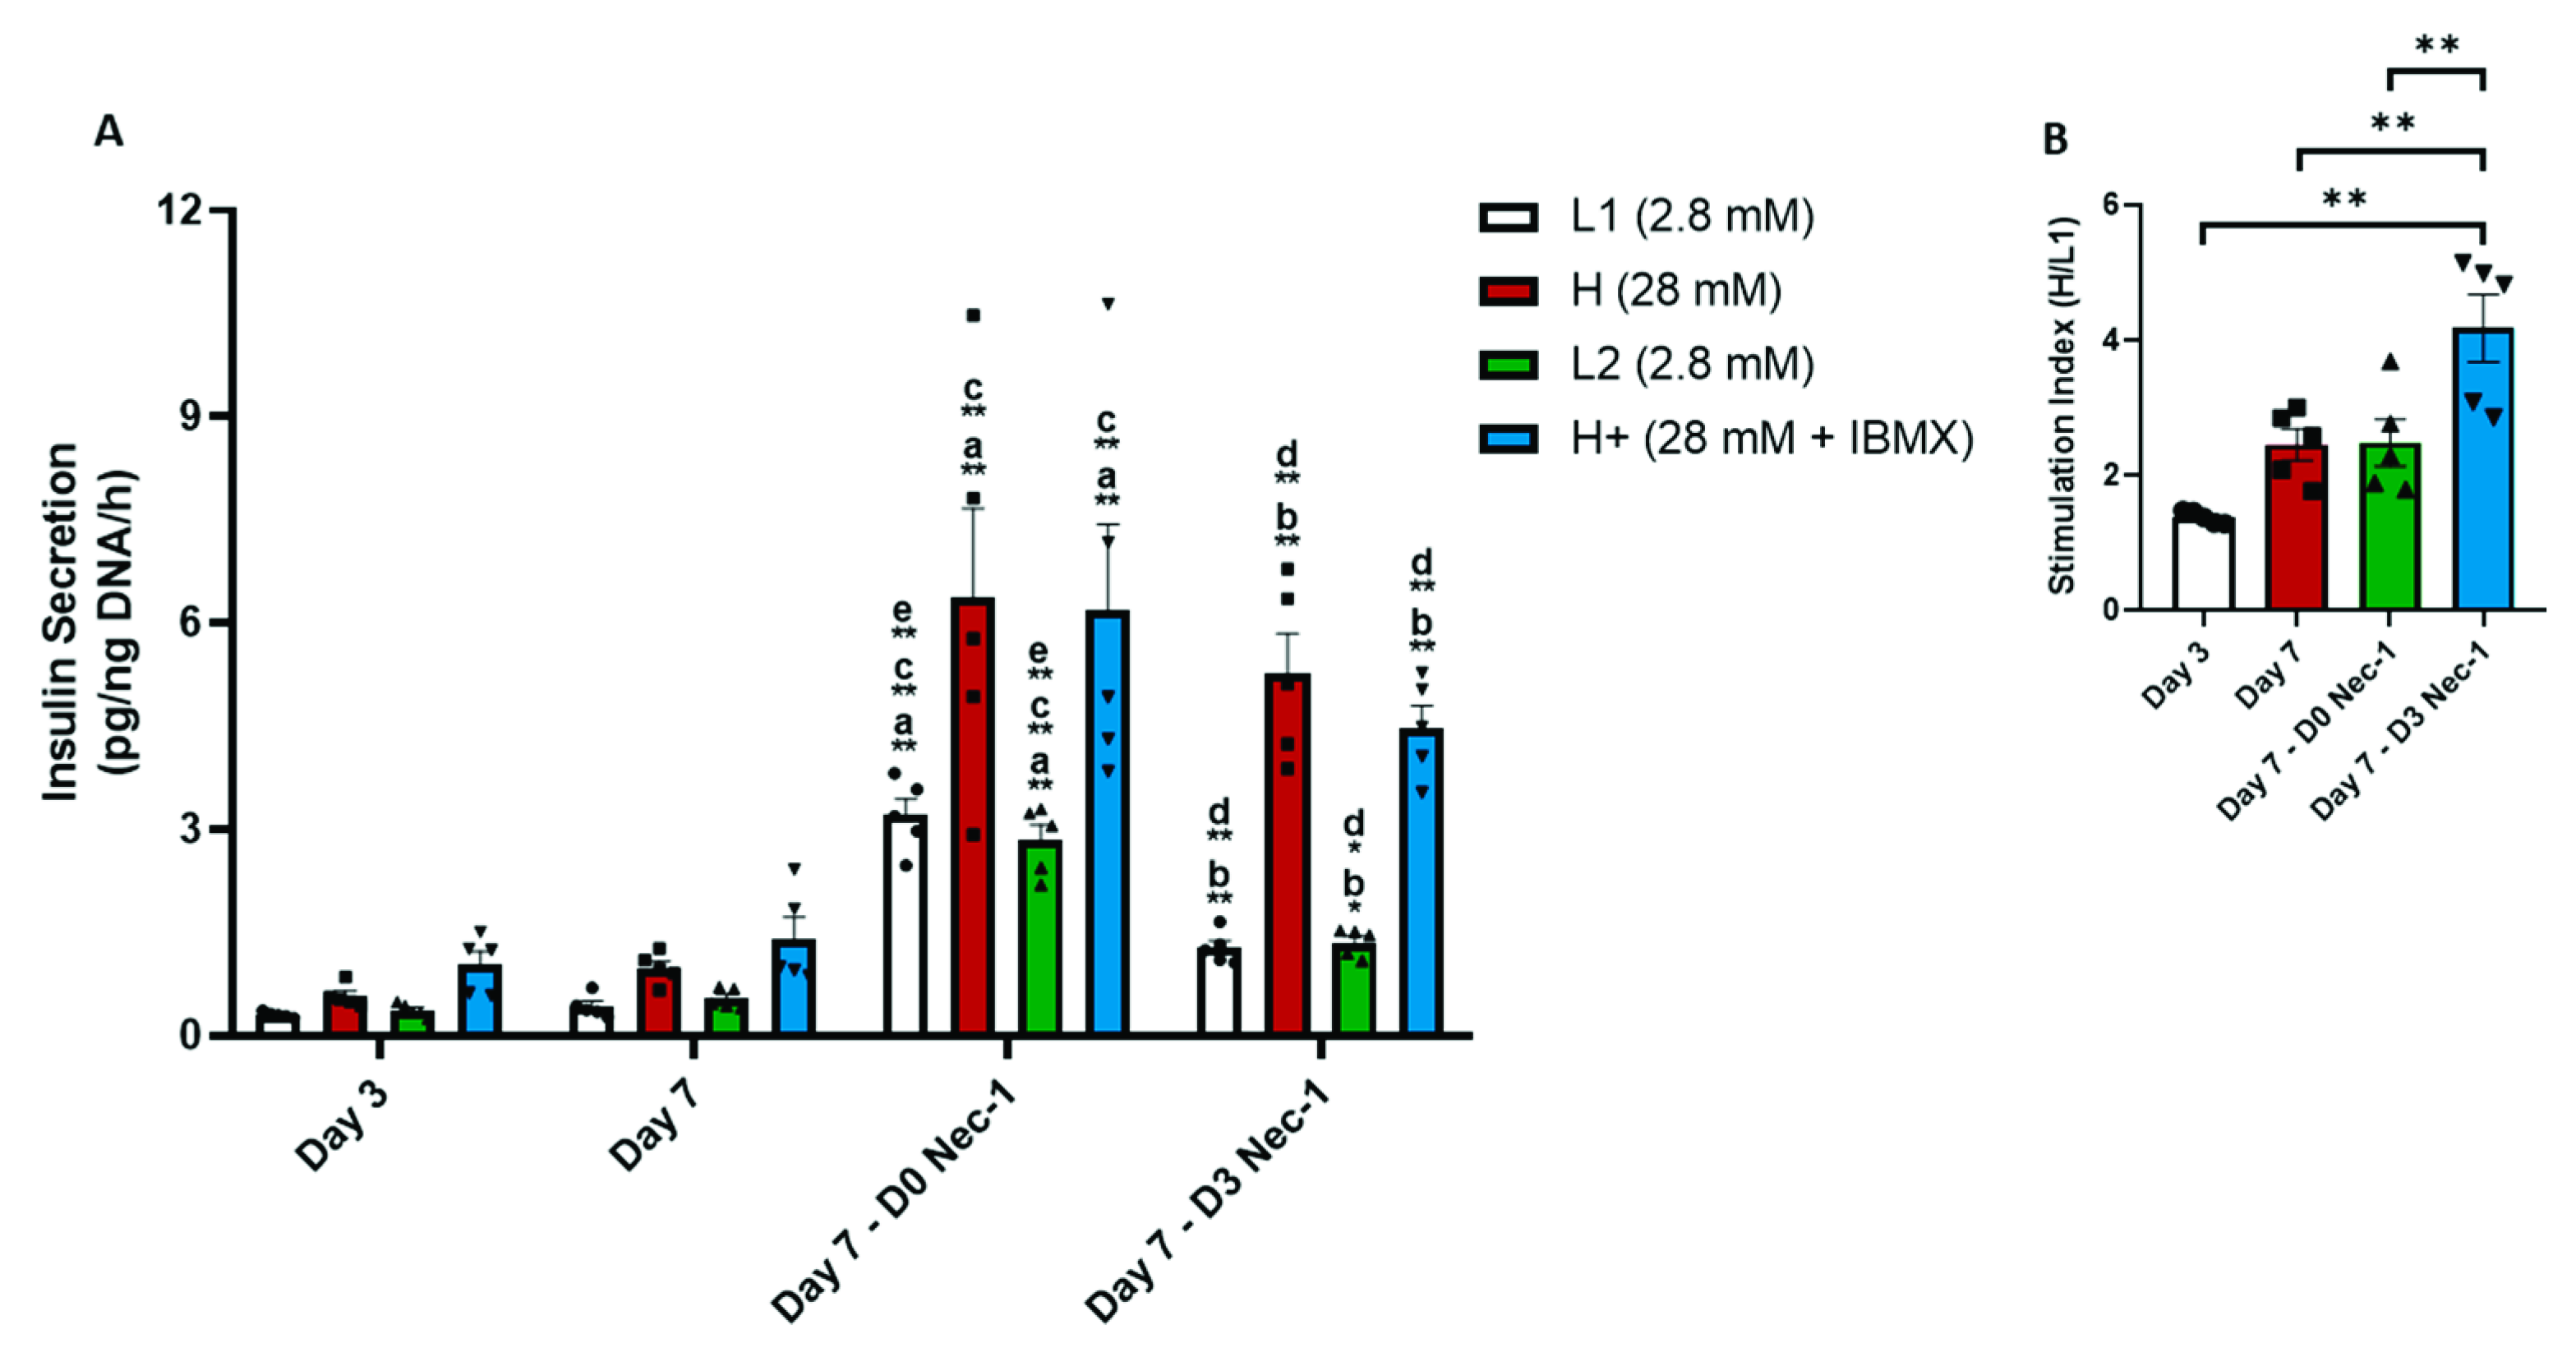
2.5. Nec-1 Supplementation on Day 3 of Tissue Culture Increases Insulin Content and Glucose-Stimulated Insulin Secretion
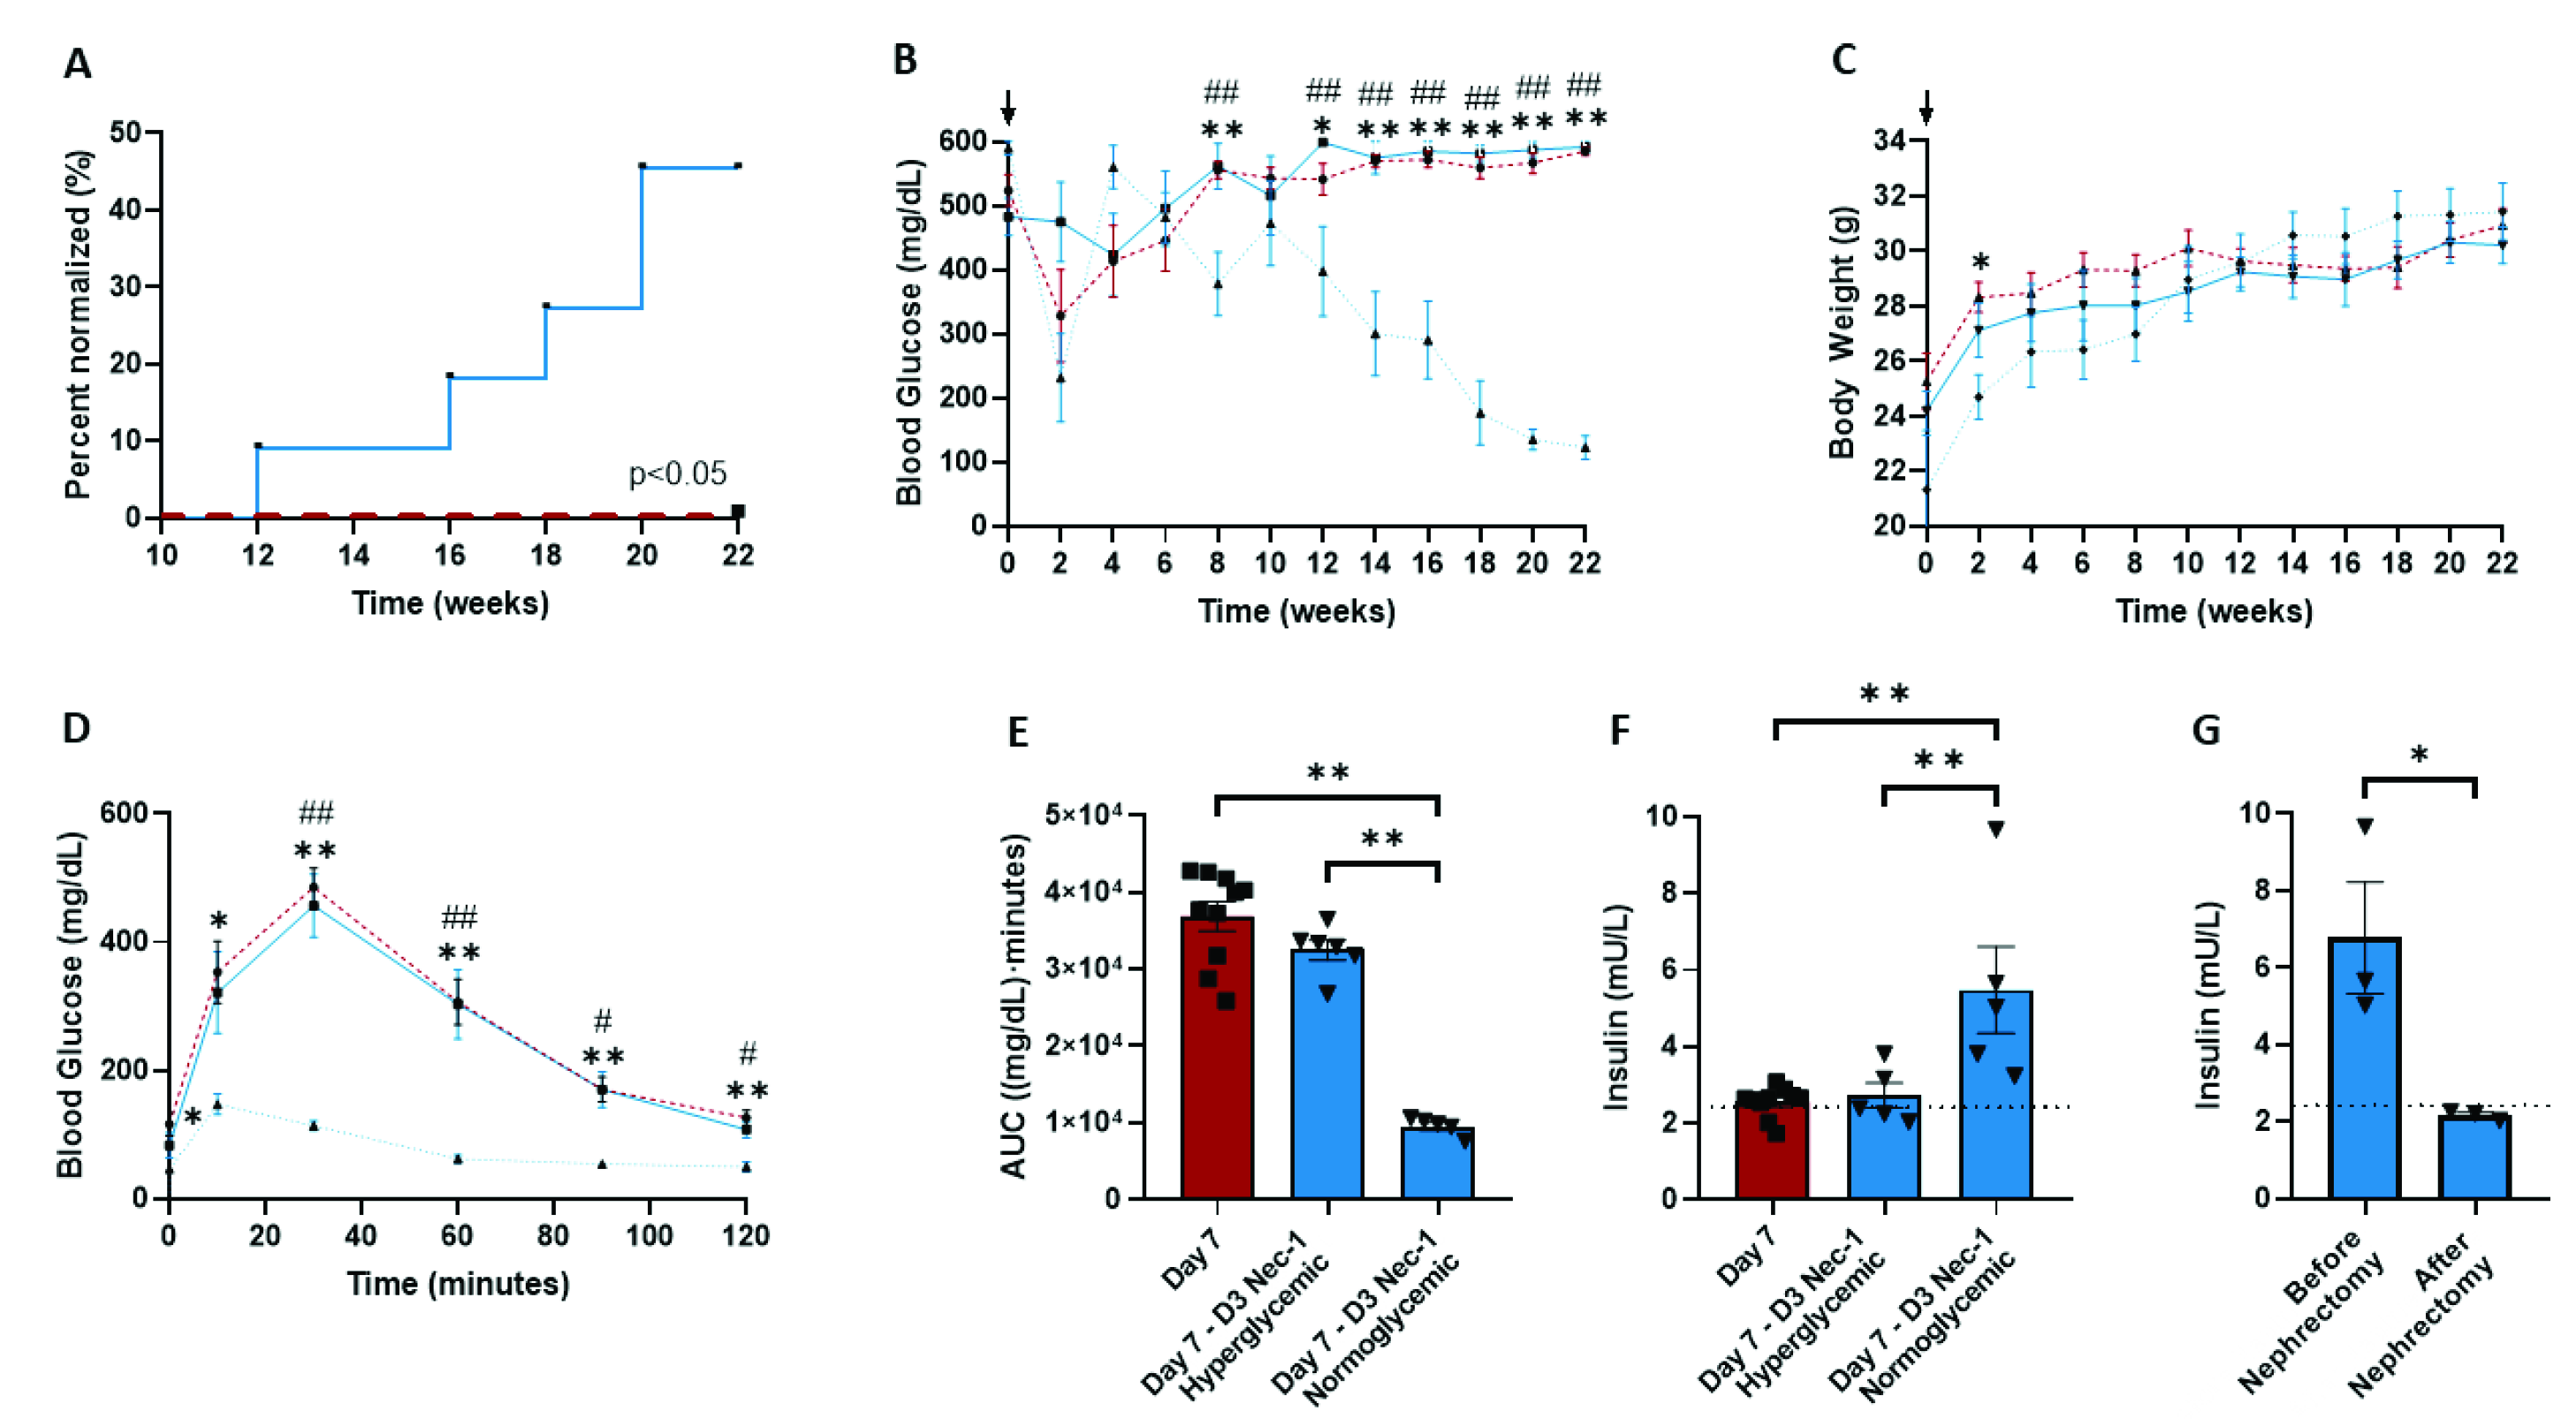
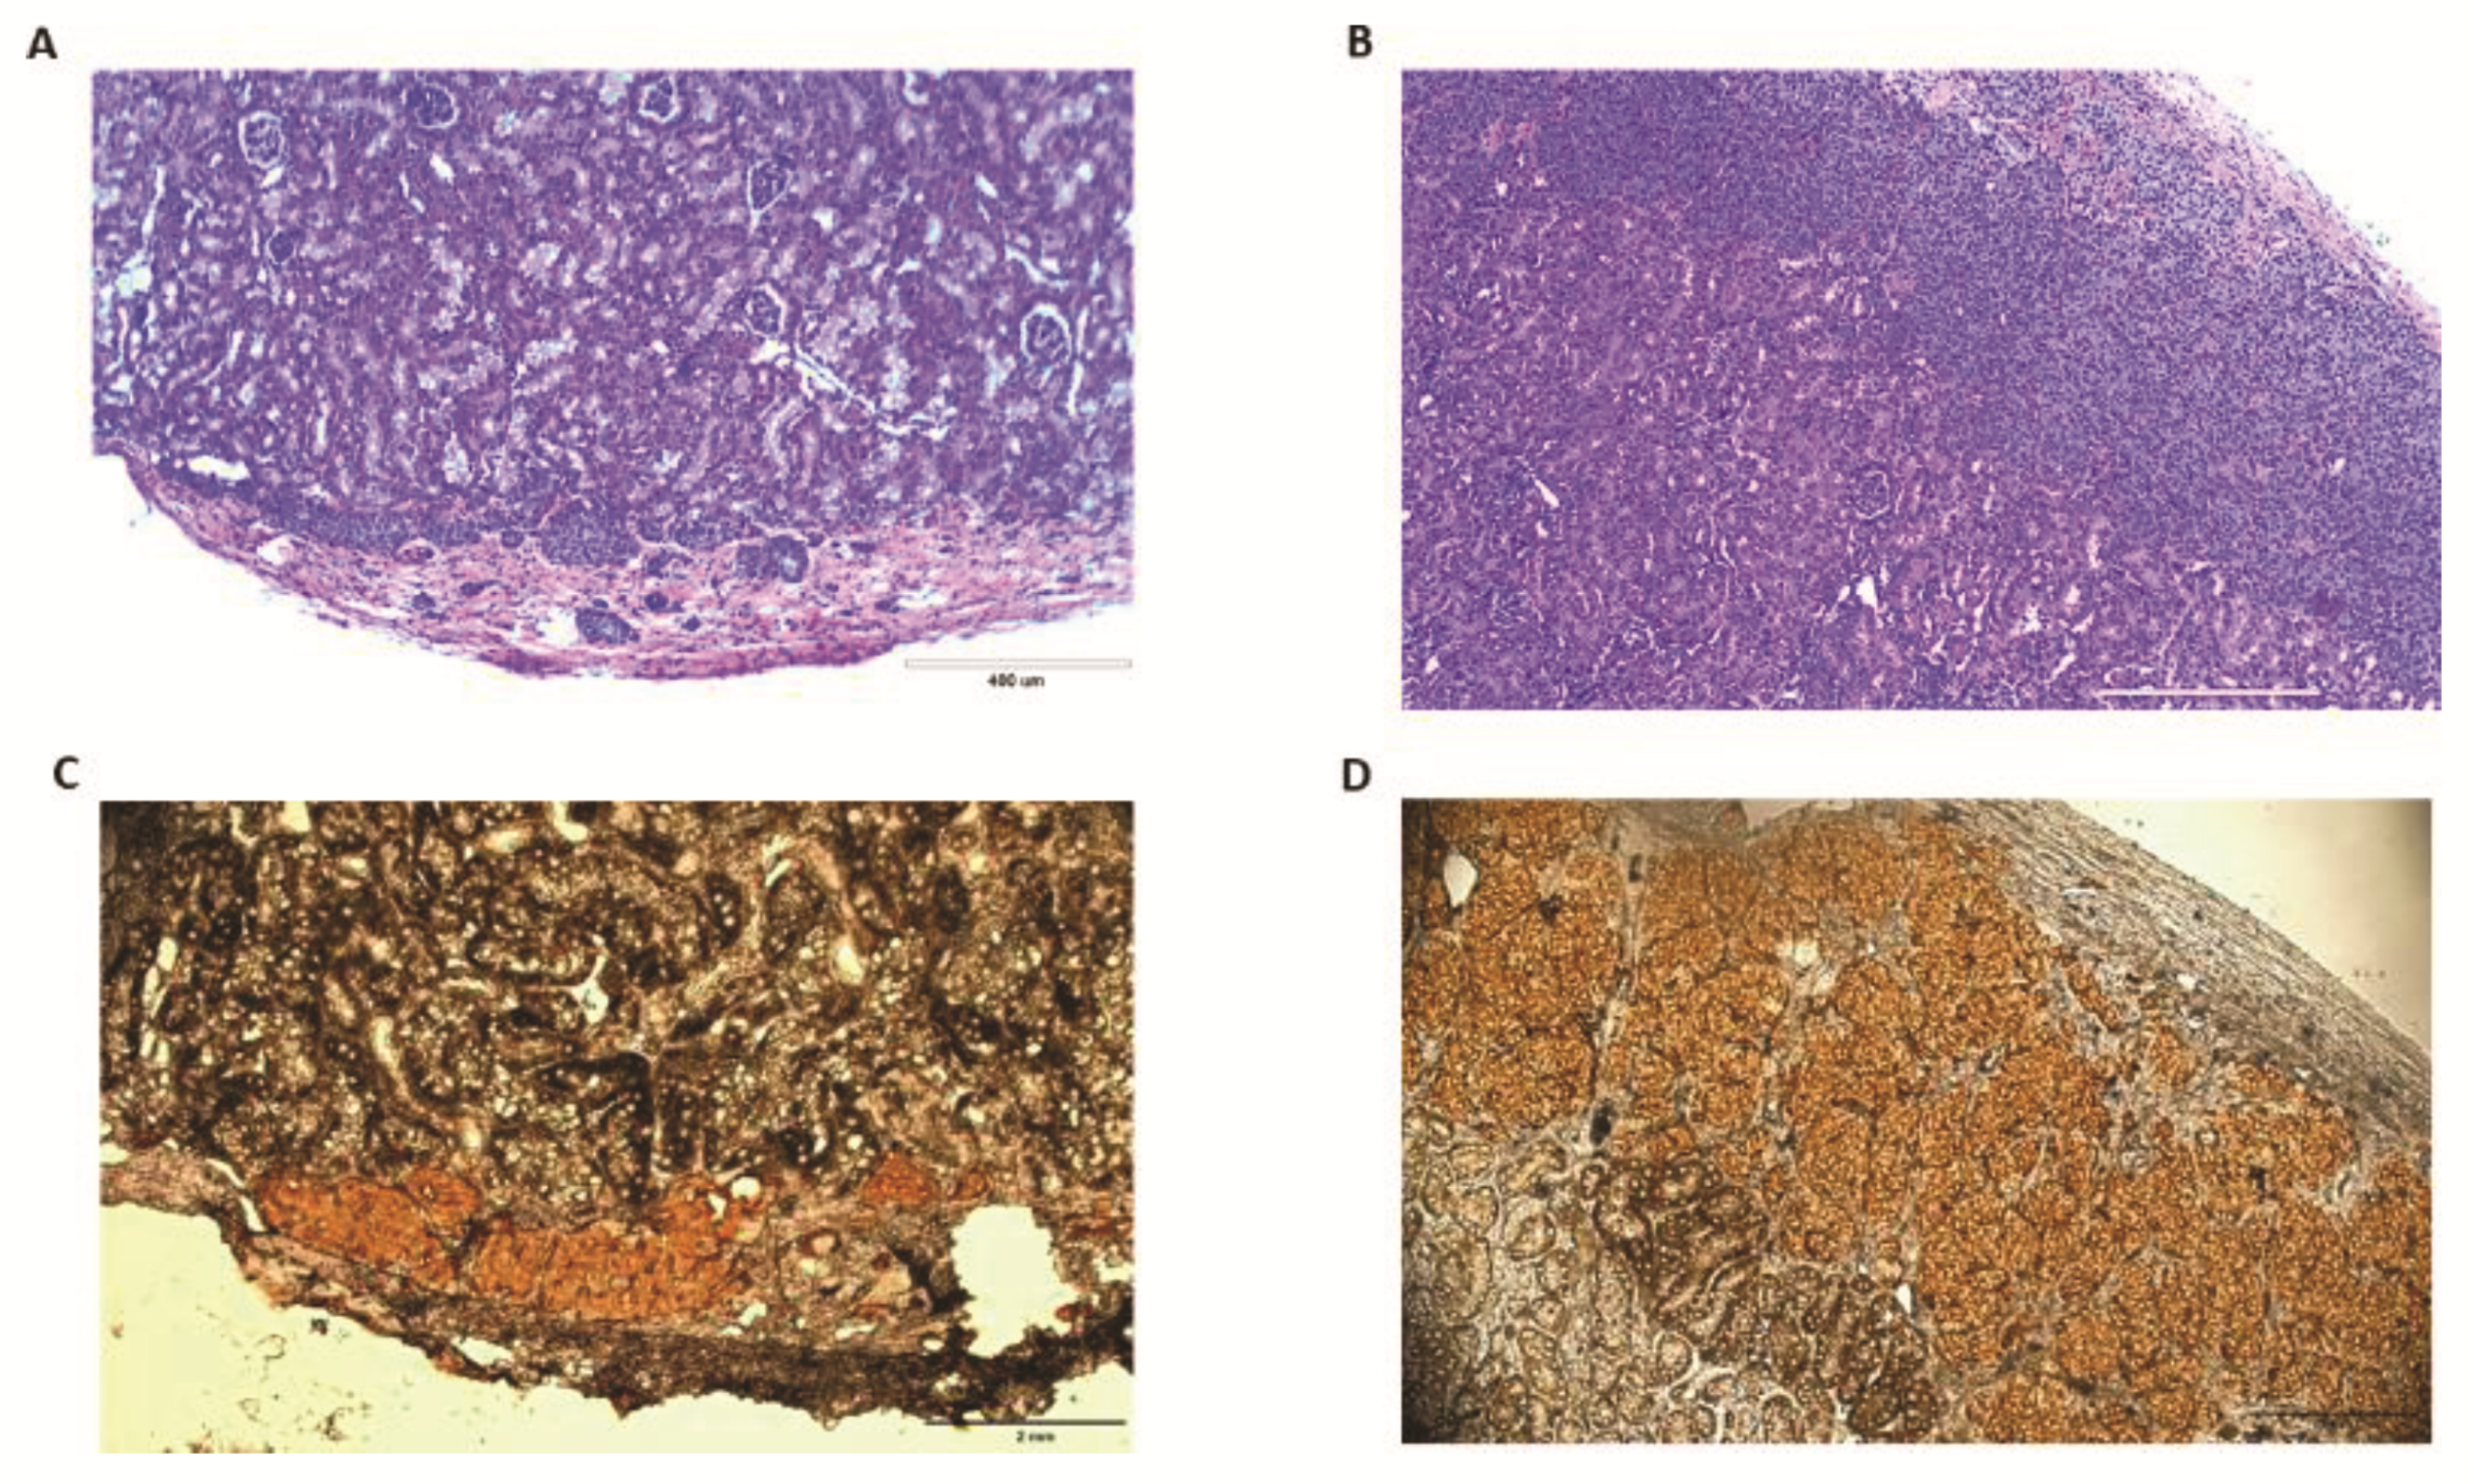
2.6. Nec-1 Supplementation on Day 3 of Tissue Culture Improves Islet Function after Transplantation into STZ-Induced Diabetic Mice
3. Discussion
4. Research Design and Methods
4.1. Animals
4.2. PPI Isolation
4.3. Islet Tissue Culture and Nec-1 Supplementation
4.4. Islet Recovery and Viability
4.5. Flow Cytometric Analysis of Islets
4.6. In Vitro Islet Function
4.7. Islet Insulin Content
4.8. Islet Transplantation and Metabolic Follow-Up
4.9. Histological and Immunohistochemical Analysis
4.10. Statistical Analysis
Supplementary Materials
Author Contributions
Funding
Conflicts of Interest
References
- Gradel, A.K.J.; Porsgaard, T.; Lykkesfeldt, J.; Seested, T.; Gram-Nielsen, S.; Kristensen, N.R.; Refsgaard, H.H.F. Factors affecting the absorption of subcutaneously administered insulin: Effect on variability. J. Diabetes Res. 2018, 2018, 1205121. [Google Scholar] [CrossRef]
- Shapiro, A.M.; Lakey, J.R.; Ryan, E.A.; Korbutt, G.S.; Toth, E.; Warnock, G.L.; Kneteman, N.M.; Rajotte, R.V. Islet transplantation in seven patients with type 1 diabetes mellitus using a glucocorticoid-free immunosuppressive regimen. N. Engl. J. Med. 2000, 343, 230–238. [Google Scholar] [CrossRef]
- Shapiro, A.M. Strategies toward single-donor islets of langerhans transplantation. Curr. Opin. Organ Transplant. 2011, 16, 627–631. [Google Scholar] [CrossRef] [PubMed] [Green Version]
- Park, C.G.; Bottino, R.; Hawthorne, W.J. Current status of islet xenotransplantation. Int. J. Surg. 2015, 23, 261–266. [Google Scholar] [CrossRef] [PubMed] [Green Version]
- Ekser, B.; Li, P.; Cooper, D.K.C. Xenotransplantation: Past, present, and future. Curr. Opin. Organ Transplant. 2017, 22, 513–521. [Google Scholar] [CrossRef]
- Vanderschelden, R.; Sathialingam, M.; Alexander, M.; Lakey, J.R.T. Cost and scalability analysis of porcine islet isolation for islet transplantation: Comparison of juvenile, neonatal and adult pigs. Cell Transplant. 2019, 28, 967–972. [Google Scholar] [CrossRef] [PubMed] [Green Version]
- Van der Windt, D.J.; Bottino, R.; Kumar, G.; Wijkstrom, M.; Hara, H.; Ezzelarab, M.; Ekser, B.; Phelps, C.; Murase, N.; Casu, A.; et al. Clinical islet xenotransplantation: How close are we? Diabetes 2012, 61, 3046–3055. [Google Scholar] [CrossRef] [PubMed] [Green Version]
- Jimenez-Vera, E.; Davies, S.; Phillips, P.; O’Connell, P.J.; Hawthorne, W.J. Long-term cultured neonatal islet cell clusters demonstrate better outcomes for reversal of diabetes: In-vivo and molecular profiles. Xenotransplantation 2015, 22, 114–123. [Google Scholar] [CrossRef]
- Degterev, A.; Hitomi, J.; Germscheid, M.; Ch’En, I.L.; Korkina, O.; Teng, X.; Abbott, D.; Cuny, G.D.; Yuan, C.; Wagner, G.; et al. Identification of rip1 kinase as a specific cellular target of necrostatins. Nat. Chem. Biol. 2008, 4, 313–321. [Google Scholar] [CrossRef] [Green Version]
- Degterev, A.; Huang, Z.; Boyce, M.; Li, Y.; Jagtap, P.; Mizushima, N.; Cuny, G.D.; Mitchison, T.J.; Moskowitz, M.A.; Yuan, J. Chemical inhibitor of nonapoptotic cell death with therapeutic potential for ischemic brain injury. Nat. Chem. Biol. 2005, 1, 112–119. [Google Scholar] [CrossRef] [PubMed]
- Bruni, A.; Bornstein, S.; Linkermann, A.; Shapiro, A.M.J. Regulated cell death seen through the lens of islet transplantation. Cell Transplant. 2018, 27, 890–901. [Google Scholar] [CrossRef] [PubMed] [Green Version]
- Itoh, T.; Takita, M.; SoRelle, J.A.; Shimoda, M.; Sugimoto, K.; Chujo, D.; Qin, H.; Naziruddin, B.; Levy, M.F.; Matsumoto, S. Correlation of released hmgb1 levels with the degree of islet damage in mice and humans and with the outcomes of islet transplantation in mice. Cell Transplant. 2012, 21, 1371–1381. [Google Scholar] [CrossRef] [PubMed]
- Tamura, Y.; Chiba, Y.; Tanioka, T.; Shimizu, N.; Shinozaki, S.; Yamada, M.; Kaneki, K.; Mori, S.; Araki, A.; Ito, H.; et al. No donor induces nec-1-inhibitable, but rip1-independent, necrotic cell death in pancreatic β-cells. FEBS Lett. 2011, 585, 3058–3064. [Google Scholar] [CrossRef] [PubMed] [Green Version]
- Paredes-Juarez, G.A.; Sahasrabudhe, N.M.; Tjoelker, R.S.; de Haan, B.J.; Engelse, M.A.; de Koning, E.J.P.; Faas, M.M.; de Vos, P. Damp production by human islets under low oxygen and nutrients in the presence or absence of an immunoisolating-capsule and necrostatin-1. Sci. Rep. 2015, 5, 14623. [Google Scholar] [CrossRef]
- Lau, H.; Corrales, N.; Alexander, M.; Mohammadi, M.R.; Li, S.; Smink, A.M.; de Vos, P.; Lakey, J.R.T. Necrostatin-1 supplementation enhances young porcine islet maturation and in-vitro function. Xenotransplantation 2020, 27, e12555. [Google Scholar] [CrossRef]
- Lau, H.; Corrales, N.; Rodriguez, S.; Luong, C.; Mohammadi, M.; Khosrawipour, V.; Li, S.; Alexander, M.; de Vos, P.; Lakey, J.R.T. Dose-dependent effects of necrostatin-1 supplementation to tissue culture media of young porcine islets. PLoS ONE 2020, 15, e0243506. [Google Scholar] [CrossRef]
- Lau, H.; Corrales, N.; Rodriguez, S.; Park, S.; Mohammadi, M.; Li, S.; Alexander, M.; Lakey, J.R.T. The effects of necrostatin-1 on the in-vitro development and function of young porcine islets over 14-day prolonged tissue culture. Xenotransplantation 2021, 28, e12667. [Google Scholar] [CrossRef]
- Papas, K.K.; Pisania, A.; Wu, H.; Weir, G.C.; Colton, C.K. A stirred microchamber for oxygen consumption rate measurements with pancreatic islets. Biotechnol. Bioeng. 2007, 98, 1071–1082. [Google Scholar] [CrossRef] [Green Version]
- Huang, Z.; Epperly, M.; Watkins, S.C.; Greenberger, J.S.; Kagan, V.E.; Bayır, H. Necrostatin-1 rescues mice from lethal irradiation. Biochim. Biophys. Acta 2016, 1862, 850–856. [Google Scholar] [CrossRef]
- Yang, S.-H.; Shin, J.; Shin, N.N.; Hwang, J.-H.; Hong, S.-C.; Park, K.; Lee, J.W.; Lee, S.; Baek, S.; Kim, K.; et al. A small molecule nec-1 directly induces amyloid clearance in the brains of aged app/ps1 mice. Sci. Rep. 2019, 9, 4183. [Google Scholar] [CrossRef]
- Hassouna, T.; Seeberger, K.L.; Salama, B.; Korbutt, G.S. Functional maturation and in-vitro differentiation of neonatal porcine islet grafts. Transplantation 2018, 102, e413–e423. [Google Scholar] [CrossRef]
- Bottino, R.; Balamurugan, A.N.; Tse, H.; Thirunavukkarasu, C.; Ge, X.; Profozich, J.; Milton, M.; Ziegenfuss, A.; Trucco, M.; Piganelli, J.D. Response of human islets to isolation stress and the effect of antioxidant treatment. Diabetes 2004, 53, 2559–2568. [Google Scholar] [CrossRef] [Green Version]
- Johansson, U.; Olsson, A.; Gabrielsson, S.; Nilsson, B.; Korsgren, O. Inflammatory mediators expressed in human islets of langerhans: Implications for islet transplantation. Biochem. Biophys. Res. Commun. 2003, 308, 474–479. [Google Scholar] [CrossRef] [Green Version]
- Sun, J.; Ni, Q.; Xie, J.; Xu, M.; Zhang, J.; Kuang, J.; Wang, Y.; Ning, G.; Wang, Q. Β-cell dedifferentiation in patients with t2d with adequate glucose control and nondiabetic chronic pancreatitis. J. Clin. Endocrinol. Metab. 2019, 104, 83–94. [Google Scholar] [CrossRef] [PubMed] [Green Version]
- Nordmann, T.M.; Dror, E.; Schulze, F.; Traub, S.; Berishvili, E.; Barbieux, C.; Böni-Schnetzler, M.; Donath, M.Y. The role of inflammation in β-cell dedifferentiation. Sci. Rep. 2017, 7, 6285. [Google Scholar] [CrossRef] [PubMed]
- Bonner-Weir, S.; Sharma, A. Pancreatic stem cells. J. Pathol. 2002, 197, 519–526. [Google Scholar] [CrossRef]
- Dor, Y. Beta-cell proliferation is the major source of new pancreatic beta cells. Nature clinical practice. Endocrinol. Metab. 2006, 2, 242–243. [Google Scholar]
- Schwitzgebel, V.M.; Scheel, D.W.; Conners, J.R.; Kalamaras, J.; Lee, J.E.; Anderson, D.J.; Sussel, L.; Johnson, J.D.; German, M.S. Expression of neurogenin3 reveals an islet cell precursor population in the pancreas. Development 2000, 127, 3533–3542. [Google Scholar] [CrossRef] [PubMed]
- Gradwohl, G.; Dierich, A.; LeMeur, M.; Guillemot, F. Neurogenin3 is required for the development of the four endocrine cell lineages of the pancreas. Proc. Natl. Acad. Sci. USA 2000, 97, 1607–1611. [Google Scholar] [CrossRef] [Green Version]
- Cai, Q.; Bonfanti, P.; Sambathkumar, R.; Vanuytsel, K.; Vanhove, J.; Gysemans, C.; Debiec-Rychter, M.; Raitano, S.; Heimberg, H.; Ordovas, L.; et al. Prospectively isolated ngn3-expressing progenitors from human embryonic stem cells give rise to pancreatic endocrine cells. Stem Cells Transl. Med. 2014, 3, 489–499. [Google Scholar] [CrossRef]
- Dai, C.; Hang, Y.; Shostak, A.; Poffenberger, G.; Hart, N.; Prasad, N.; Phillips, N.; Levy, S.E.; Greiner, D.L.; Shultz, L.D.; et al. Age-dependent human β cell proliferation induced by glucagon-like peptide 1 and calcineurin signaling. J. Clin. Investig. 2017, 127, 3835–3844. [Google Scholar] [CrossRef] [PubMed]
- Zheng, H.W.; Chen, J.; Sha, S.H. Receptor-interacting protein kinases modulate noise-induced sensory hair cell death. Cell Death Dis. 2014, 5, e1262. [Google Scholar] [CrossRef] [PubMed]
- Wu, J.R.; Wang, J.; Zhou, S.K.; Yang, L.; Yin, J.L.; Cao, J.P.; Cheng, Y.B. Necrostatin-1 protection of dopaminergic neurons. Neural Regen. Res. 2015, 10, 1120–1124. [Google Scholar] [PubMed]
- Smith, C.C.T.; Davidson, S.M.; Lim, S.Y.; Simpkin, J.C.; Hothersall, J.S.; Yellon, D.M. Necrostatin: A Potentially Novel Cardioprotective Agent? Cardiovasc. Drugs Ther. 2007, 21, 227–233. [Google Scholar] [CrossRef]
- Miki, A.; Ricordi, C.; Sakuma, Y.; Yamamoto, T.; Misawa, R.; Mita, A.; Ichii, H.; Molano, R.D.; Vaziri, N.D.; Pileggi, A. Divergent antioxidant capacity of human islet cell subsets: A potential cause of beta-cell vulnerability in diabetes and islet transplantation. PLoS ONE 2018, 13, e0196570. [Google Scholar] [CrossRef] [Green Version]
- Yamanaka, K.; Saito, Y.; Yamamori, T.; Urano, Y.; Noguchi, N. 24(S)-hydroxycholesterol induces neuronal cell death through necroptosis, a form of programmed necrosis. J. Biol. Chem. 2011, 286, 24666–24673. [Google Scholar] [CrossRef] [Green Version]
- Gu, L.; Cui, X.; Lang, S.; Wang, H.; Hong, T.; Wei, R. Glucagon receptor antagonism increases mouse pancreatic δ-cell mass through cell proliferation and duct-derived neogenesis. Biochem. Biophys. Res. Commun. 2019, 512, 864–870. [Google Scholar] [CrossRef]
- Smith, K.E.; Purvis, W.G.; Davis, M.A.; Min, C.G.; Cooksey, A.M.; Weber, C.S.; Jandova, J.; Price, N.D.; Molano, D.S.; Stanton, J.B.; et al. In-vitro characterization of neonatal, juvenile, and adult porcine islet oxygen demand, β-cell function, and transcriptomes. Xenotransplantation 2018, 25, e12432. [Google Scholar] [CrossRef]
- Giovagnoli, S.; Luca, G.; Casaburi, I.; Blasi, P.; Macchiarulo, G.; Ricci, M.; Calvitti, M.; Basta, G.; Calafiore, R.; Rossi, C. Long-term delivery of superoxide dismutase and catalase entrapped in poly(lactide-co-glycolide) microspheres: In-vitro effects on isolated neonatal porcine pancreatic cell clusters. J. Control. Release Off. J. Control. Release Soc. 2005, 107, 65–77. [Google Scholar] [CrossRef]
- Riegger, J.; Brenner, R.E. Evidence of necroptosis in osteoarthritic disease: Investigation of blunt mechanical impact as possible trigger in regulated necrosis. Cell Death Dis. 2019, 10, 683. [Google Scholar] [CrossRef] [Green Version]
- Robertson, R.P.; Tsai, P.; Little, S.A.; Zhang, H.J.; Walseth, T.F. Receptor-mediated adenylate cyclase-coupled mechanism for pge2 inhibition of insulin secretion in hit cells. Diabetes 1987, 36, 1047–1053. [Google Scholar] [CrossRef] [PubMed]
- Hayward, J.A.; Ellis, C.E.; Seeberger, K.; Lee, T.; Salama, B.; Mulet-Sierra, A.; Kuppan, P.; Adesida, A.; Korbutt, G.S. Cotransplantation of mesenchymal stem cells with neonatal porcine islets improve graft function in diabetic mice. Diabetes 2017, 66, 1312–1321. [Google Scholar] [CrossRef] [PubMed] [Green Version]
- Pepper, A.R.; Gall, C.; Mazzuca, D.M.; Melling, C.W.; White, D.J. Diabetic rats and mice are resistant to porcine and human insulin: Flawed experimental models for testing islet xenografts. Xenotransplantation 2009, 16, 502–510. [Google Scholar] [CrossRef]
- Lamb, M.; Laugenour, K.; Liang, O.; Alexander, M.; Foster, C.E.; Lakey, J.R. In-vitro maturation of viable islets from partially digested young pig pancreas. Cell Transplant. 2014, 23, 263–272. [Google Scholar] [CrossRef] [Green Version]
- Lau, H.; Corrales, N.; Rodriguez, S.; Luong, C.; Zaldivar, F.; Alexander, M.; Lakey, J.R.T. An islet maturation media to improve the development of young porcine islets during in-vitro culture. Islets 2020, 12, 41–58. [Google Scholar] [CrossRef]
- Ichii, H.; Inverardi, L.; Pileggi, A.; Molano, R.D.; Cabrera, O.; Caicedo, A.; Messinger, S.; Kuroda, Y.; Berggren, P.O.; Ricordi, C. A novel method for the assessment of cellular composition and beta-cell viability in human islet preparations. Am. J. Transpl. 2005, 5, 1635–1645. [Google Scholar] [CrossRef] [PubMed] [Green Version]
- Qi, M.; Bilbao, S.; Forouhar, E.; Kandeel, F.; Al-Abdullah, I.H. Encompassing atp, DNA, insulin, and protein content for quantification and assessment of human pancreatic islets. Cell Tissue Bank 2018, 19, 77–85. [Google Scholar] [CrossRef] [PubMed]
- Korbutt, G.S.; Elliott, J.F.; Ao, Z.; Smith, D.K.; Warnock, G.L.; Rajotte, R.V. Large scale isolation, growth, and function of porcine neonatal islet cells. J. Clin. Investig. 1996, 97, 2119–2129. [Google Scholar] [CrossRef] [Green Version]
- Robles, L.; Vaziri, N.D.; Li, S.; Takasu, C.; Masuda, Y.; Vo, K.; Farzaneh, S.H.; Stamos, M.J.; Ichii, H. Dimethyl fumarate ameliorates acute pancreatitis in rodent. Pancreas 2015, 44, 441–447. [Google Scholar] [CrossRef] [Green Version]
- Hoyeck, M.P.; Blair, H.; Ibrahim, M.; Solanki, S.; Elsawy, M.; Prakash, A.; Rick, K.R.C.; Matteo, G.; O’Dwyer, S.; Bruin, J.E. Long-term metabolic consequences of acute dioxin exposure differ between male and female mice. Sci. Rep. 2020, 10, 1448. [Google Scholar] [CrossRef] [Green Version]


Publisher’s Note: MDPI stays neutral with regard to jurisdictional claims in published maps and institutional affiliations. |
© 2021 by the authors. Licensee MDPI, Basel, Switzerland. This article is an open access article distributed under the terms and conditions of the Creative Commons Attribution (CC BY) license (https://creativecommons.org/licenses/by/4.0/).
Share and Cite
Lau, H.; Li, S.; Corrales, N.; Rodriguez, S.; Mohammadi, M.; Alexander, M.; de Vos, P.; Lakey, J.R. Necrostatin-1 Supplementation to Islet Tissue Culture Enhances the In-Vitro Development and Graft Function of Young Porcine Islets. Int. J. Mol. Sci. 2021, 22, 8367. https://0-doi-org.brum.beds.ac.uk/10.3390/ijms22168367
Lau H, Li S, Corrales N, Rodriguez S, Mohammadi M, Alexander M, de Vos P, Lakey JR. Necrostatin-1 Supplementation to Islet Tissue Culture Enhances the In-Vitro Development and Graft Function of Young Porcine Islets. International Journal of Molecular Sciences. 2021; 22(16):8367. https://0-doi-org.brum.beds.ac.uk/10.3390/ijms22168367
Chicago/Turabian StyleLau, Hien, Shiri Li, Nicole Corrales, Samuel Rodriguez, Mohammadreza Mohammadi, Michael Alexander, Paul de Vos, and Jonathan RT Lakey. 2021. "Necrostatin-1 Supplementation to Islet Tissue Culture Enhances the In-Vitro Development and Graft Function of Young Porcine Islets" International Journal of Molecular Sciences 22, no. 16: 8367. https://0-doi-org.brum.beds.ac.uk/10.3390/ijms22168367