
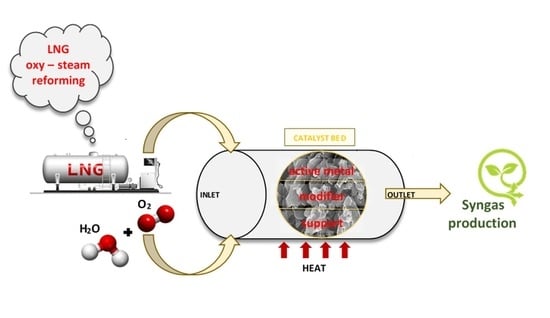
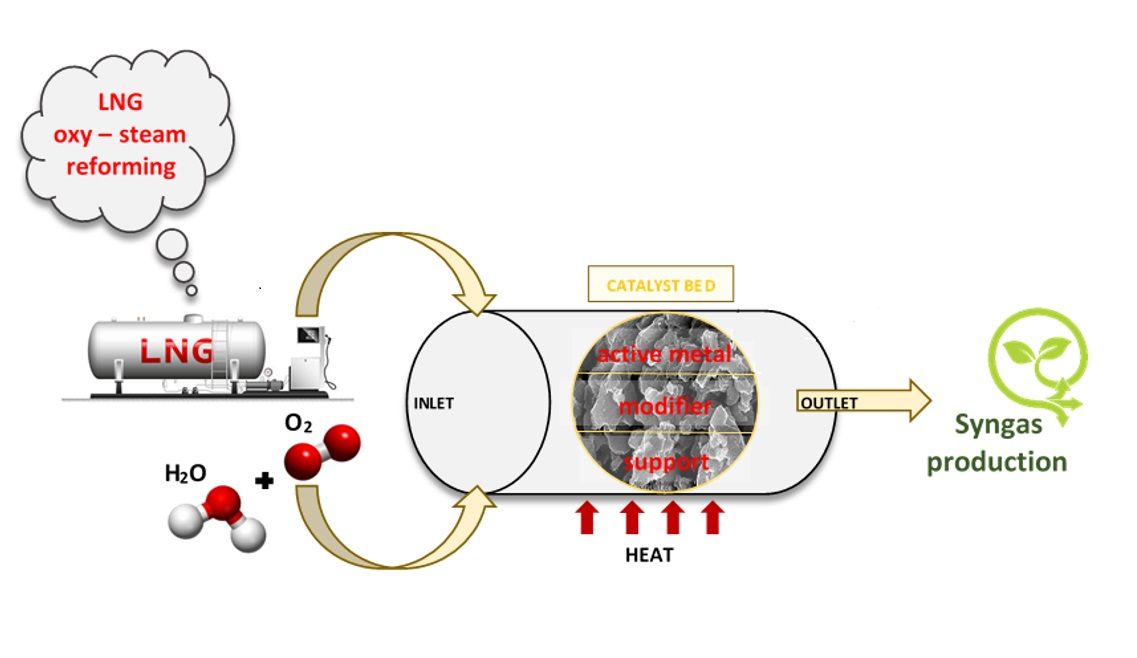
The Effect of Modifiers on the Performance of Ni/CeO2 and Ni/La2O3 Catalysts in the Oxy–Steam Reforming of LNG


 , and
, and
Abstract
:
1. Introduction
2. Results and Discussion
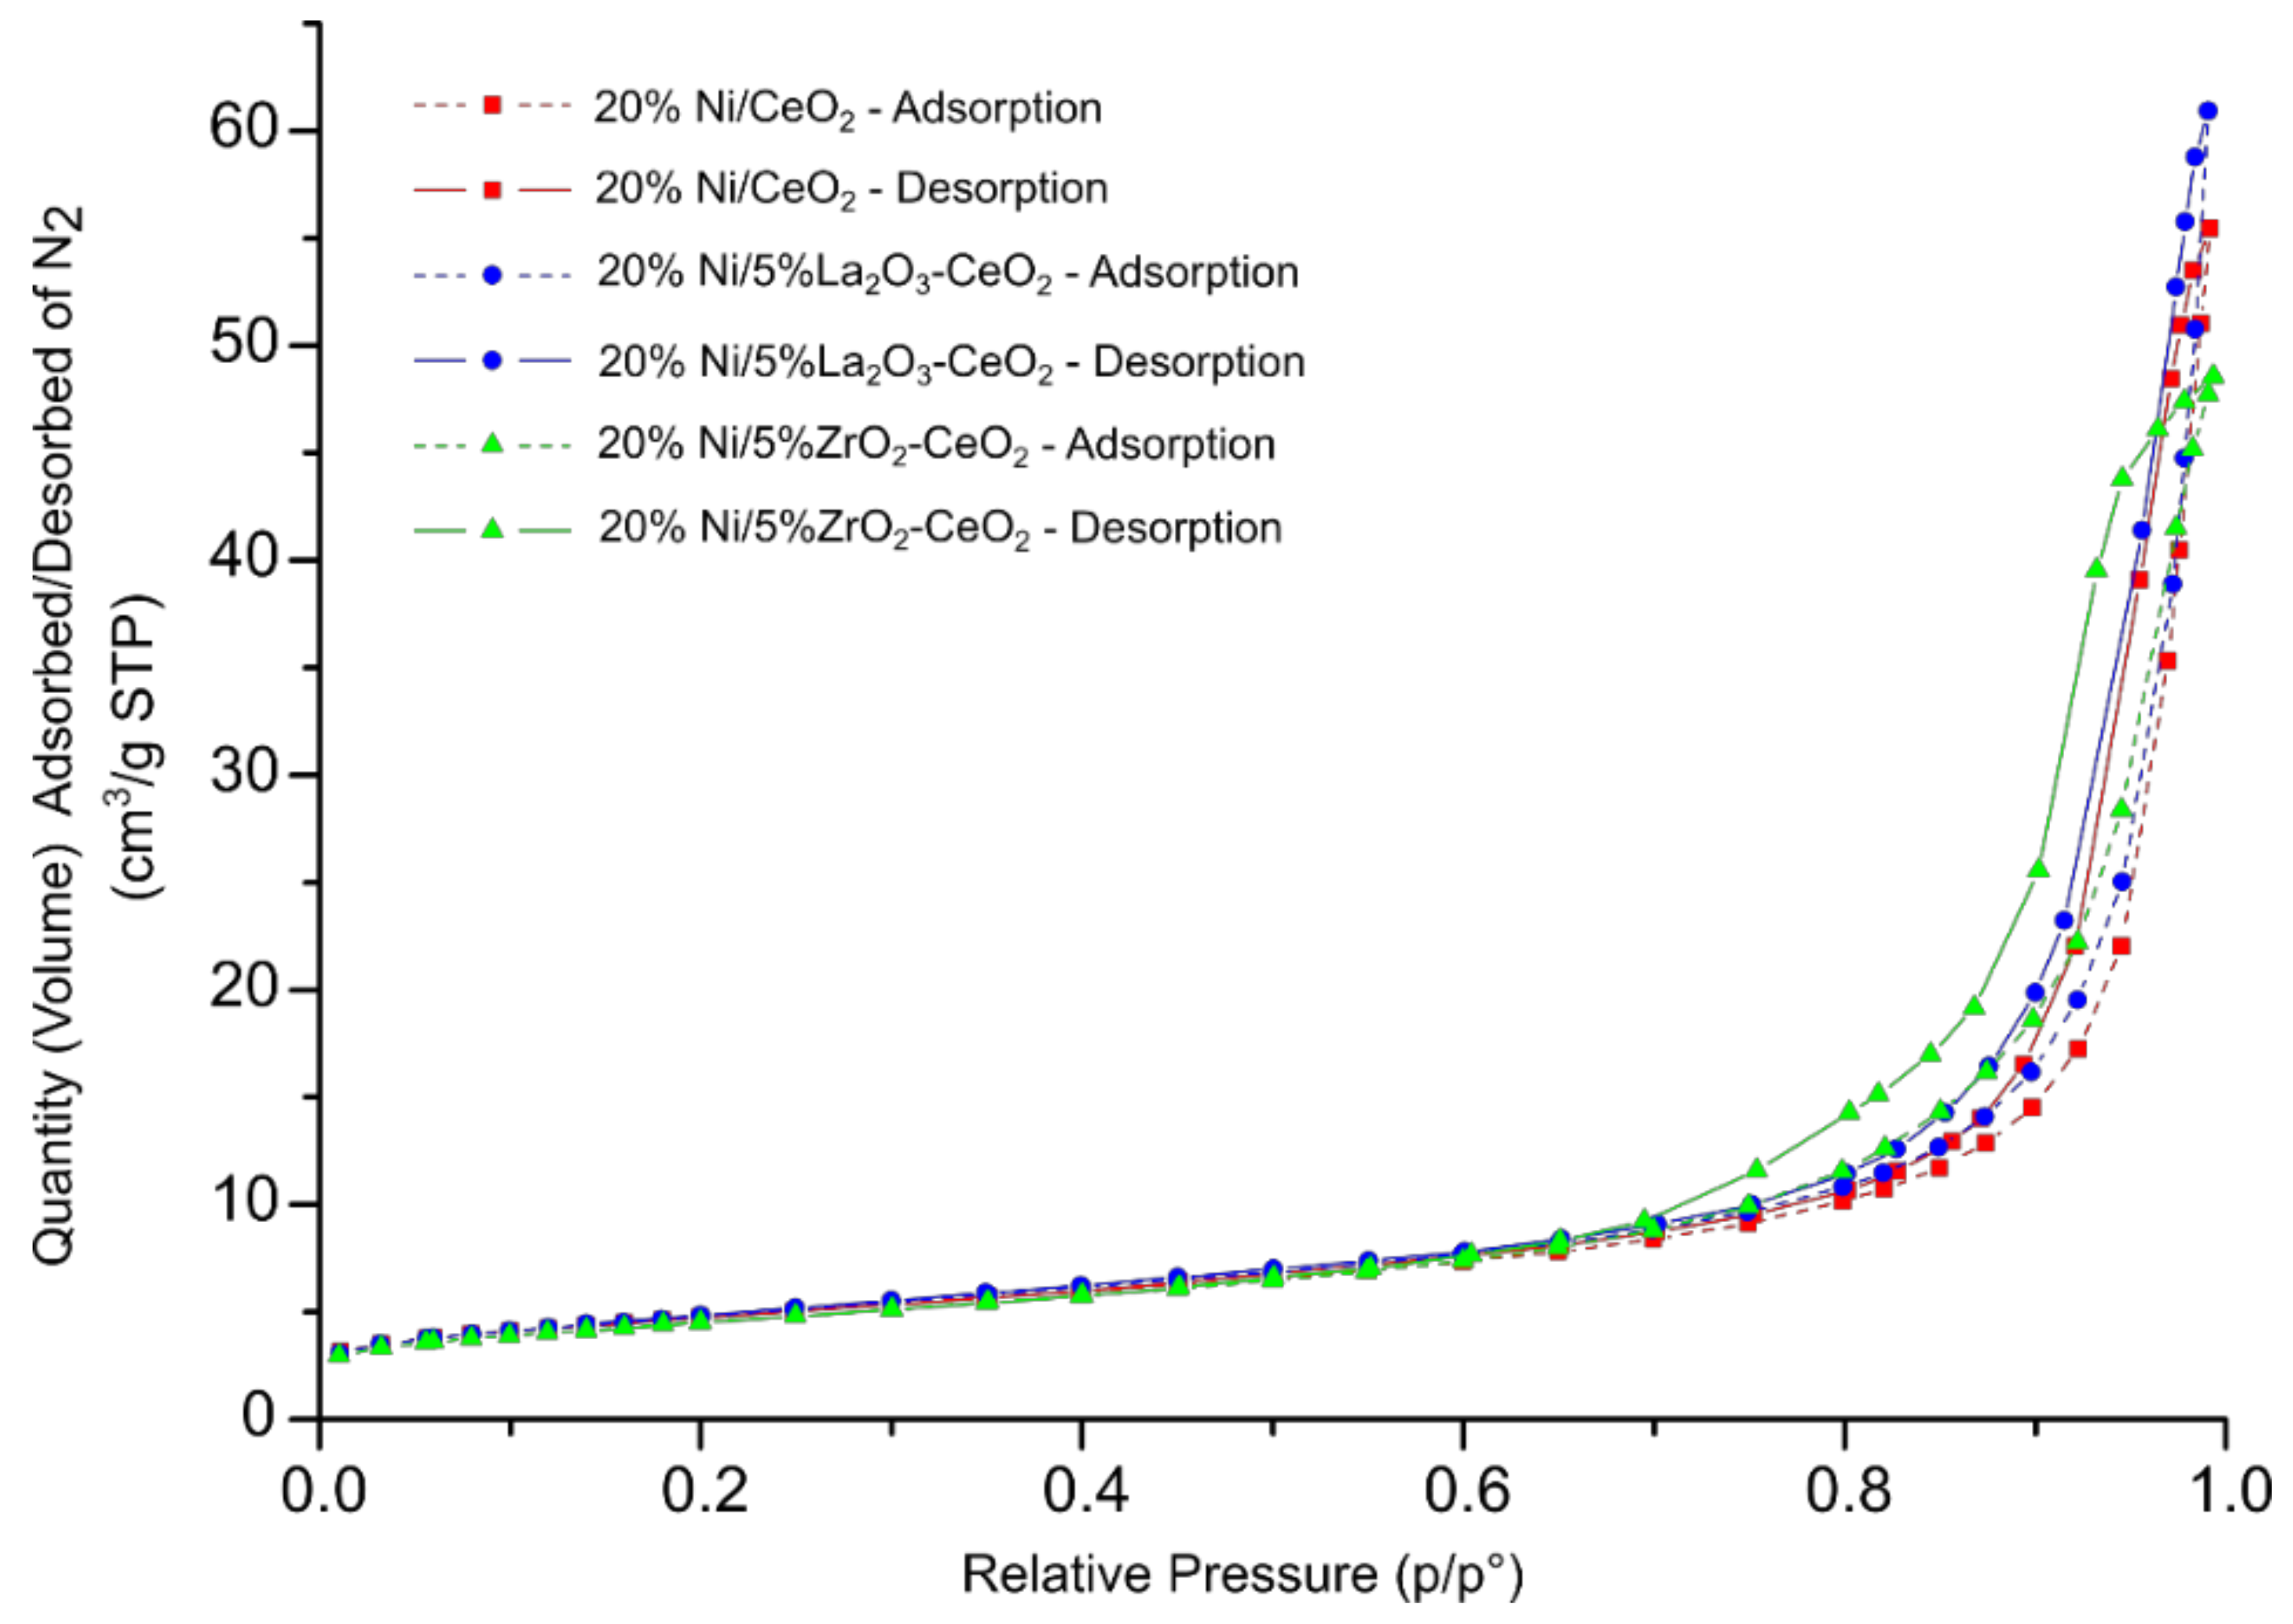
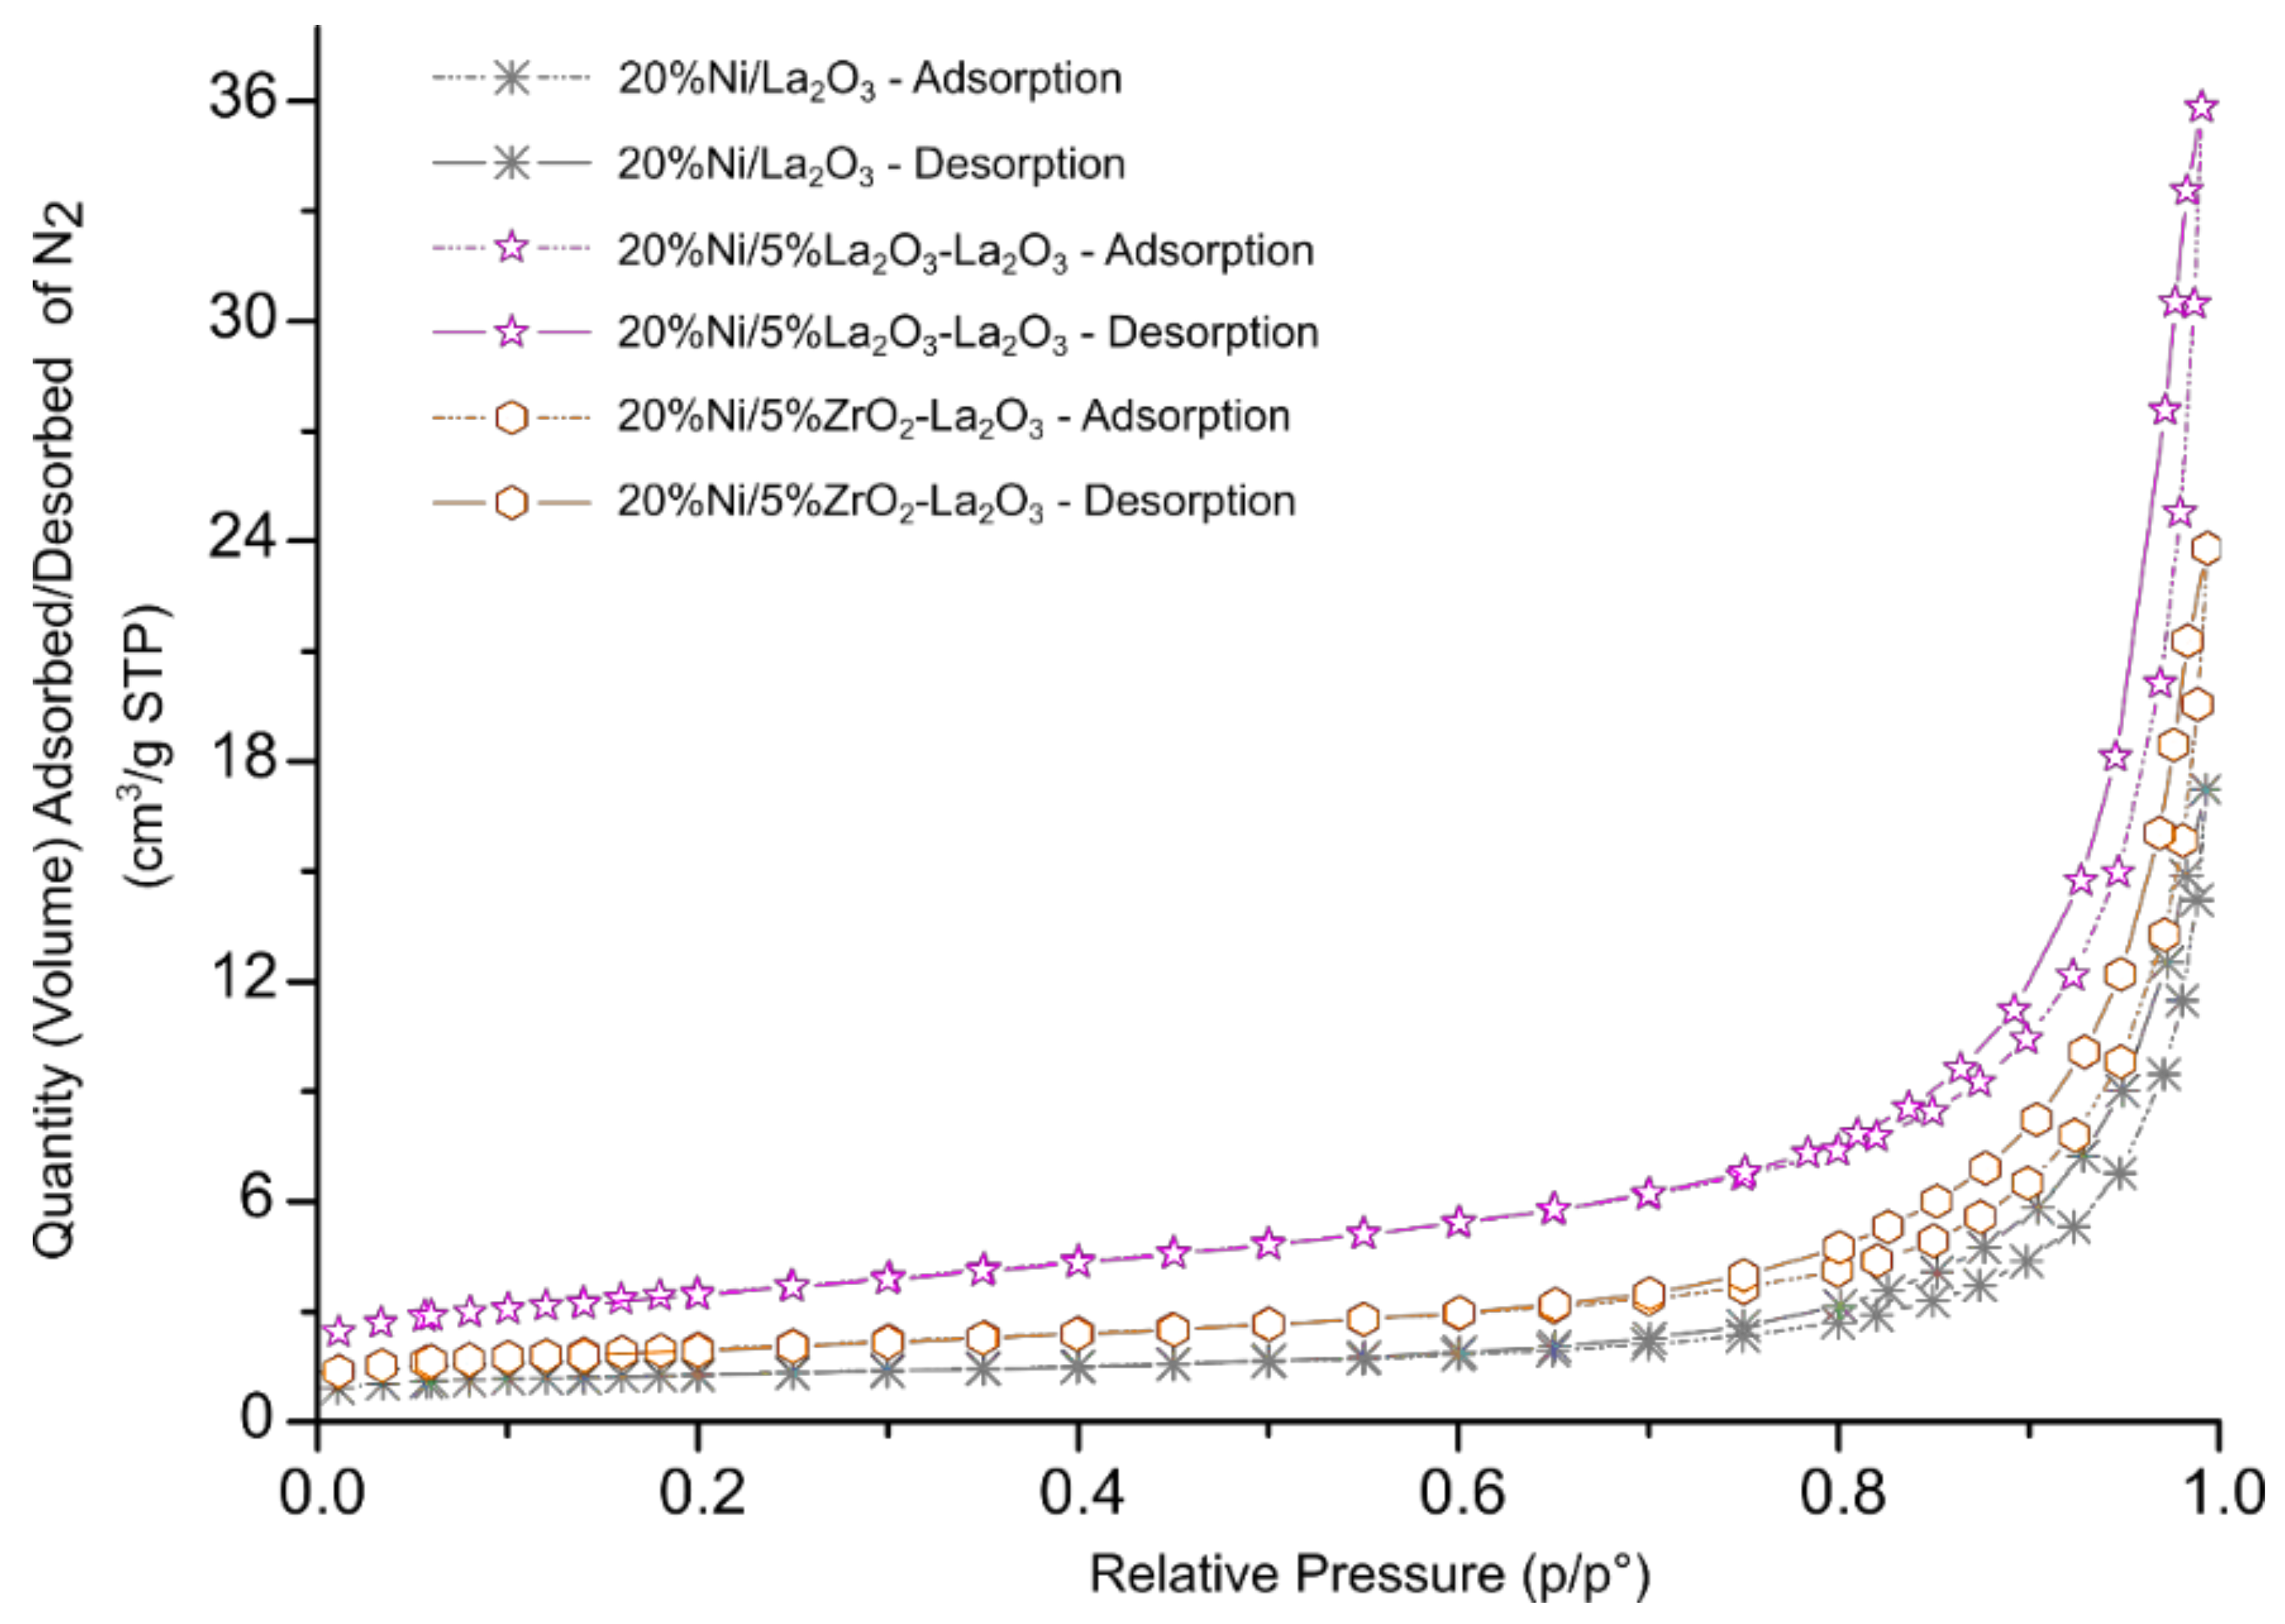
2.1. BET Analysis
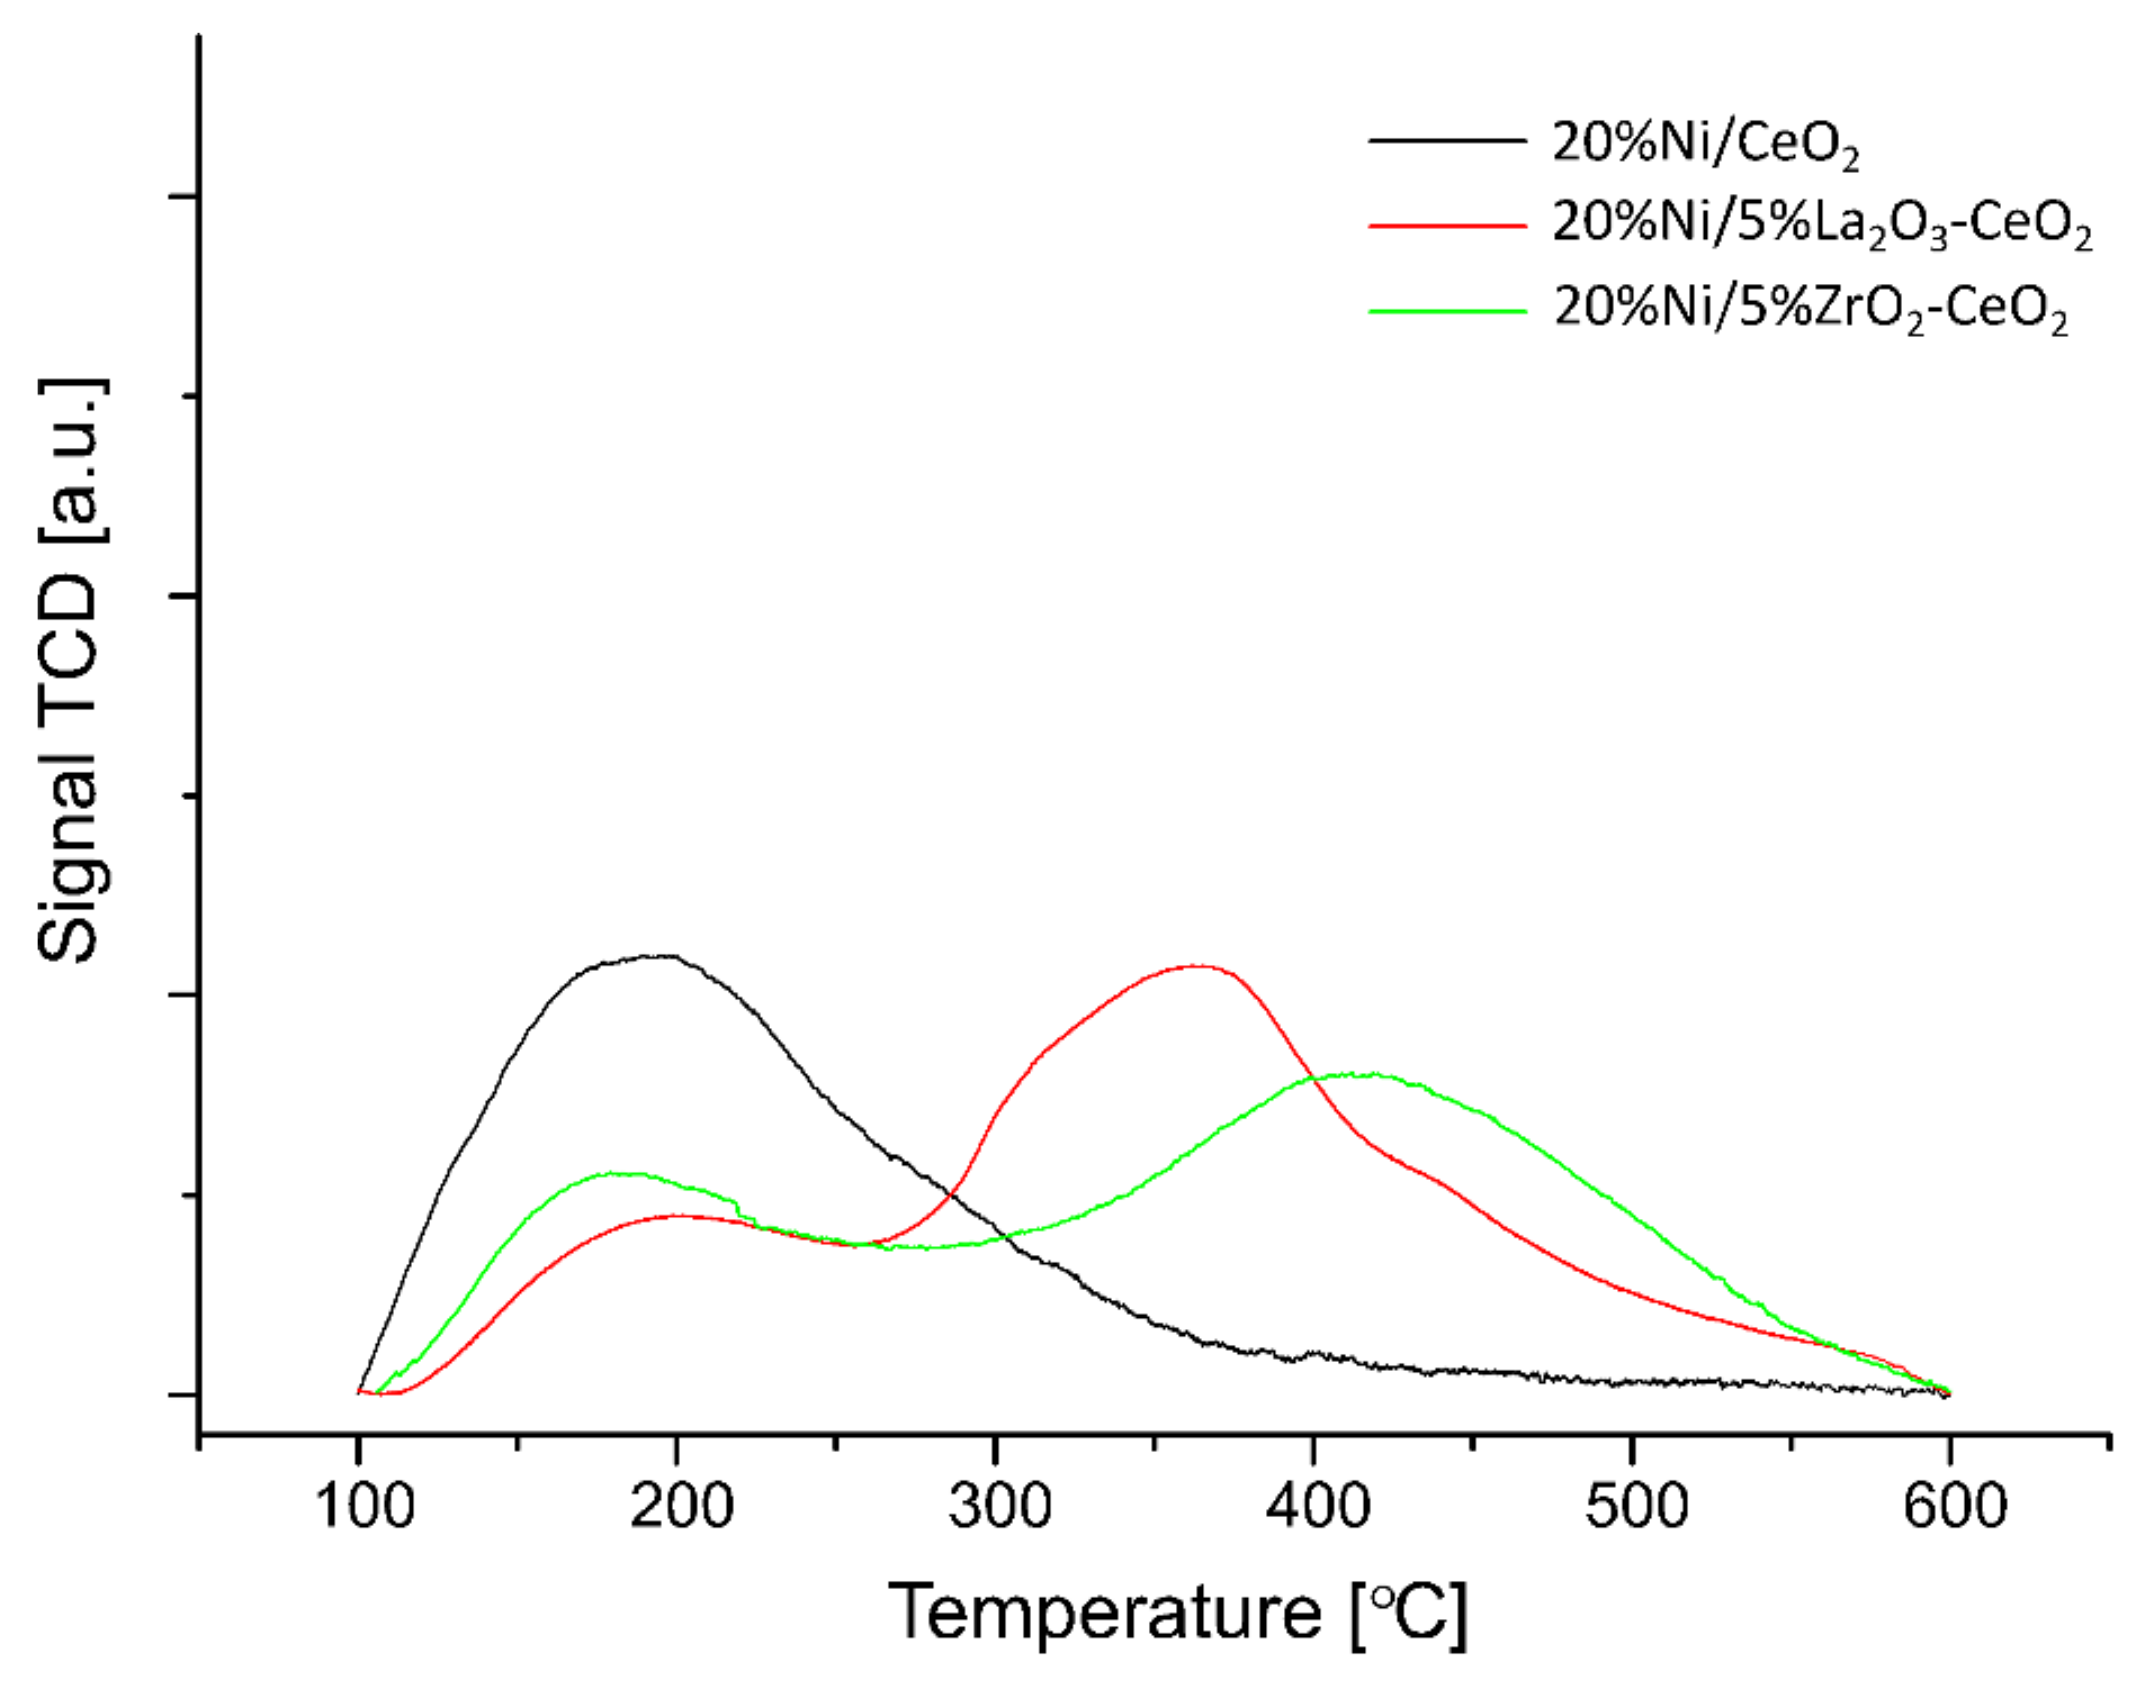
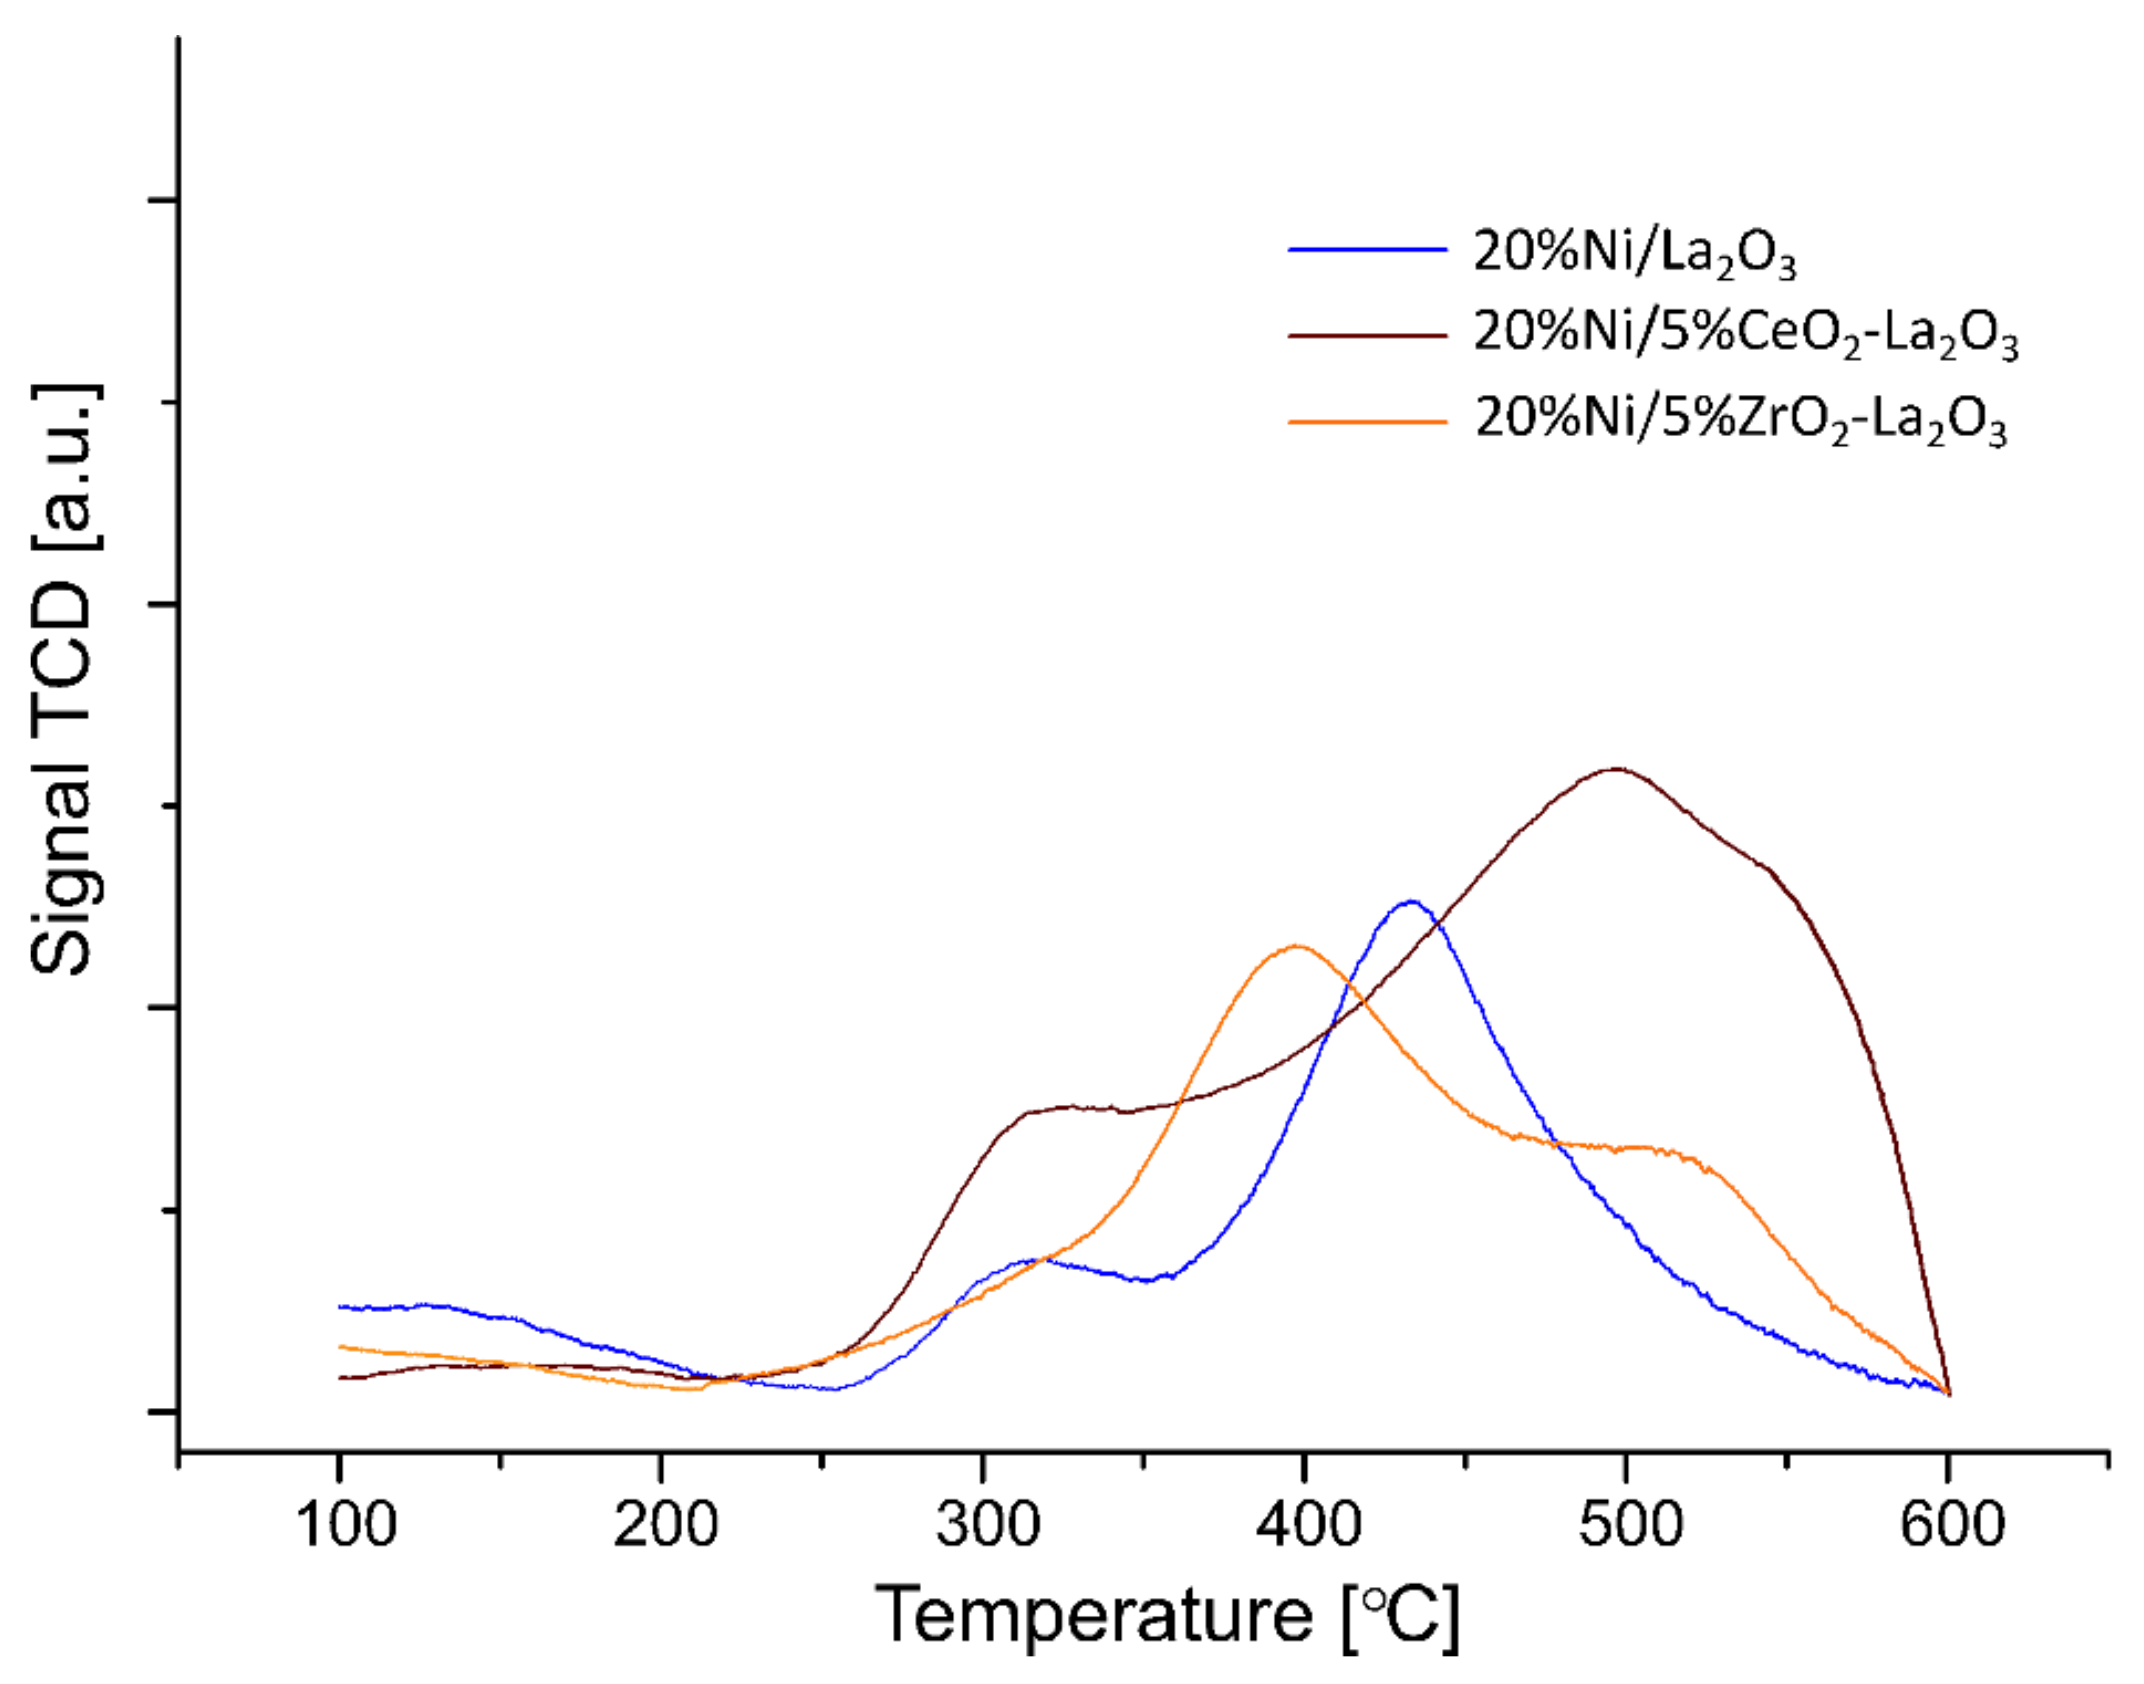
2.2. The Acidity of the Catalyst Systems Tested (TPD-NH3)
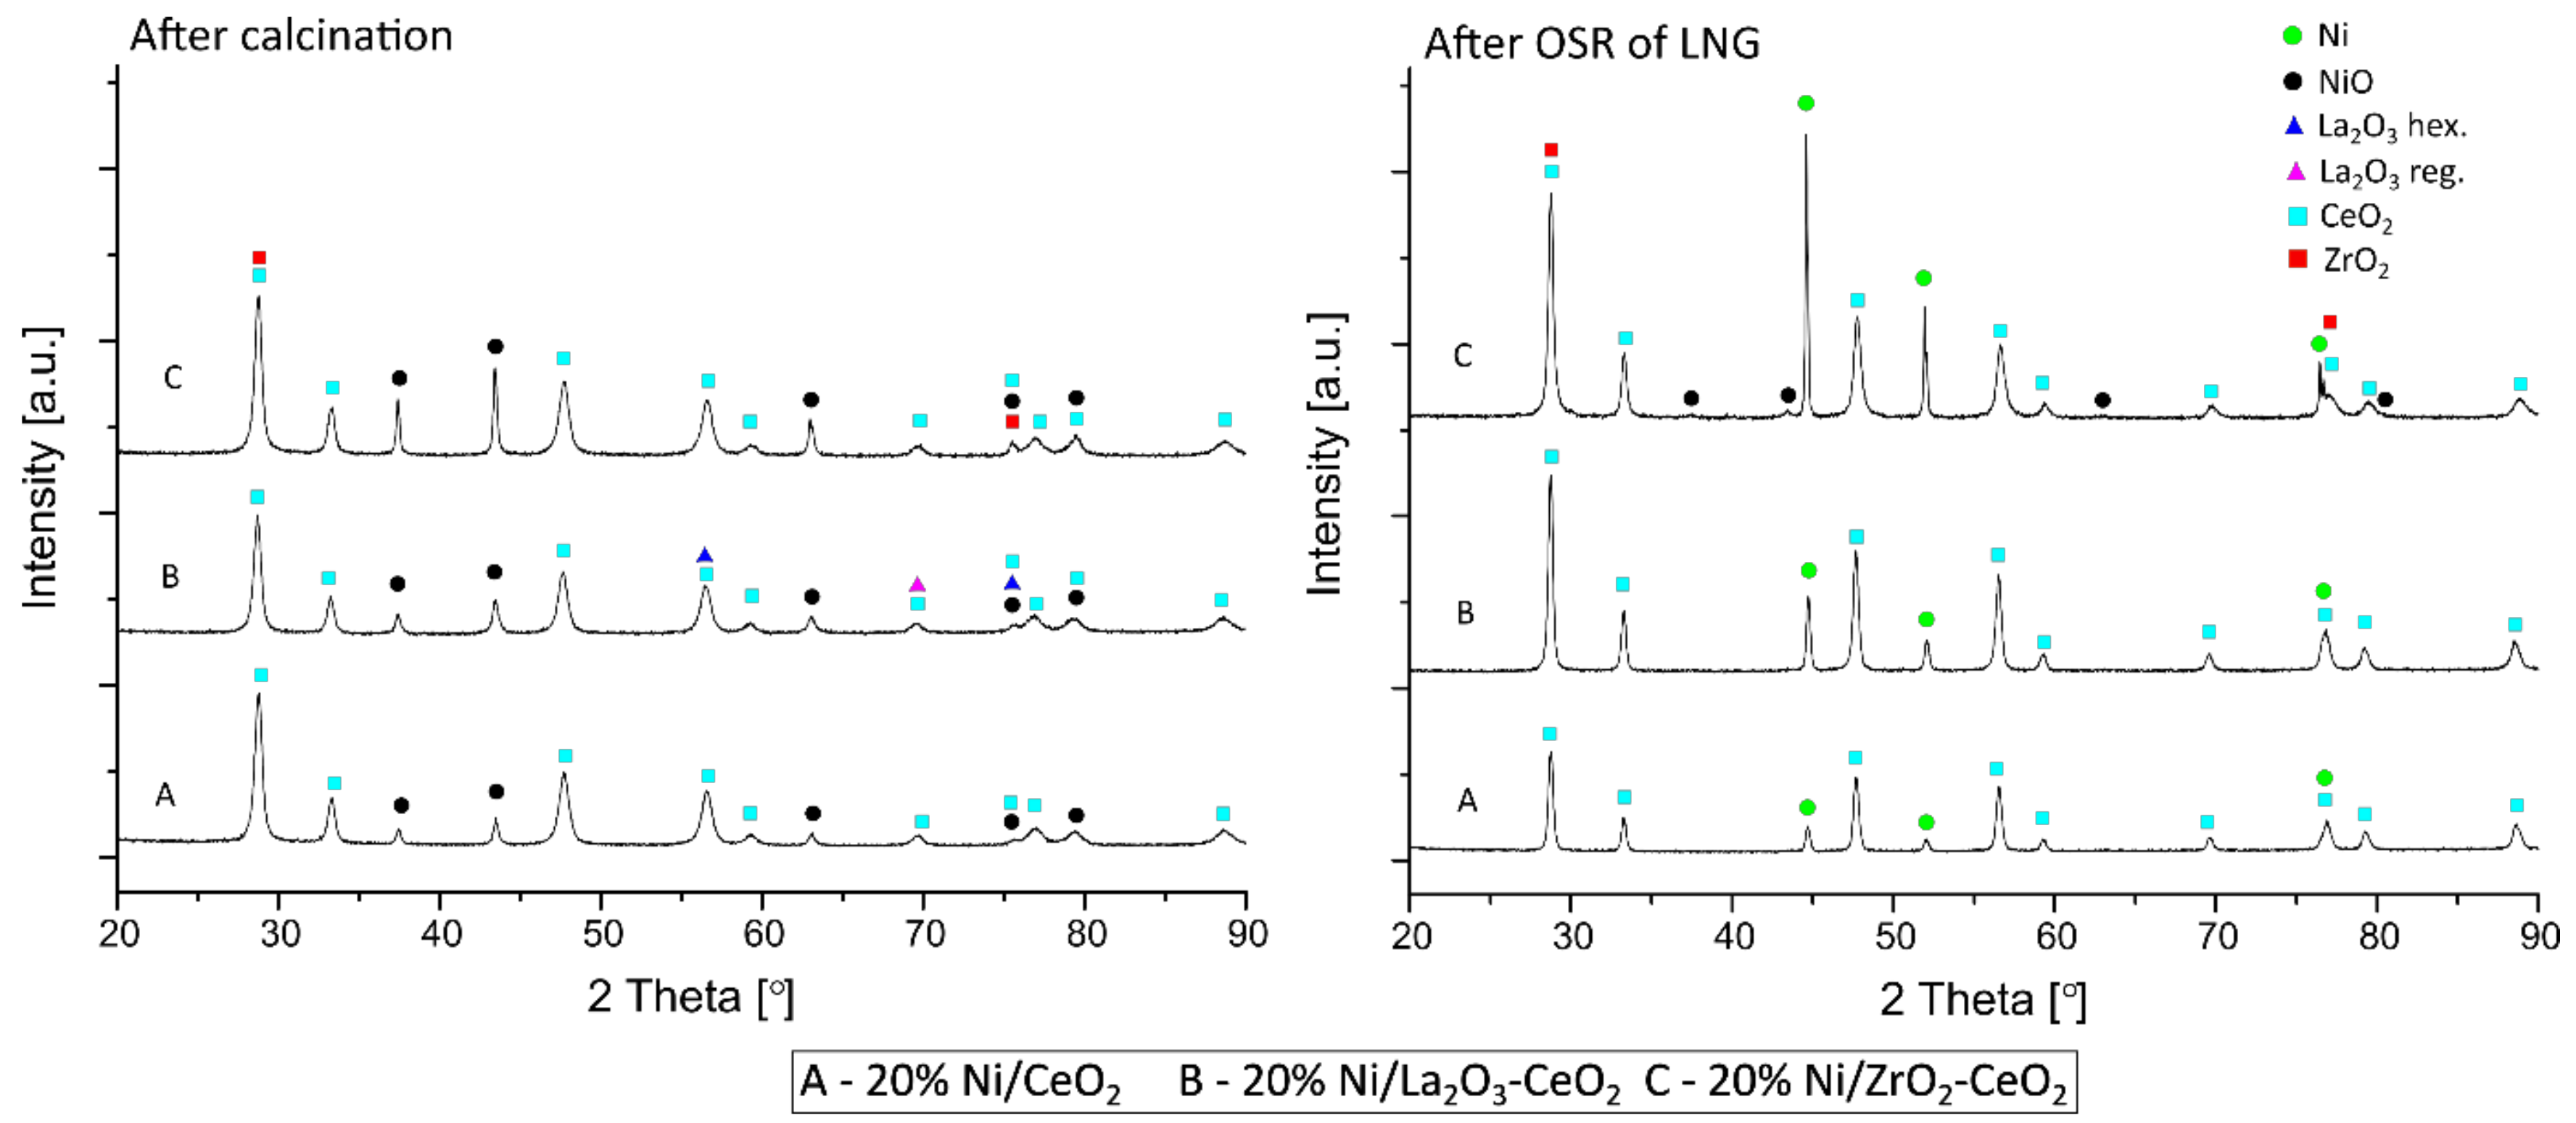
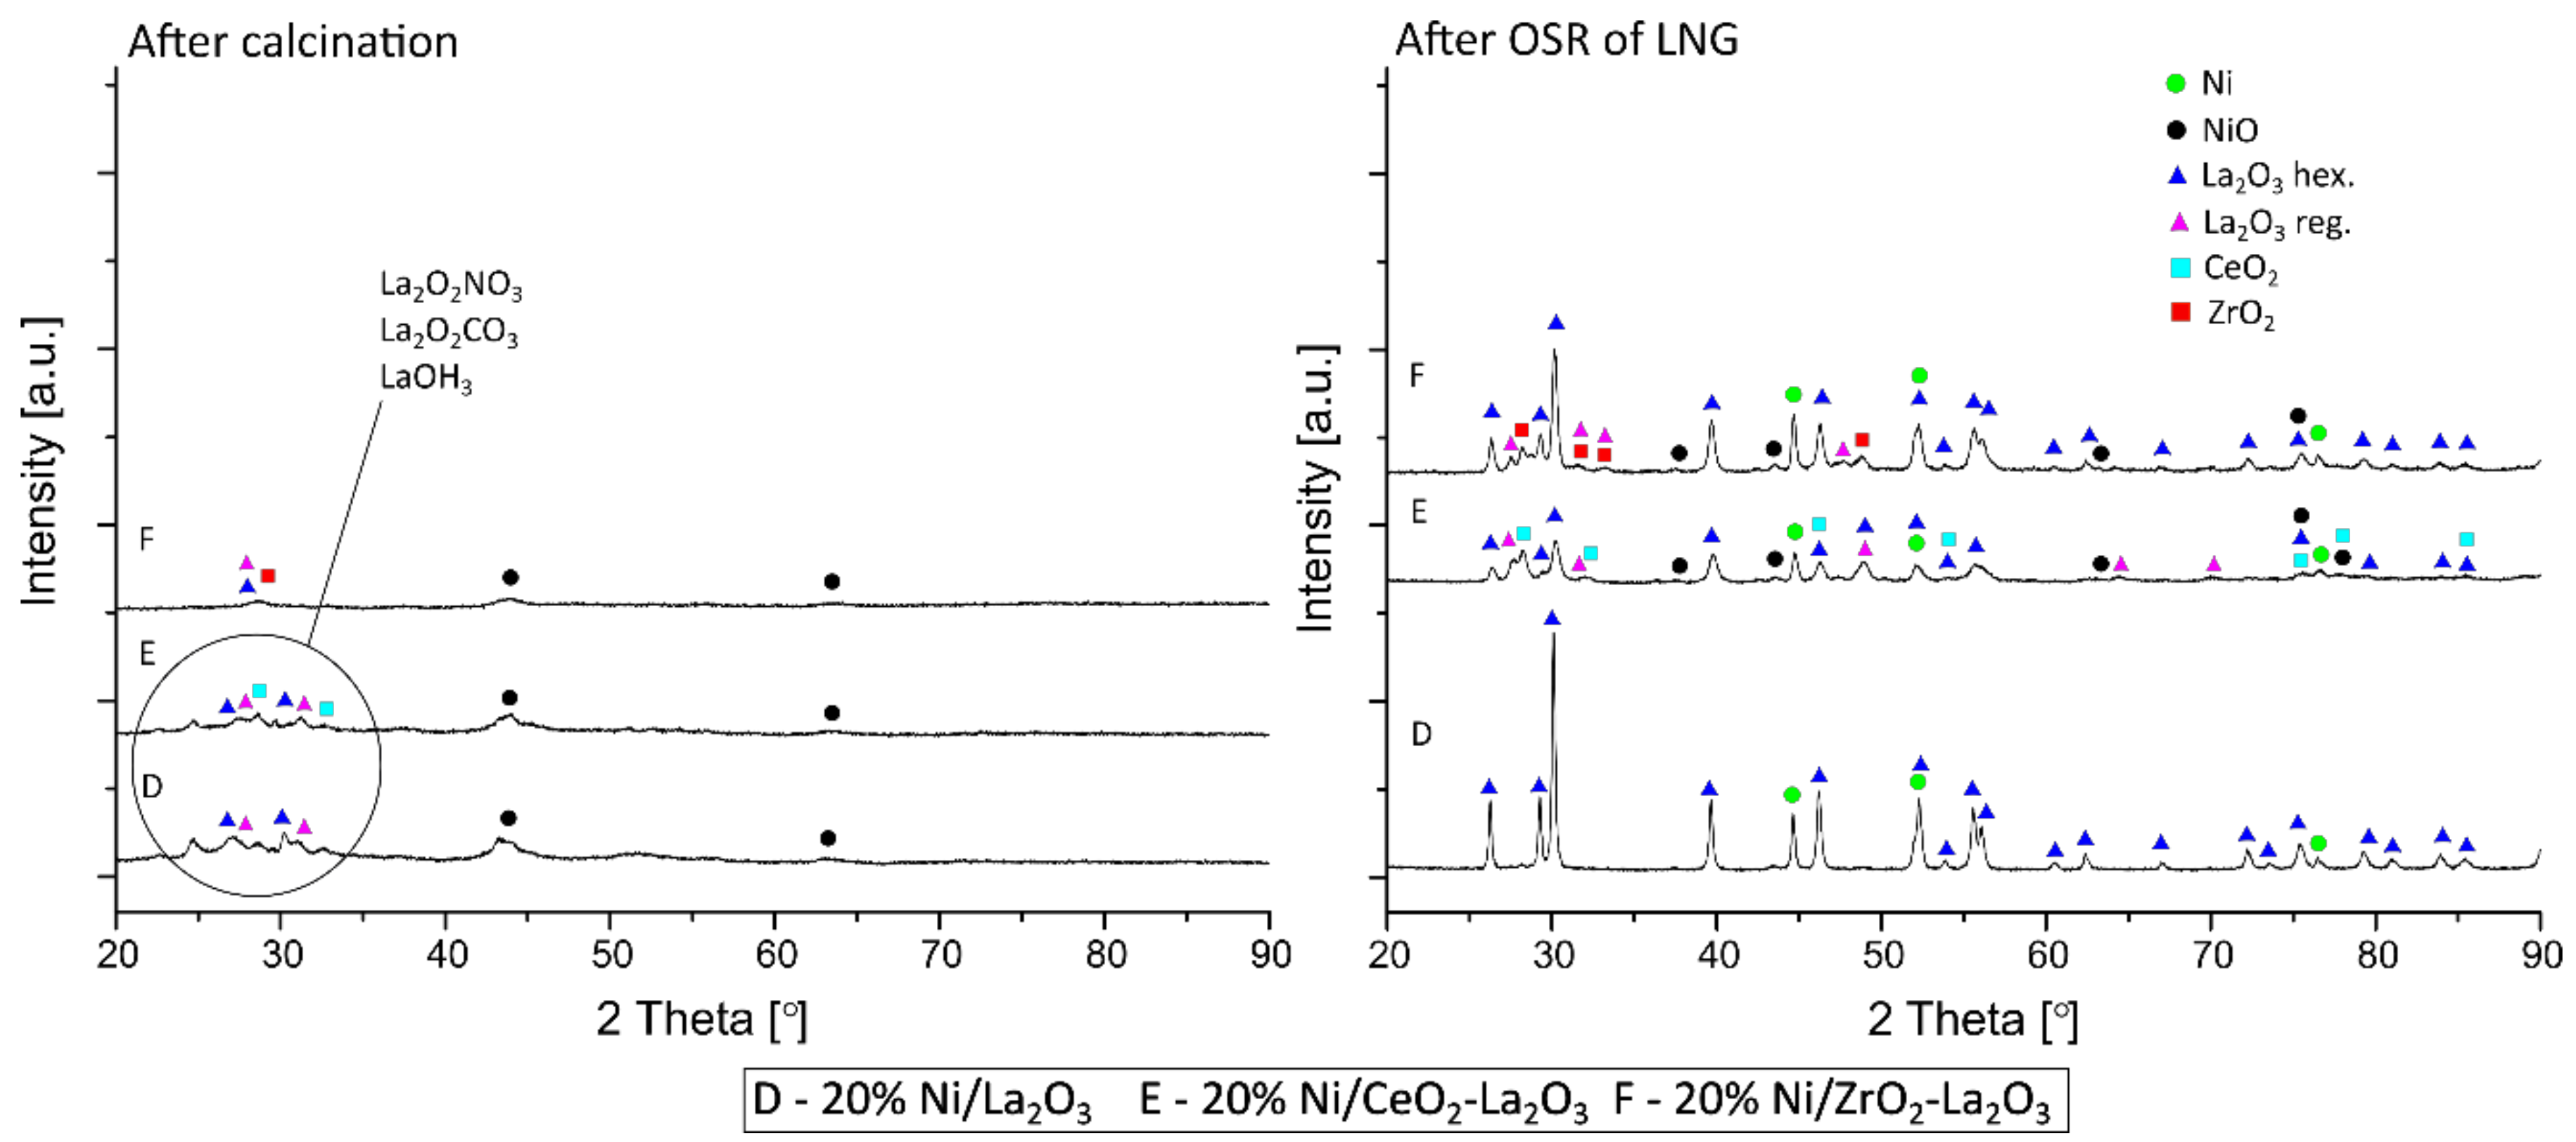
2.3. Phase Composition Studies
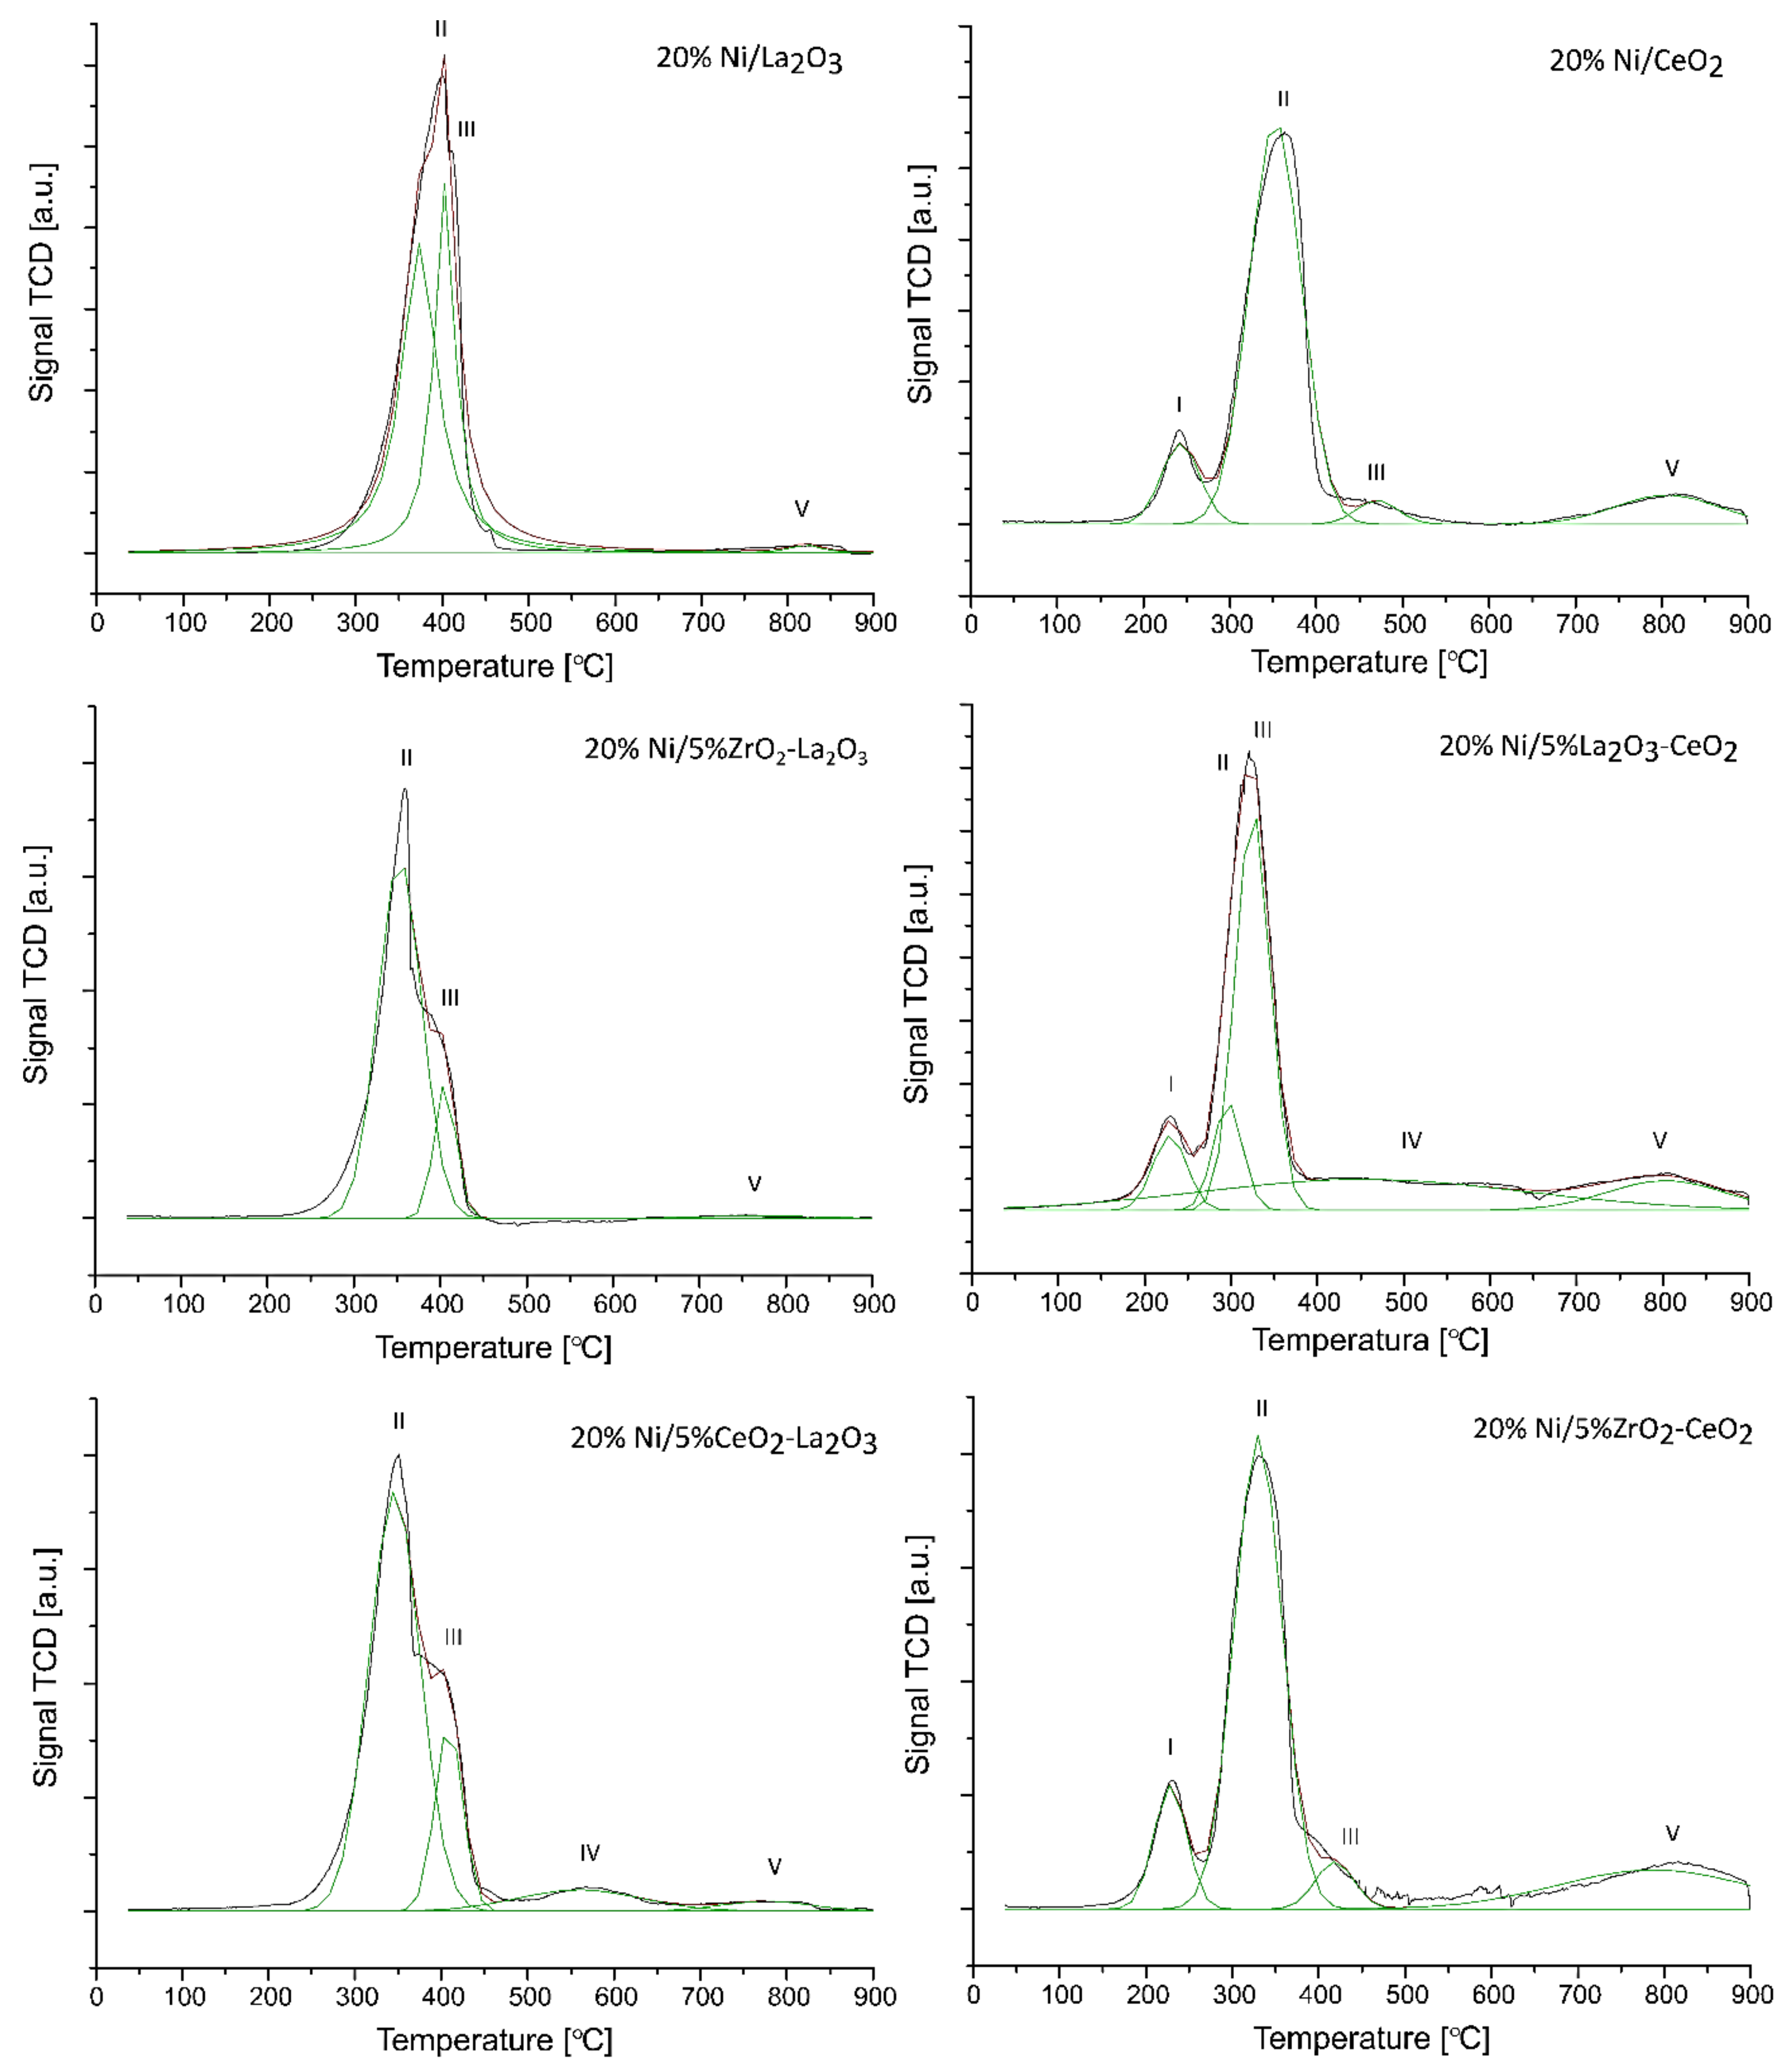
2.4. Reduction Behavior of Ni Catalysts
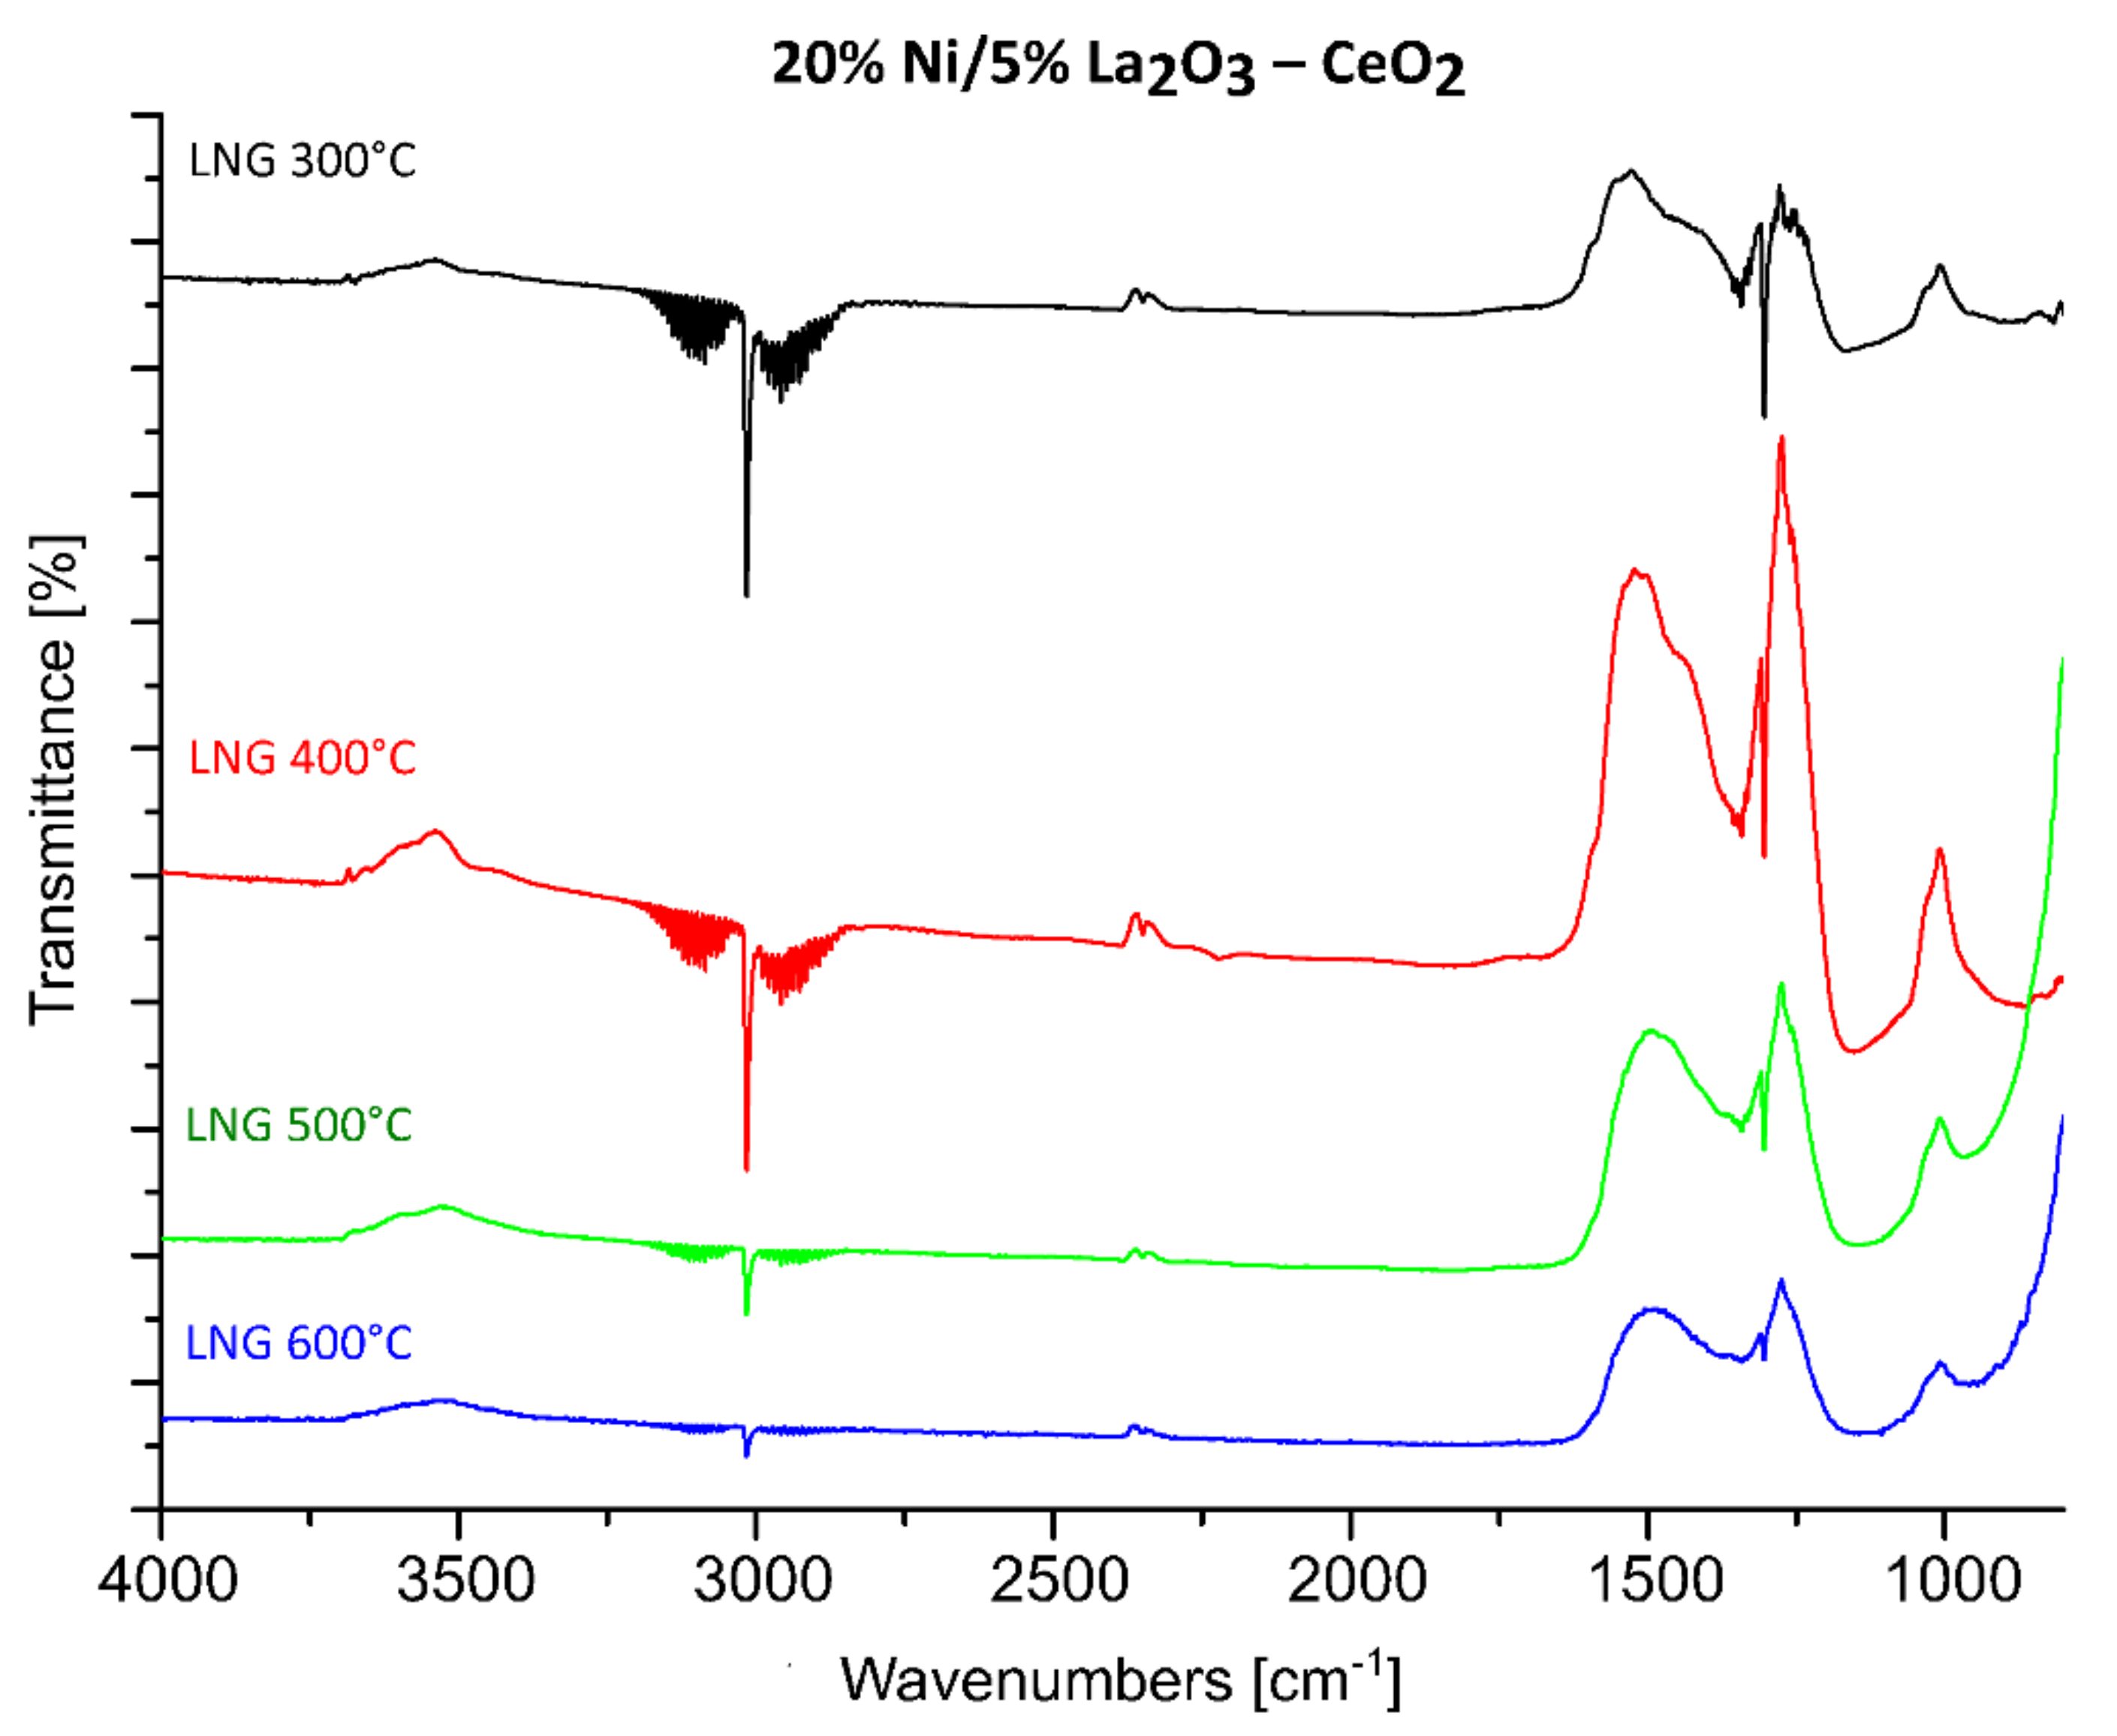
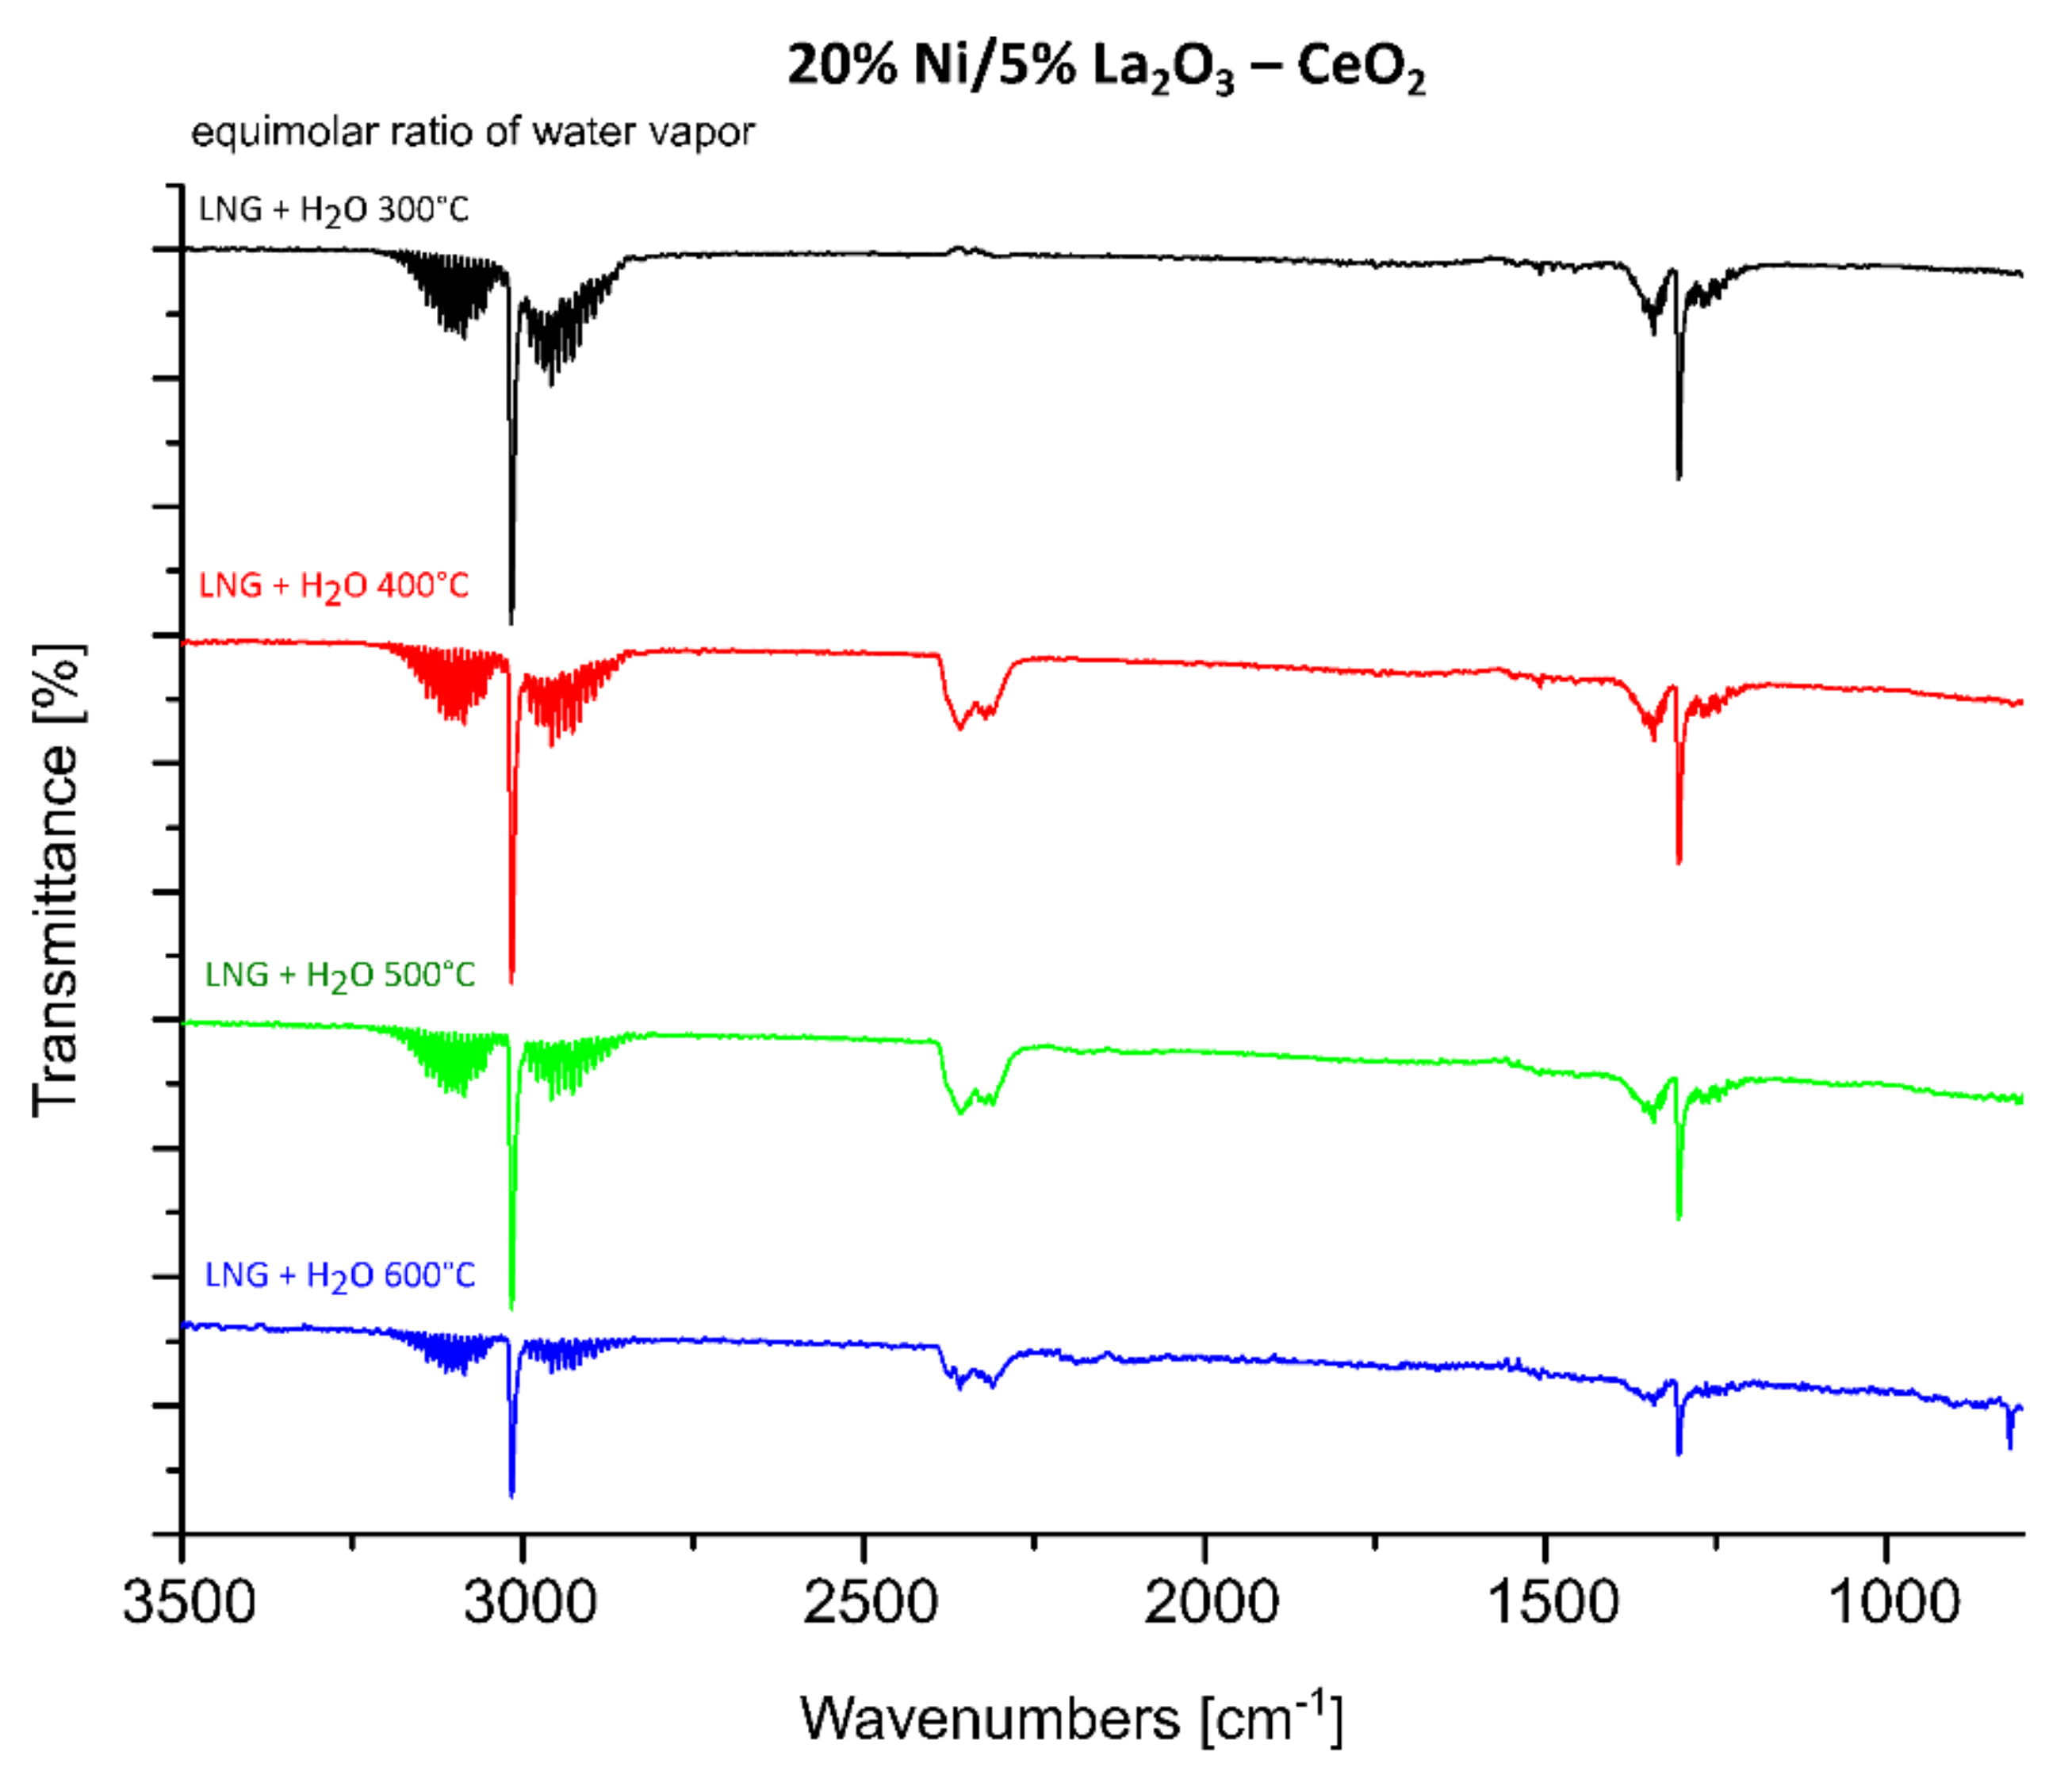
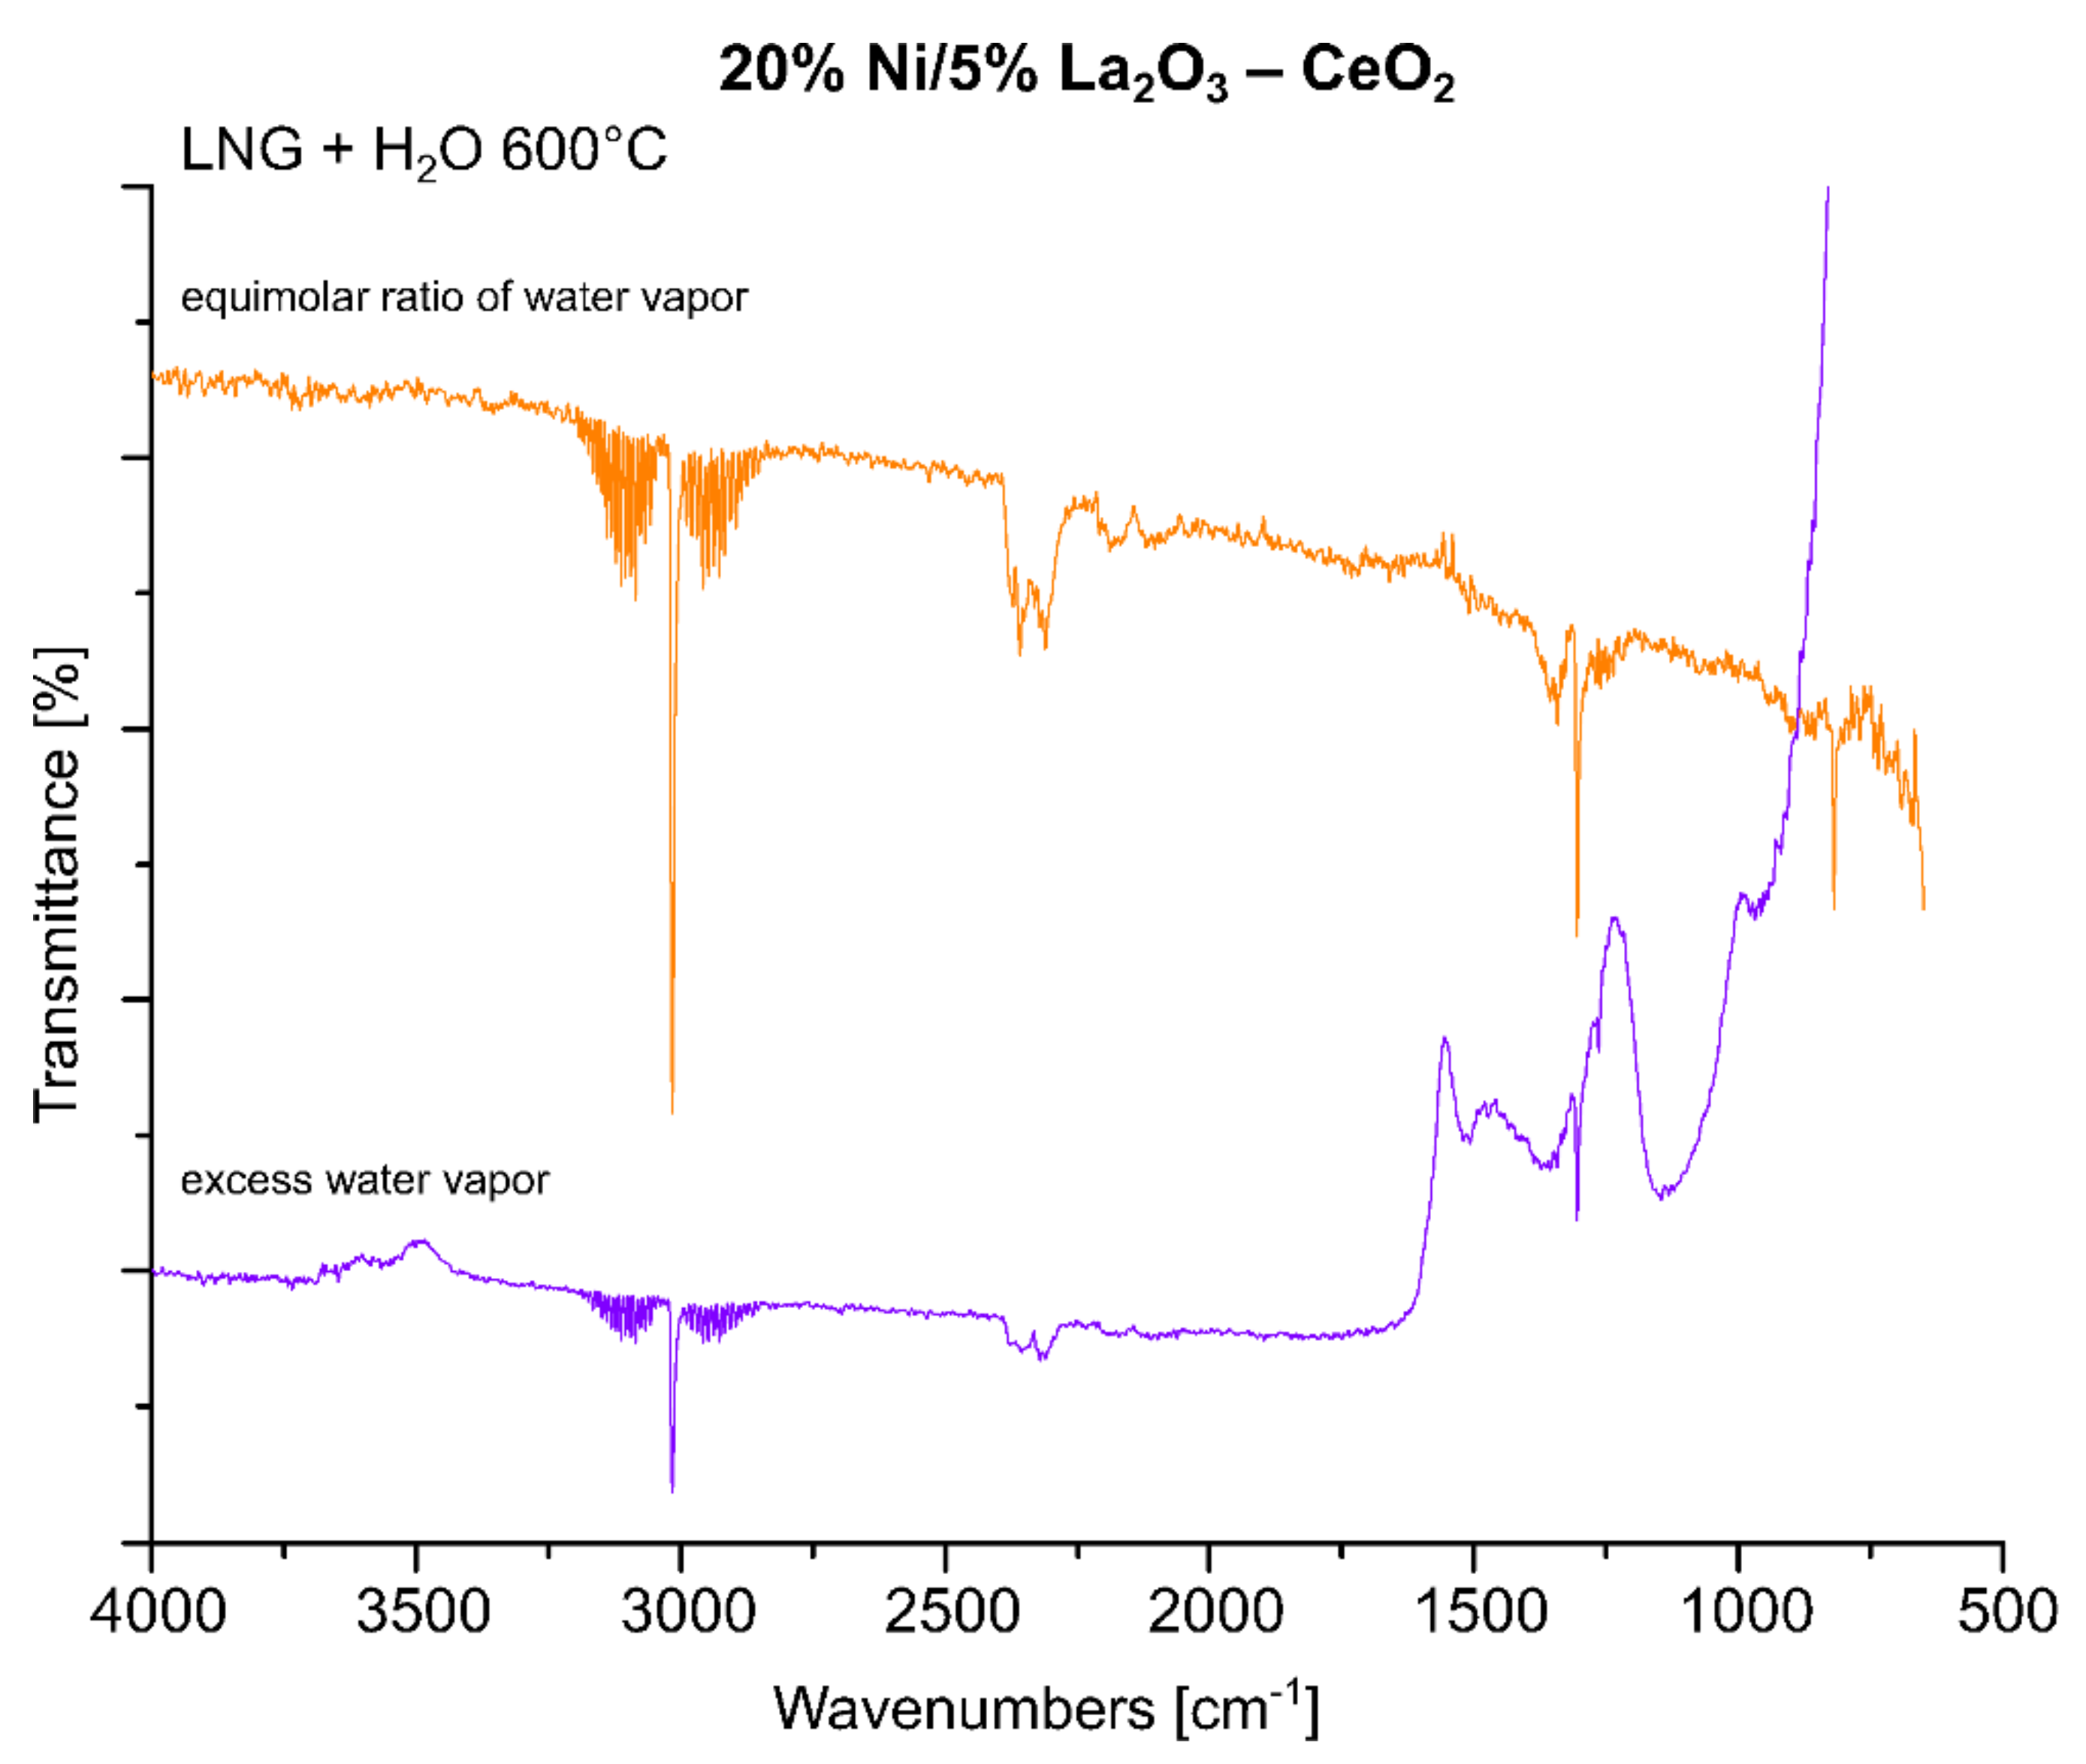
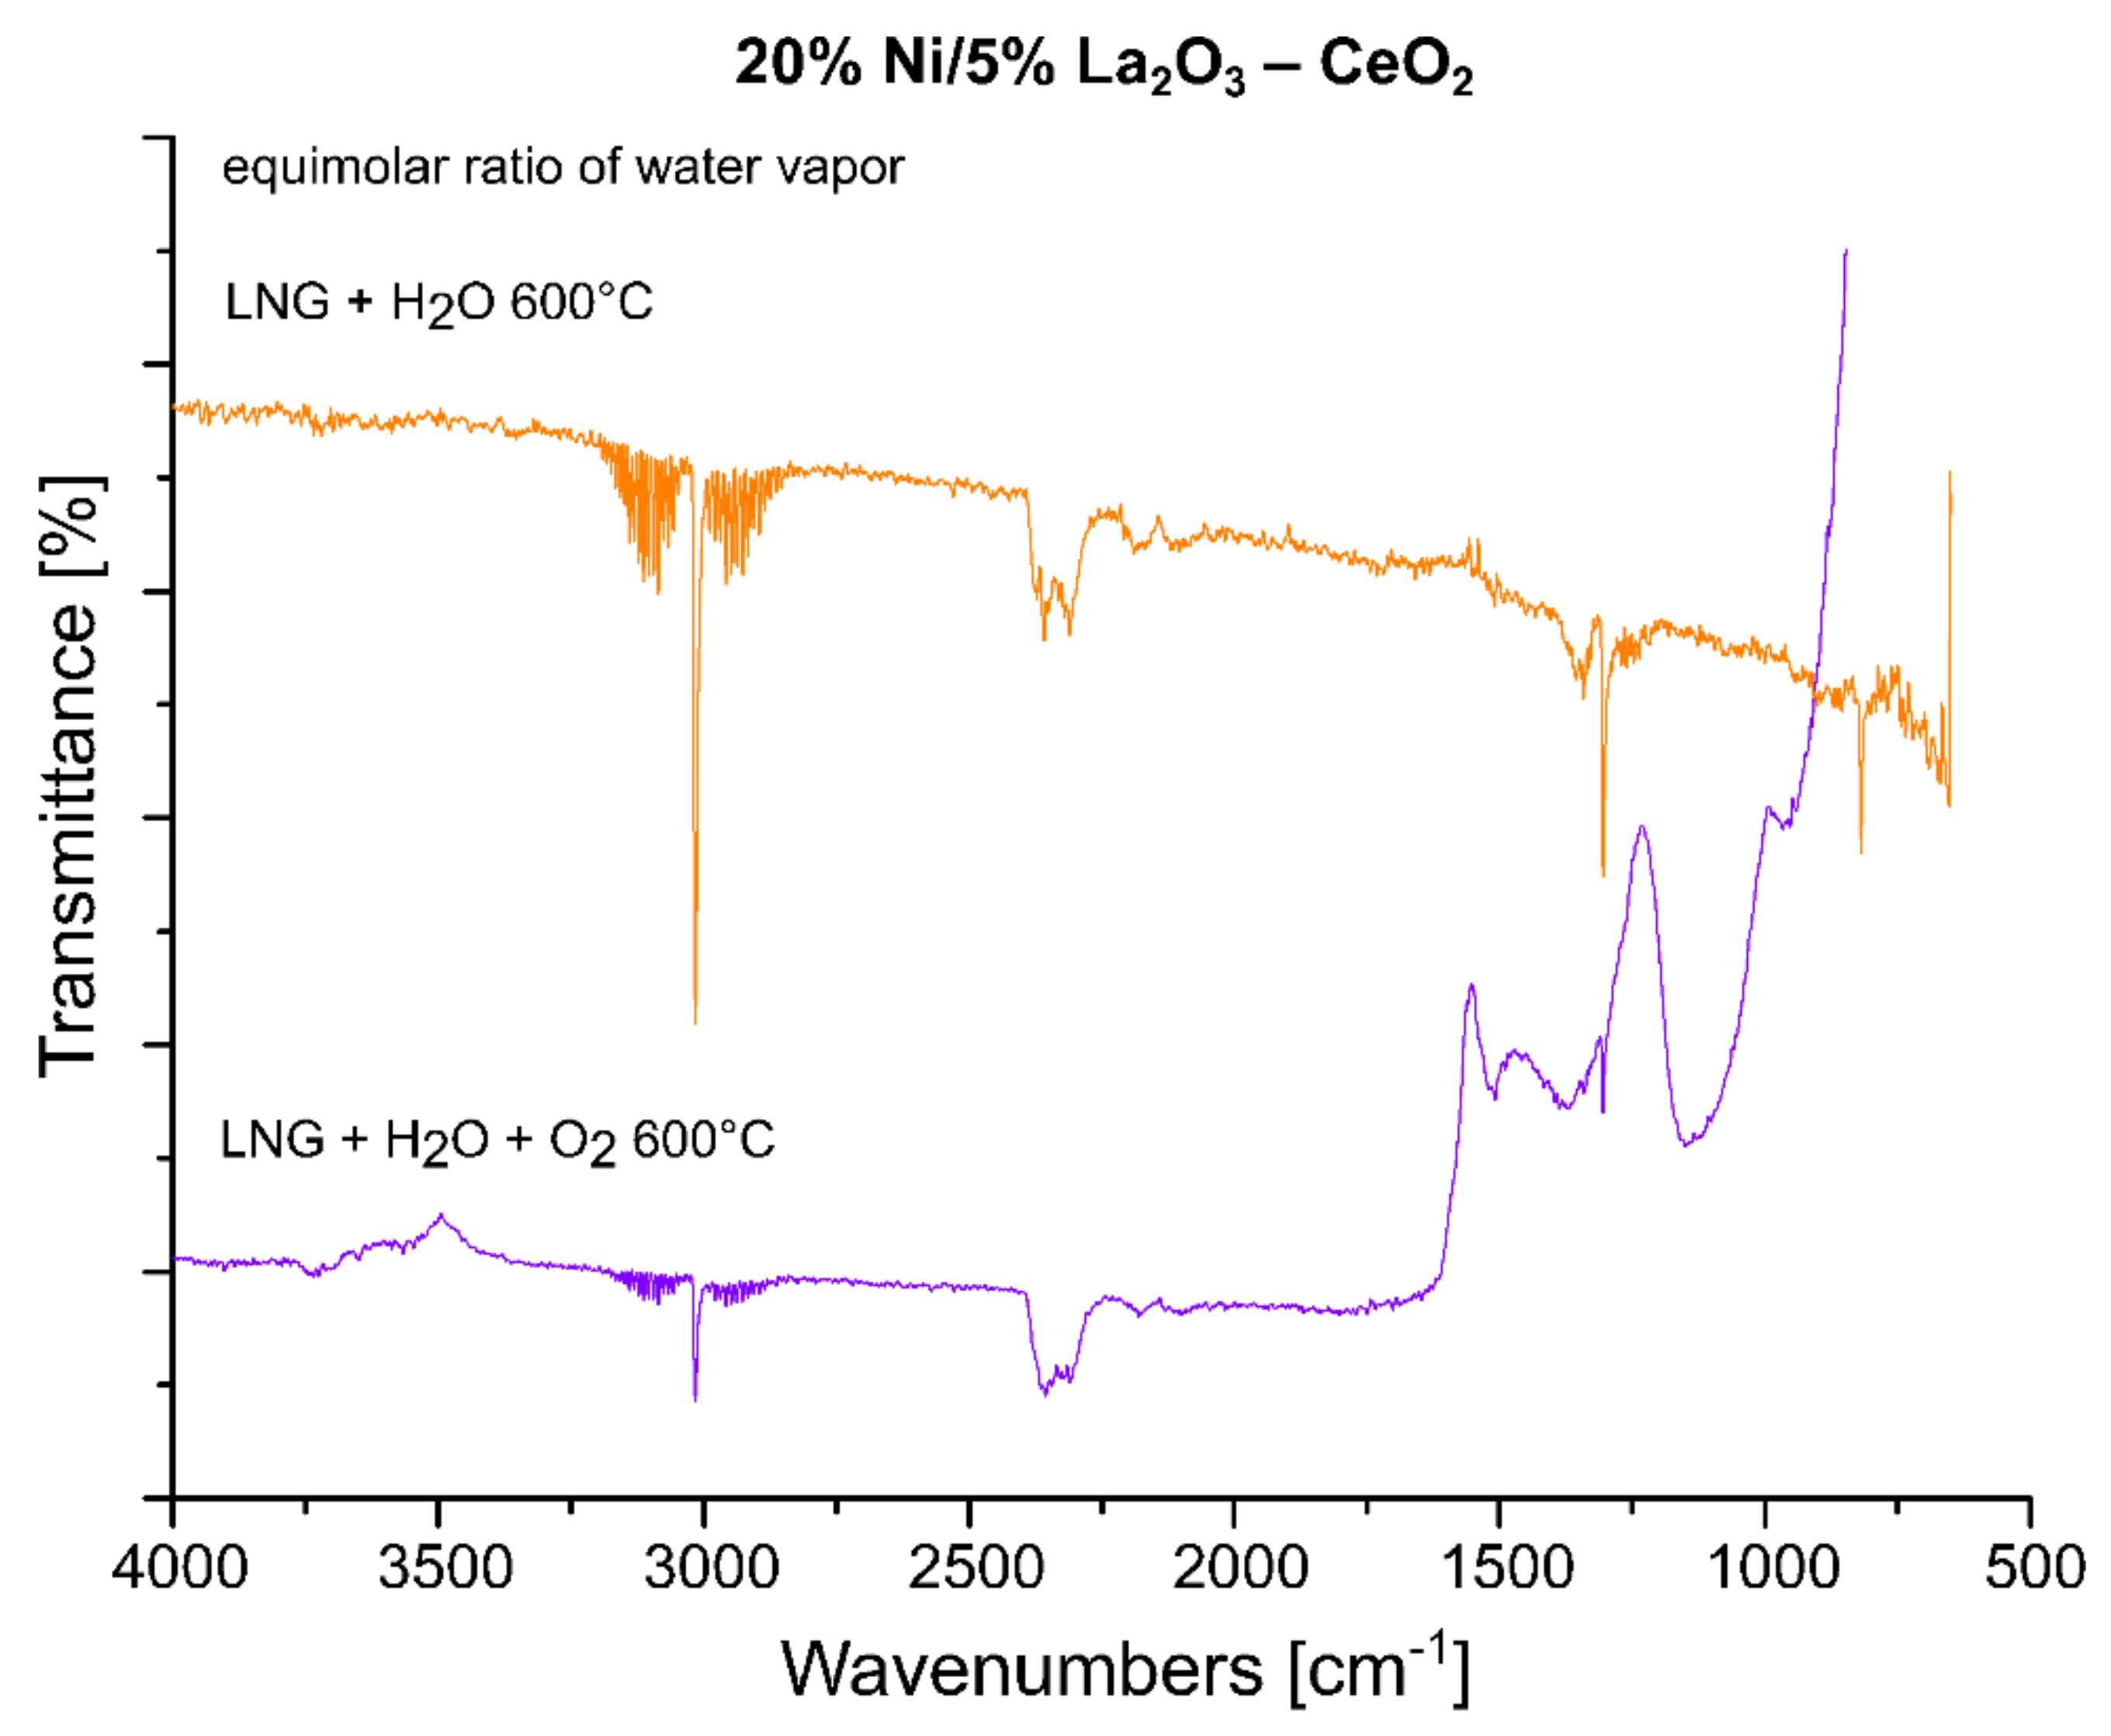
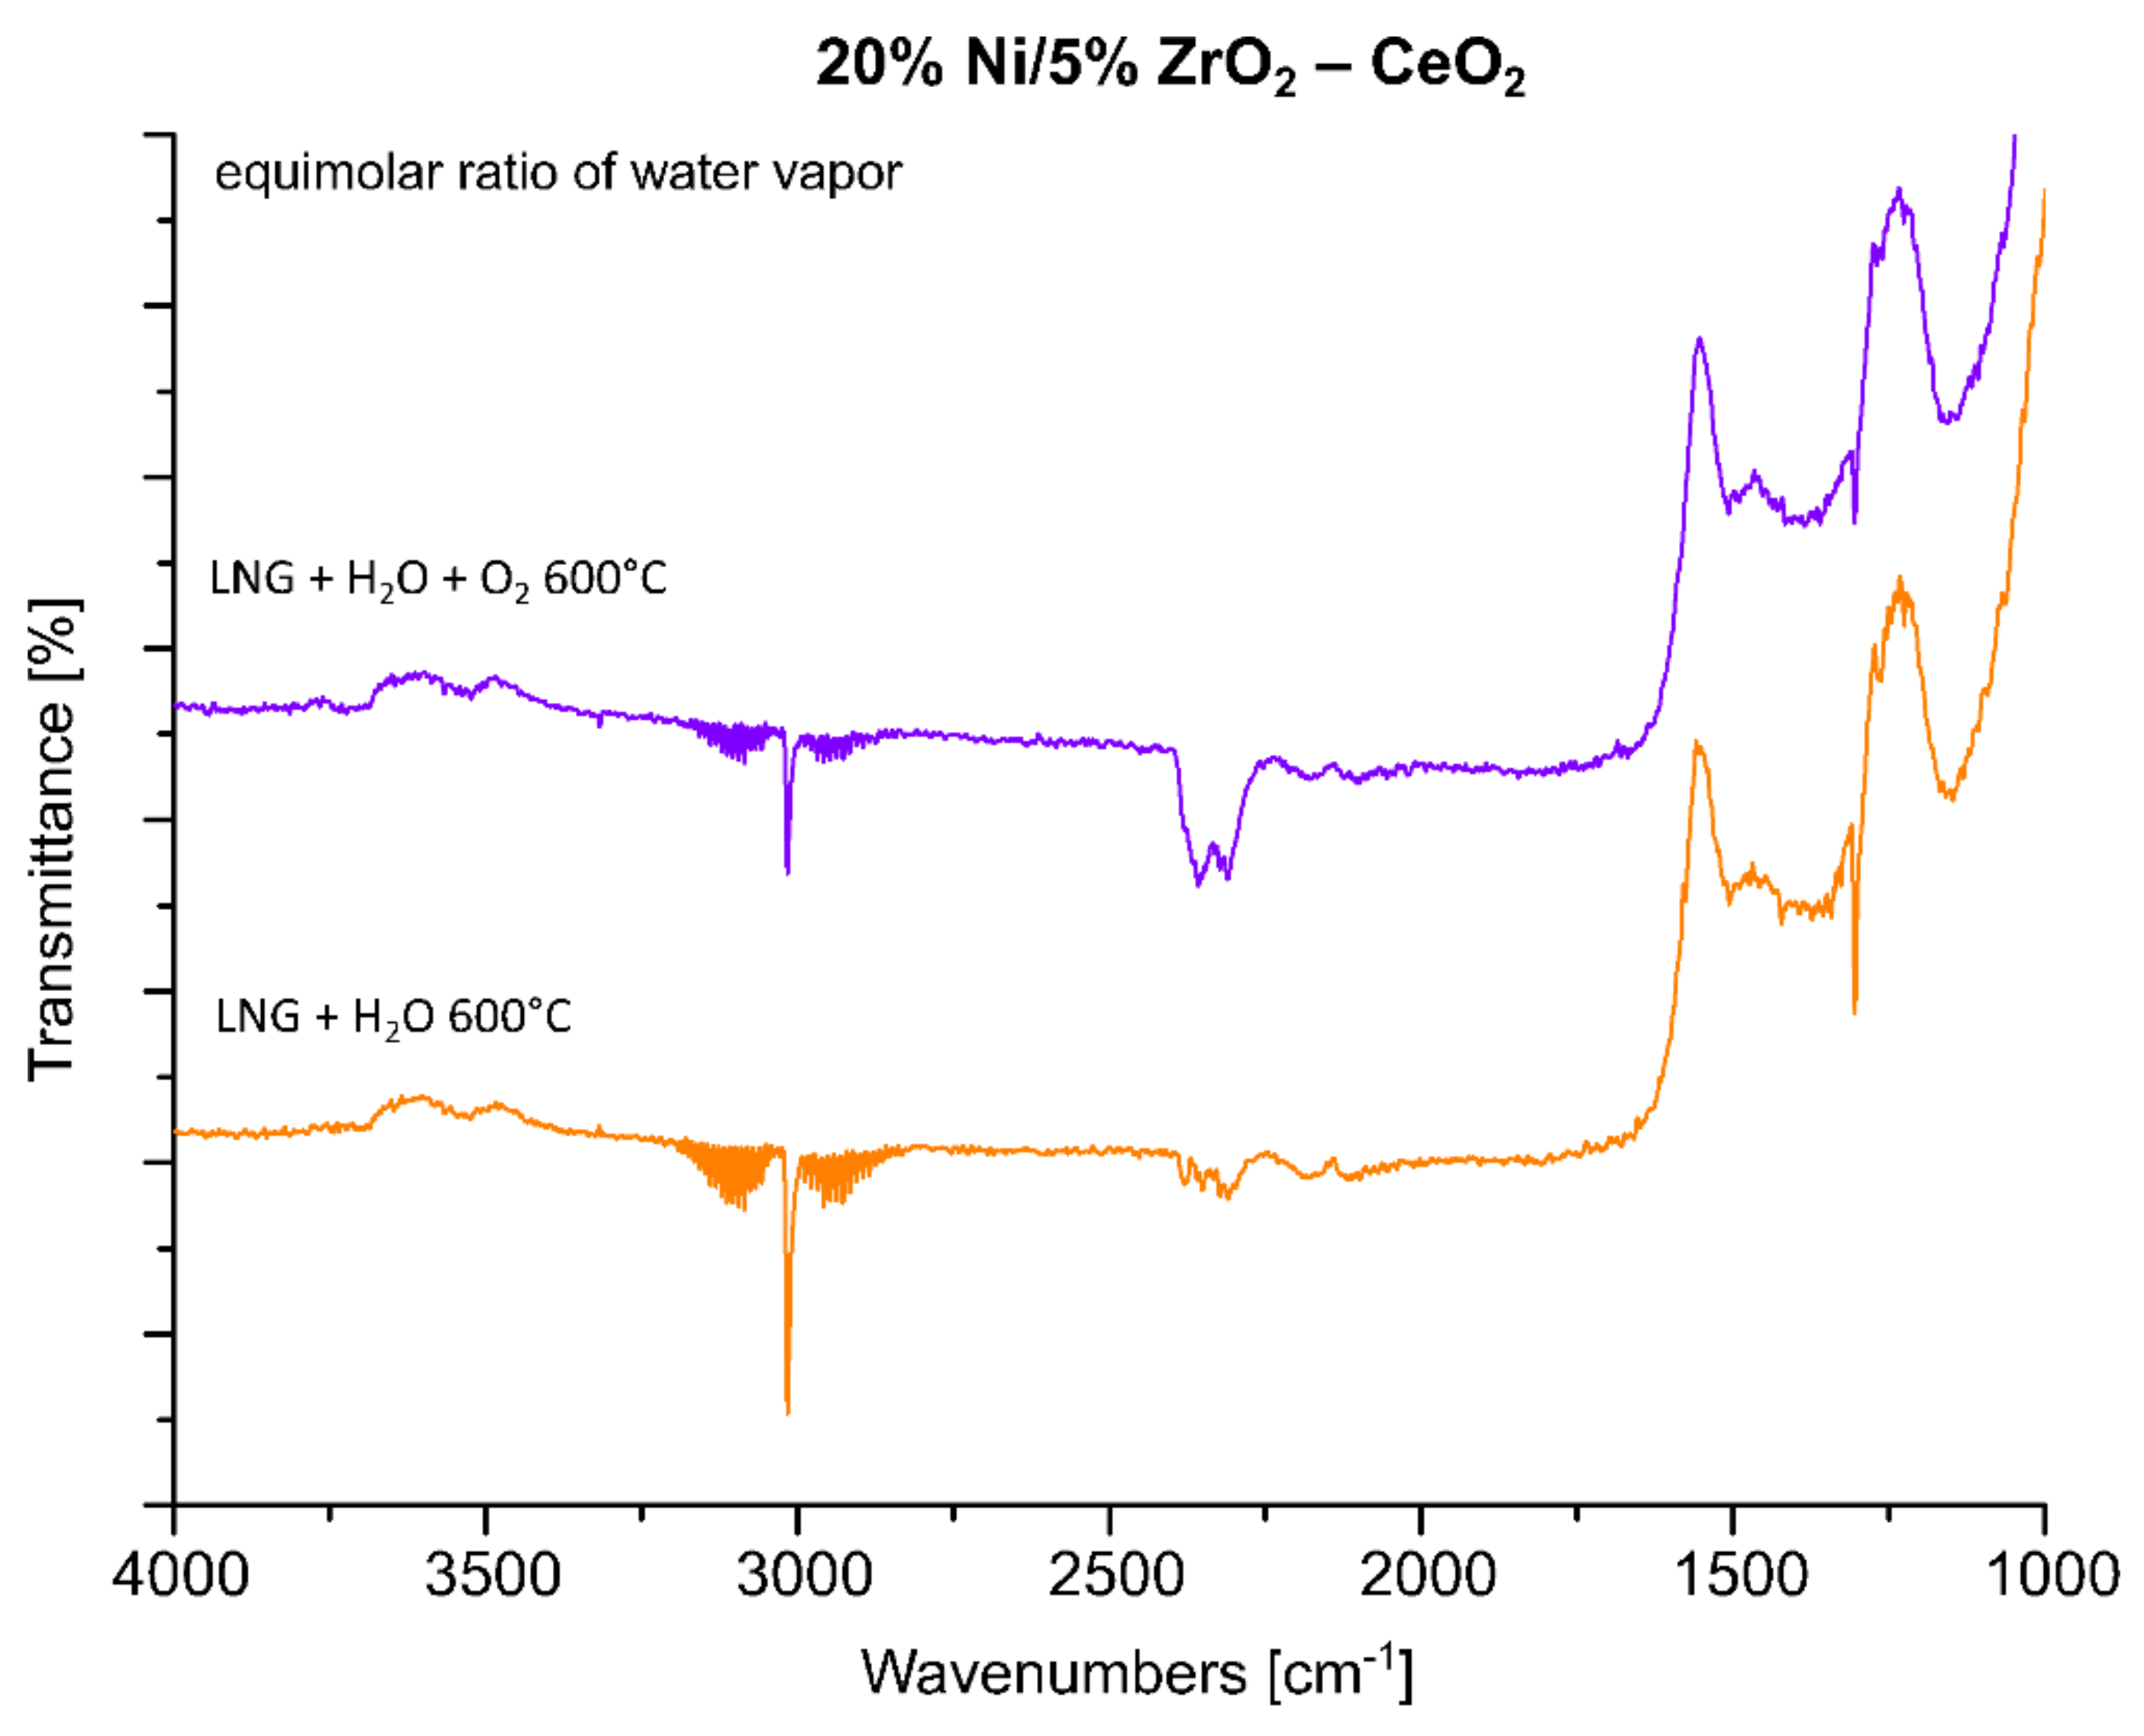
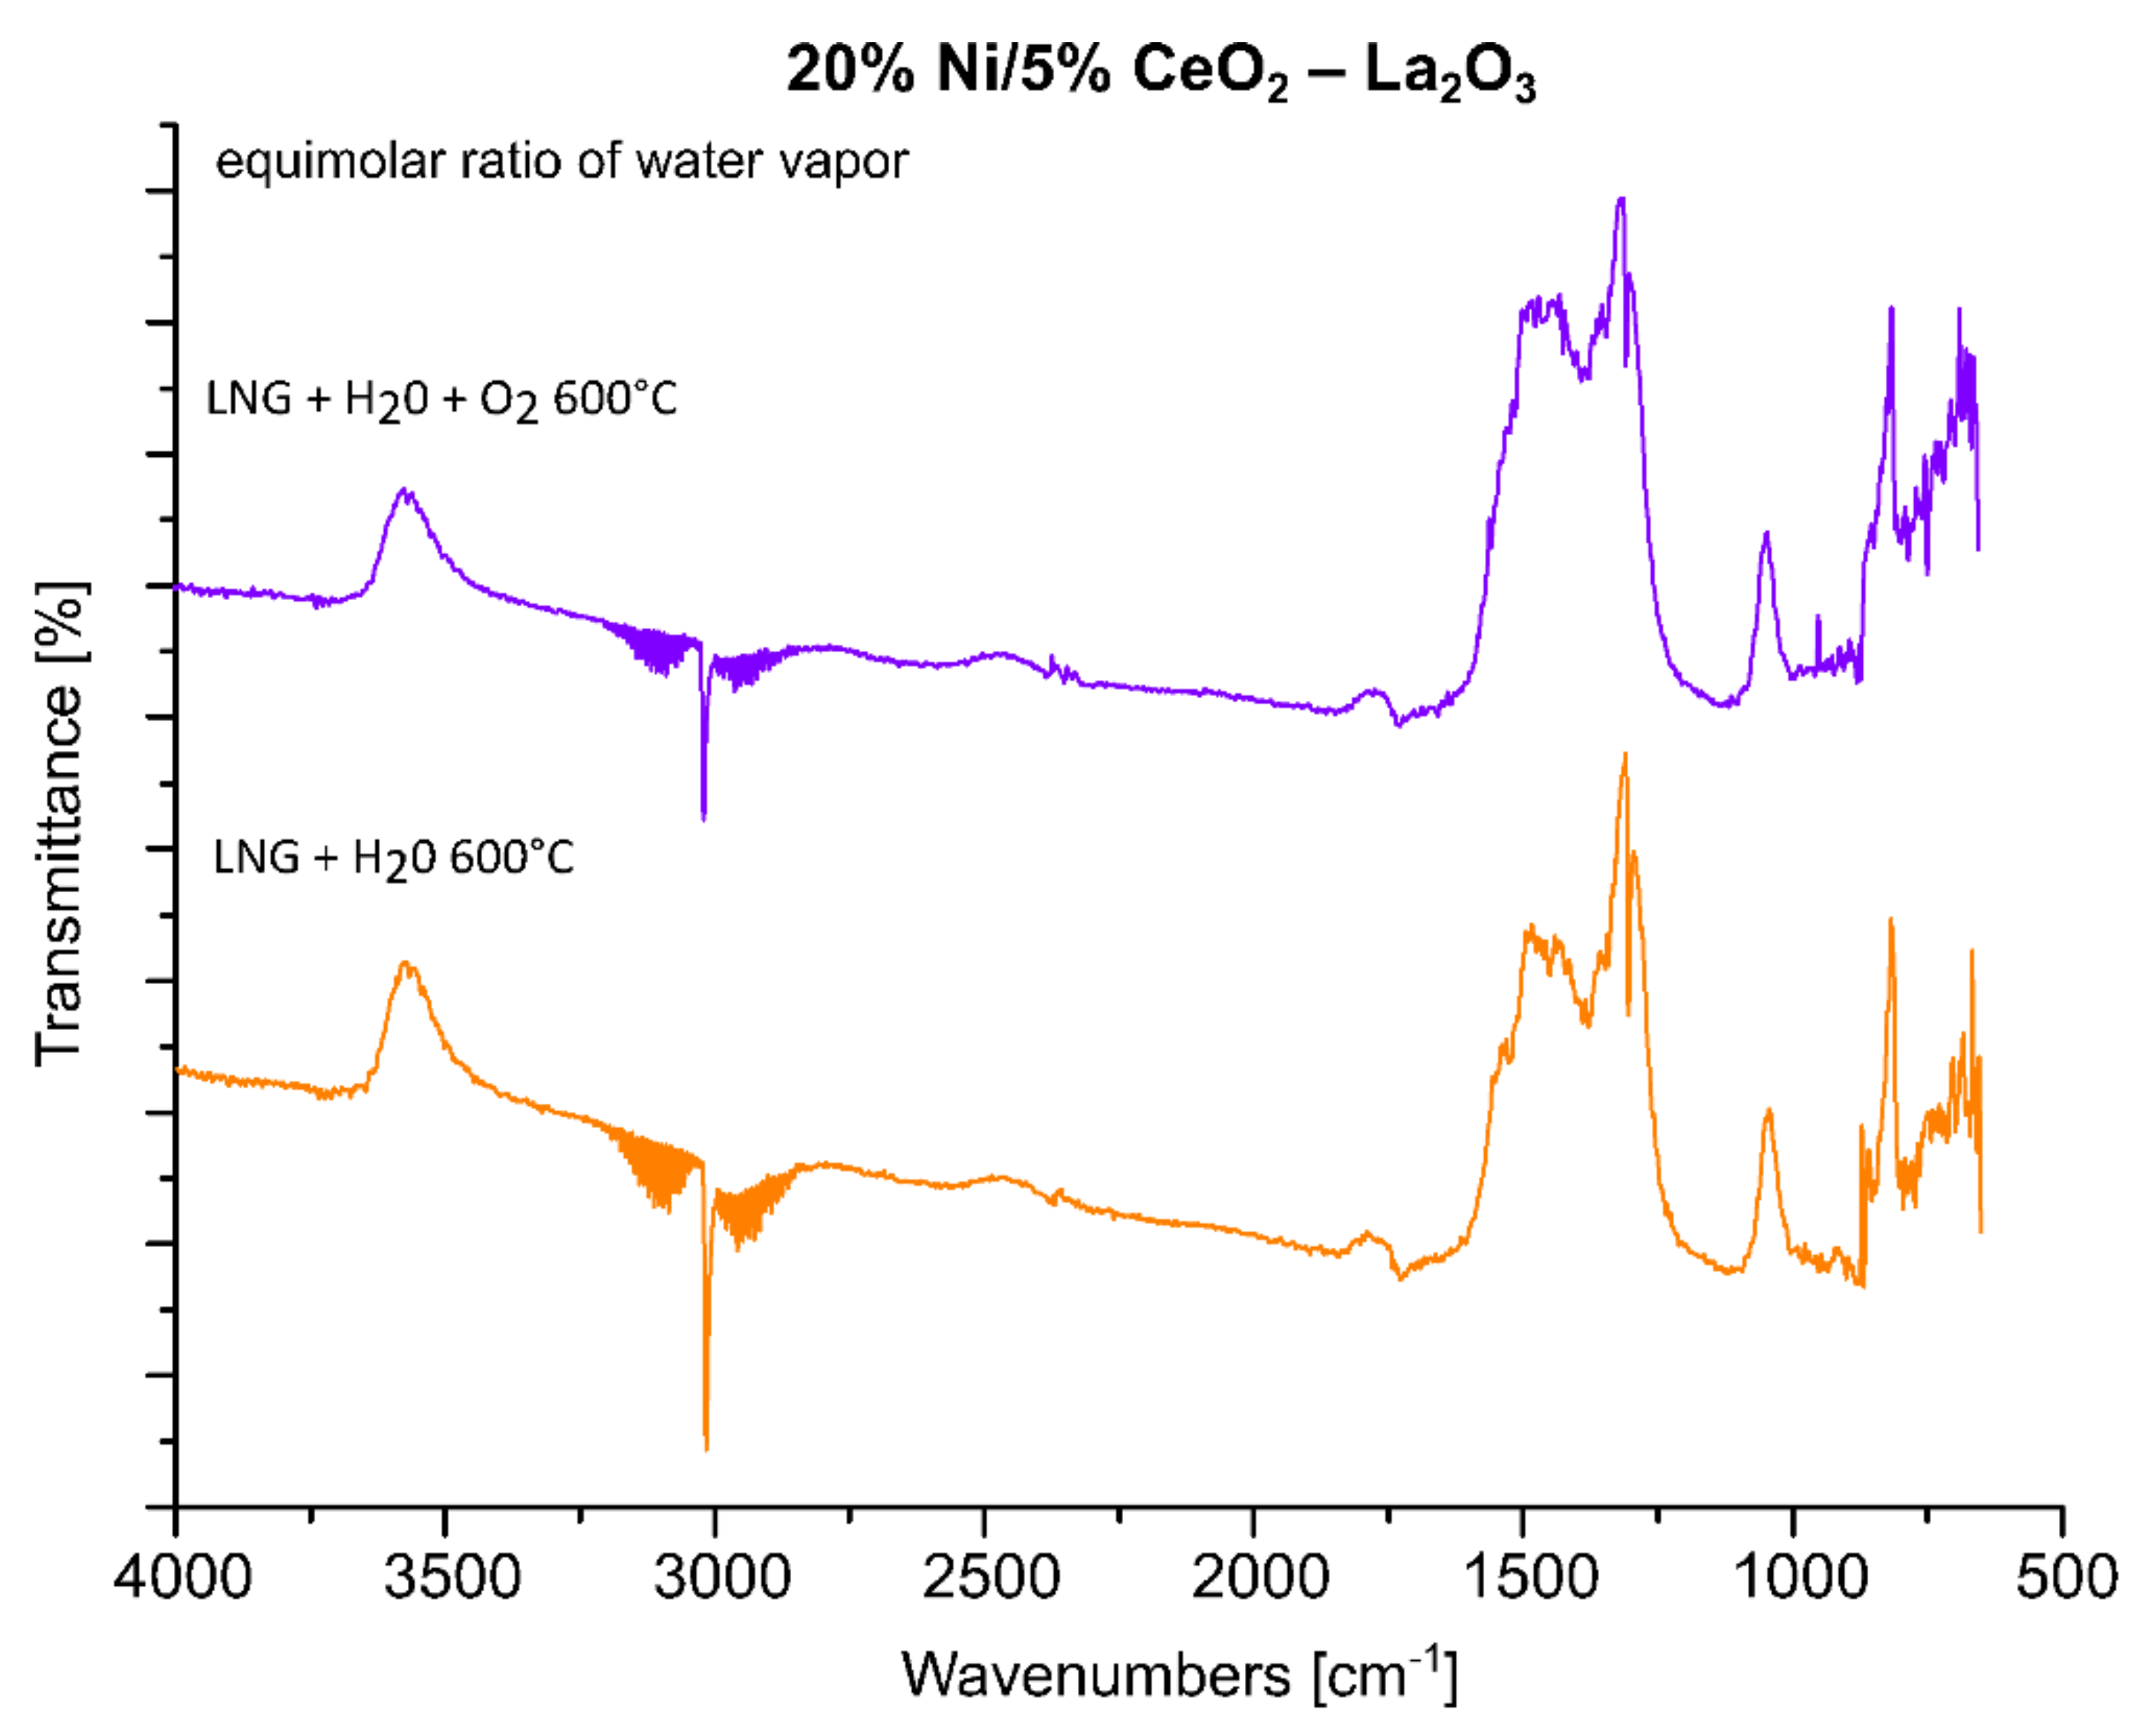
2.5. FTIR Analysis
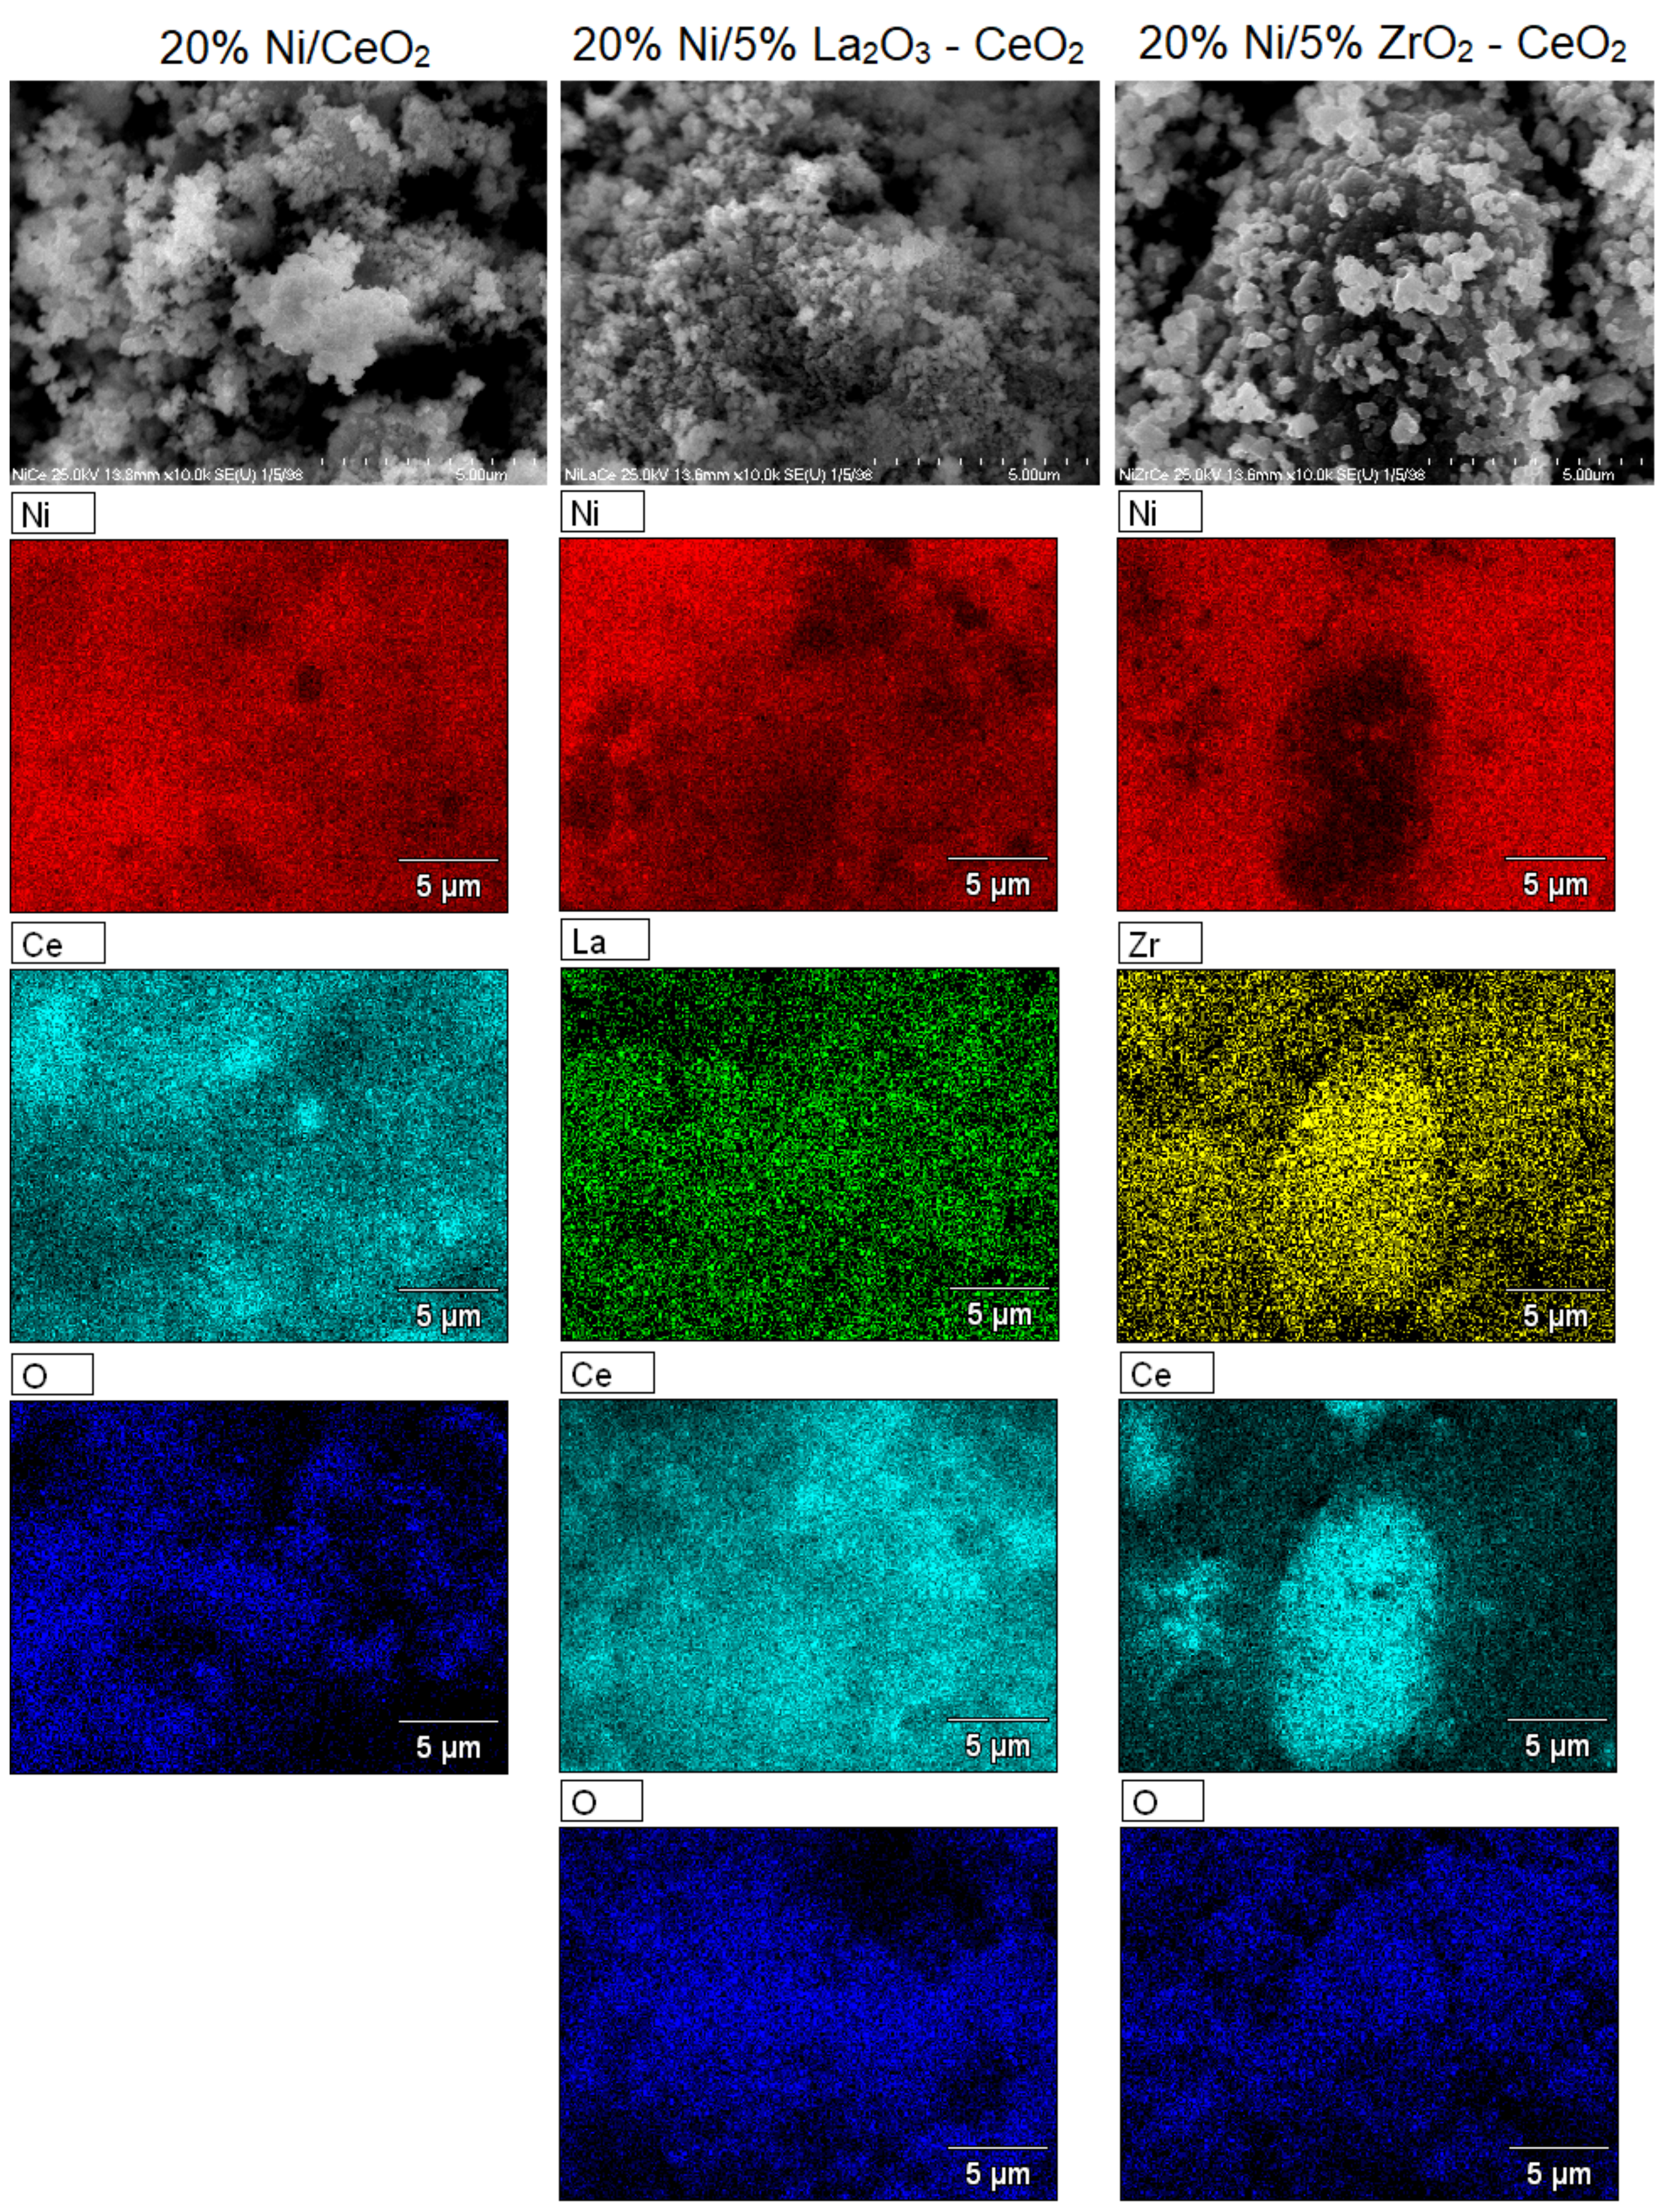
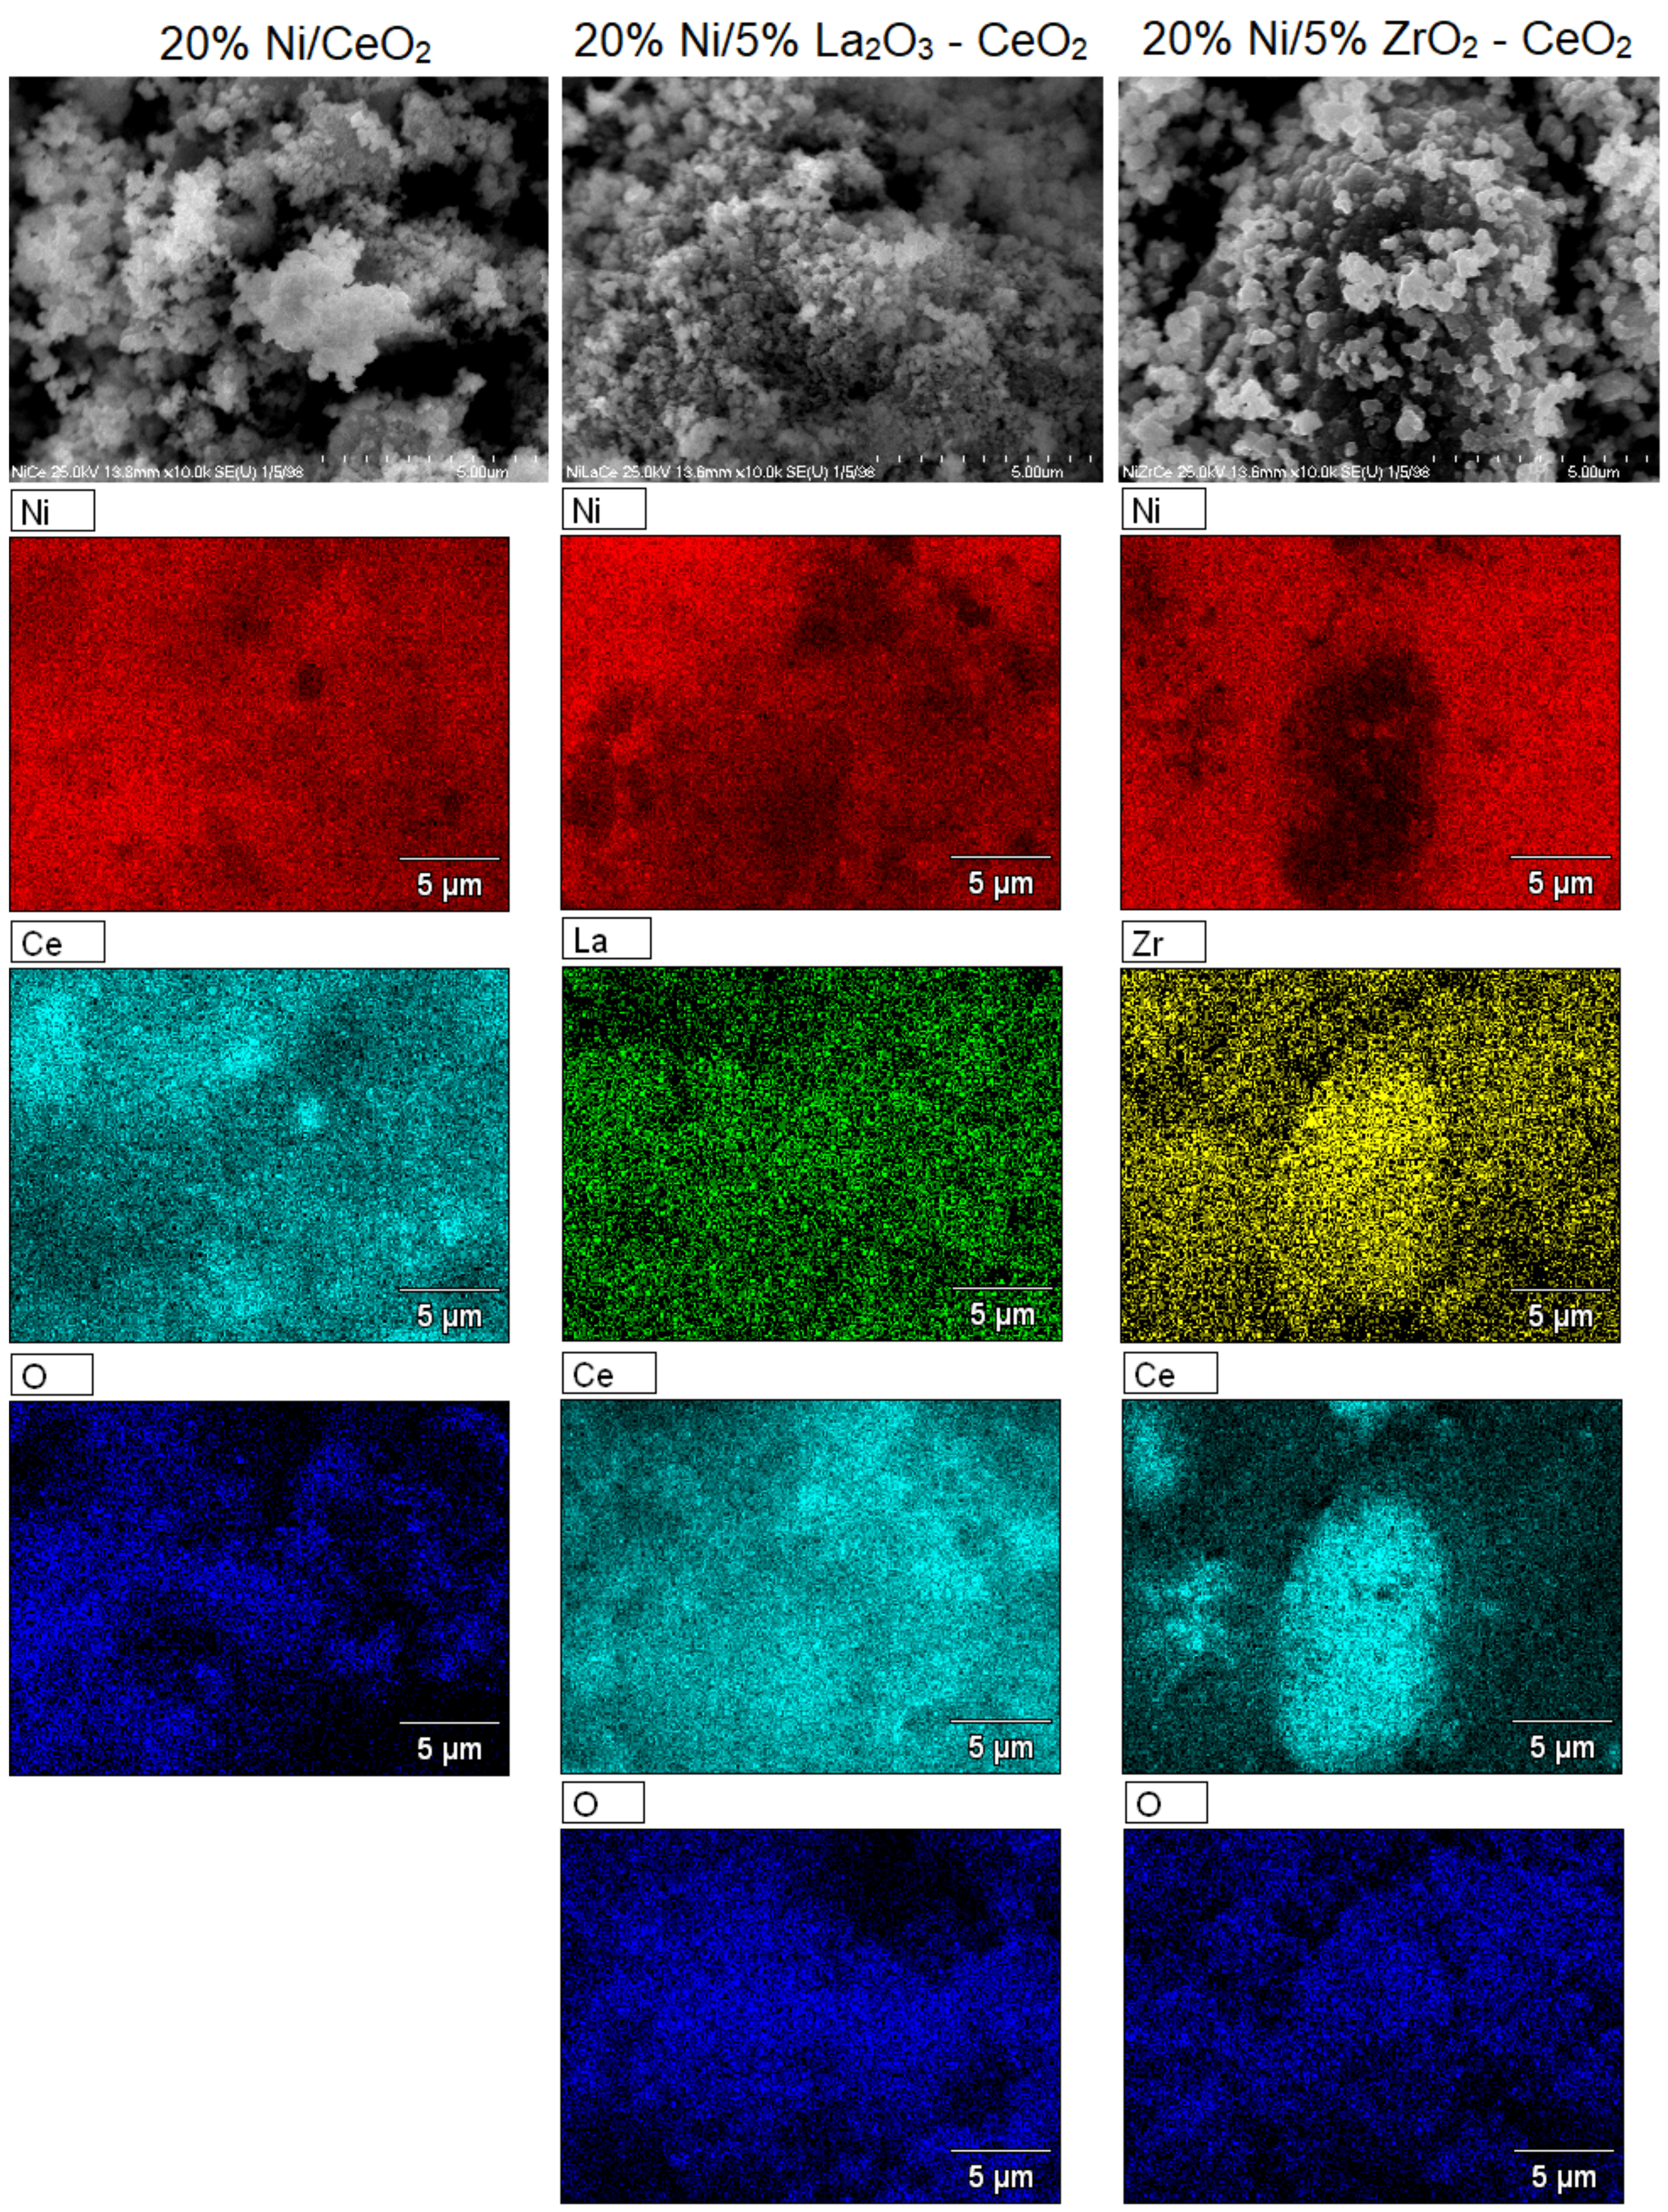
2.6. SEM-EDS Analysis
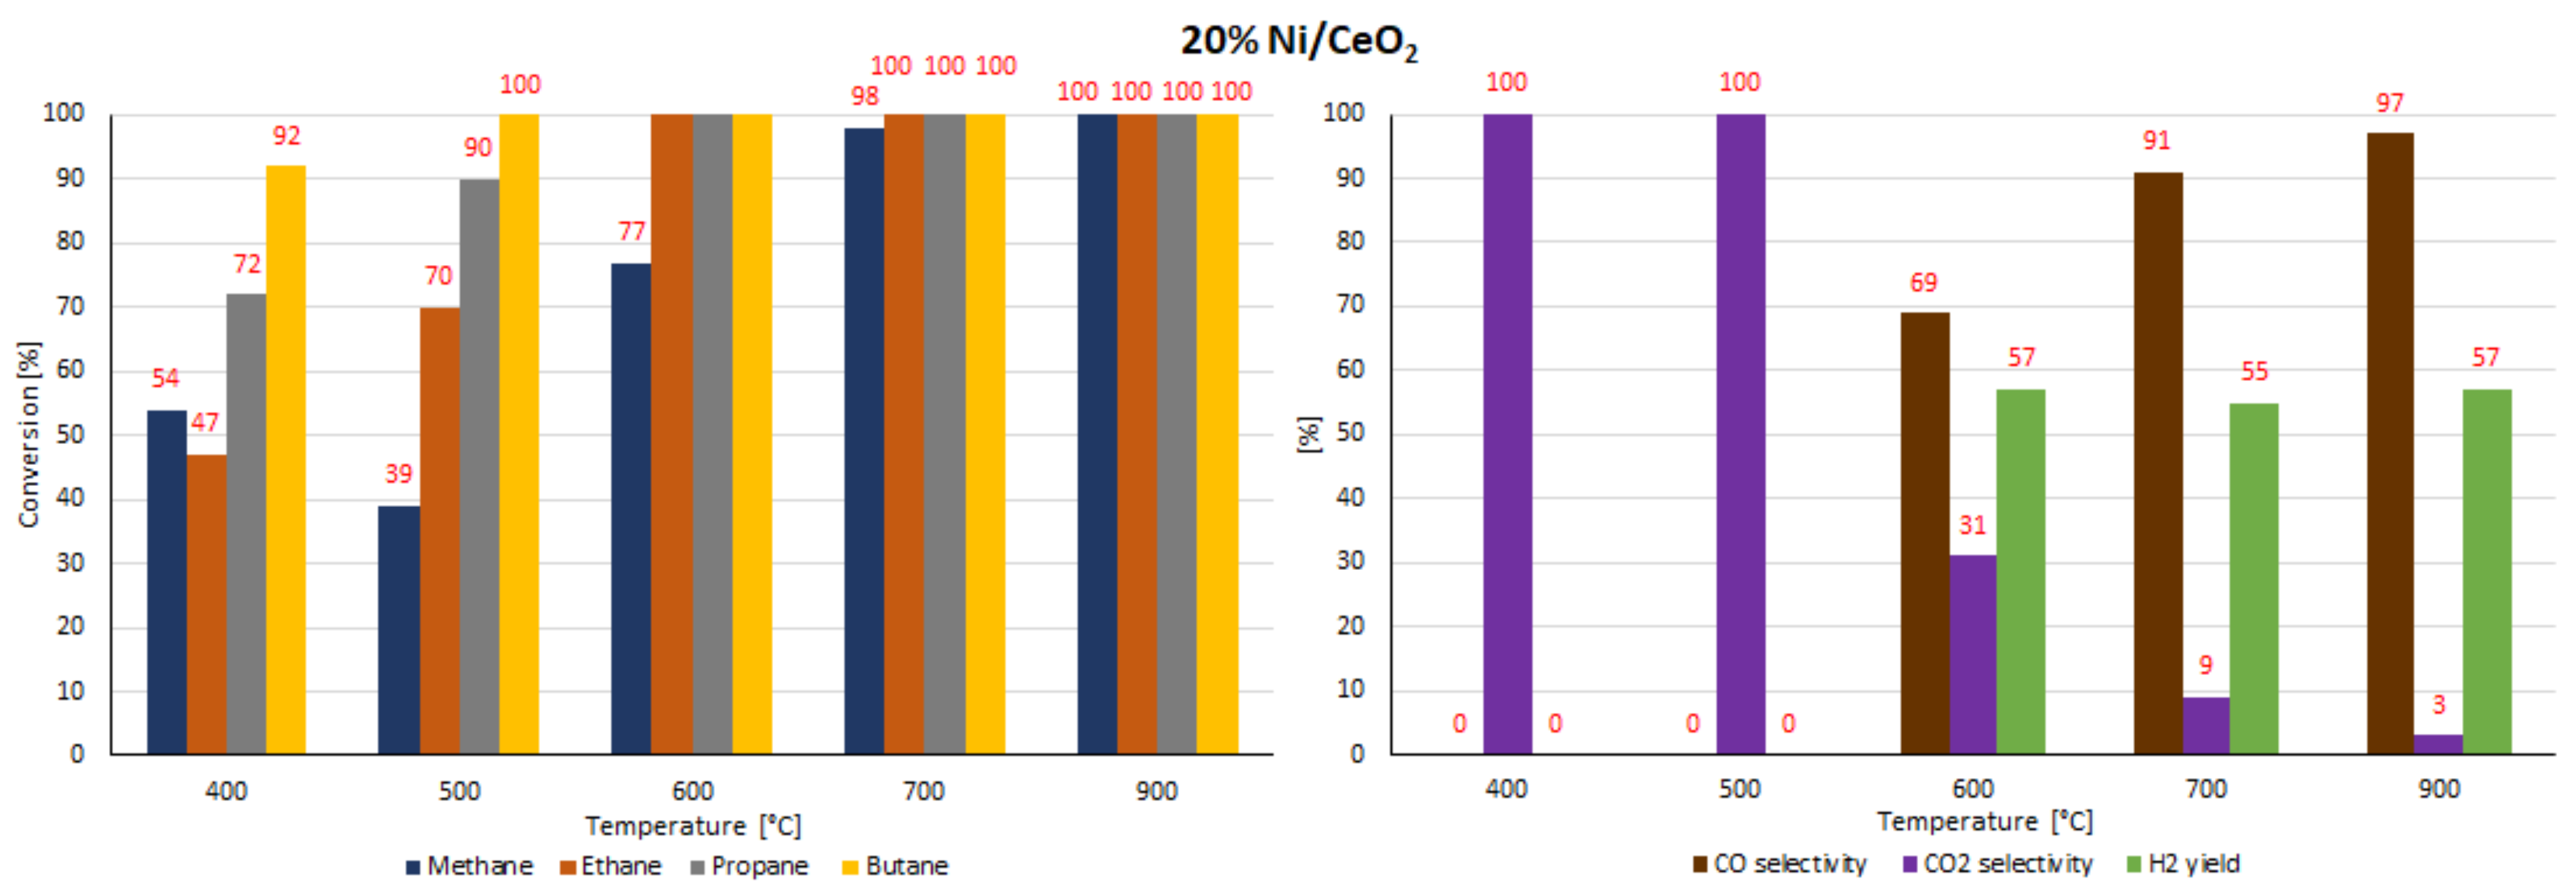
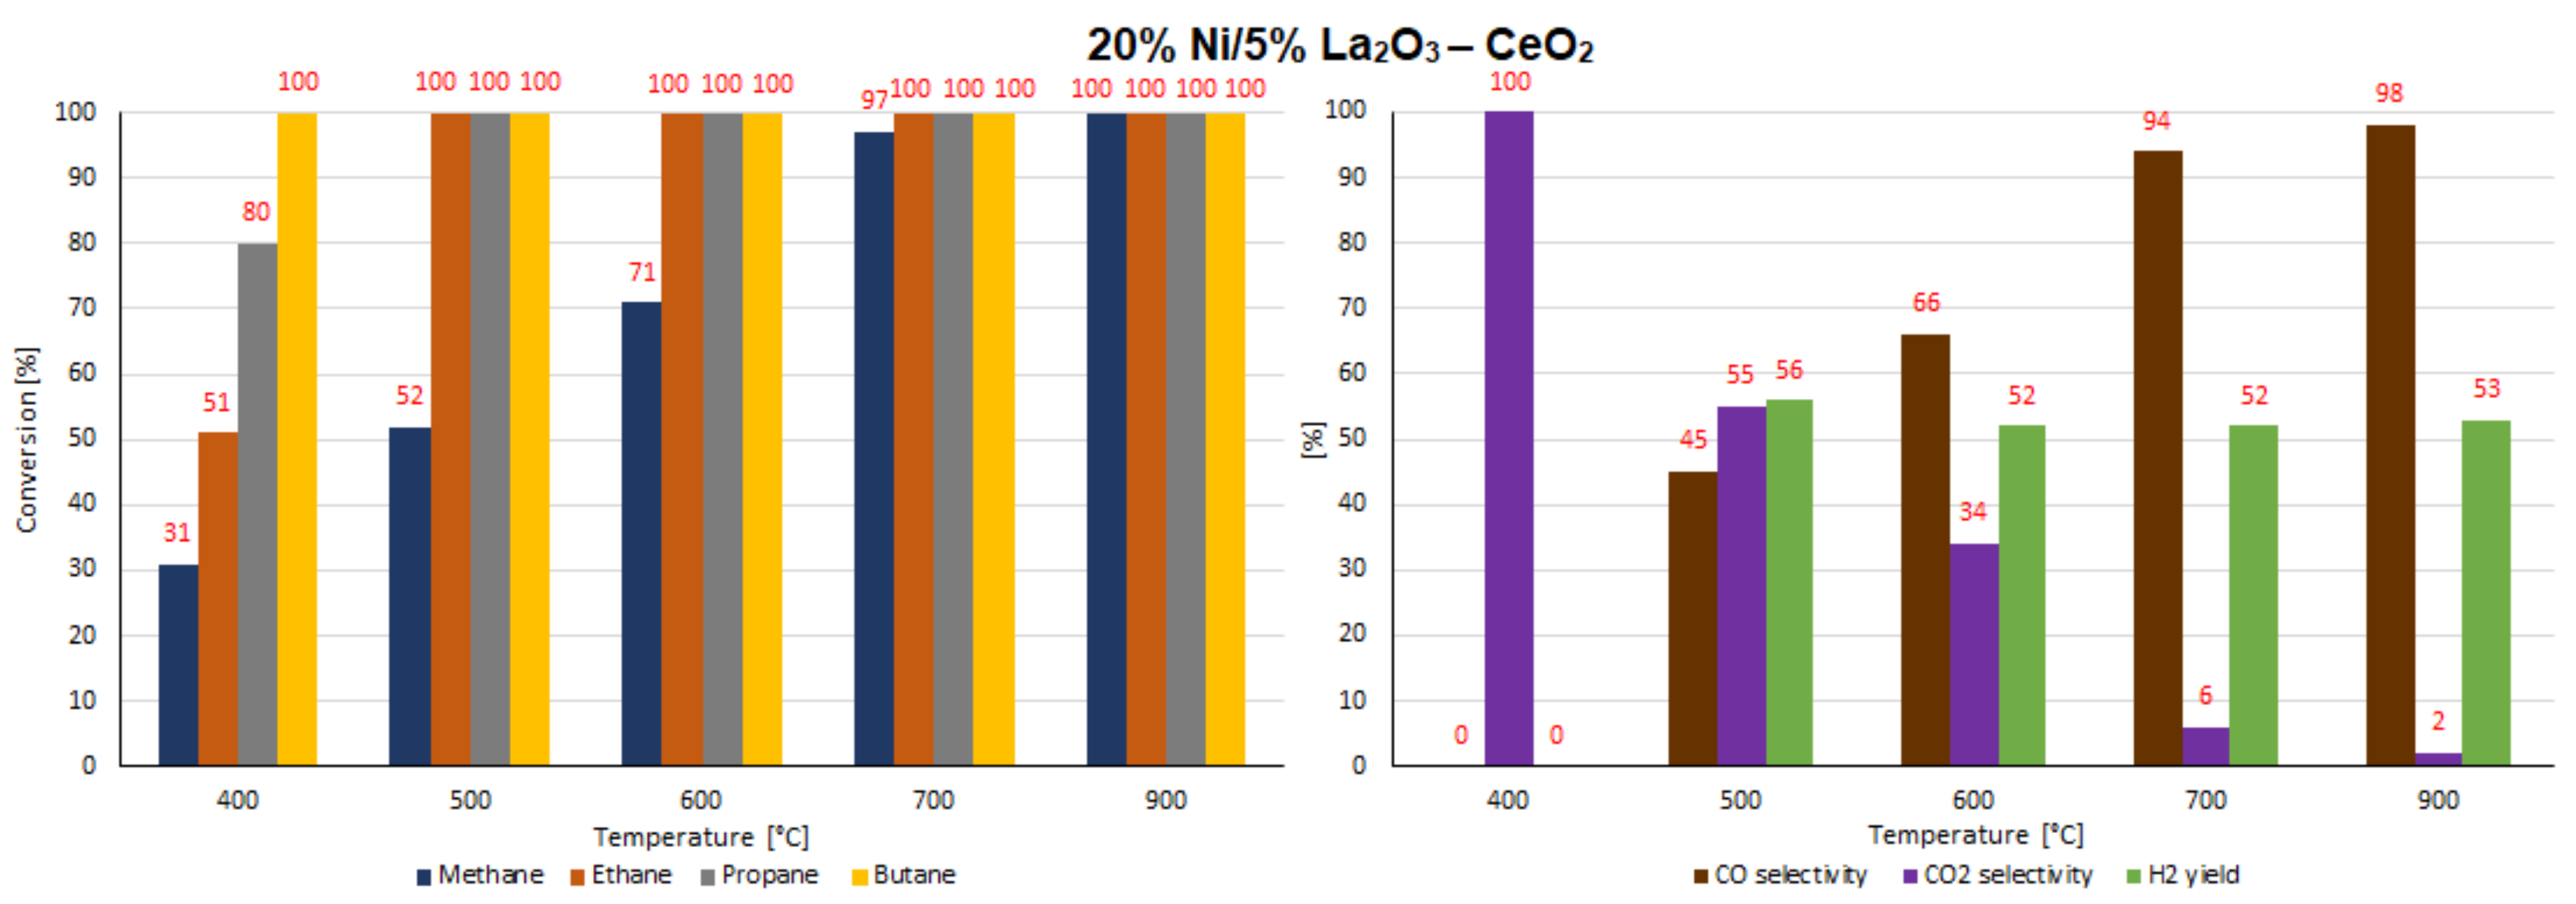
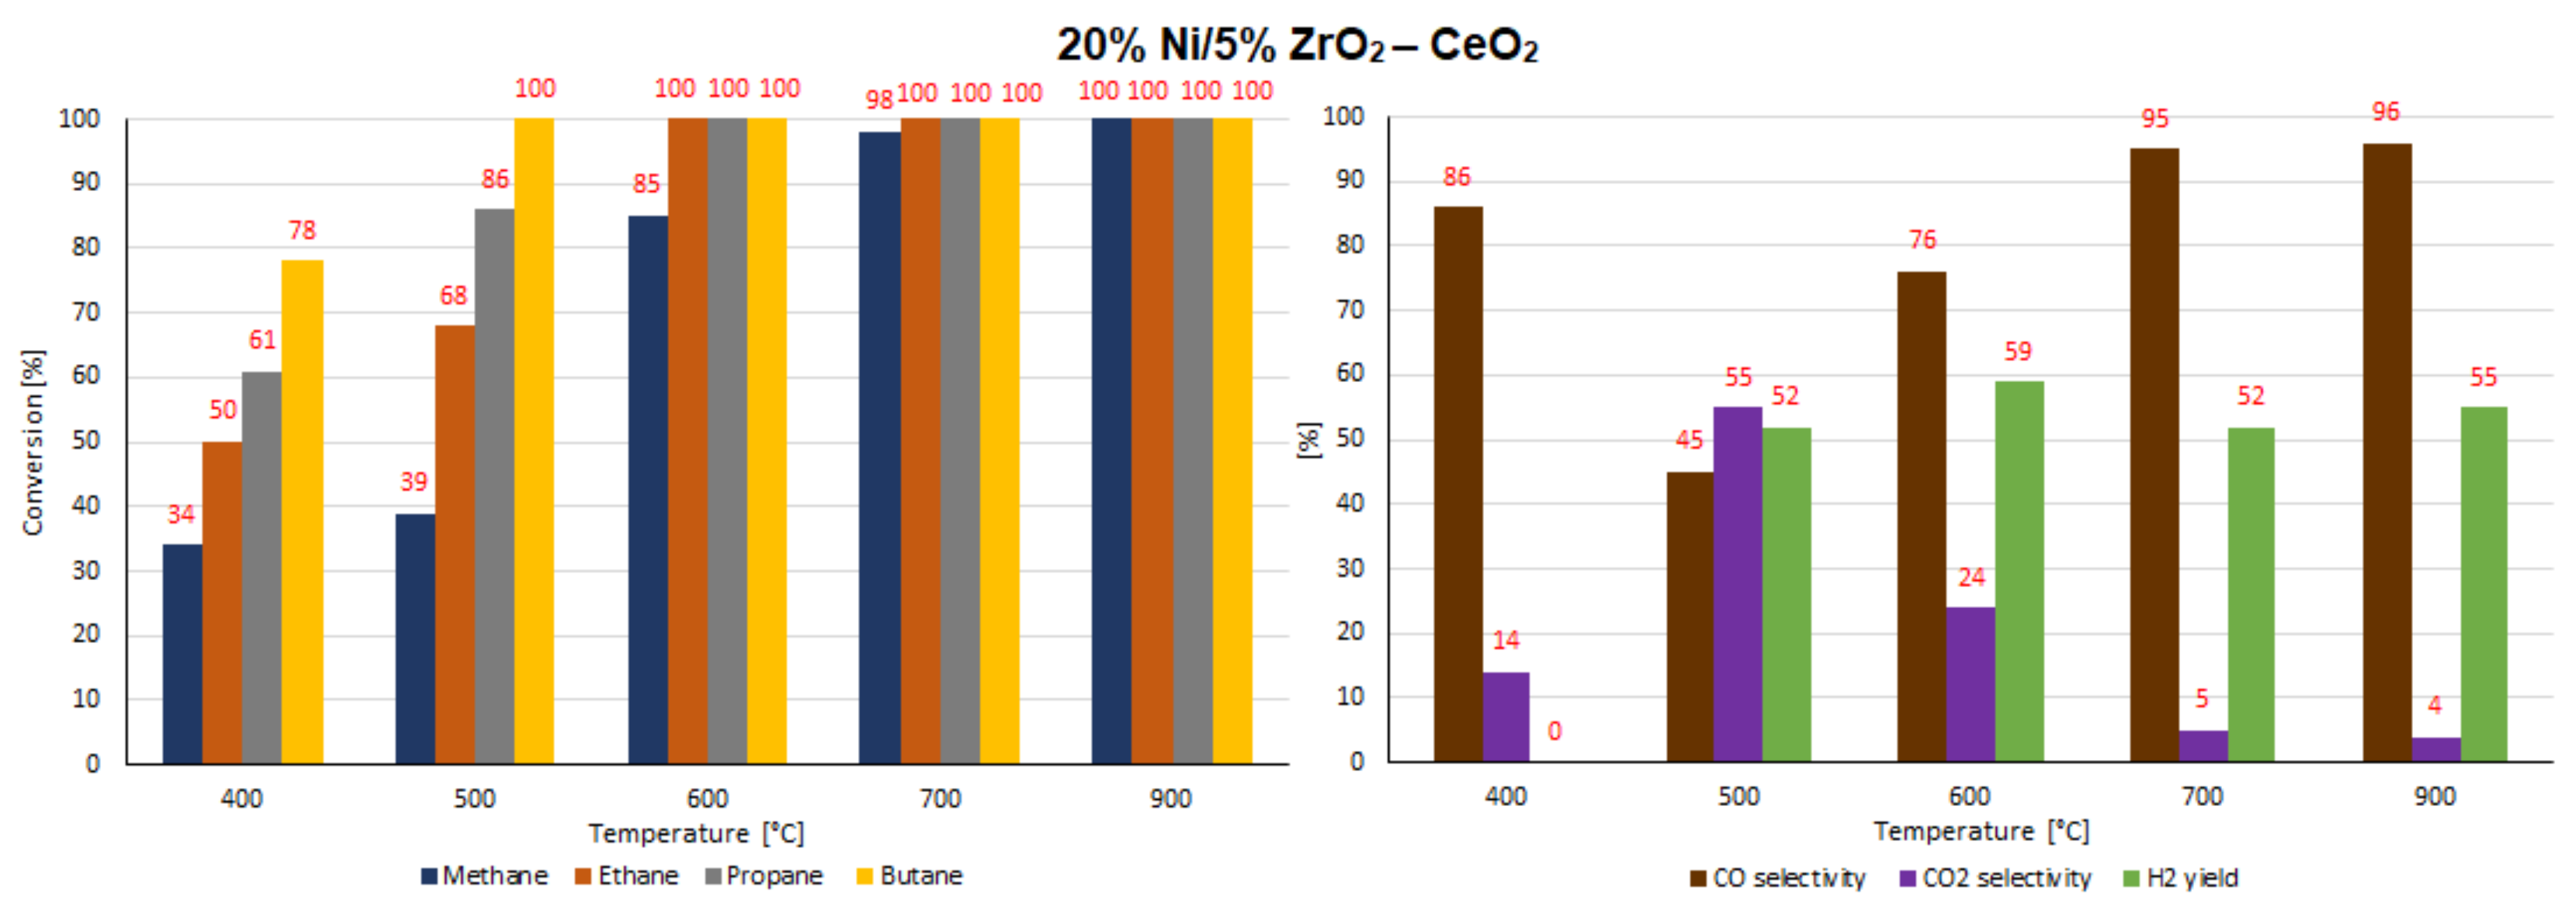
2.7. Catalytic Performance
3. Materials and Methods
3.1. Supports and Catalysts Preparation
3.2. Catalysts Characterization
3.3. Catalytic Activity and Stability Measurements
- —the moles of hydrocarbon (methane, ethane, propane and butane) at the reactor inlet;
- —the moles of hydrocarbon (methane, ethane, propane and butane) at the reactor outlet;
- —the moles of CO at the reactor outlet;
- —the moles of CO2 at the reactor outlet;
- —the moles of H2 at the reactor outlet;
- —the sum of the moles of the hydrocarbons (methane, ethane, propane and butane) at the reactor inlet;
- —the sum of the moles of the hydrocarbons (methane, ethane, propane and butane) at the reactor outlet.
4. Conclusions
Author Contributions
Funding
Institutional Review Board Statement
Informed Consent Statement
Data Availability Statement
Conflicts of Interest
References
- Madej-Lachowska, M. Badania kinetyczne procesu parowego reformingu metanolu na katalizatorze Cu/Zn/Zr/Ce/Cr (Kinetic studies on steam reforming of methanol over Cu/Zn/Zr/Ce/Cr catalyst). Przem. Chem. 2016, 1, 151–154. [Google Scholar] [CrossRef]
- Mazloomi, K.; Gomes, C. Hydrogen as an energy carrier: Prospects and challenges. Renew. Sustain. Energy Rev. 2012, 16, 3024–3033. [Google Scholar] [CrossRef]
- Mierczynski, P. Comparative studies of bimetallic Ru-Cu, Rh-Cu, Ag-Cu, Ir-Cu catalysts supported on ZnO-Al2O3, ZrO2-Al2O3 systems. Catal. Lett. 2016, 146, 1825–1837. [Google Scholar] [CrossRef]
- Mierczynski, P.; Mierczynska, A.; Maniukiewicz, W.; Maniecki, T.P.; Vasilev, K. MWCNTs as a catalyst in oxy-steam reforming of methanol. RSC Adv. 2016, 6, 81408–81413. [Google Scholar] [CrossRef]
- Deczyński, J.; ŻÓŁTowski, B. Wodór jako paliwo alternatywne do zasilania silników ze spalaniem wewnętrznym (Hydrogen as alternative fuels for powering engines with the internal burn). Studia Mater. Pol. Stowarzyszenia Zarz. Wiedza 2014, 69, 18–31. [Google Scholar]
- Bi, L.; Boulfrad, S.; Traversa, E. Reversible solid oxide fuel cells (R-SOFCs) with chemically stable proton-conducting oxides. Solid State Ion. 2015, 275, 101–105. [Google Scholar] [CrossRef]
- Cheekatamarla, P.K.; Finnerty, C. Reforming catalysts for hydrogen generation in fuel cell applications. J. Power Sources 2006, 160, 490–499. [Google Scholar] [CrossRef]
- Appleby, A. Fuel cell technology: Status and future prospects. Energy 1996, 21, 521–653. [Google Scholar] [CrossRef]
- Dutta, S. A review on production, storage of hydrogen and its utilization as an energy resource. J. Ind. Eng. Chem. 2014, 20, 1148–1156. [Google Scholar] [CrossRef]
- Mosinska, M.; Stępińska, N.; Maniukiewicz, W.; Rogowski, J.; Mierczynska-Vasilev, A.; Vasilev, K.; Szynkowska, M.I.; Mierczynski, P. Hydrogen production on Cu-Ni catalysts via the oxy-steam reforming of methanol. Catalysts 2020, 10, 273. [Google Scholar] [CrossRef] [Green Version]
- Harun, N.; Abidin, S.Z.; Osazuwa, O.; Taufiq-Yap, Y.; Azizan, M.T. Hydrogen production from glycerol dry reforming over Ag-promoted Ni/Al2O3. Int. J. Hydrog. Energy 2019, 44, 213–225. [Google Scholar] [CrossRef]
- Mierczynski, P.; Mierczynska, A.; Ciesielski, R.; Mosinska, M.; Nowosielska, M.; Czylkowska, A.; Maniukiewicz, W.; Szynkowska, M.I.; Vasilev, K. High active and selective Ni/CeO2-Al2O3 and Pd-Ni/CeO2-Al2O3 catalysts for oxy-steam reforming of methanol. Catalysts 2018, 8, 380. [Google Scholar] [CrossRef] [Green Version]
- Nikolaidis, P.; Poullikkas, A. A comparative overview of hydrogen production processes. Renew. Sustain. Energy Rev. 2017, 67, 597–611. [Google Scholar] [CrossRef]
- Chang, F.-W.; Ou, T.-C.; Roselin, L.S.; Chen, W.-S.; Lai, S.-C.; Wu, H.-M. Production of hydrogen by partial oxidation of methanol over bimetallic Au–Cu/TiO2-Fe2O3 catalysts. J. Mol. Catal. A Chem. 2009, 313, 55–64. [Google Scholar] [CrossRef]
- Rabenstein, G.; Hacker, V. Hydrogen for fuel cells from ethanol by steam-reforming, partial-oxidation and combined auto-thermal reforming: A thermodynamic analysis. J. Power Sources 2008, 185, 1293–1304. [Google Scholar] [CrossRef]
- Cubeiro, M.; Fierro, J. Partial oxidation of methanol over supported palladium catalysts. Appl. Catal. A Gen. 1998, 168, 307–322. [Google Scholar] [CrossRef]
- Mosińska, M.; Szynkowska-Jóźwik, M.I.; Mierczyński, P. Catalysts for hydrogen generation via oxy–steam reforming of methanol process. Materials 2020, 13, 5601. [Google Scholar] [CrossRef] [PubMed]
- Boudjeloud, M.; Boulahouache, A.; Rabia, C.; Salhi, N. La-doped supported Ni catalysts for steam reforming of methane. Int. J. Hydrog. Energy 2019, 44, 9906–9913. [Google Scholar] [CrossRef]
- Wang, H.; Blaylock, D.W.; Dam, A.H.; Liland, S.E.; Rout, K.R.; Zhu, Y.-A.; Green, W.H.; Holmen, A.; Chen, D. Steam methane reforming on a Ni-based bimetallic catalyst: Density functional theory and experimental studies of the catalytic consequence of surface alloying of Ni with Ag. Catal. Sci. Technol. 2017, 7, 1713–1725. [Google Scholar] [CrossRef]
- Nieva, M.A.; Villaverde, M.M.; Monzon, A.; Garetto, T.F.; Marchi, A.J. Steam-methane reforming at low temperature on nickel-based catalysts. Chem. Eng. J. 2014, 235, 158–166. [Google Scholar] [CrossRef]
- LeValley, T.L.; Richard, A.; Fan, M. The progress in water gas shift and steam reforming hydrogen production technologies—A review. Int. J. Hydrog. Energy 2014, 39, 16983–17000. [Google Scholar] [CrossRef]
- Neiva, A.; Gama, A. A study on the characteristics of the reforming of methane: A review. Braz. J. Pet. Gas 2010, 4. [Google Scholar] [CrossRef] [Green Version]
- Al-Ubaid, A.; Wolf, E. Steam reforming of methane on reduced non-stoichiometric nickel aluminate catalysts. Appl. Catal. 1988, 40, 73–85. [Google Scholar] [CrossRef]
- Laosiripojana, N.; Assabumrungrat, S. Methane steam reforming over Ni/Ce-ZrO2 catalyst: Influences of Ce-ZrO2 support on reactivity, resistance toward carbon formation, and intrinsic reaction kinetics. Appl. Catal. A Gen. 2005, 290, 200–211. [Google Scholar] [CrossRef]
- De Lima, S.M.; da Cruz, I.O.; Jacobs, G.; Davis, B.H.; Mattos, L.V.; Noronha, F.B. Steam reforming, partial oxidation, and oxidative steam reforming of ethanol over Pt/CeZrO2 catalyst. J. Catal. 2008, 257, 356–368. [Google Scholar] [CrossRef]
- Mosinska, M.; Szynkowska, M.I.; Mierczynski, P. Oxy-steam reforming of natural gas on Ni catalysts—A minireview. Catalysts 2020, 10, 896. [Google Scholar] [CrossRef]
- Mierczynski, P.; Stępińska, N.; Mosinska, M.; Chalupka, K.; Albinska, J.; Maniukiewicz, W.; Rogowski, J.; Nowosielska, M.; Szynkowska, M.I. Hydrogen production via the oxy-steam reforming of LNG or methane on Ni catalysts. Catalysts 2020, 10, 346. [Google Scholar] [CrossRef] [Green Version]
- Mosinska, M.; Stepinska, N.; Chalupka, K.; Maniukiewicz, W.; Szynkowska, M.I.; Mierczynski, P. Effect of Ag-addition on the catalytic and physicochemical properties of Ni/ZrO2 catalyst in oxy-steam reforming of CH4 and LNG processes. Catalysts 2020, 10, 855. [Google Scholar] [CrossRef]
- Park, S.; Yoo, J.; Han, S.J.; Song, J.H.; Lee, E.J.; Song, I.K. Steam reforming of liquefied natural gas (LNG) for hydrogen production over nickel-boron-alumina xerogel catalyst. Int. J. Hydrog. Energy 2017, 42, 15096–15106. [Google Scholar] [CrossRef]
- Bang, Y.; Park, S.; Han, S.J.; Yoo, J.; Song, J.H.; Choi, J.H.; Kang, K.H.; Song, I.K. Hydrogen production by steam reforming of liquefied natural gas (LNG) over mesoporous Ni/Al2O3 catalyst prepared by an EDTA-assisted impregnation method. Appl. Catal. B Environ. 2016, 180, 179–188. [Google Scholar] [CrossRef]
- Osorio-Tejada, J.; Llera, E.; Scarpellini, S. LNG: An alternative fuel for road freight transport in Europe. WIT Trans. Built Environ. 2015, 235–246. [Google Scholar] [CrossRef] [Green Version]
- Bernatik, A.; Šenovský, P.; Pitt, M. LNG as a potential alternative fuel—Safety and security of storage facilities. J. Loss Prev. Process. Ind. 2011, 24, 19–24. [Google Scholar] [CrossRef] [Green Version]
- Jiménez-Gómez, C.P.; Cecilia, J.A.; Márquez-Rodríguez, I.; Moreno-Tost, R.; Santamaría-González, J.; Mérida-Robles, J.; Maireles-Torres, P. Gas-phase hydrogenation of furfural over Cu/CeO2 catalysts. Catal. Today 2017, 279, 327–338. [Google Scholar] [CrossRef]
- Papavasiliou, J.; Avgouropoulos, G.; Ioannides, T. Production of hydrogen via combined steam reforming of methanol over CuO-CeO2 catalysts. Catal. Commun. 2004, 5, 231–235. [Google Scholar] [CrossRef]
- Ouyang, B.; Tan, W.; Liu, B. Morphology effect of nanostructure ceria on the Cu/CeO2 catalysts for synthesis of methanol from CO2 hydrogenation. Catal. Commun. 2017, 95, 36–39. [Google Scholar] [CrossRef]
- Udani, P.; Gunawardana, P.; Lee, H.C.; Kim, D.H. Steam reforming and oxidative steam reforming of methanol over CuO-CeO2 catalysts. Int. J. Hydrog. Energy 2009, 34, 7648–7655. [Google Scholar] [CrossRef]
- Men, Y.; Gnaser, H.; Zapf, R.; Hessel, V.; Ziegler, C. Parallel screening of Cu/CeO2/γ-Al2O3 catalysts for steam reforming of methanol in a 10-channel micro-structured reactor. Catal. Commun. 2004, 5, 671–675. [Google Scholar] [CrossRef]
- Men, Y.; Gnaser, H.; Ziegler, C.; Zapf, R.; Hessel, V.; Kolb, G. Characterization of Cu/CeO2/γ-Al2O3 thin film catalysts by thermal desorption spectroscopy. Catal. Lett. 2005, 105, 35–40. [Google Scholar] [CrossRef]
- Liu, Y.; Hayakawa, T.; Suzuki, K.; Hamakawa, S.; Tsunoda, T.; Ishii, T.; Kumagai, M. Highly active copper/ceria catalysts for steam reforming of methanol. Appl. Catal. A Gen. 2002, 223, 137–145. [Google Scholar] [CrossRef]
- Mierczynski, P.; Mosinska, M.; Zakrzewski, M.; Dawid, B.; Ciesielski, R.; Maniecki, T.; Maniukiewicz, W. Influence of the Zn-Al binary oxide composition on the physicochemical and catalytic properties of Ni catalysts in the oxy-steam reforming of methanol. React. Kinet. Mech. Catal. 2017, 121, 453–472. [Google Scholar] [CrossRef] [Green Version]
- Mierczynski, P.; Mosinska, M.; Maniukiewicz, W.; Vasilev, K.; Szynkowska, M.I. Novel Rh(Pd)-Cu(Ni) supported catalysts for oxy-steam reforming of methanol. Arab. J. Chem. 2020, 13, 3183–3195. [Google Scholar] [CrossRef]
- Charisiou, N.; Tzounis, L.; Sebastian, V.; Hinder, S.; Baker, M.; Polychronopoulou, K.; Goula, M. Investigating the correlation between deactivation and the carbon deposited on the surface of Ni/Al2O3 and Ni/La2O3-Al2O3 catalysts during the biogas reforming reaction. Appl. Surf. Sci. 2019, 474, 42–56. [Google Scholar] [CrossRef] [Green Version]
- Bachiller-Baeza, B.; Mateos-Pedrero, C.; Soria, M.; Guerrero-Ruiz, A.; Rodemerck, U.; Rodríguez-Ramos, I. Transient studies of low-temperature dry reforming of methane over Ni-CaO/ZrO2-La2O3. Appl. Catal. B Environ. 2013, 129, 450–459. [Google Scholar] [CrossRef]
- Pantaleo, G.; La Parola, V.; Deganello, F.; Calatozzo, P.; Bal, R.; Venezia, A.M. Synthesis and support composition effects on CH4 partial oxidation over Ni–CeLa oxides. Appl. Catal. B Environ. 2015, 164, 135–143. [Google Scholar] [CrossRef]
- Mierczynski, P.; Mosinska, M.; Stepinska, N.; Chalupka, K.; Nowosielska, M.; Maniukiewicz, W.; Rogowski, J.; Goswami, N.; Vasilev, K.; Szynkowska, M.I. Effect of the support composition on catalytic and physicochemical properties of Ni catalysts in oxy-steam reforming of methane. Catal. Today 2021, 364, 46–60. [Google Scholar] [CrossRef]
- Cychosz, K.A.; Thommes, M. Progress in the physisorption characterization of nanoporous gas storage materials. Engineering 2018, 4, 559–566. [Google Scholar] [CrossRef]
- Sing, K.S.; Williams, R.T. Physisorption hysteresis loops and the characterization of nanoporous materials. Adsorpt. Sci. Technol. 2004, 22, 773–782. [Google Scholar] [CrossRef]
- Yu, Y.; Gan, Y.-M.; Huang, C.; Lu, Z.-H.; Wang, X.; Zhang, R.; Feng, G. Ni/La2O3 and Ni/MgO-La2O3 catalysts for the decomposition of NH3 into hydrogen. Int. J. Hydrog. Energy 2020, 45, 16528–16539. [Google Scholar] [CrossRef]
- Füglein, E.; Walter, D. Thermal analysis of lanthanum hydroxide. J. Therm. Anal. Calorim. 2012, 110, 199–202. [Google Scholar] [CrossRef]
- Fleming, P.; Farrell, R.A.; Holmes, J.; Morris, M.A. The rapid formation of La(OH)3 from La2O3 powders on exposure to water vapor. J. Am. Ceram. Soc. 2010, 93, 1187–1194. [Google Scholar] [CrossRef]
- Valderrama, G.; Kiennemann, A.; Goldwasser, M. Dry reforming of CH4 over solid solutions of LaNi1−xCoxO3. Catal. Today 2008, 133–135, 142–148. [Google Scholar] [CrossRef]
- Kambolis, A.; Matralis, H.; Trovarelli, A.; Papadopoulou, C. Ni/CeO2-ZrO2 catalysts for the dry reforming of methane. Appl. Catal. A Gen. 2010, 377, 16–26. [Google Scholar] [CrossRef]
- Oemar, U.; Ang, M.L.; Hidajat, K.; Kawi, S. Enhancing performance of Ni/La2O3 catalyst by Sr-modification for steam reforming of toluene as model compound of biomass tar. RSC Adv. 2015, 5, 17834–17842. [Google Scholar] [CrossRef]
- Oemar, U.; Hidajat, K.; Kawi, S. Role of catalyst support over PdO-NiO catalysts on catalyst activity and stability for oxy-CO2 reforming of methane. Appl. Catal. A Gen. 2011, 402, 176–187. [Google Scholar] [CrossRef]
- Barroso-Quiroga, M.M.; Castro-Luna, A.E. Catalytic activity and effect of modifiers on Ni-based catalysts for the dry reforming of methane. Int. J. Hydrog. Energy 2010, 35, 6052–6056. [Google Scholar] [CrossRef]
- Araiza, D.G.; González-Vigi, F.; Gómez-Cortés, A.; Arenas-Alatorre, J.; Díaz, G. Pt-based catalysts in the dry reforming of methane: Effect of support and metal precursor on the catalytic stability. J. Mex. Chem. Soc. 2021, 65. [Google Scholar] [CrossRef]
- Tang, K.; Liu, W.; Li, J.; Guo, J.; Zhang, J.; Wang, S.; Niu, S.; Yang, Y. The effect of exposed facets of ceria to the nickel species in nickel-ceria catalysts and their performance in a NO + CO reaction. ACS Appl. Mater. Interfaces 2015, 7, 26839–26849. [Google Scholar] [CrossRef] [PubMed]
- Romero-Núñez, A.; Díaz, G. High oxygen storage capacity and enhanced catalytic performance of NiO/NixCe1-xO2−δ nanorods: Synergy between Ni-doping and 1D morphology. RSC Adv. 2015, 5, 54571–54579. [Google Scholar] [CrossRef]
- Greluk, M.; Gac, W.; Rotko, M.; Słowik, G.; Turczyniak-Surdacka, S. Co/CeO2 and Ni/CeO2 catalysts for ethanol steam reforming: Effect of the cobalt/nickel dispersion on catalysts properties. J. Catal. 2021, 393, 159–178. [Google Scholar] [CrossRef]
- Greluk, M.; Rotko, M.; Turczyniak-Surdacka, S. Comparison of catalytic performance and coking resistant behaviors of cobalt- and nickel-based catalyst with different Co/Ce and Ni/Ce molar ratio under SRE conditions. Appl. Catal. A Gen. 2020, 590, 117334. [Google Scholar] [CrossRef]
- Manfro, R.L.; Ribeiro, N.F.; Souza, M.M. Production of hydrogen from steam reforming of glycerol using nickel catalysts supported on Al2O3, CeO2 and ZrO2. Catal. Sustain. Energy 2013, 1, 60–70. [Google Scholar] [CrossRef]
- Shah, N.; Panjala, A.D.; Huffman, G.P. Hydrogen production by catalytic decomposition of methane. Energy Fuels 2001, 15, 1528–1534. [Google Scholar] [CrossRef]
- Khani, Y.; Shariatinia, Z.; Bahadoran, F. High catalytic activity and stability of ZnLaAlO4 supported Ni, Pt and Ru nanocatalysts applied in the dry, steam and combined dry-steam reforming of methane. Chem. Eng. J. 2016, 299, 353–366. [Google Scholar] [CrossRef]


| Materials | BET Surface Area (m2/g) | Monolayer Capacity (cm3/g) | Average Pore Radius (nm) |
|---|---|---|---|
| CeO2 | 20.08 | 0.10 | 9.76 |
| 5% ZrO2–CeO2 | 30.53 | 0.10 | 5.41 |
| 5% La2O3–CeO2 | 19.39 | 0.09 | 6.89 |
| La2O3 | 0.44 | 0.002 | 19.93 |
| 5% CeO2–La2O3 | 4.91 | 0.03 | 14.82 |
| 5% ZrO2–La2O3 | 3.27 | 0.02 | 16.53 |
| 20% Ni/CeO2 | 16.69 | 0.09 | 9.98 |
| 20% Ni/5% ZrO2–CeO2 | 15.93 | 0.08 | 7.92 |
| 20% Ni/5% La2O3–CeO2 | 16.98 | 0.09 | 10.36 |
| 20% Ni/La2O3 | 4.28 | 0.03 | 12.70 |
| 20% Ni/5% CeO2–La2O3 | 12.07 | 0.06 | 9.57 |
| 20% Ni/5% ZrO2–La2O3 | 6.74 | 0.04 | 11.40 |
| Total Acidity (mmol/g) | Weak Centers (mmol/g) | Medium Centers (mmol/g) | Strong Centers (mmol/g) | |
|---|---|---|---|---|
| 180 °C–600 °C | 180 °C–300 °C | 300 °C–450 °C | 450 °C–600 °C | |
| 20% Ni/CeO2 | 0.30 | 0.22 | 0.05 | 0.03 |
| 20% Ni/5% ZrO2–CeO2 | 0.47 | 0.13 | 0.21 | 0.13 |
| 20% Ni/5% La2O3–CeO2 | 0.22 | 0.03 | 0.07 | 0.12 |
| 20% Ni/La2O3 | 0.35 | 0.02 | 0.21 | 0.12 |
| 20% Ni/5% CeO2–La2O3 | 1.69 | 0.01 | 0.31 | 1.37 |
| 20% Ni/5% ZrO2–La2O3 | 0.70 | 0.05 | 0.30 | 0.35 |
| Catalysts | The Size of NiO Crystallites (nm) | The Size of Metallic Ni Crystallites (nm) |
|---|---|---|
| 20% Ni/CeO2 | 28 | 37 |
| 20% Ni/5% ZrO2–CeO2 | 59 | 153 |
| 20% Ni/5% La2O3–CeO2 | 26 | 47 |
| 20% Ni/La2O3 | 5 | 67 |
| 20% Ni/5% CeO2–La2O3 | 6 | 29 |
| 20% Ni/5% ZrO2–La2O3 | 4 | 41 |
| Catalysts | Peak Contribution to the Overall TPR Peak Area (%) | ||||
|---|---|---|---|---|---|
| I-Peak (Tmax) | II-Peak (Tmax) | III-Peak (Tmax) | IV-Peak (Tmax) | V-Peak (Tmax) | |
| 20% Ni/CeO2 | 0.11 (245 °C) | 0.75 (365 °C) | 0.03 (465 °C) | - | 0.11 (825 °C) |
| 20% Ni/5% ZrO2–CeO2 | 0.11 (230 °C) | 0.63 (340 °C) | 0.05 (400 °C) | - | 0.21 (830 °C) |
| 20% Ni/5% La2O3–CeO2 | 0.08 (230 °C) | 0.09 (310 °C) | 0.42 (320 °C) | 0.30 (500 °C) | 0.11 (800 °C) |
| 20% Ni/La2O3 | - | 0.35 (400 °C) | 0.62 (410 °C) | - | 0.03 (850 °C) |
| 20% Ni/5% CeO2–La2O3 | - | 0.71 (350 °C) | 0.17 (385 °C) | 0.09 (575 °C) | 0.03 (810 °C) |
| 20% Ni/5% ZrO2–La2O3 | - | 0.83 (360 °C) | 0.15 (390 °C) | - | 0.02 (780 °C) |
| Catalysts | Temp (°C) | Methane Conversion (%) | Ethane Conversion (%) | Propane Conversion (%) | Butane Conversion (%) |
|---|---|---|---|---|---|
| 20% Ni/CeO2 | 400 | 37 | 47 | 72 | 92 |
| 500 | 39 | 70 | 90 | 100 | |
| 600 | 77 | 100 | 100 | 100 | |
| 700 | 98 | 100 | 100 | 100 | |
| 900 | 100 | 100 | 100 | 100 | |
| 20% Ni/5% ZrO2–CeO2 | 400 | 34 | 50 | 61 | 78 |
| 500 | 39 | 68 | 86 | 100 | |
| 600 | 85 | 100 | 100 | 100 | |
| 700 | 98 | 100 | 100 | 100 | |
| 900 | 100 | 100 | 100 | 100 | |
| 20% Ni/5% La2O3–CeO2 | 400 | 31 | 51 | 80 | 100 |
| 500 | 52 | 100 | 100 | 100 | |
| 600 | 71 | 100 | 100 | 100 | |
| 700 | 97 | 100 | 100 | 100 | |
| 900 | 100 | 100 | 100 | 100 | |
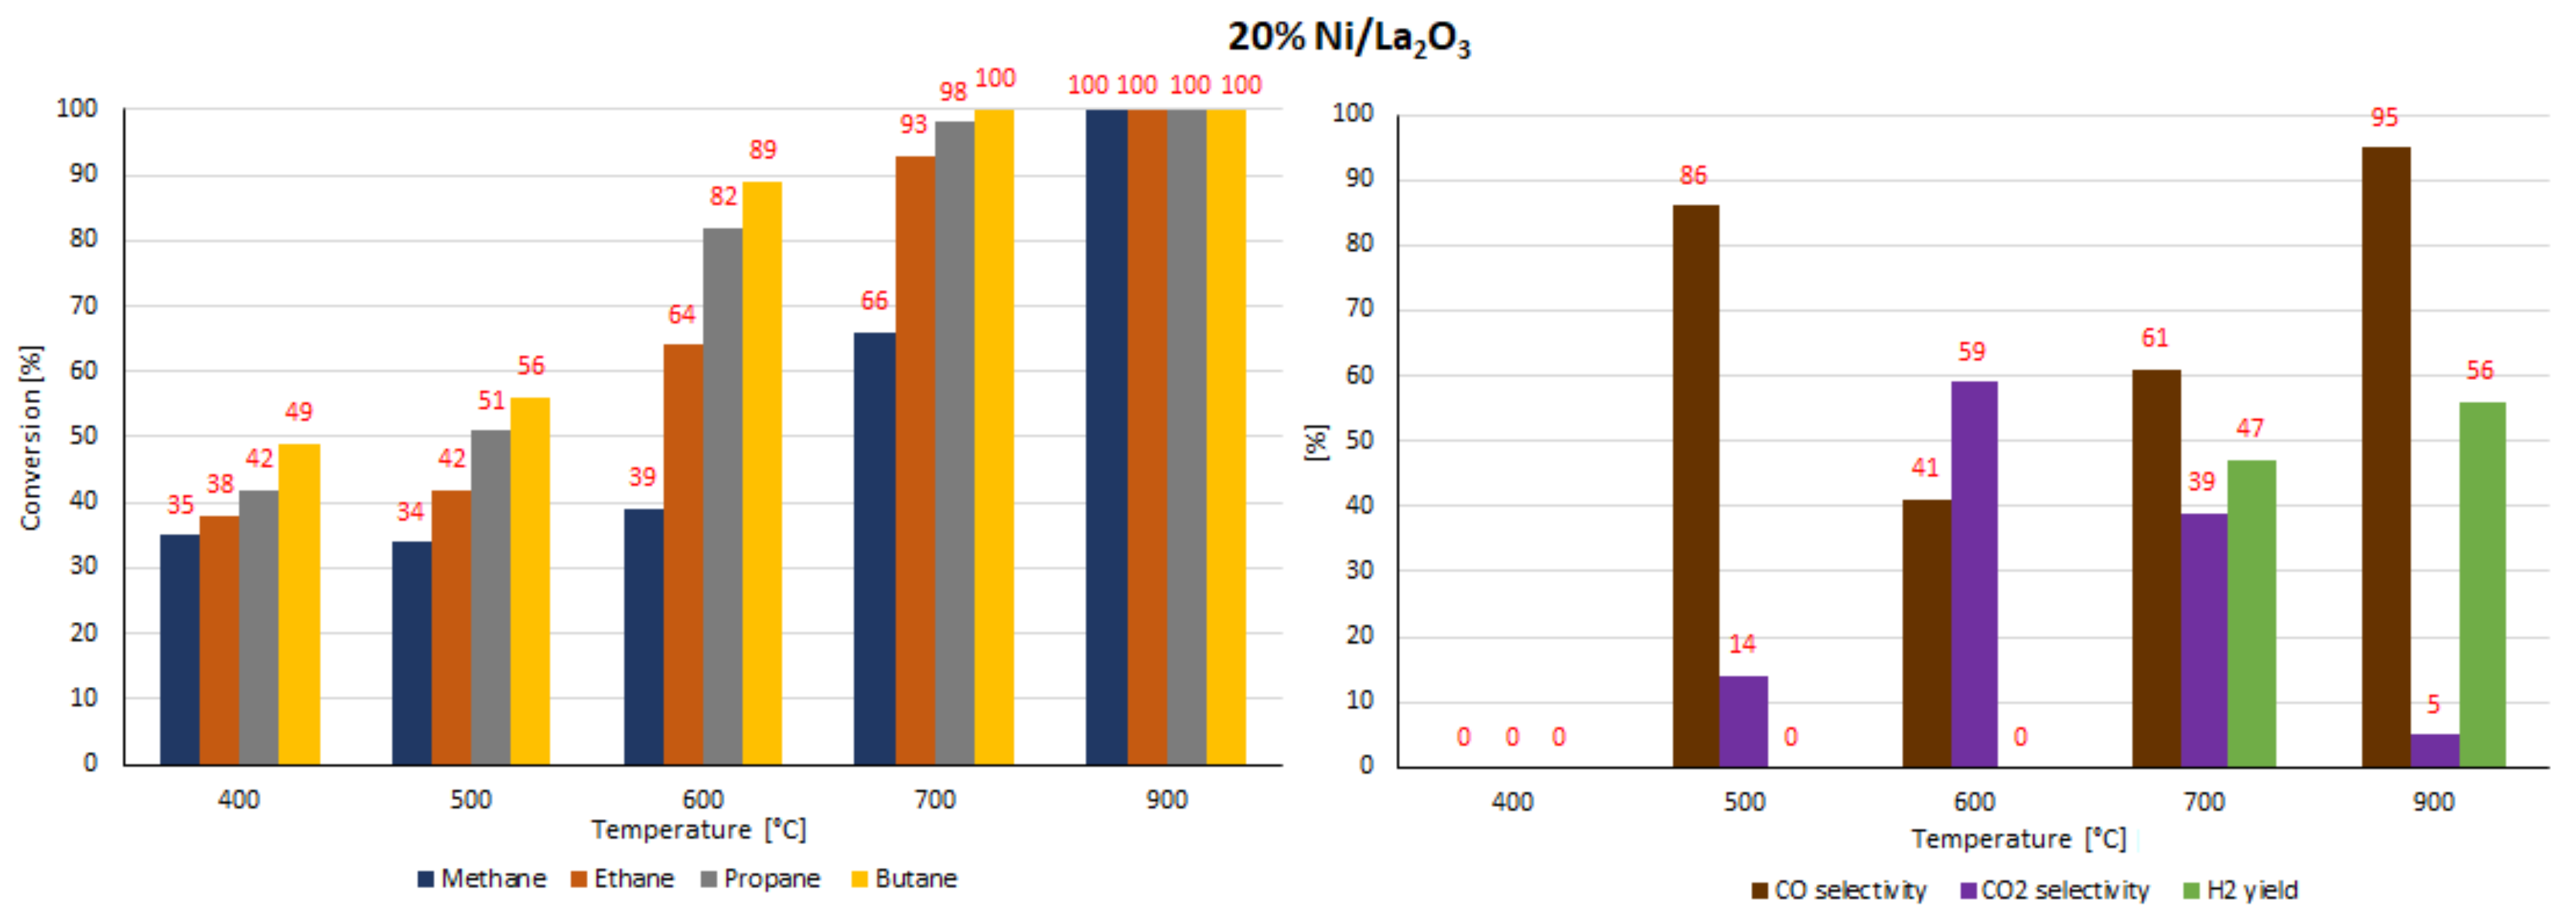
| 20% Ni/La2O3 | 400 | 35 | 38 | 42 | 49 |
| 500 | 34 | 42 | 51 | 56 | |
| 600 | 39 | 64 | 82 | 89 | |
| 700 | 66 | 93 | 98 | 100 | |
| 900 | 100 | 100 | 100 | 100 | |
| 20% Ni/5% CeO2–La2O3 | 400 | 36 | 42 | 48 | 55 |
| 500 | 36 | 50 | 66 | 79 | |
| 600 | 42 | 68 | 84 | 94 | |
| 700 | 44 | 62 | 79 | 88 | |
| 900 | 100 | 100 | 100 | 100 | |
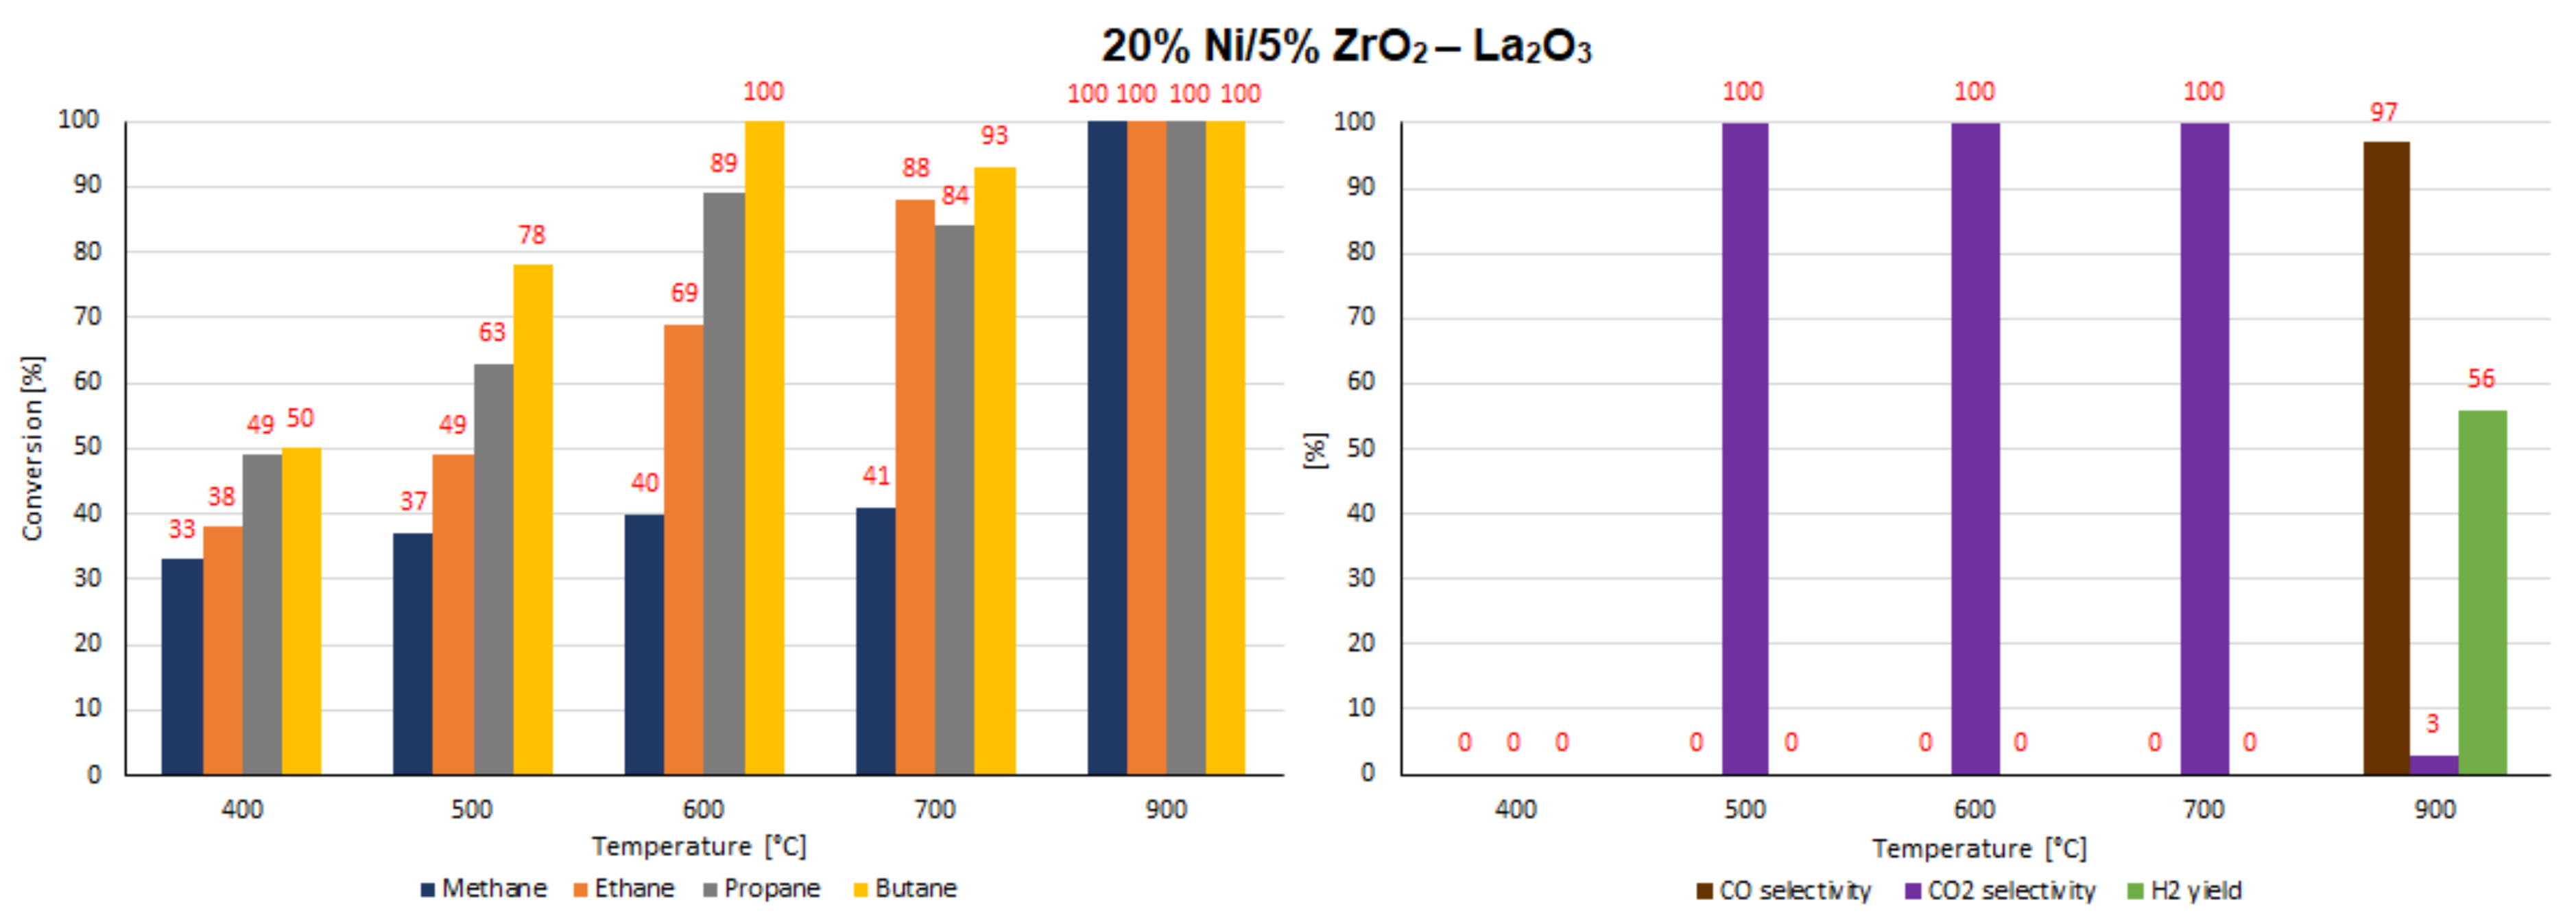
| 20% Ni/5% ZrO2–La2O3 | 400 | 33 | 38 | 49 | 50 |
| 500 | 37 | 49 | 63 | 78 | |
| 600 | 40 | 69 | 89 | 100 | |
| 700 | 41 | 88 | 84 | 93 | |
| 900 | 100 | 100 | 100 | 100 |
| Catalysts | Temp (°C) | CO Selectivity (%) | CO2 Selectivity (%) | H2 Yield (%) |
|---|---|---|---|---|
| 20% Ni/CeO2 | 400 | 0 | 100 | 0 |
| 500 | 0 | 100 | 0 | |
| 600 | 69 | 31 | 57 | |
| 700 | 91 | 9 | 55 | |
| 900 | 97 | 3 | 57 | |
| 20% Ni/5% ZrO2–CeO2 | 400 | 86 | 14 | 0 |
| 500 | 45 | 55 | 52 | |
| 600 | 76 | 24 | 59 | |
| 700 | 95 | 5 | 52 | |
| 900 | 96 | 4 | 55 | |
| 20% Ni/5% La2O3–CeO2 | 400 | 0 | 100 | 0 |
| 500 | 45 | 55 | 56 | |
| 600 | 66 | 34 | 52 | |
| 700 | 94 | 6 | 52 | |
| 900 | 98 | 2 | 53 | |
| 20% Ni/La2O3 | 400 | 0 | 100 | 0 |
| 500 | 86 | 14 | 0 | |
| 600 | 41 | 59 | 0 | |
| 700 | 61 | 39 | 47 | |
| 900 | 95 | 5 | 56 | |
| 20% Ni/5% CeO2–La2O3 | 400 | 0 | 100 | 0 |
| 500 | 0 | 100 | 0 | |
| 600 | 0 | 100 | 0 | |
| 700 | 0 | 100 | 5 | |
| 900 | 96 | 4 | 54 | |
| 20% Ni/5% ZrO2–La2O3 | 400 | 0 | 100 | 0 |
| 500 | 0 | 100 | 0 | |
| 600 | 0 | 100 | 0 | |
| 700 | 0 | 100 | 0 | |
| 900 | 97 | 3 | 56 |
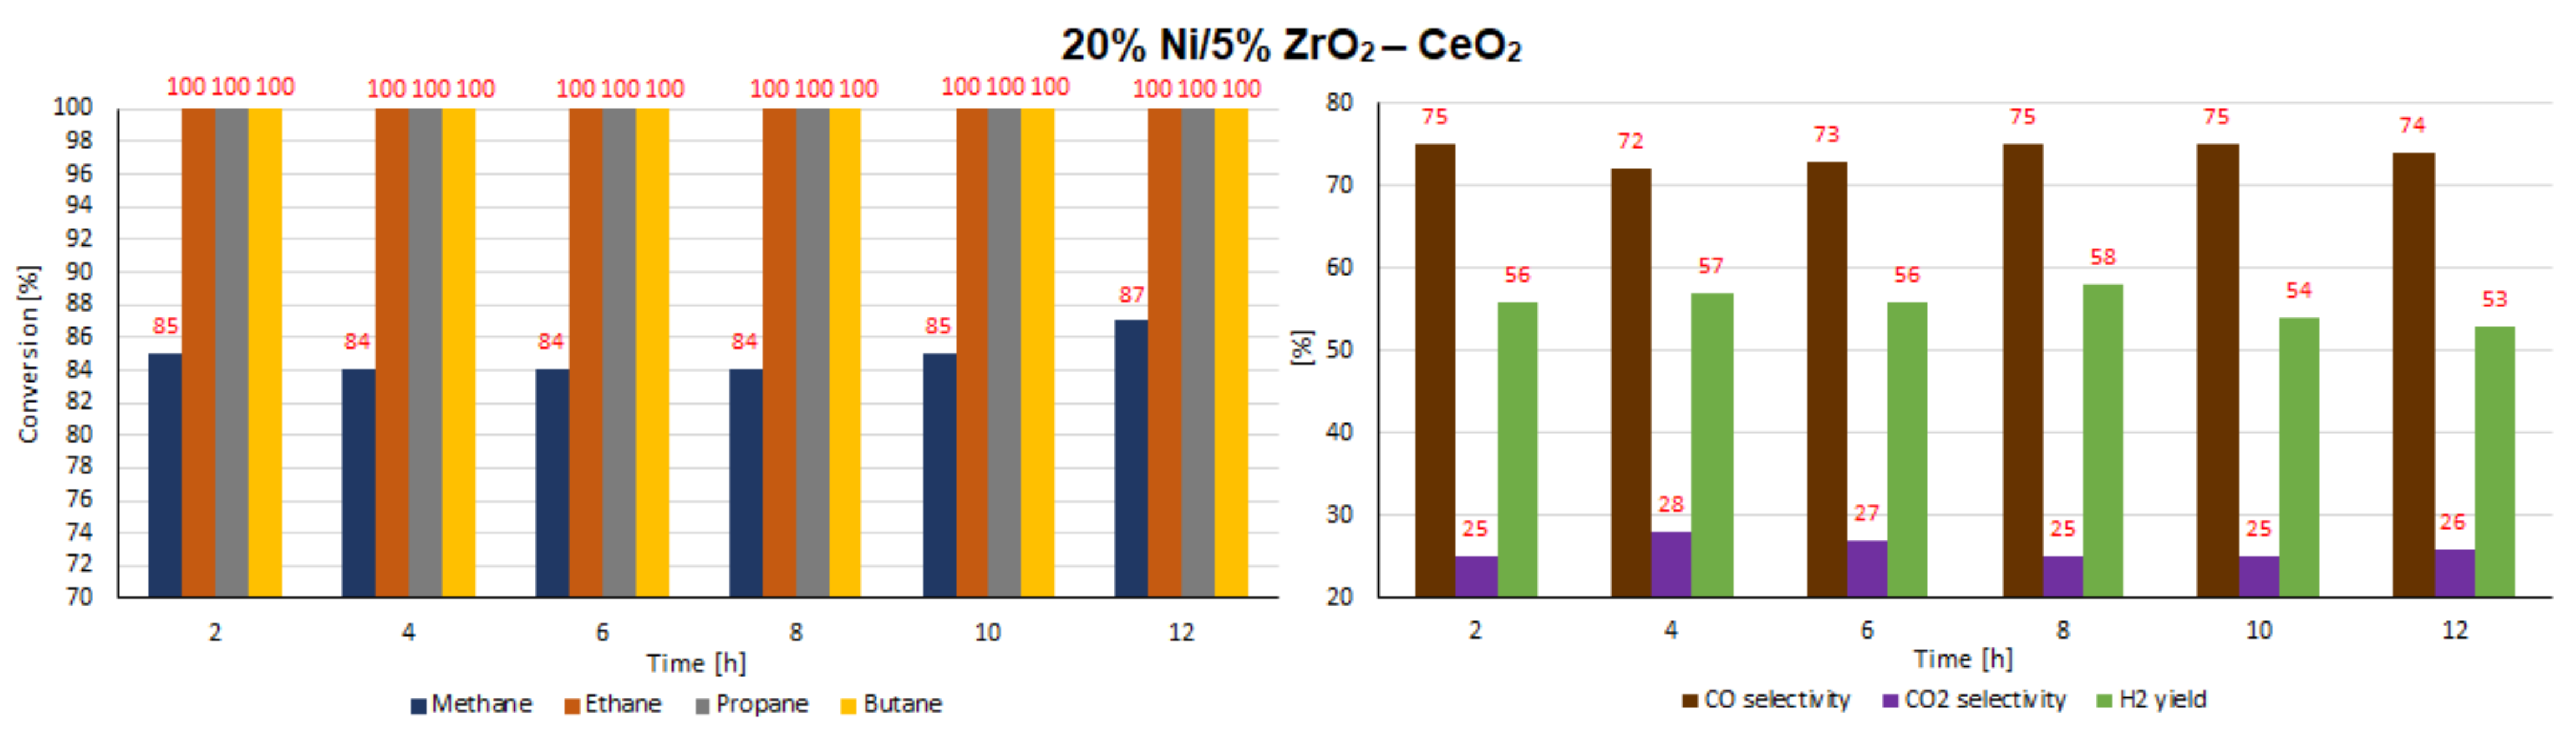
| Catalysts | Time (h) | Methane Conversion (%) | Ethane Conversion (%) | Propane Conversion (%) | Butane Conversion (%) |
|---|---|---|---|---|---|
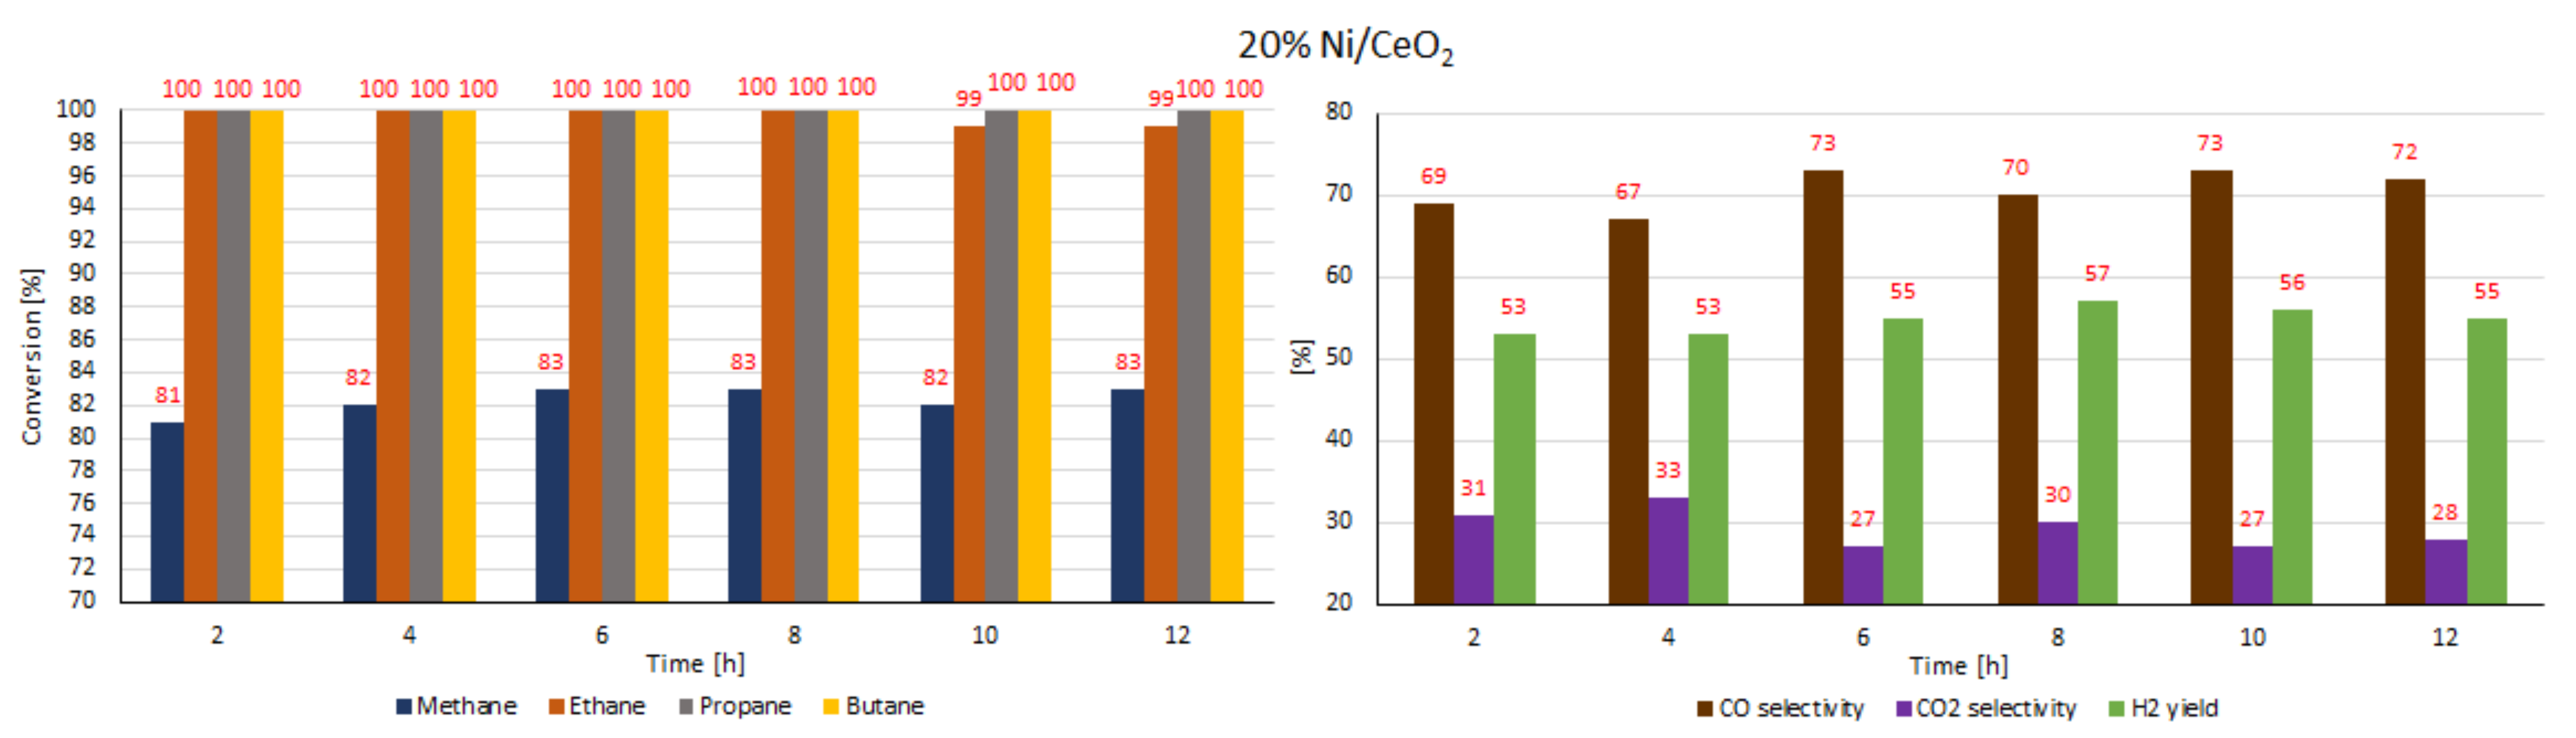
| 20% Ni/CeO2 | 2 | 81 | 100 | 100 | 100 |
| 4 | 82 | 100 | 100 | 100 | |
| 6 | 83 | 100 | 100 | 100 | |
| 8 | 83 | 100 | 100 | 100 | |
| 10 | 82 | 99 | 100 | 100 | |
| 12 | 83 | 99 | 100 | 100 | |
| 20% Ni/5% ZrO2–CeO2 | 2 | 85 | 100 | 100 | 100 |
| 4 | 84 | 100 | 100 | 100 | |
| 6 | 84 | 100 | 100 | 100 | |
| 8 | 84 | 100 | 100 | 100 | |
| 10 | 85 | 100 | 100 | 100 | |
| 12 | 87 | 100 | 100 | 100 | |
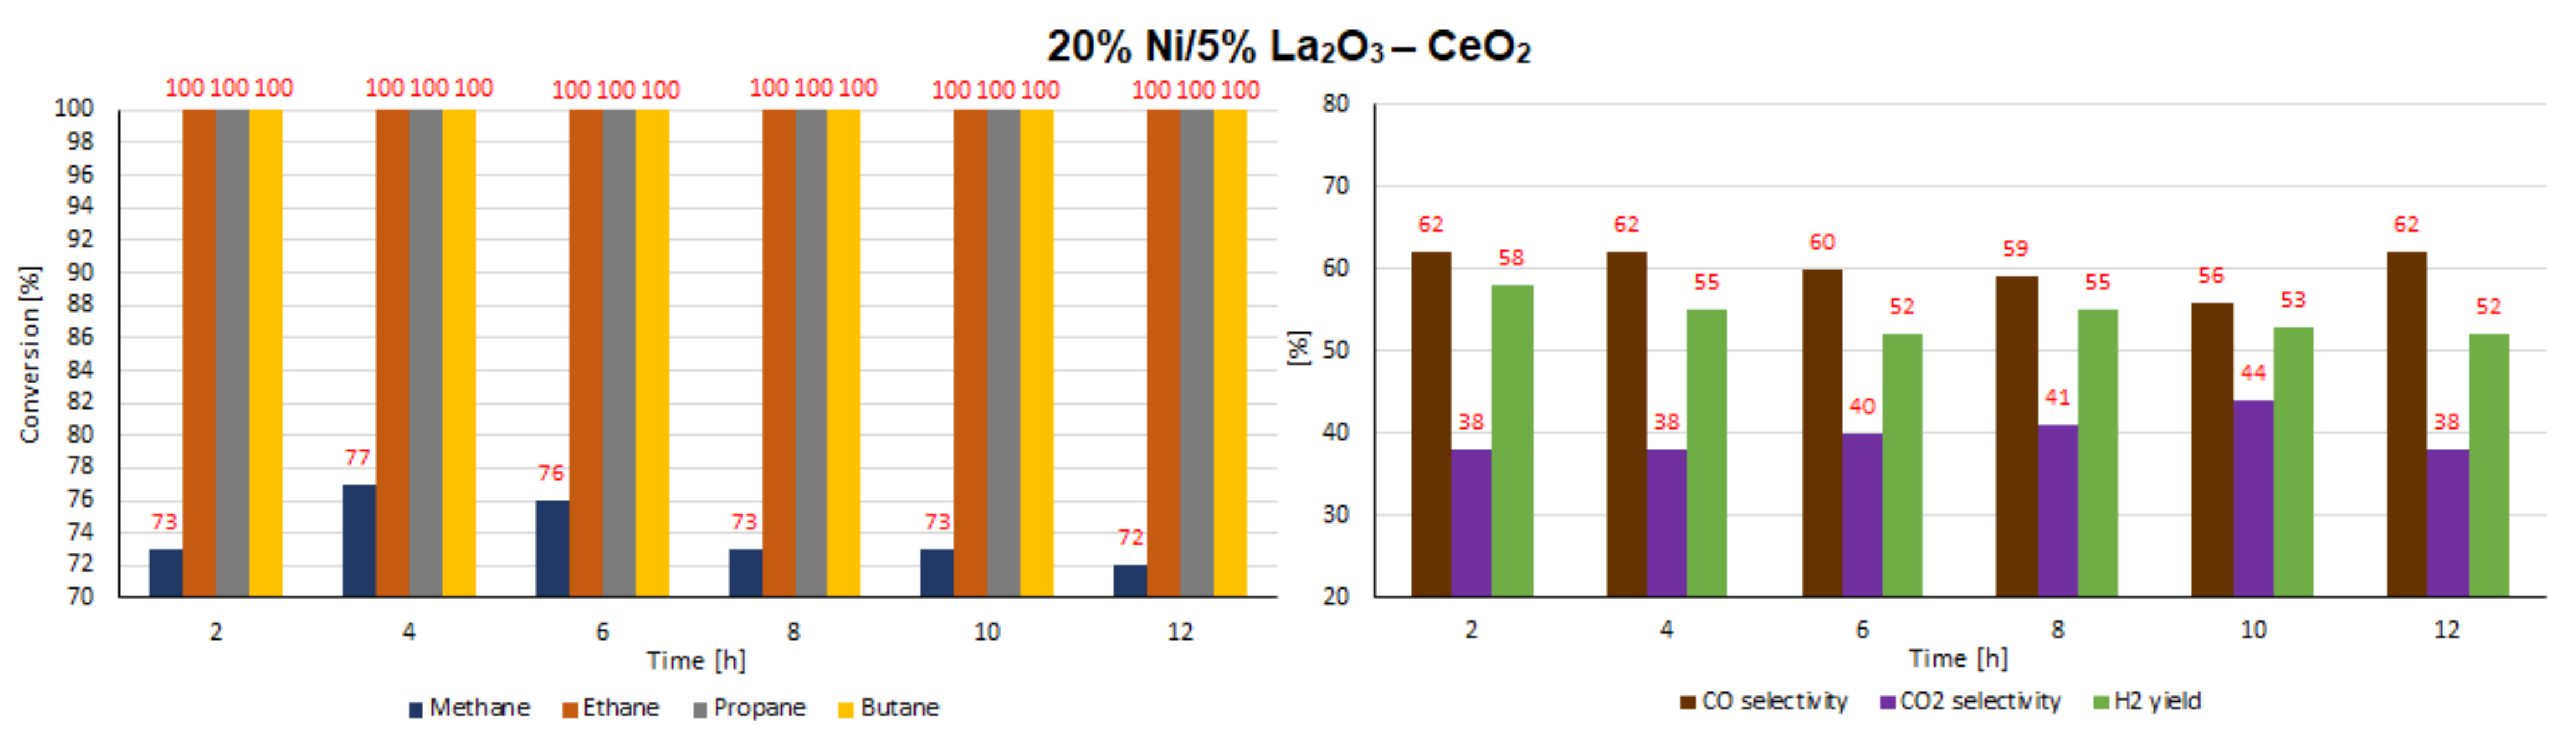
| 20% Ni/5% La2O3–CeO2 | 2 | 73 | 100 | 100 | 100 |
| 4 | 77 | 100 | 100 | 100 | |
| 6 | 76 | 100 | 100 | 100 | |
| 8 | 73 | 100 | 100 | 100 | |
| 10 | 73 | 100 | 100 | 100 | |
| 12 | 72 | 100 | 100 | 100 |
| Catalysts | Time (h) | CO Selectivity (%) | CO2 Selectivity (%) | H2 Yield (%) |
|---|---|---|---|---|
| 20% Ni/CeO2 | 2 | 69 | 31 | 53 |
| 4 | 67 | 33 | 53 | |
| 6 | 73 | 27 | 55 | |
| 8 | 70 | 30 | 57 | |
| 10 | 73 | 27 | 56 | |
| 12 | 72 | 28 | 55 | |
| 20% Ni/5% ZrO2–CeO2 | 2 | 75 | 25 | 56 |
| 4 | 72 | 28 | 57 | |
| 6 | 73 | 27 | 56 | |
| 8 | 75 | 25 | 58 | |
| 10 | 75 | 25 | 54 | |
| 12 | 74 | 26 | 53 | |
| 20% Ni/5% La2O3–CeO2 | 2 | 62 | 38 | 58 |
| 4 | 62 | 38 | 55 | |
| 6 | 60 | 40 | 52 | |
| 8 | 59 | 41 | 55 | |
| 10 | 56 | 44 | 53 | |
| 12 | 62 | 38 | 52 |
Publisher’s Note: MDPI stays neutral with regard to jurisdictional claims in published maps and institutional affiliations. |
© 2021 by the authors. Licensee MDPI, Basel, Switzerland. This article is an open access article distributed under the terms and conditions of the Creative Commons Attribution (CC BY) license (https://creativecommons.org/licenses/by/4.0/).
Share and Cite
Mosinska, M.; Maniukiewicz, W.; Szynkowska-Jozwik, M.I.; Mierczynski, P. The Effect of Modifiers on the Performance of Ni/CeO2 and Ni/La2O3 Catalysts in the Oxy–Steam Reforming of LNG. Int. J. Mol. Sci. 2021, 22, 9076. https://0-doi-org.brum.beds.ac.uk/10.3390/ijms22169076
Mosinska M, Maniukiewicz W, Szynkowska-Jozwik MI, Mierczynski P. The Effect of Modifiers on the Performance of Ni/CeO2 and Ni/La2O3 Catalysts in the Oxy–Steam Reforming of LNG. International Journal of Molecular Sciences. 2021; 22(16):9076. https://0-doi-org.brum.beds.ac.uk/10.3390/ijms22169076
Chicago/Turabian StyleMosinska, Magdalena, Waldemar Maniukiewicz, Malgorzata I. Szynkowska-Jozwik, and Pawel Mierczynski. 2021. "The Effect of Modifiers on the Performance of Ni/CeO2 and Ni/La2O3 Catalysts in the Oxy–Steam Reforming of LNG" International Journal of Molecular Sciences 22, no. 16: 9076. https://0-doi-org.brum.beds.ac.uk/10.3390/ijms22169076