
Genome-Wide Mapping of Cytosine Methylation Revealed Dynamic DNA Methylation Patterns Associated with Sporophyte Development of Saccharina japonica


Abstract
:1. Introduction
2. Results
2.1. Whole-Genome Bisulfite Sequencing of S. japonica Sporophytes
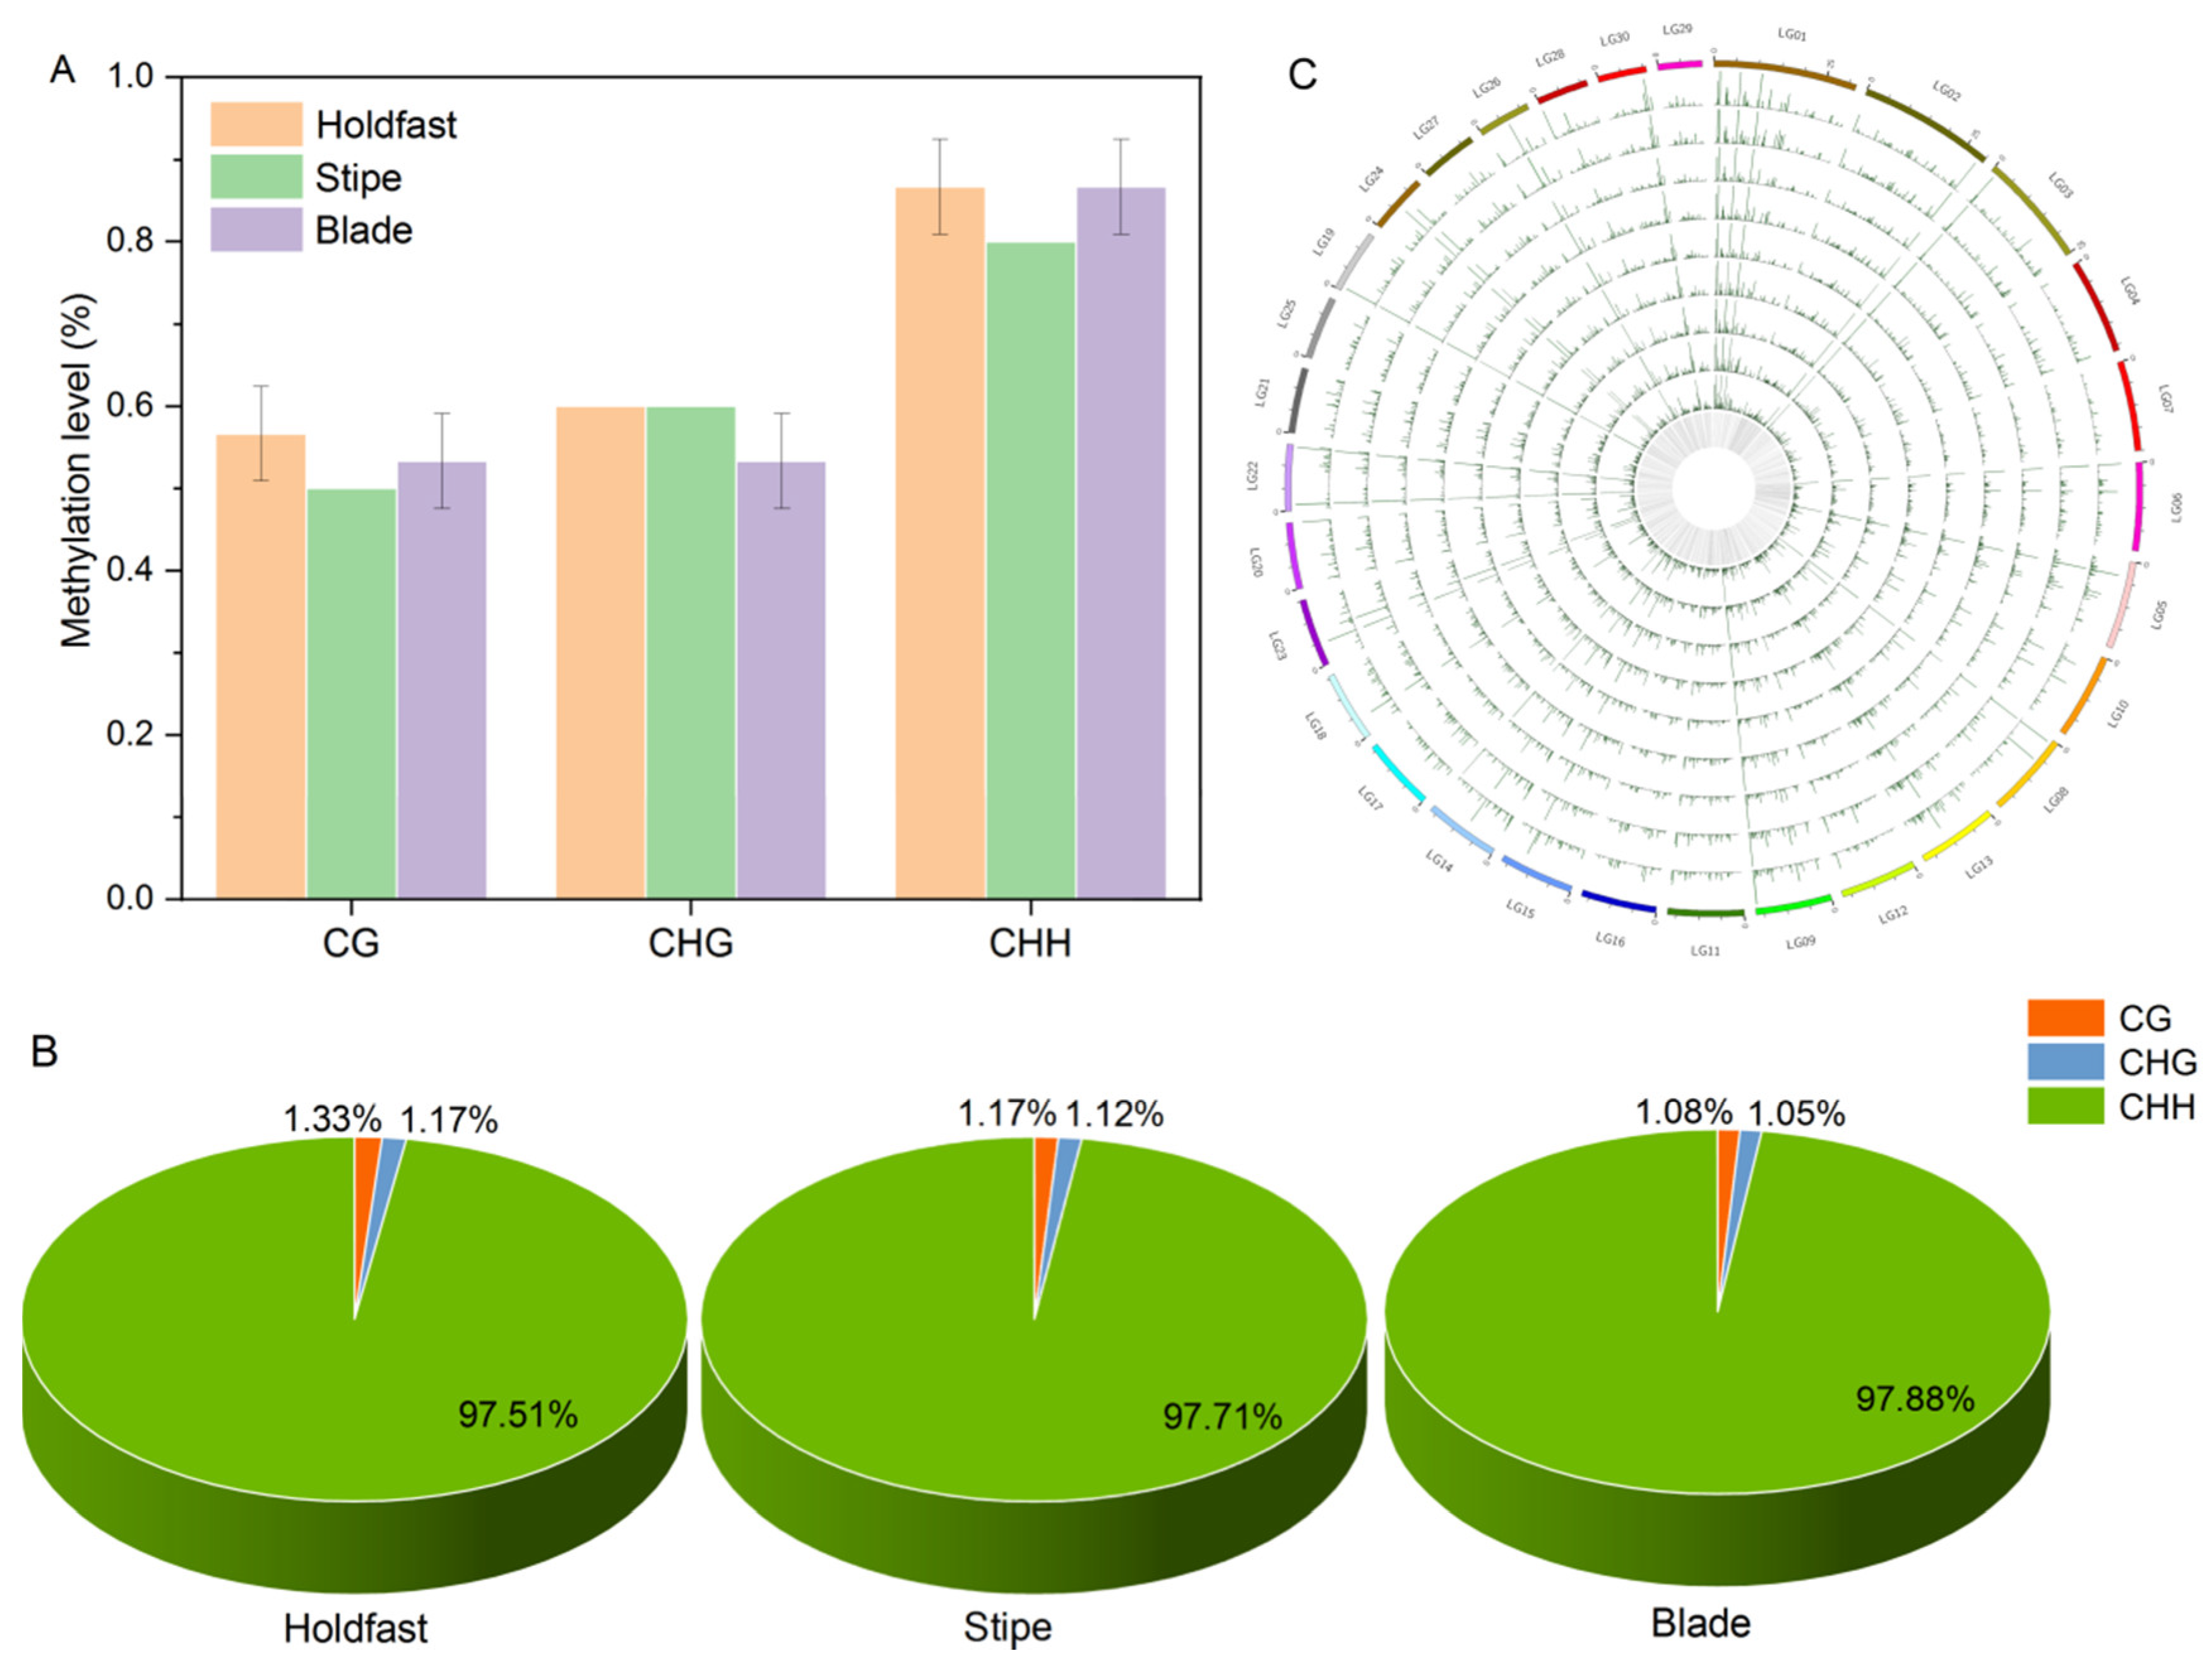
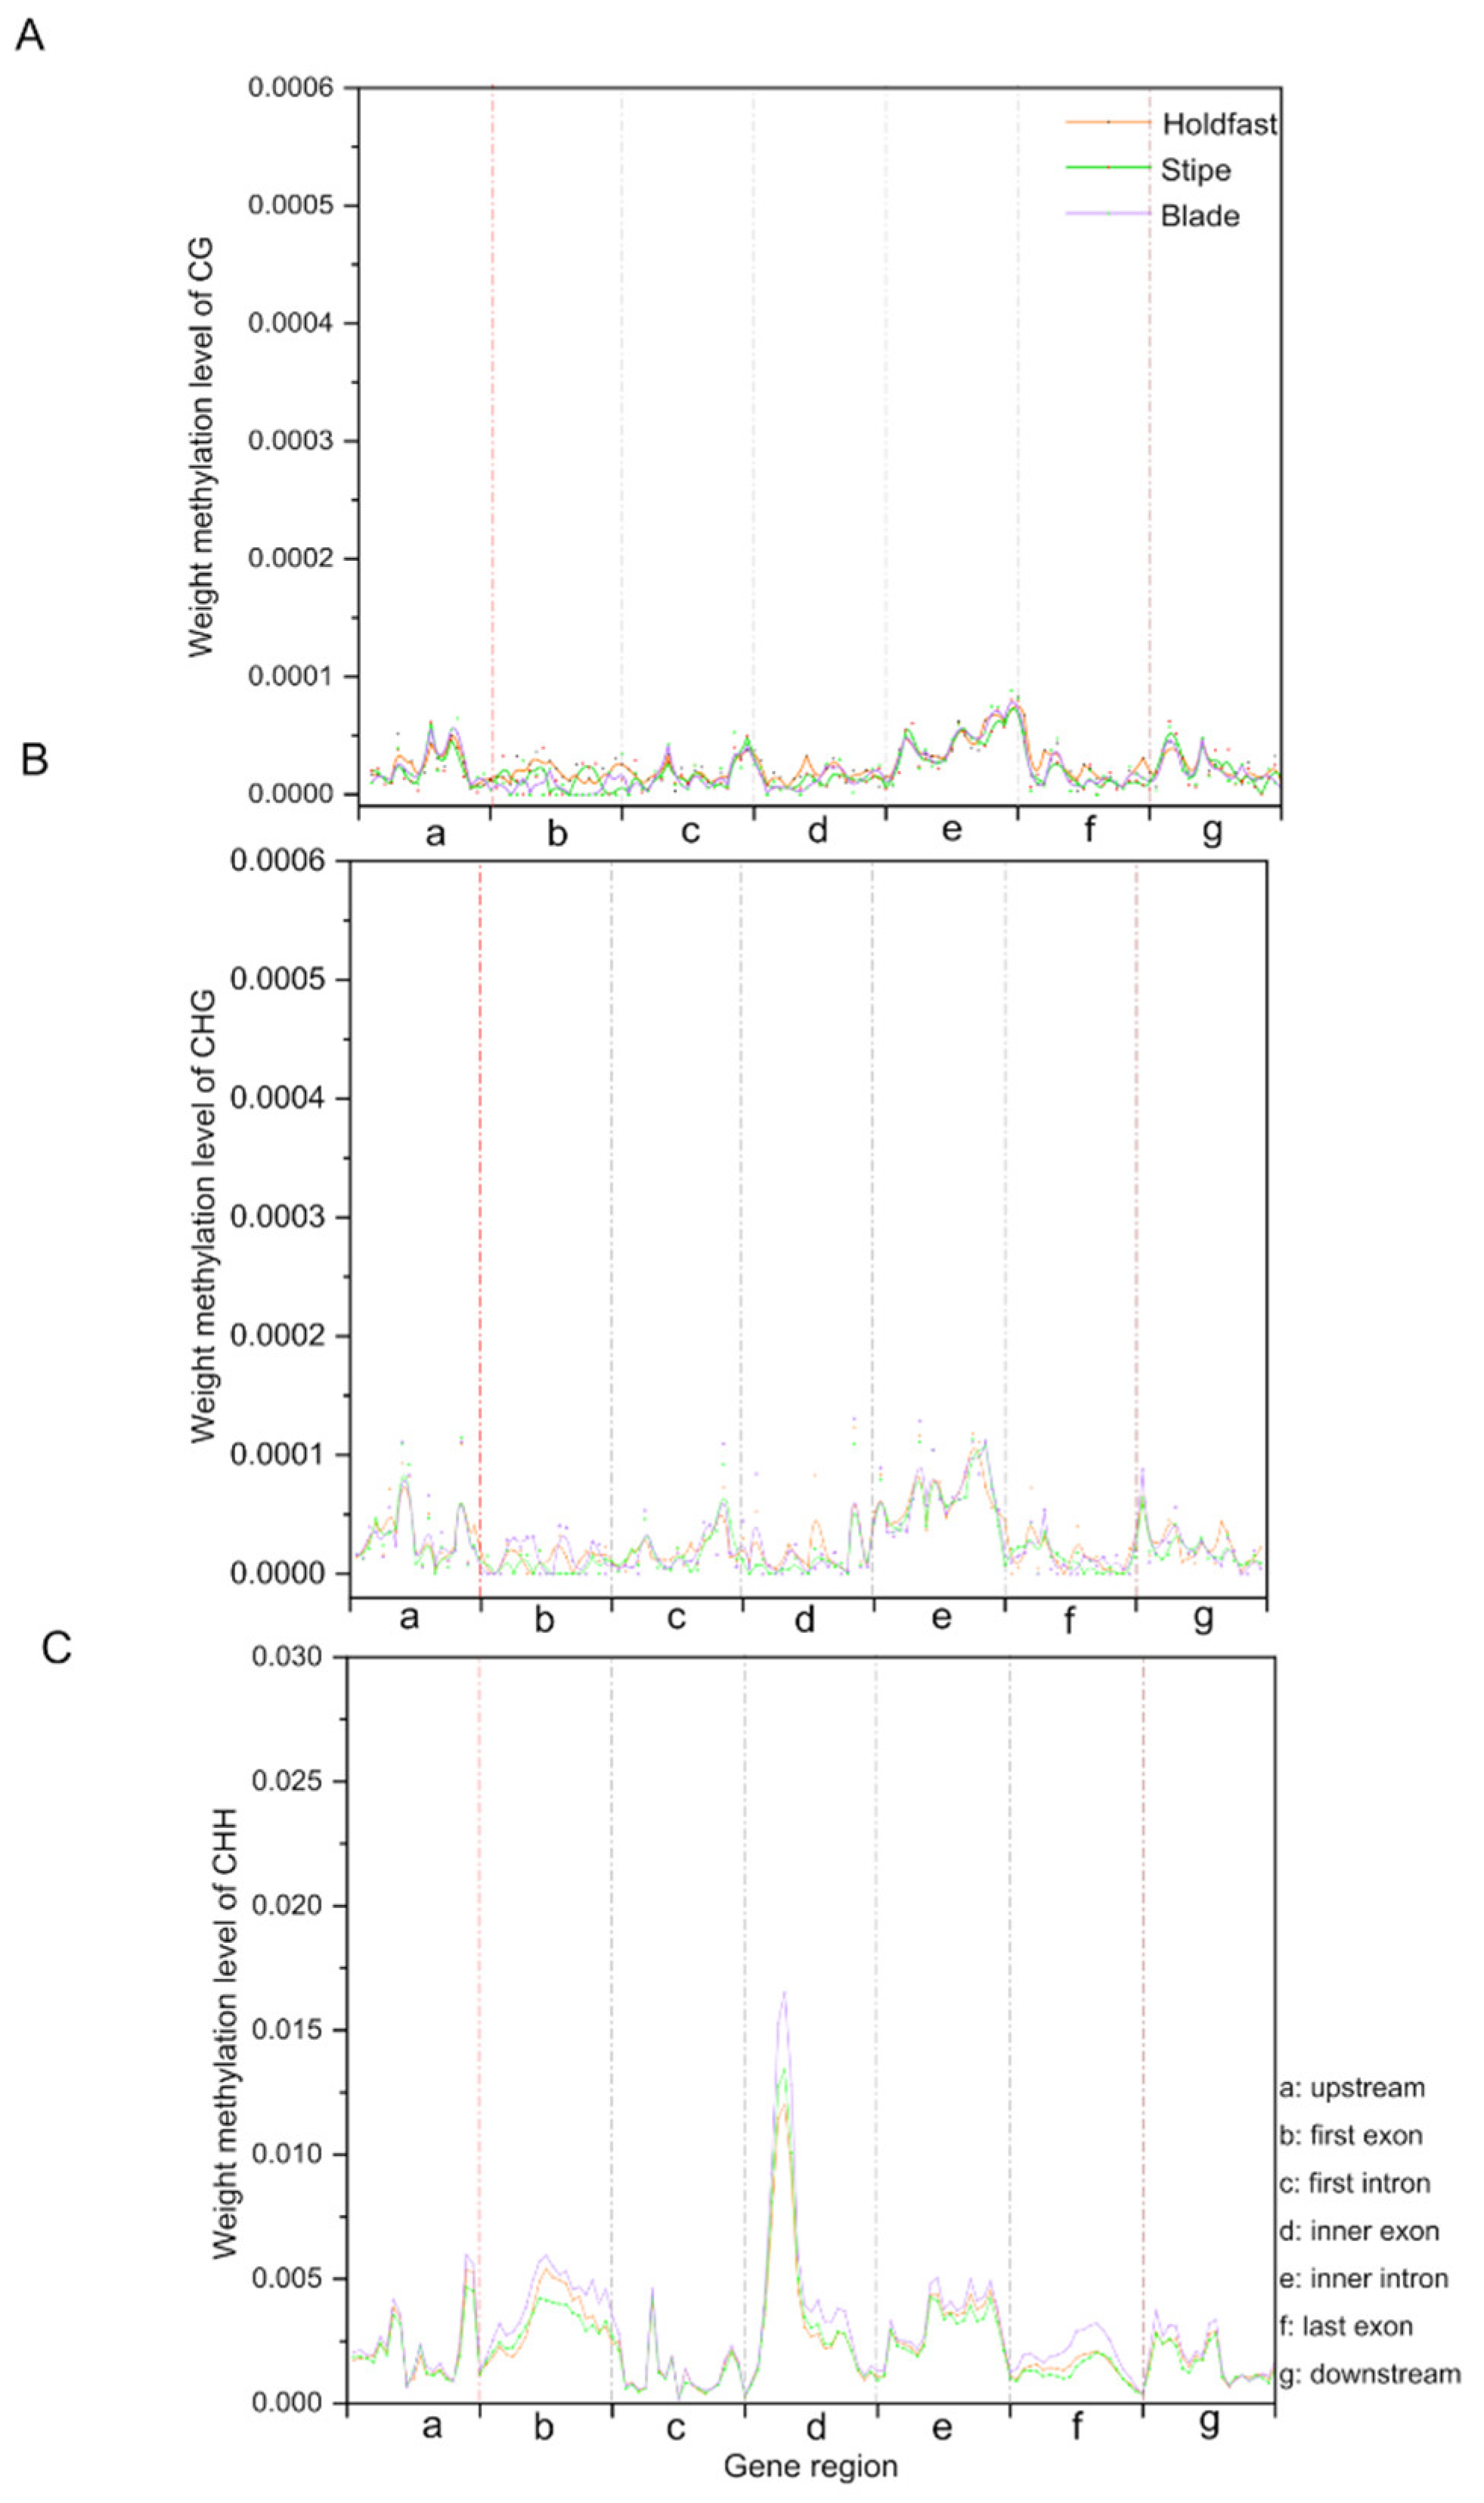
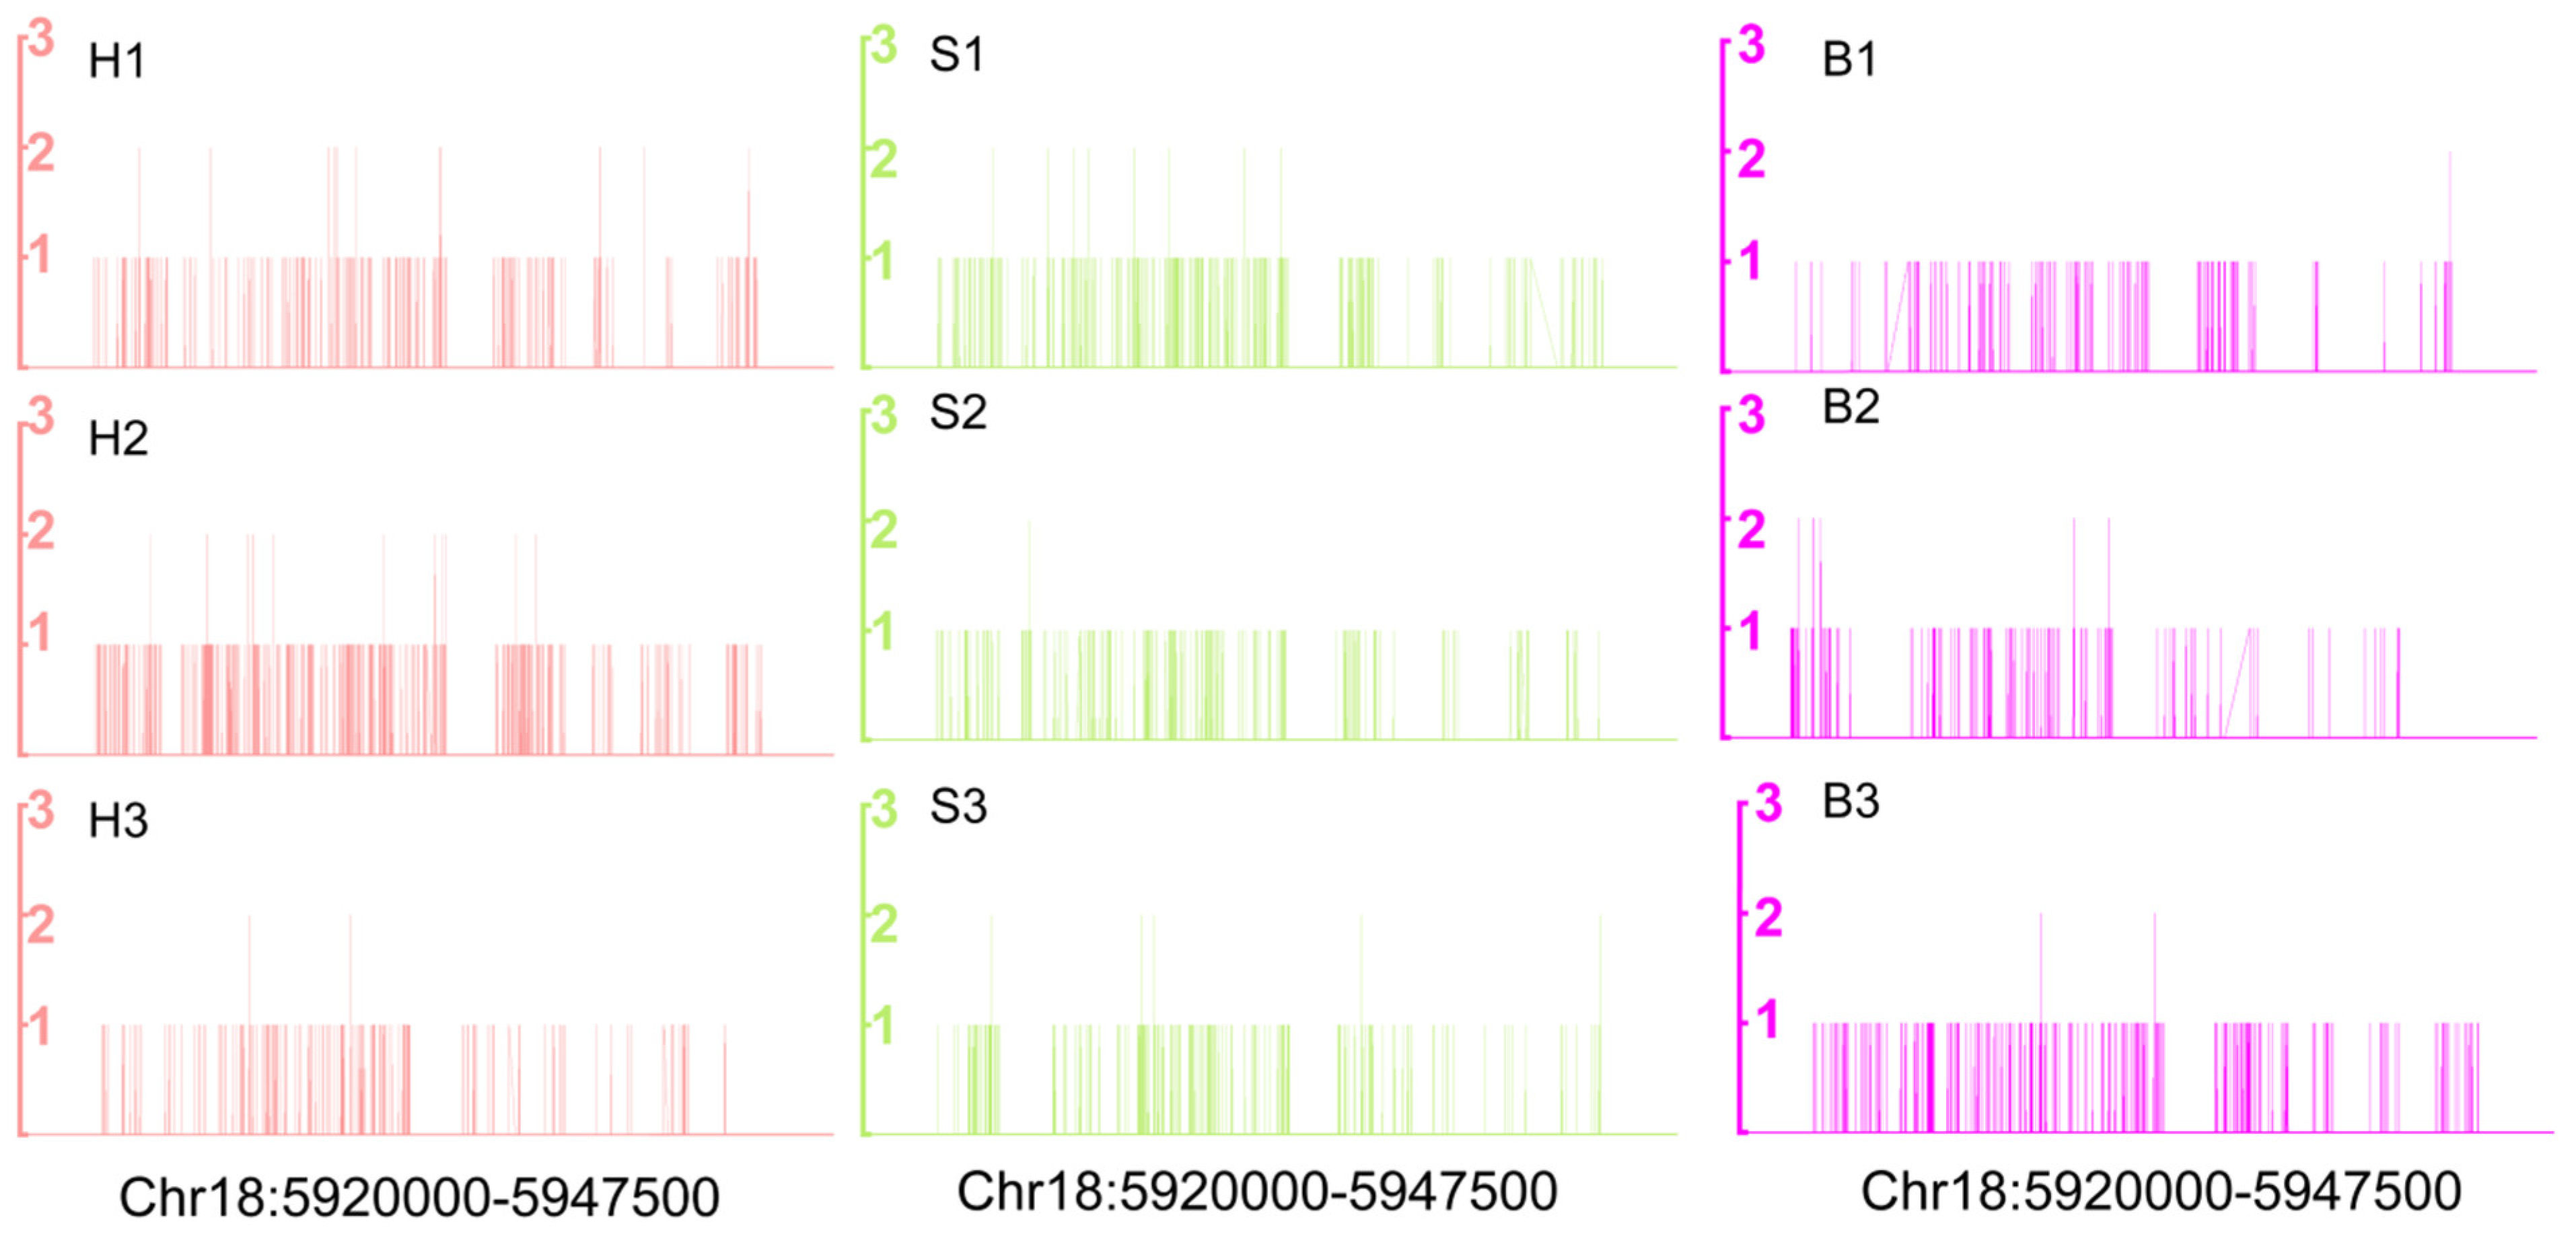
2.2. DNA Methylation Landscapes in Holdfast, Stipe and Blade
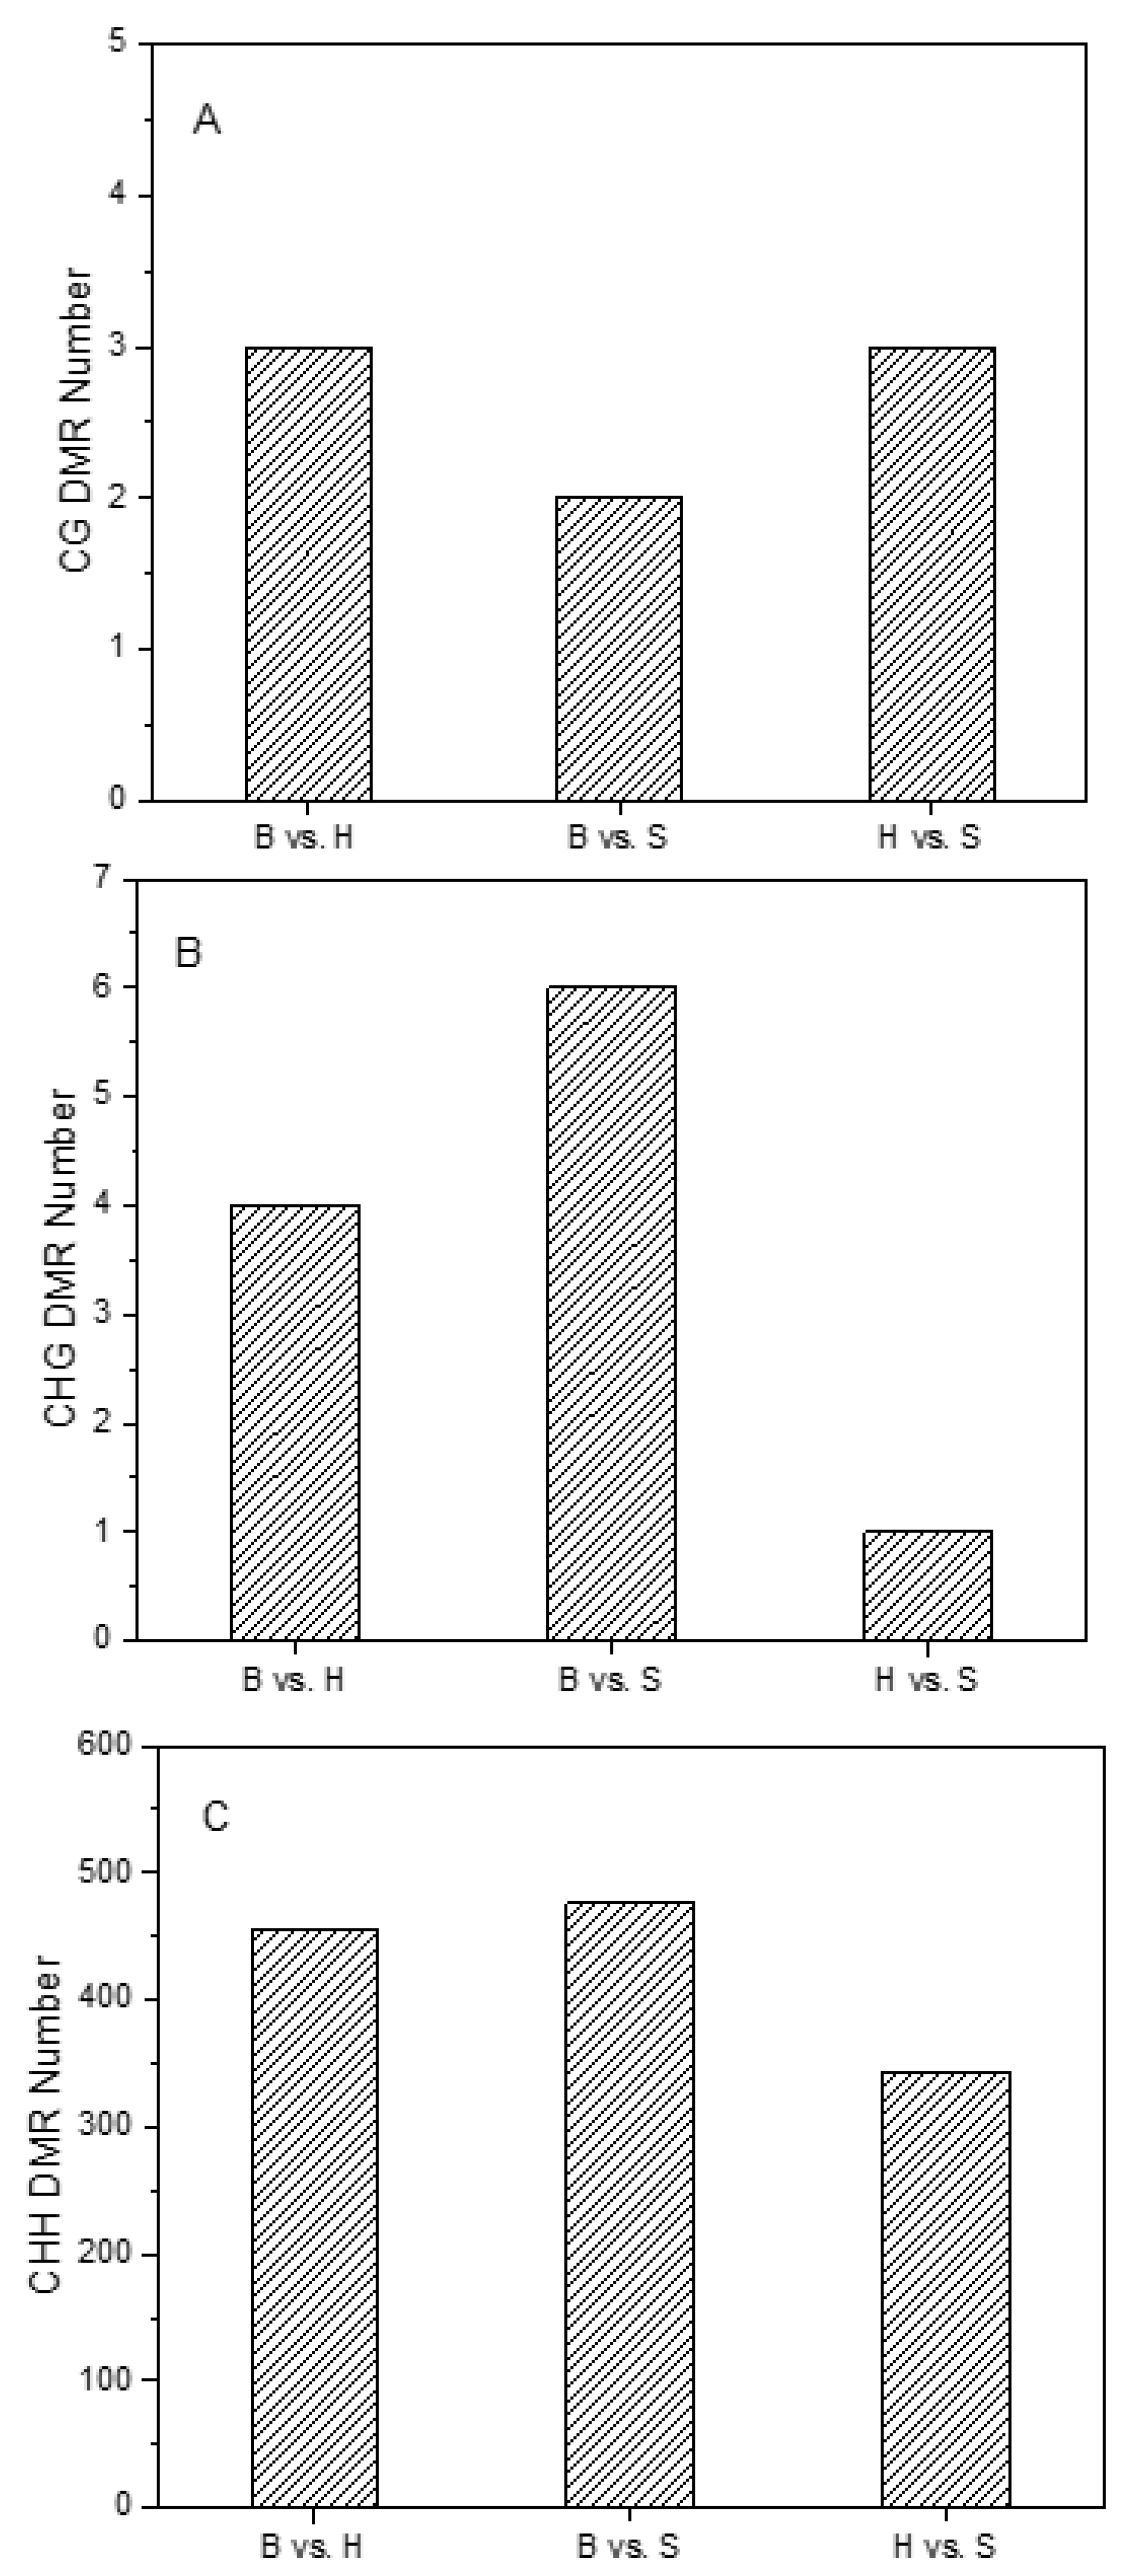
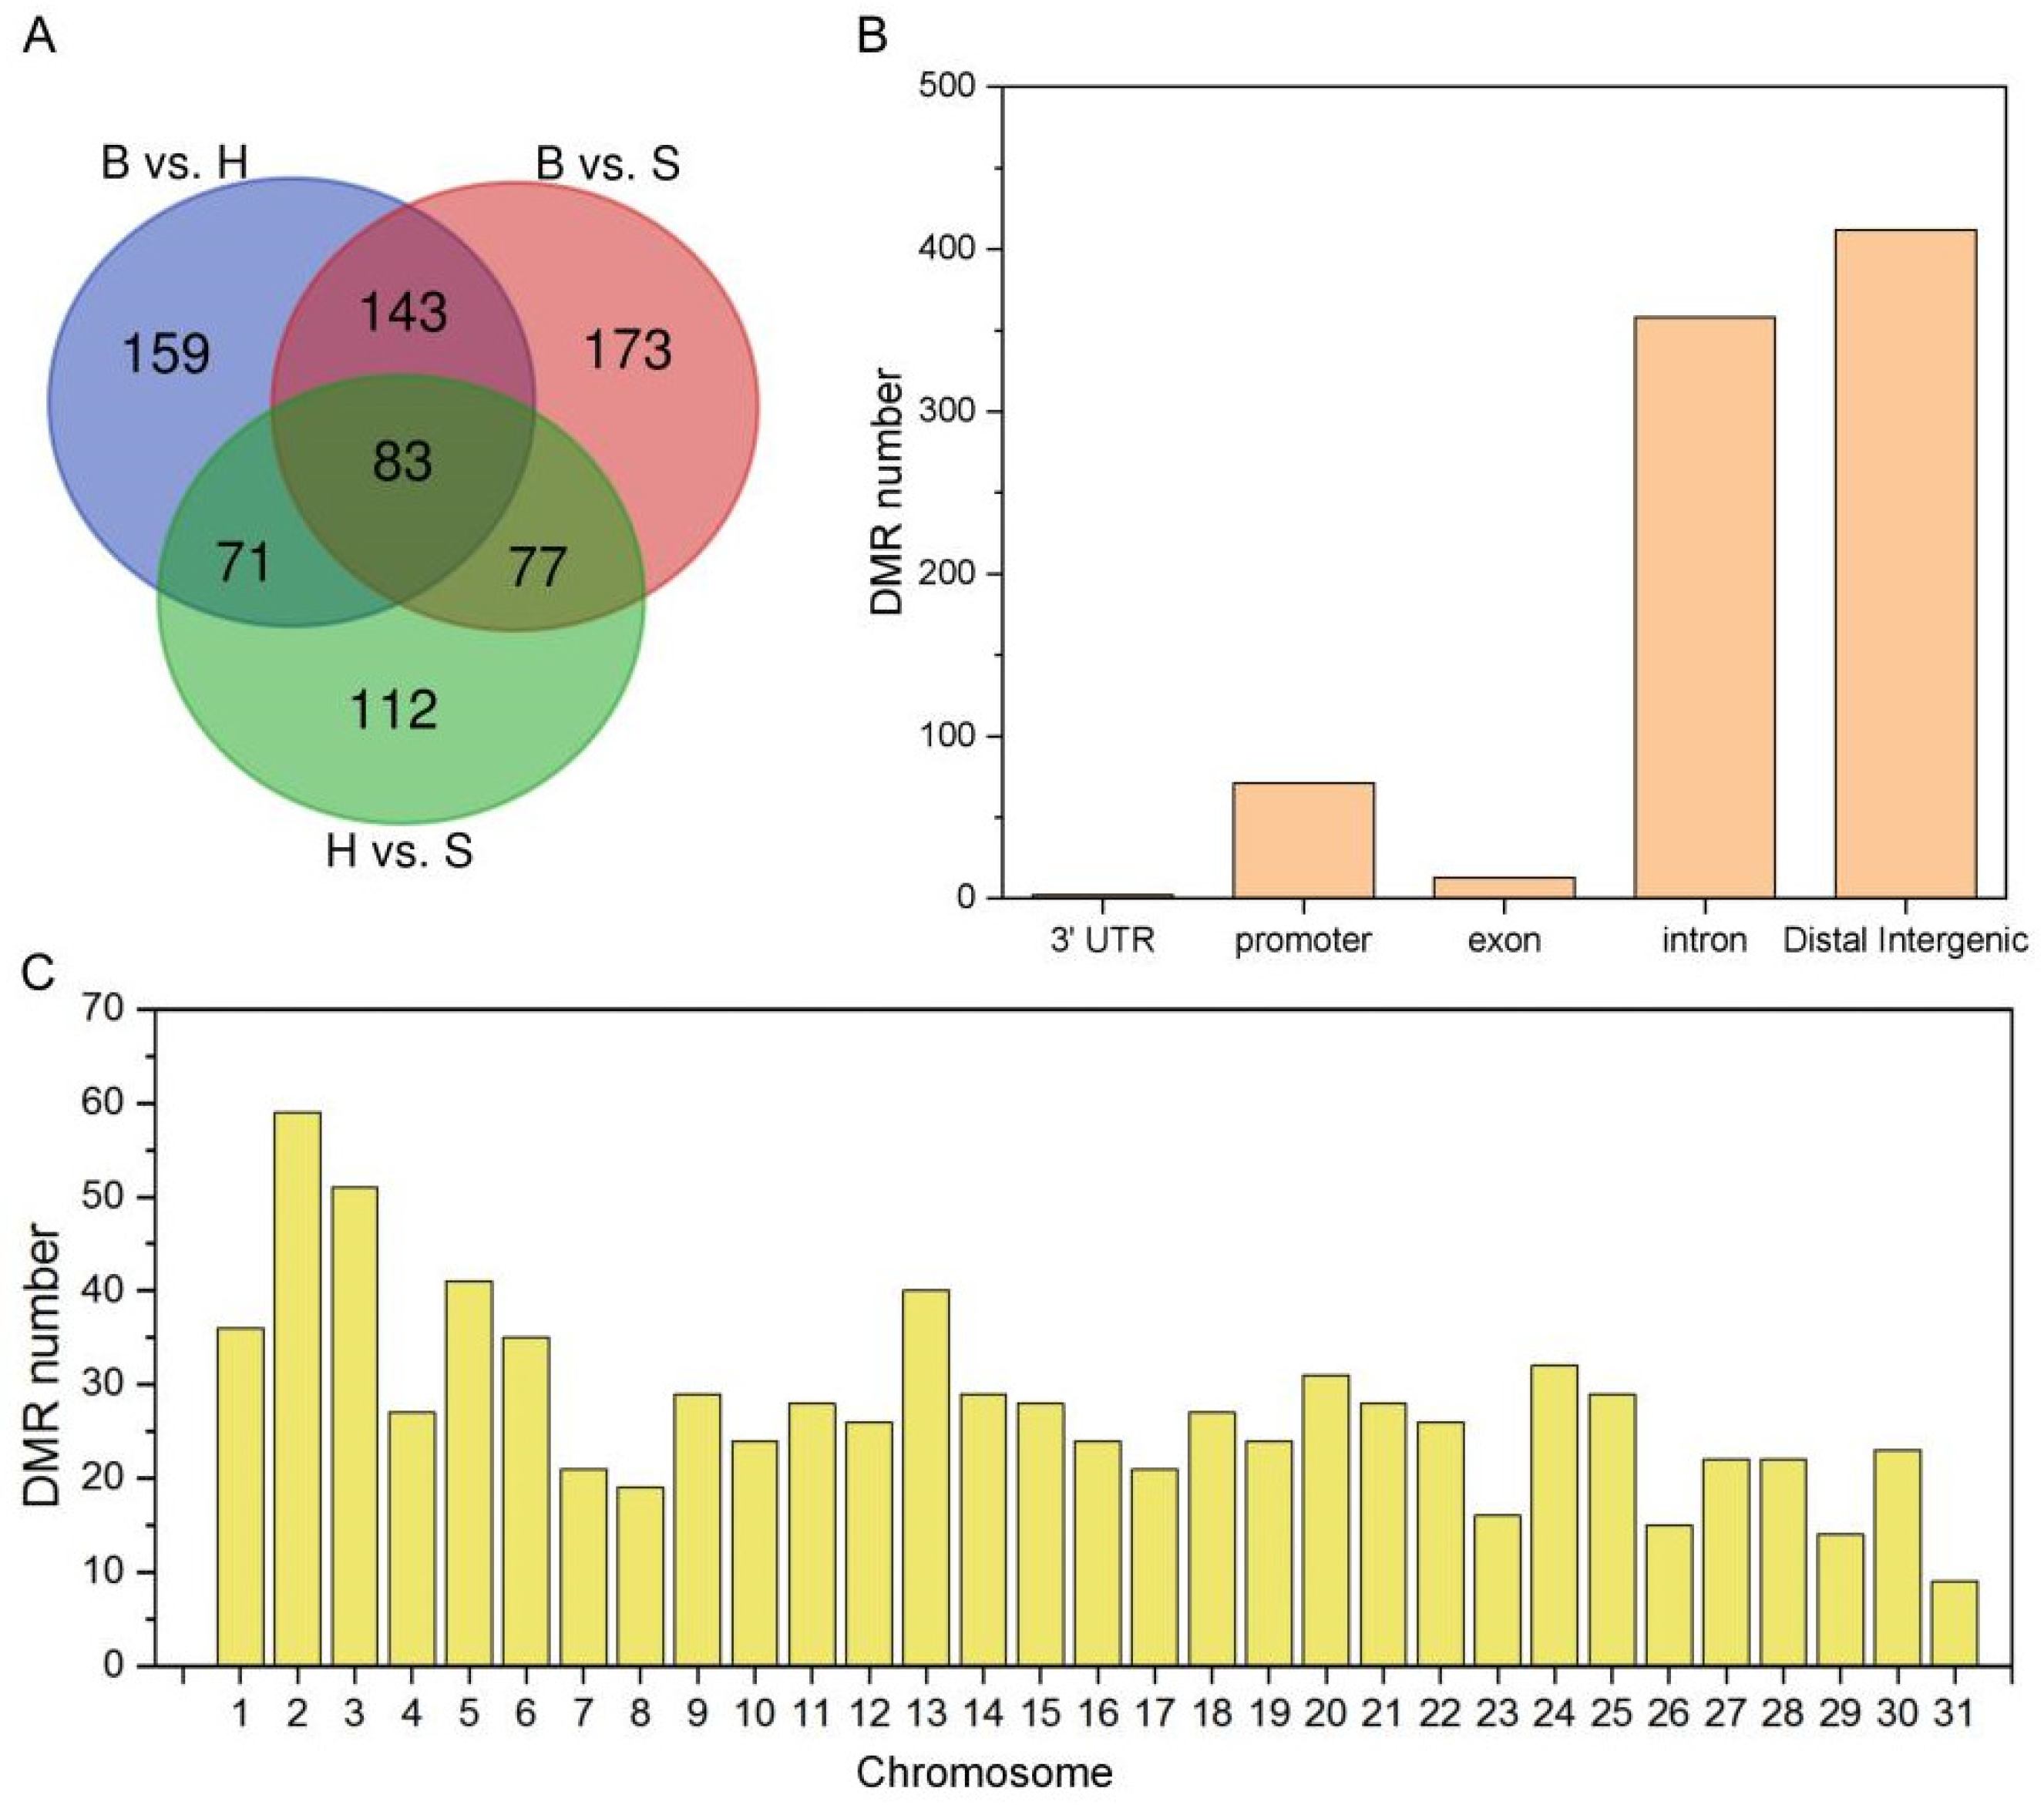
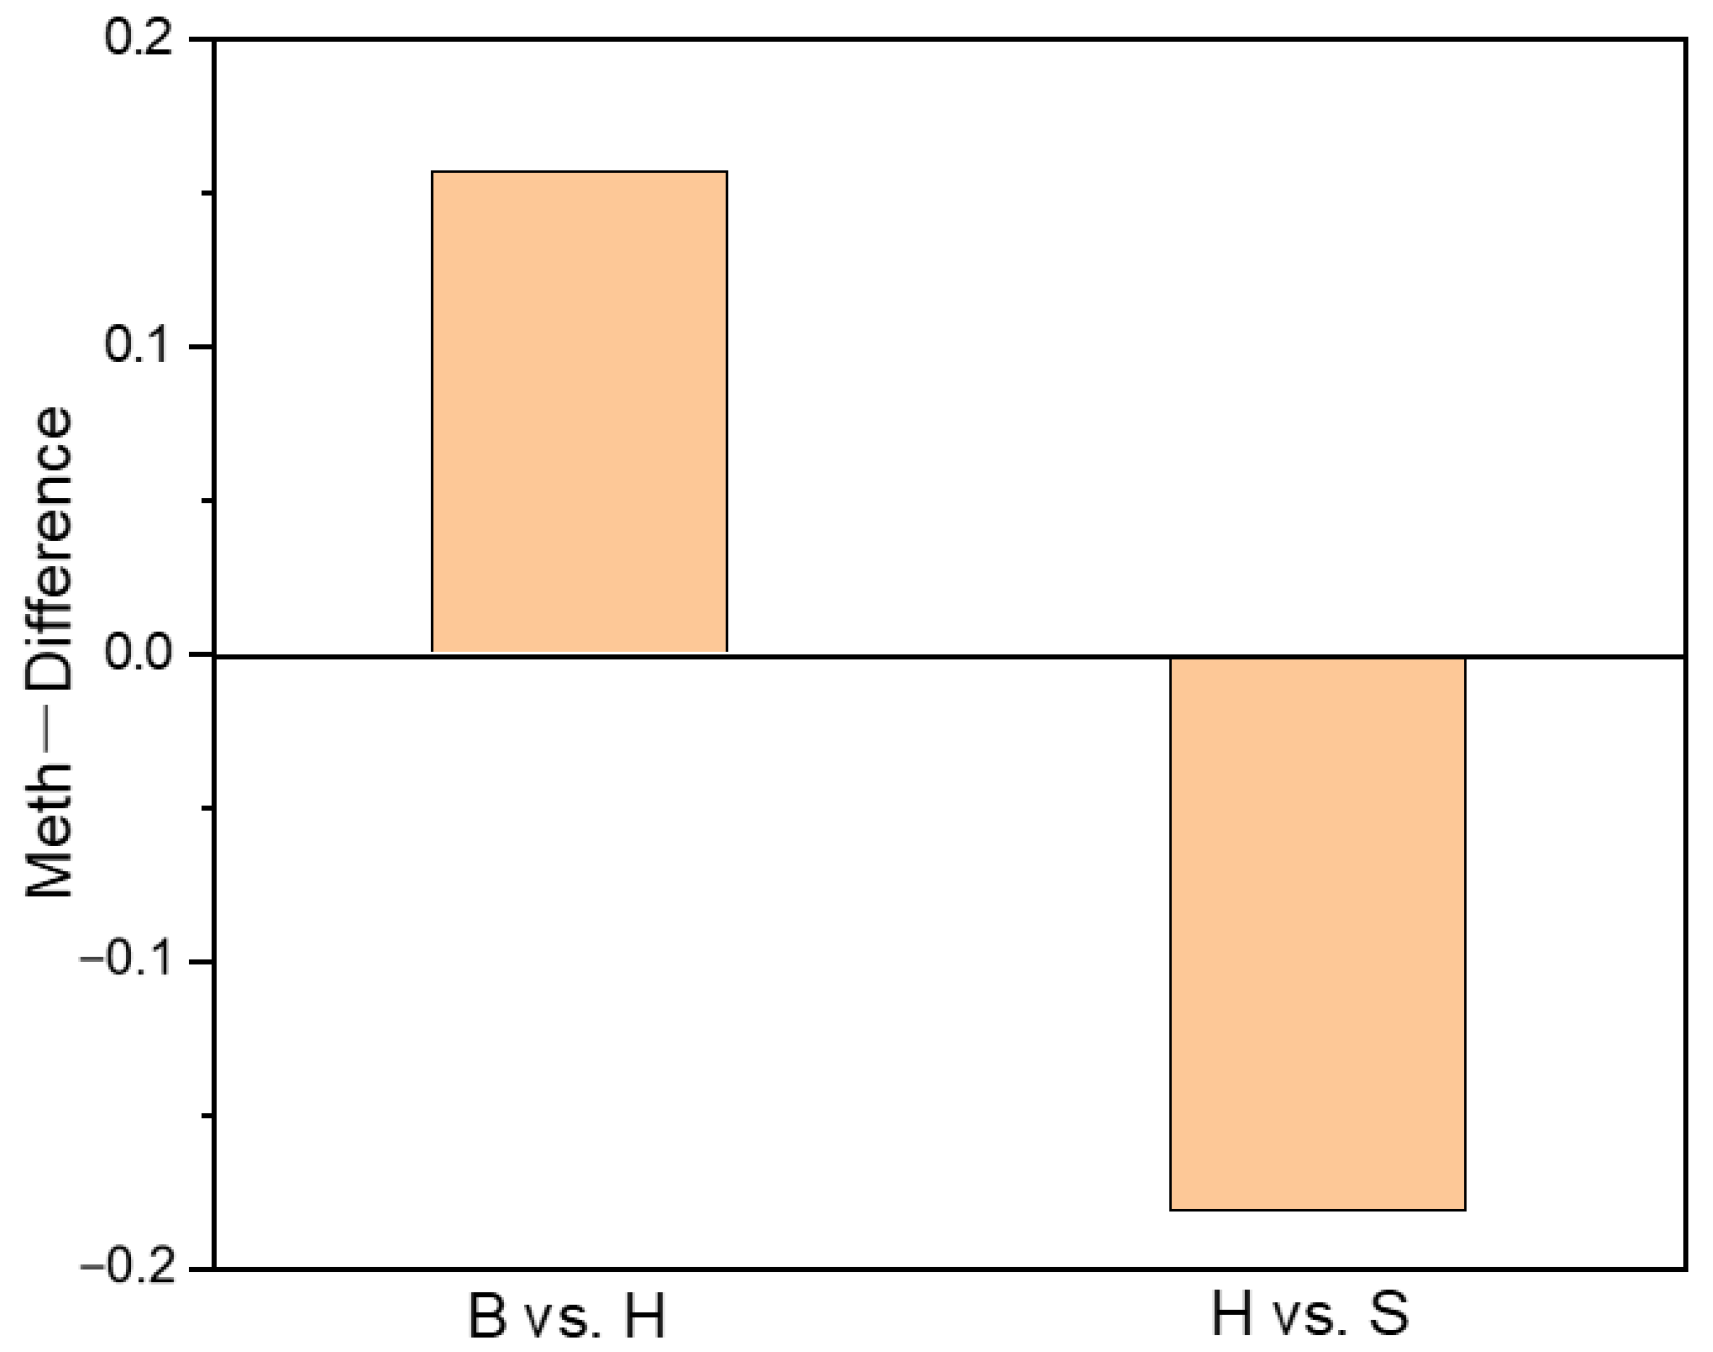
2.3. Characterization of DNA Methylation Variations in Holdfast, Stipe and Blade
2.4. Annotations of DMR Related Genes in Holdfast, Stipe and Blade
2.5. Identification of the DNA Methylation Profiles of Alginate-Related Genes
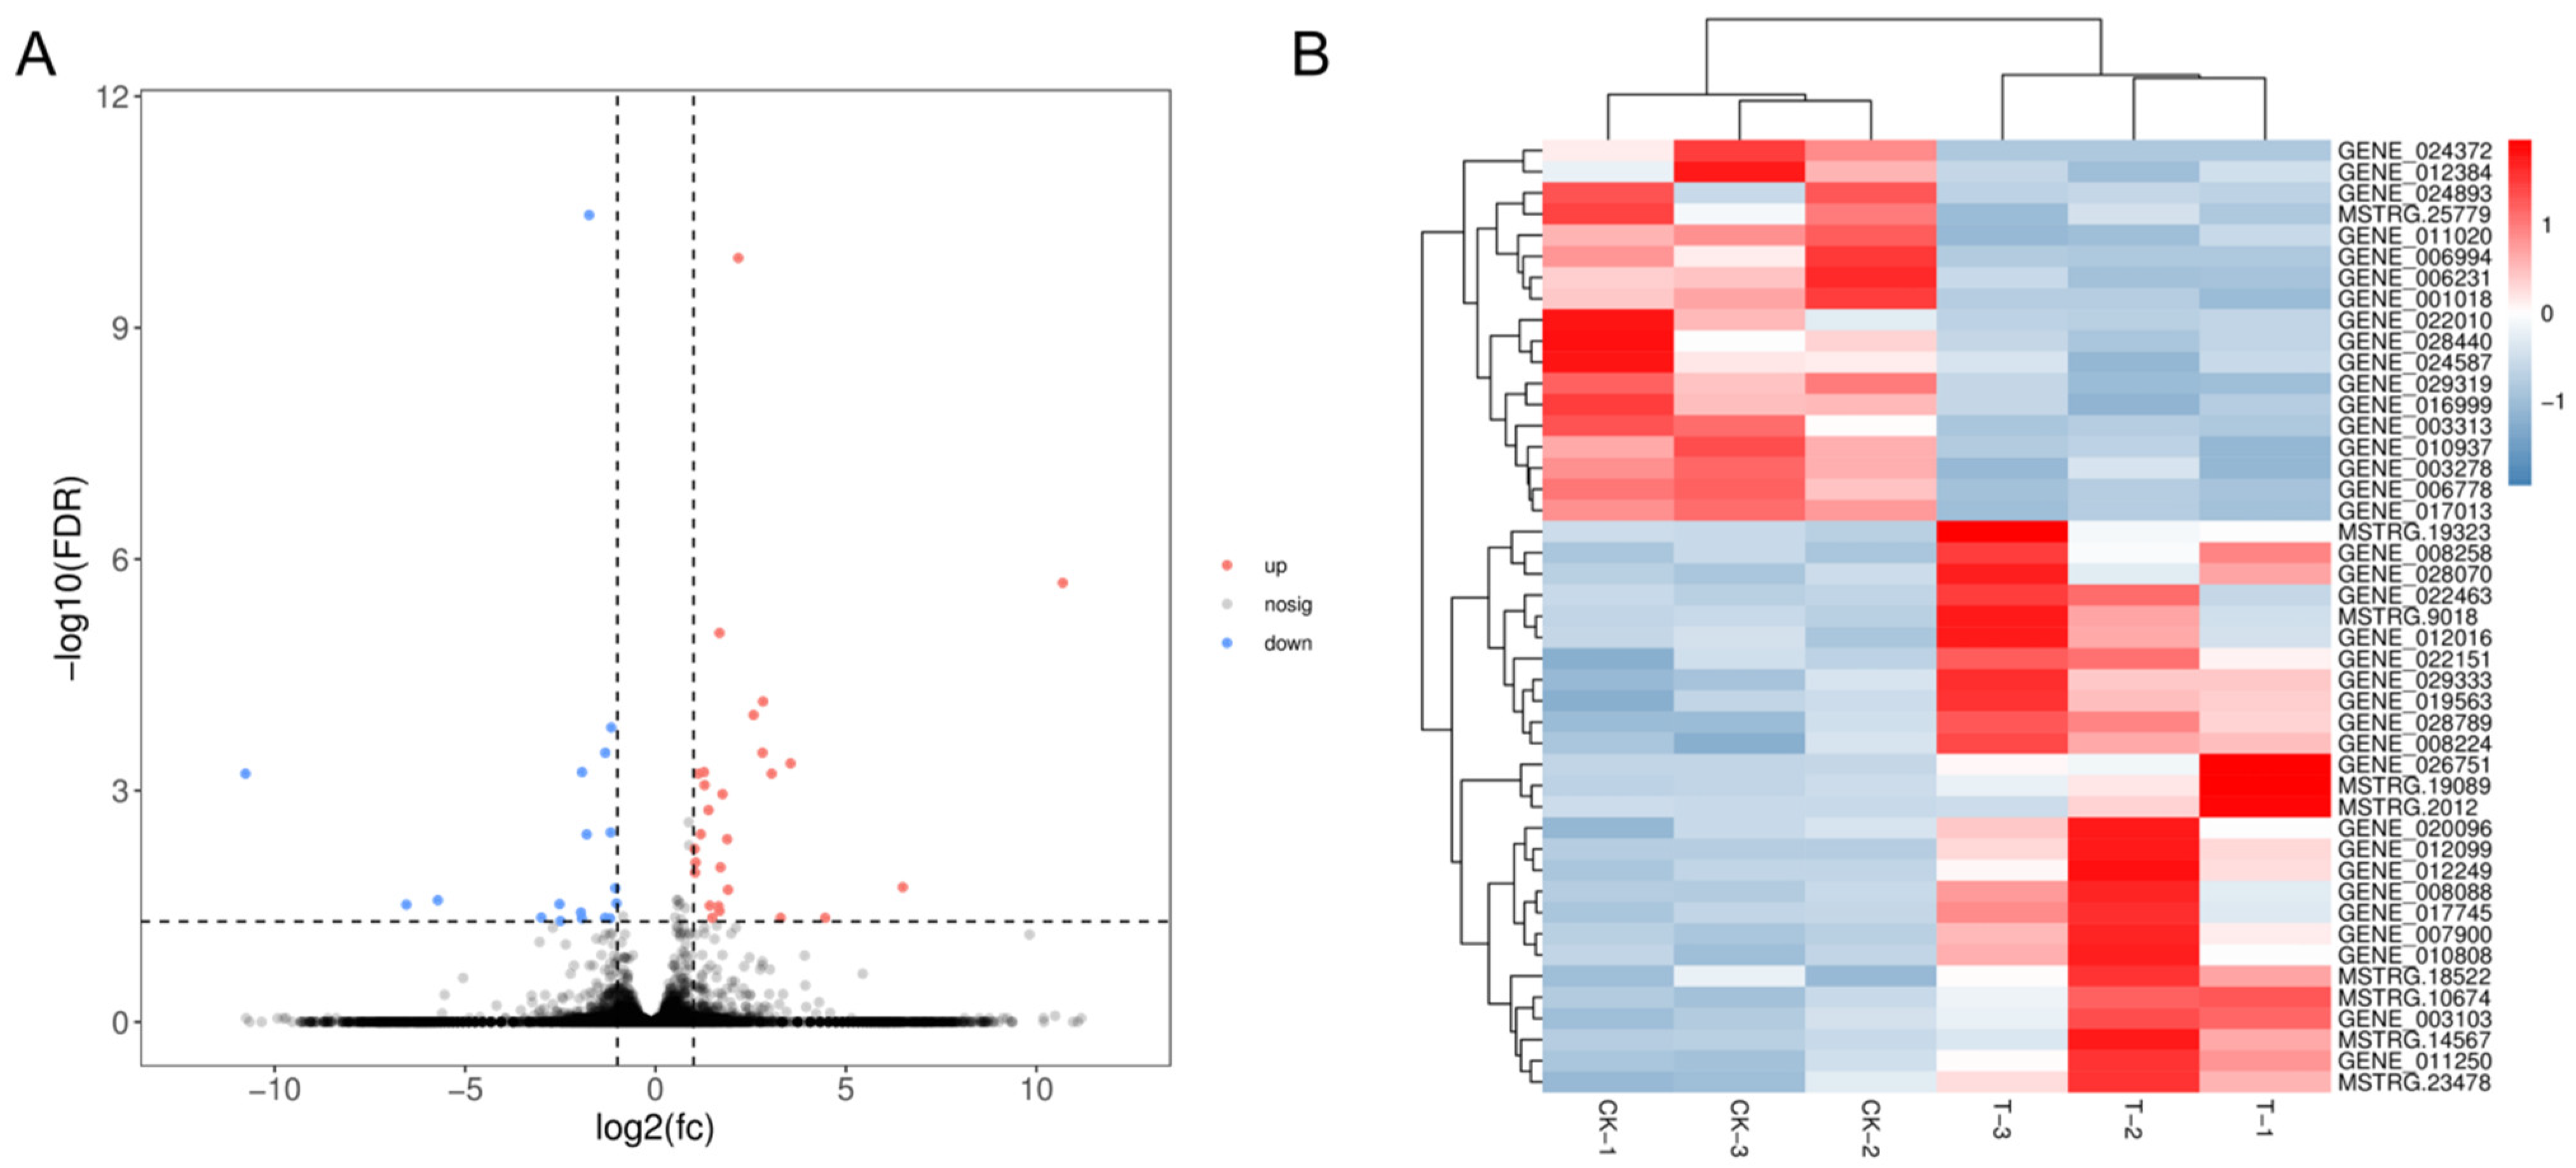
2.6. Correlations between the DNA Methylation and Gene Expression
3. Discussion
3.1. Cytosine Methylation Characteristics in the Holdfast, Stipe and Blade
3.2. Regulations of Cytosine Methylation in the Cell Development of Holdfast, Stipe and Blade
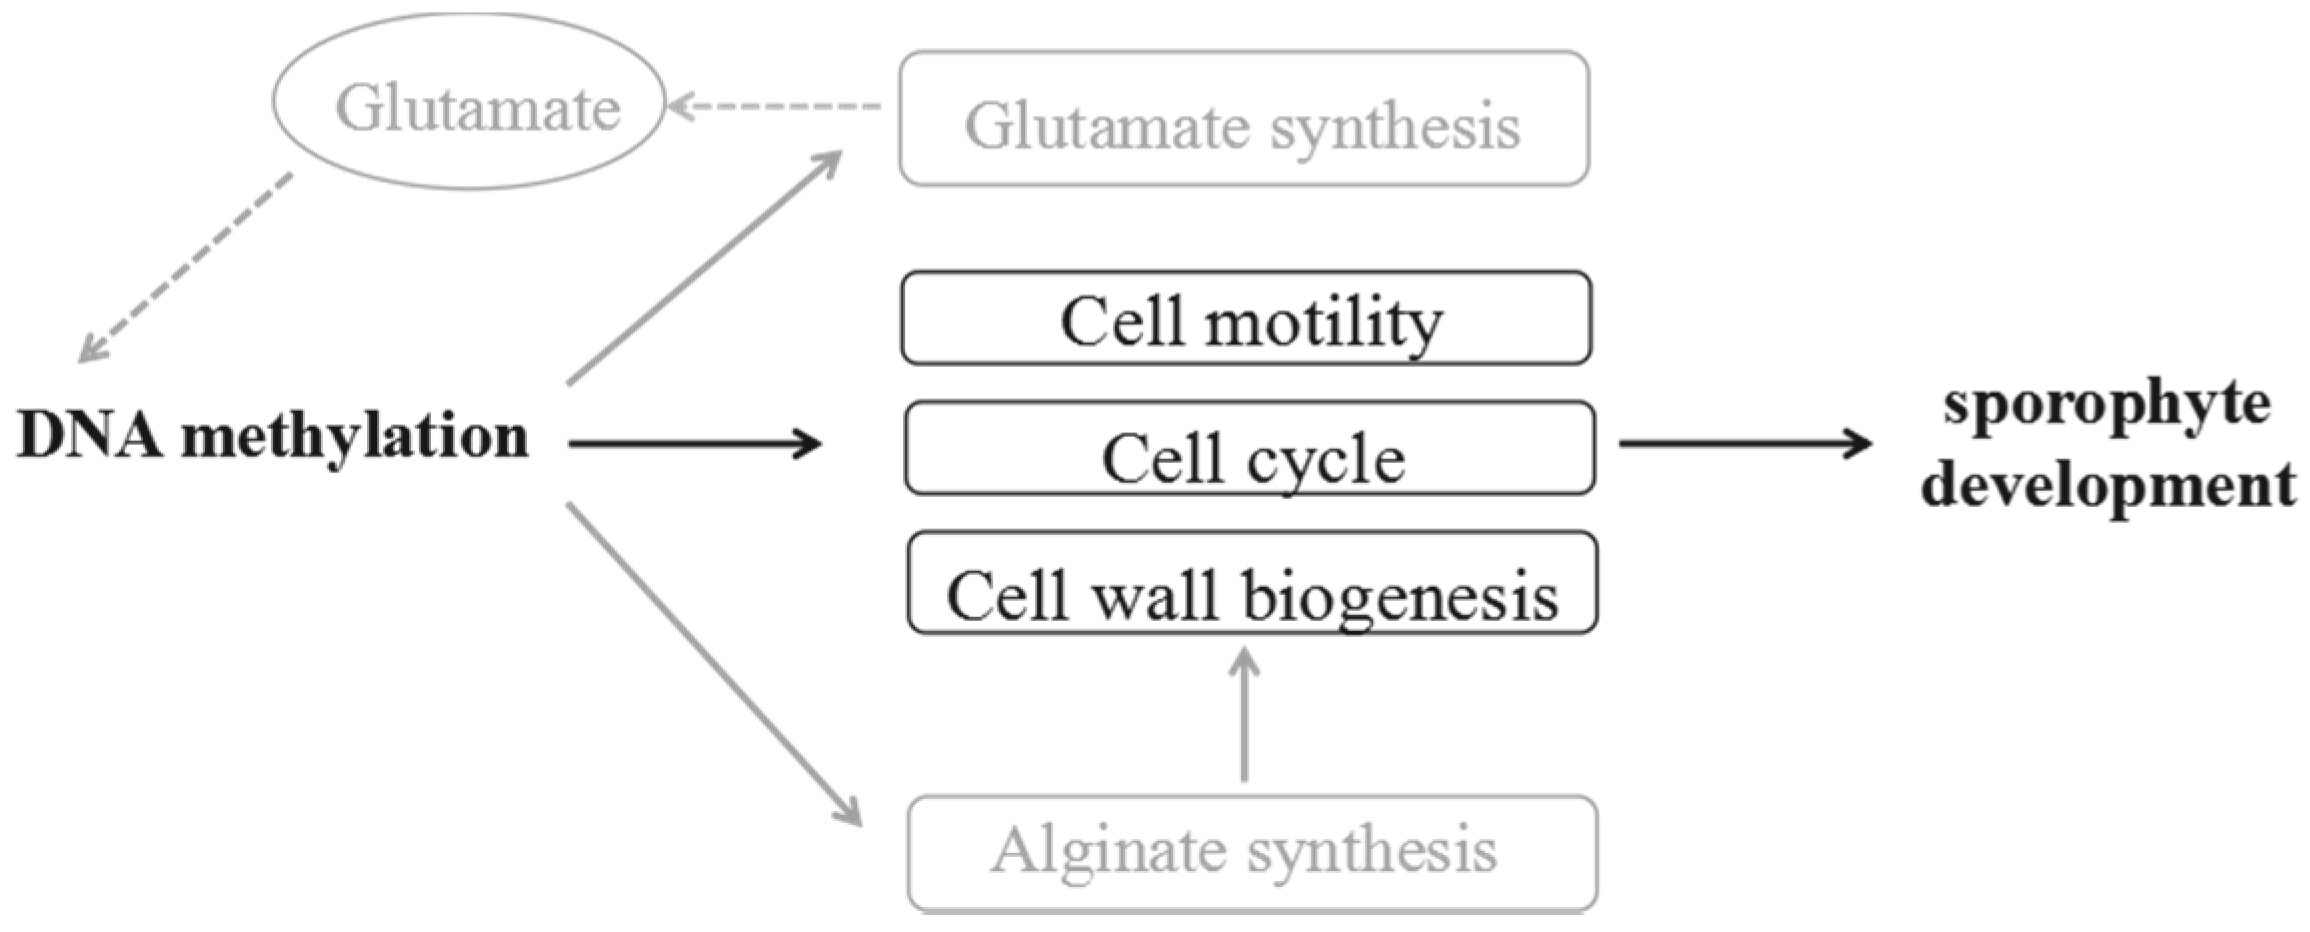
3.3. Glutamate May Act as the Epigenetic Regulator in the Sporophyte Development
4. Materials and Methods
4.1. Plant Material and Treatment
4.2. Methylation Library Construction and Sequencing Analysis
4.3. Bioinformatic Analysis of Methyl C Library Sequencing Data
4.4. Differentially Methylated Regions between the Holdfast, Stipe and Blade
4.5. cDNA Libraries Construction and Transcriptome Sequencing and Analysis
4.6. qRT-PCR Analysis
4.7. Statistical Analysis
5. Conclusions
Supplementary Materials
Author Contributions
Funding
Institutional Review Board Statement
Informed Consent Statement
Data Availability Statement
Conflicts of Interest
References
- Thomas, B.; Matson, S.; Chopra, V.; Sun, L.; Sharma, S.; Hersch, S.; Rosas, H.D.; Scherzer, C.; Ferrante, R.; Matson, W. A novel method for detecting 7-methyl guanine reveals aberrant methylation levels in Huntington disease. Anal. Biochem. 2013, 436, 112–120. [Google Scholar] [CrossRef] [Green Version]
- Klungland, A.; Robertson, A.B. Oxidized C5-methyl cytosine bases in DNA: 5-Hydroxymethylcytosine; 5-formylcytosine; and 5-carboxycytosine. Free Radic. Biol. Med. 2017, 107, 62–68. [Google Scholar] [CrossRef]
- Walter, M.; Teissandier, A.; Pérez-Palacios, R.; Bourc’His, D. Author response: An epigenetic switch ensures transposon repression upon dynamic loss of DNA methylation in embryonic stem cells. eLife 2016, 5, e11418. [Google Scholar] [CrossRef]
- Hanna, C.W.; Kelsey, G. Genomic imprinting beyond DNA methylation: A role for maternal histones. Genome Biol. 2017, 18, 1–4. [Google Scholar] [CrossRef]
- Zhang, H.; Lang, Z.; Zhu, J.K. Dynamics and function of DNA methylation in plants. Nat. Rev. Mol. Cell Biol. 2018, 19, 489–506. [Google Scholar] [CrossRef]
- Saze, H.; Tsugane, K.; Kanno, T.; Nishimura, T. DNA methylation in plants: Relationship to small RNAs and histone modifications, and functions in transposon inactivation. Plant Cell Physiol. 2012, 53, 766–784. [Google Scholar] [CrossRef] [PubMed] [Green Version]
- Cao, X.; Jacobsen, S.E. Locus-specific control of asymmetric and CpNpG methylation by the DRM and CMT3 methyltransferase genes. Proc. Natl. Acad. Sci. USA 2002, 99, 16491–16498. [Google Scholar] [CrossRef] [PubMed] [Green Version]
- Hsieh, T.F.; Shin, J.; Uzawa, R.; Silva, P.; Cohen, S.; Bauer, M.J.; Hashimoto, M.; Kirkbride, R.C.; Harada, J.J.; Zilberman, D.; et al. Regulation of imprinted gene expression in Arabidopsis endosperm. Proc. Natl. Acad. Sci. USA 2011, 108, 1755–1762. [Google Scholar] [CrossRef] [PubMed] [Green Version]
- Jones, P.A.; Takai, D. The role of DNA methylation in mammalian epigenetics. Science 2001, 293, 1068–1070. [Google Scholar] [CrossRef]
- Matzke, M.A.; Mosher, R.A. RNA-directed DNA methylation: An epigenetic pathway of increasing complexity. Nat. Rev. Genet. 2014, 15, 394–408. [Google Scholar] [CrossRef]
- Stroud, H.; Do, T.; Du, J.; Zhong, X.; Feng, S.; Johnson, L.M.; Patel, D.J.; Jacobsen, S.E. Non-CG methylation patterns shape the epigenetic landscape in Arabidopsis. Nat. Struct. Mol. Biol. 2014, 21, 64–72. [Google Scholar] [CrossRef] [Green Version]
- Ponger, L.; Li, W.H. Evolutionary Diversification of DNA Methyltransferases in Eukaryotic Genomes. Mol. Biol. Evol. 2005, 22, 1119–1128. [Google Scholar] [CrossRef] [Green Version]
- Kaiser, S.; Jurkowski, T.; Kellner, S.; Schneider, D.; Jeltsch, A.; Helm, M. The RNA methyltransferase Dnmt2 methylates DNA in the structural context of a tRNA. RNA Biol. 2017, 14, 1241–1251. [Google Scholar] [CrossRef]
- Vieira, G.C.; Vieira, G.F.; Sinigaglia, M.; Silva Valente, V.L. Linking epigenetic function to electrostatics: The DNMT2 structural model example. PLoS ONE 2017, 12, e0178643. [Google Scholar] [CrossRef] [Green Version]
- Dowen, R.H.; Pelizzola, M.; Schmitz, R.; Lister, R.; Dowen, J.M.; Nery, J.R.; Dixon, J.E.; Ecker, J.R. Widespread dynamic DNA methylation in response to biotic stress. Proc. Natl. Acad. Sci. USA 2012, 109, 12858–12859. [Google Scholar] [CrossRef] [PubMed] [Green Version]
- Zhu, J.K. Active DNA Demethylation Mediated by DNA Glycosylases. Annu. Rev. Genet. 2009, 43, 143–166. [Google Scholar] [CrossRef] [PubMed] [Green Version]
- Gong, Z.Z.; Morales-Ruiz, T.; Ariza, R.R.; Rold’an-Arjona, T.; David, L.; Zhu, J.K. ROS1, a repressor of transcriptional gene silencing in Arabidopsis, encodes a DNA glycosylase/lyase. Cell 2002, 111, 803–814. [Google Scholar] [CrossRef] [Green Version]
- Agius, F.; Kapoor, A.; Zhu, J.K. Role of the Arabidopsis DNA glycosylase/lyase ROS1 in active DNA demethylation. Proc. Natl. Acad. Sci. USA 2006, 103, 11796–11801. [Google Scholar] [CrossRef] [PubMed] [Green Version]
- Zhu, C.; Zhang, S.T.; Zhou, C.Z.; Chen, L.; Fu, H.F.; Li, X.Z.; Lin, Y.L.; Lai, Z.Z.; Guo, Y.Q. Genome-wide investigation and transcriptional analysis of cytosine-5 DNA methyltransferase and DNA demethylase gene families in tea plant (Camellia sinensis) under abiotic stress and withering processing. PeerJ 2020, 8, e8432. [Google Scholar] [CrossRef] [Green Version]
- Baurens, F.C.; Nicolleau, J.; Legavre, T.; Verdeil, J.L.; Monteuuis, O. Genomic DNA methylation of juvenile and mature Acacia mangium micropropagated in vitro with reference to leaf morphology as a phase change marker. Tree Physiol. 2004, 24, 401–407. [Google Scholar] [CrossRef] [PubMed]
- Zhang, X.; Yazaki, J.; Sundaresan, A.; Cokus, S.; Chan, S.W.L.; Chen, H.; Henderson, I.; Shinn, P.; Pellegrini, M.; Jacobsen, S.E.; et al. Genome-wide high-resolution mapping and functional analysis of DNA methylation in Arabidopsis. Cell 2006, 126, 1189–1201. [Google Scholar] [CrossRef] [Green Version]
- Widman, N.; Feng, S.; Jacobsen, S.E.; Pellegrini, M. Epigenetic differences between shoots and roots in Arabidopsis reveals tissue-specific regulation. Epigenetics 2014, 9, 236–242. [Google Scholar] [CrossRef] [Green Version]
- Mankessi, F.; Saya, A.R.; Favreau, B.; Doulbeau, S.; Conéjéro, G.; Lartaud, M.; Verdeil, J.L.; Monteuuis, O. Variations of DNA methylation in Eucalyptus urophylla × Eucalyptus grandis shoot tips and apical meristems of different physiological ages. Physiol. Plant 2011, 143, 178–187. [Google Scholar] [CrossRef]
- Park, J.S.; Frost, J.; Park, K.; Ohr, H.; Park, G.T.; Kim, S.; Eom, H.; Lee, I.; Brooks, J.S.; Fischer, R.L.; et al. Control of DEMETER DNA demethylase gene transcription in male and female gamete companion cells in Arabidopsis thaliana. Proc. Natl. Acad. Sci. USA 2017, 114, 2078–2083. [Google Scholar] [CrossRef] [PubMed] [Green Version]
- Bartels, A.; Han, Q.; Nair, P.; Stacey, L.; Gaynier, H.; Mosley, M.; Huang, Q.Q.; Pearson, J.K.; Hsieh, T.F.; An, Y.Q.C.; et al. Dynamic DNA methylation in plant growth and development. Int. J. Mol. Sci. 2018, 19, 2144. [Google Scholar] [CrossRef] [PubMed] [Green Version]
- Veluchamy, A.; Lin, X.; Maumus, F.; Rivarola, M.; Bhavsar, J.; Creasy, T.; O’Brien, K.; Sengamalay, N.A.; Tallon, L.J.; Smith, A.; et al. Insights into the role of DNA methylation in diatoms by genome-wide profiling in Phaeodactylum tricornutum. Nat. Commun. 2013, 4, 2091. [Google Scholar] [CrossRef] [PubMed] [Green Version]
- Feng, S.; Jacobsen, S.E.; Reik, W. Epigenetic reprogramming in plant and animal development. Science 2010, 330, 622–627. [Google Scholar] [CrossRef] [Green Version]
- Kronholm, I.; Bassett, A.; Baulcombe, D.; Collins, S. Epigenetic and genetic contributions to adaptation in Chlamydomonas. Mol. Biol. Evol. 2017, 34, 2285–2306. [Google Scholar] [CrossRef] [Green Version]
- Cock, J.M.; Coelho, S.M.; Brownlee, C.; Taylor, A.R. The Ectocarpus genome sequence: Insights into brown algal biology and the evolutionary diversity of the eukaryotes. New Phytol. 2010, 188, 1–4. [Google Scholar] [CrossRef] [PubMed]
- Fan, X.; Han, W.; Teng, L.; Jiang, P.; Zhang, X.; Xu, D.; Li, C.; Pellegrini, M.; Wu, C.; Wang, Y.; et al. Single-base methylome profiling of the giant kelp Saccharina japonica reveals significant differences in DNA methylation to microalgae and plants. New Phytol. 2020, 225, 234–249. [Google Scholar] [CrossRef] [Green Version]
- Wang, X.; Chen, Z.; Li, Q.; Zhang, J.; Liu, S.; Duan, D. High-density SNP-based QTL mapping and candidate gene screening for yield-related blade length and width in Saccharina japonica (Laminariales, Phaeophyta). Sci. Rep. 2018, 8, 1–10. [Google Scholar] [CrossRef] [Green Version]
- Lopez, D.A.; Hamaji, T.; Kropat, J.; De Hoff, P.; Morselli, M.; Rubbi, L.; Fitz-Gibbon, S.T.; Gallaher, S.D.; Merchant, S.S.; Umen, J.G.; et al. Dynamic changes in the transcriptome and methylome of Chlamydomonas reinhardtii throughout its life cycle. Plant Physiol. 2015, 169, 2730–2743. [Google Scholar] [CrossRef] [Green Version]
- Song, Q.X.; Lu, X.; Li, Q.T.; Chen, H.; Hu, X.Y.; Ma, B.; Zhang, W.K.; Chen, S.Y.; Zhang, J.S. Genome-Wide Analysis of DNA Methylation in Soybean. Mol. Plant 2013, 6, 1961–1974. [Google Scholar] [CrossRef] [Green Version]
- Bolon, Y.T.; Joseph, B.; Cannon, S.B.; Graham, M.A.; Diers, B.W.; Farmer, A.D.; May, G.D.; Muehlbauer, G.J.; Specht, J.E.; Tu, Z.J.; et al. Complementary genetic and genomic approaches help characterize the linkage group I seed protein QTL in soybean. BMC Plant Biol. 2010, 10, 41. [Google Scholar] [CrossRef] [PubMed] [Green Version]
- Shao, Z.R.; Zhang, P.Y.; Lu, C.; Li, S.X.; Chen, Z.H.; Wang, X.L.; Duan, D.L. Transcriptome sequencing of Saccharina japonica sporophytes during whole developmental periods reveals regulatory networks underlying alginate and mannitol biosynthesis. BMC Genom. 2019, 20, 975. [Google Scholar] [CrossRef] [Green Version]
- Michel, G.; Tonon, T.; Scornet, D.; Cock, J.M.; Kloareg, B. The cell wall polysaccharide metabolism of the brown alga Ectocarpus siliculosus. Insights into the evolution of extracellular matrix polysaccharides in Eukaryotes. New Phytol. 2010, 188, 82–97. [Google Scholar] [CrossRef] [PubMed]
- Inoue, A.; Ojima, T. Functional identification of alginate lyase from the brown alga Saccharina japonica. Sci. Rep. 2019, 9, 4937. [Google Scholar] [CrossRef] [PubMed] [Green Version]
- Zhao, H.; Sun, P.; Fan, T.P.; Yang, X.H.; Zheng, T.Z.; Sun, C.K. The effect of glutamate-induced excitotoxicity on DNA methylation in astrocytes in a new in vitro neuron-astrocyte-endothelium co-culture system. Biochem. Biophys. Res. Commun. 2019, 508, 1209–1214. [Google Scholar] [CrossRef]


| Sample | Number of Clean Reads (Millions) | Unique Beast-Mapped Reads | Bisulfite Conversion Rate (%) | |
|---|---|---|---|---|
| Number (Millions, % of Clean Reads) | Genome Coverage (%) | |||
| B1 | 50.87 | 24.19 (47.55) | 83.47 | 99.45 |
| B2 | 55.43 | 27.14 (48.97) | 83.54 | 99.39 |
| B3 | 59.63 | 38.22 (64.09) | 85.45 | 99.49 |
| H1 | 56.79 | 32.66 (57.51) | 85.05 | 99.4 |
| H2 | 65.99 | 38.32 (58.08) | 86.05 | 99.39 |
| H3 | 56.65 | 26.36 (46.53) | 84.35 | 99.41 |
| S1 | 53.99 | 32.09 (59.43) | 85.21 | 99.44 |
| S2 | 56.97 | 28.52 (50.05) | 84.03 | 99.45 |
| S3 | 54.36 | 26.67 (49.07) | 84.20 | 99.44 |
| Total | 510.68 | 274.17 (53.48) | - | - |
| Group | Type | Gene ID | Chr | Region | Annotation |
|---|---|---|---|---|---|
| B vs. H | CG | EVM0005705 | LG06 | Intron | Expressed unknown protein |
| CG | EVM0014824 | LG16 | Intron | Acetyl-CoA acetyltransferase | |
| CG | EVM0003628 | LG17 | Distal Intergenic | Phosphatidylinositol transfer protein SEC14 and related proteins | |
| CHG | EVM0000314 | LG11 | Distal Intergenic | Ultraviolet-B receptor UVR8 | |
| CHG | EVM0009498 | LG24 | Intron | Probable tRNA modification GTPase MnmE | |
| CHG | EVM0013175 | LG14 | Intron | Conserved unknown protein | |
| CHG | EVM0015260 | LG05 | Distal Intergenic | Conserved unknown protein | |
| B vs. S | CG | EVM0007843 | LG14 | Distal Intergenic | Conserved unknown protein |
| CG | EVM0003628 | LG17 | Distal Intergenic | Phosphatidylinositol transfer protein SEC14 and related proteins | |
| CHG | EVM0005994 | LG20 | Intron | Villin | |
| CHG | EVM0009069 | LG28 | Intron | Conserved unknown protein | |
| CHG | EVM0000732 | LG11 | Distal Intergenic | Conserved unknown protein | |
| CHG | EVM0010537 | LG24 | Distal Intergenic | Conserved unknown protein | |
| CHG | EVM0016237 | LG21 | Distal Intergenic | Expressed unknown protein | |
| CHG | EVM0016549 | LG11 | Promoter | Hypothetical protein Esi00670105 | |
| H vs. S | CG | EVM0006317 | LG14 | Distal Intergenic | Tetratricopeptide repeat containing protein |
| CG | EVM0013389 | LG25 | Distal Intergenic | Conserved unknown protein | |
| CG | EVM0001259 | LG26 | Intron | Periplasmic binding protein | |
| CHG | EVM0010537 | LG24 | Distal Intergenic | Conserved unknown protein |
| Pathway | Gene ID | Gene Annotiation | B vs. H | B vs. S | H vs. S |
|---|---|---|---|---|---|
| Cell motility | EVM0003386 | NB-ARC and TPR repeat-containing protein | ● | ● | ● |
| EVM0008642 | NB-ARC and TPR repeat-containing protein | ● | ● | ● | |
| EVM0007683 | NB-ARC and TPR repeat-containing protein | ● | ● | ● | |
| EVM0005188 | NB-ARC and TPR repeat-containing protein | ● | ● | ● | |
| Cell cycle | EVM0004313 | Cdc2-related protein kinase | ● | ● | ● |
| EVM0009233 | Asn/thr-rich large protein family protein | ● | ● | ● | |
| Cell wall/membrane biogenesis | EVM0014756 | Ankyrin repeat | ● | ● | ● |
| EVM0006136 | D-isomer specific 2-hydroxyacid dehydrogenase | ● | ● | ● | |
| EVM0015189 | Zinc metalloprotease EGY3 | ● | ● | ● | |
| EVM0015061 | Endo-1,3-beta-glucanase, family GH81 | ● | ● | ● | |
| Intracellular trafficking, secretion, and vesicular transport | EVM0001662 | Glycine dehydrogenase, mitochondrial | ● | ● | ● |
| EVM0006566 | Plastid Ffh subunit of the signal recognition particle | ● | ● | ● | |
| EVM0003888 | Camkk-meta protein kinase | ● | ● | ● | |
| EVM0015686 | Small Conductance Mechanosensitive Ion channel | ● | ● | ● | |
| EVM0004673 | Uric acid-xanthine permease | ● | ● | ● | |
| EVM0013751 | Protein zinc induced facilitator1 | ● | ● | ● | |
| Signal transduction | EVM0004728 | Serine/threonine-protein kinase | ● | ● | ● |
| EVM0015398 | Respiratory burst oxidase homolog protein B | ● | ● | ● | |
| EVM0004327 | Guanylyl cyclase | ● | ● | ● |
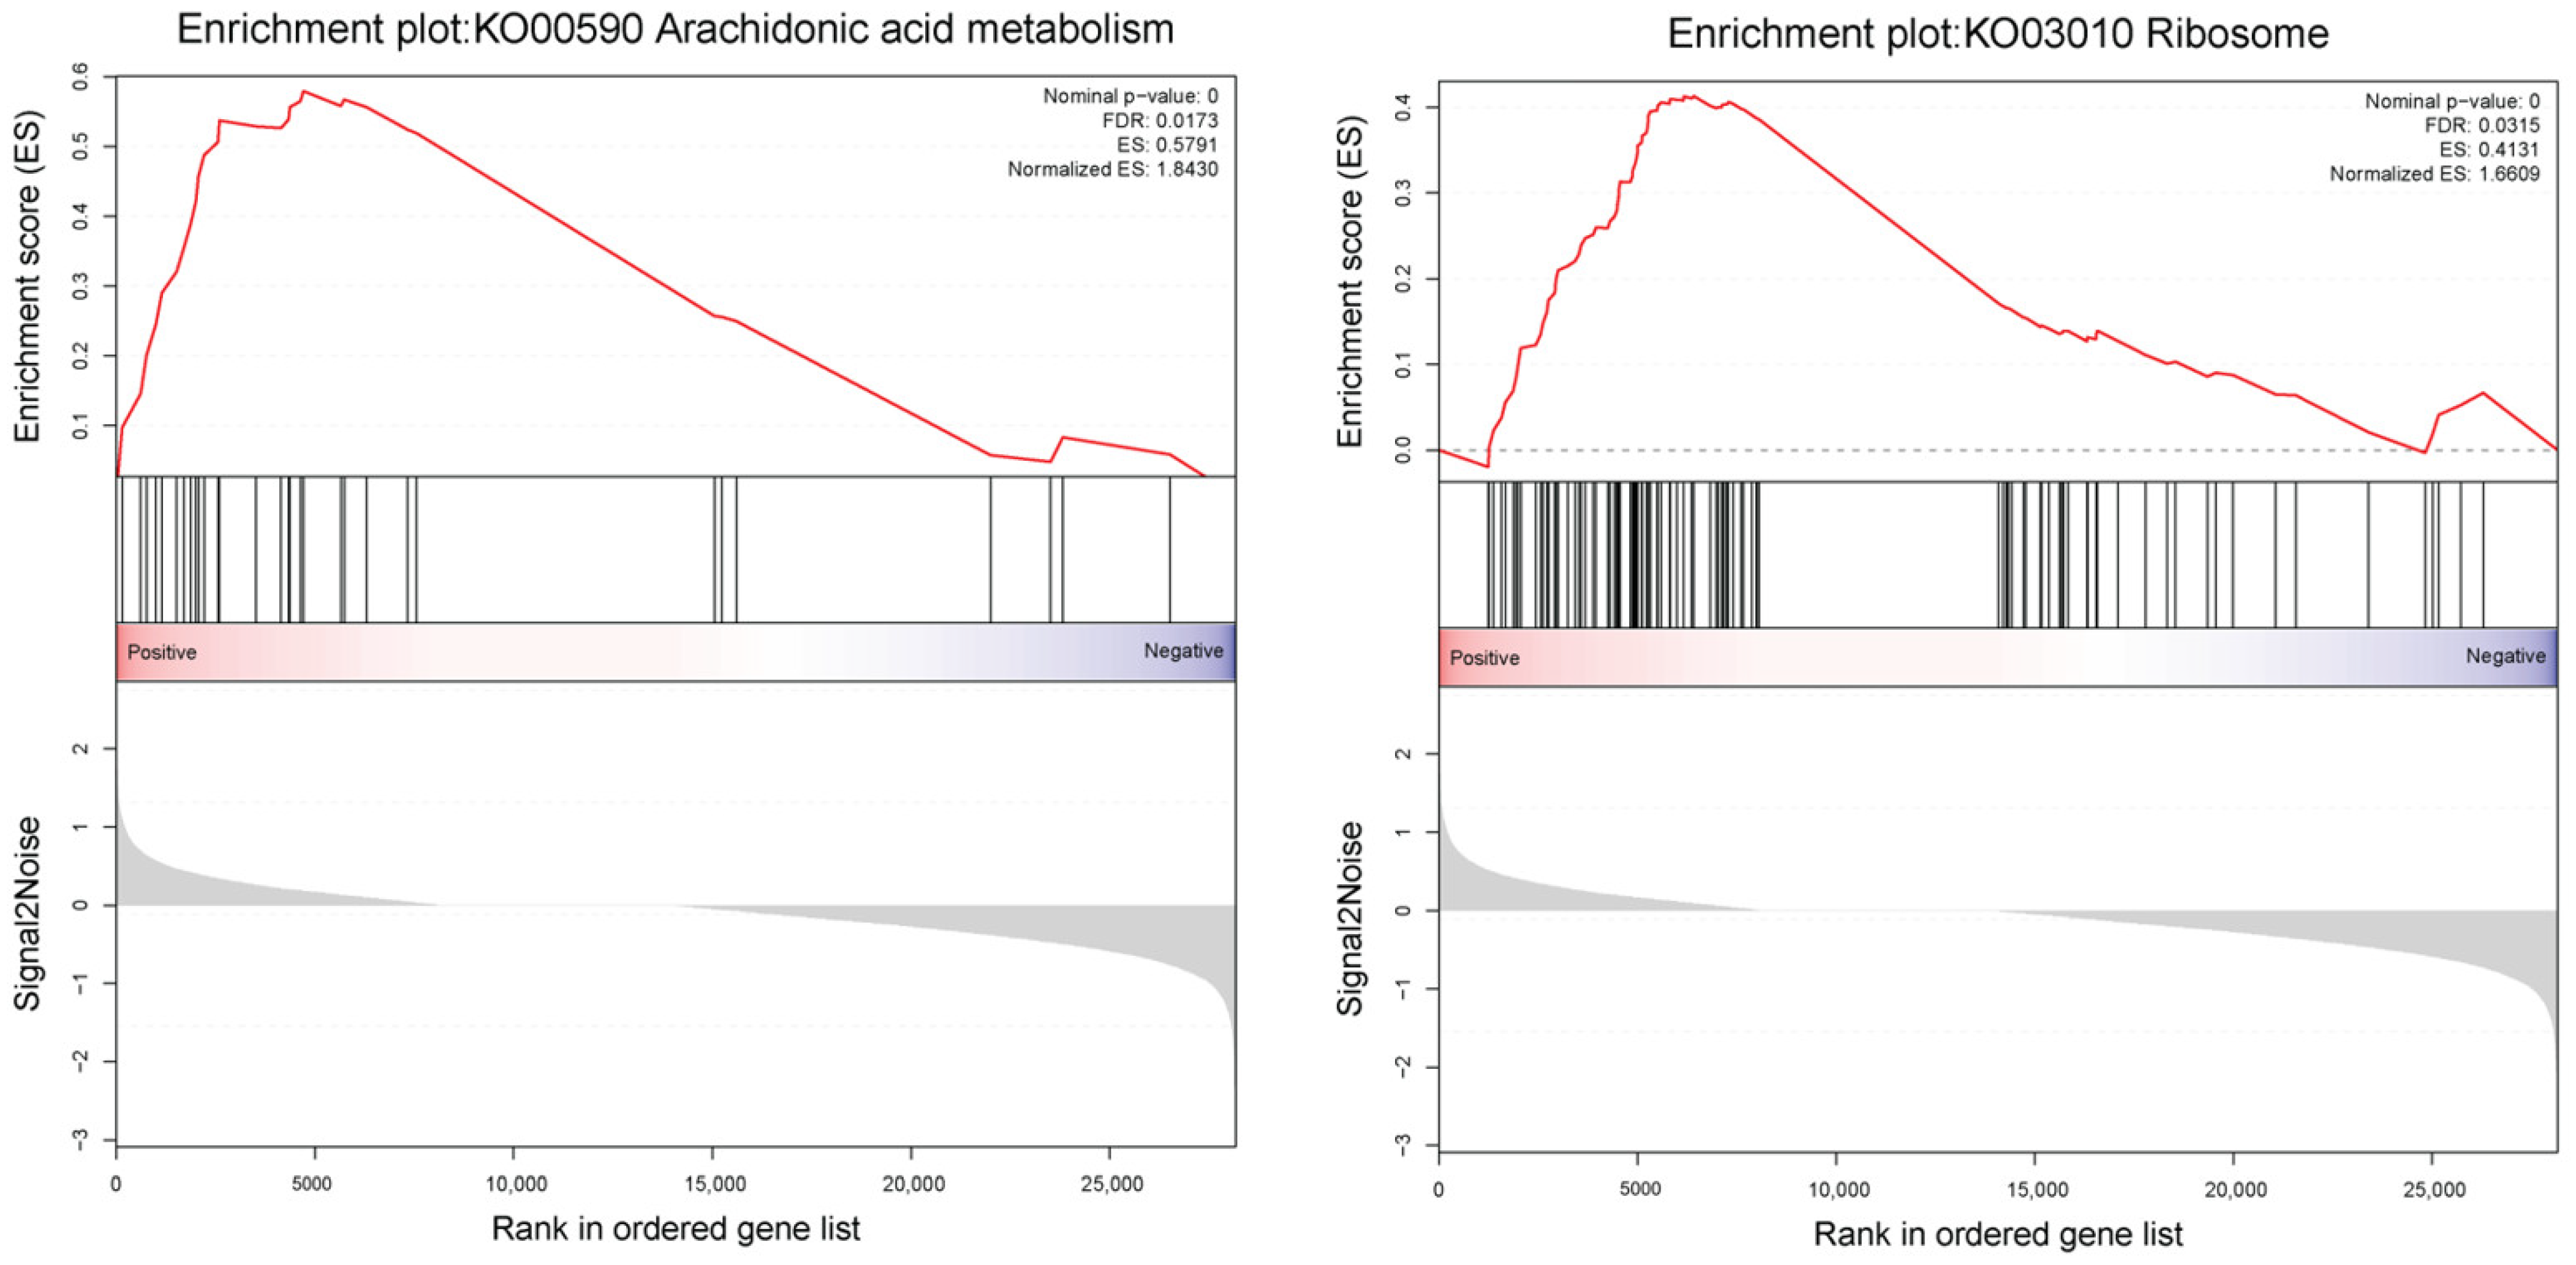
| Pathway | Description | ES | NES | p-Val. | q-Val. |
|---|---|---|---|---|---|
| KO00590 | Arachidonic acid metabolism | 0.58 | 1.84 | 0 | 0.01 |
| KO03010 | Ribosome | 0.41 | 1.66 | 0 | 0.03 |
| KO00790 | Folate biosynthesis | 0.41 | 1.15 | 0.21 | 0.49 |
| KO00650 | Butanoate metabolism | 0.34 | 0.93 | 0.55 | 1.00 |
| KO00280 | Valine, leucine and isoleucin degradation | 0.26 | 0.92 | 0.75 | 0.85 |
| KO00920 | Sulfur metabolism | 0.30 | 0.84 | 0.72 | 0.90 |
| KO00190 | Oxidative phosphorylation | 0.23 | 0.84 | 0.85 | 0.77 |
Publisher’s Note: MDPI stays neutral with regard to jurisdictional claims in published maps and institutional affiliations. |
© 2021 by the authors. Licensee MDPI, Basel, Switzerland. This article is an open access article distributed under the terms and conditions of the Creative Commons Attribution (CC BY) license (https://creativecommons.org/licenses/by/4.0/).
Share and Cite
Yang, X.; Wang, X.; Yao, J.; Duan, D. Genome-Wide Mapping of Cytosine Methylation Revealed Dynamic DNA Methylation Patterns Associated with Sporophyte Development of Saccharina japonica. Int. J. Mol. Sci. 2021, 22, 9877. https://0-doi-org.brum.beds.ac.uk/10.3390/ijms22189877
Yang X, Wang X, Yao J, Duan D. Genome-Wide Mapping of Cytosine Methylation Revealed Dynamic DNA Methylation Patterns Associated with Sporophyte Development of Saccharina japonica. International Journal of Molecular Sciences. 2021; 22(18):9877. https://0-doi-org.brum.beds.ac.uk/10.3390/ijms22189877
Chicago/Turabian StyleYang, Xiaoqi, Xiuliang Wang, Jianting Yao, and Delin Duan. 2021. "Genome-Wide Mapping of Cytosine Methylation Revealed Dynamic DNA Methylation Patterns Associated with Sporophyte Development of Saccharina japonica" International Journal of Molecular Sciences 22, no. 18: 9877. https://0-doi-org.brum.beds.ac.uk/10.3390/ijms22189877