Application of Raman Spectroscopic Imaging to Assess the Structural Changes at Cell-Scaffold Interface

 ,
,  ,
,  , ,
, ,  , , and
Abstract
:
1. Introduction
2. Results
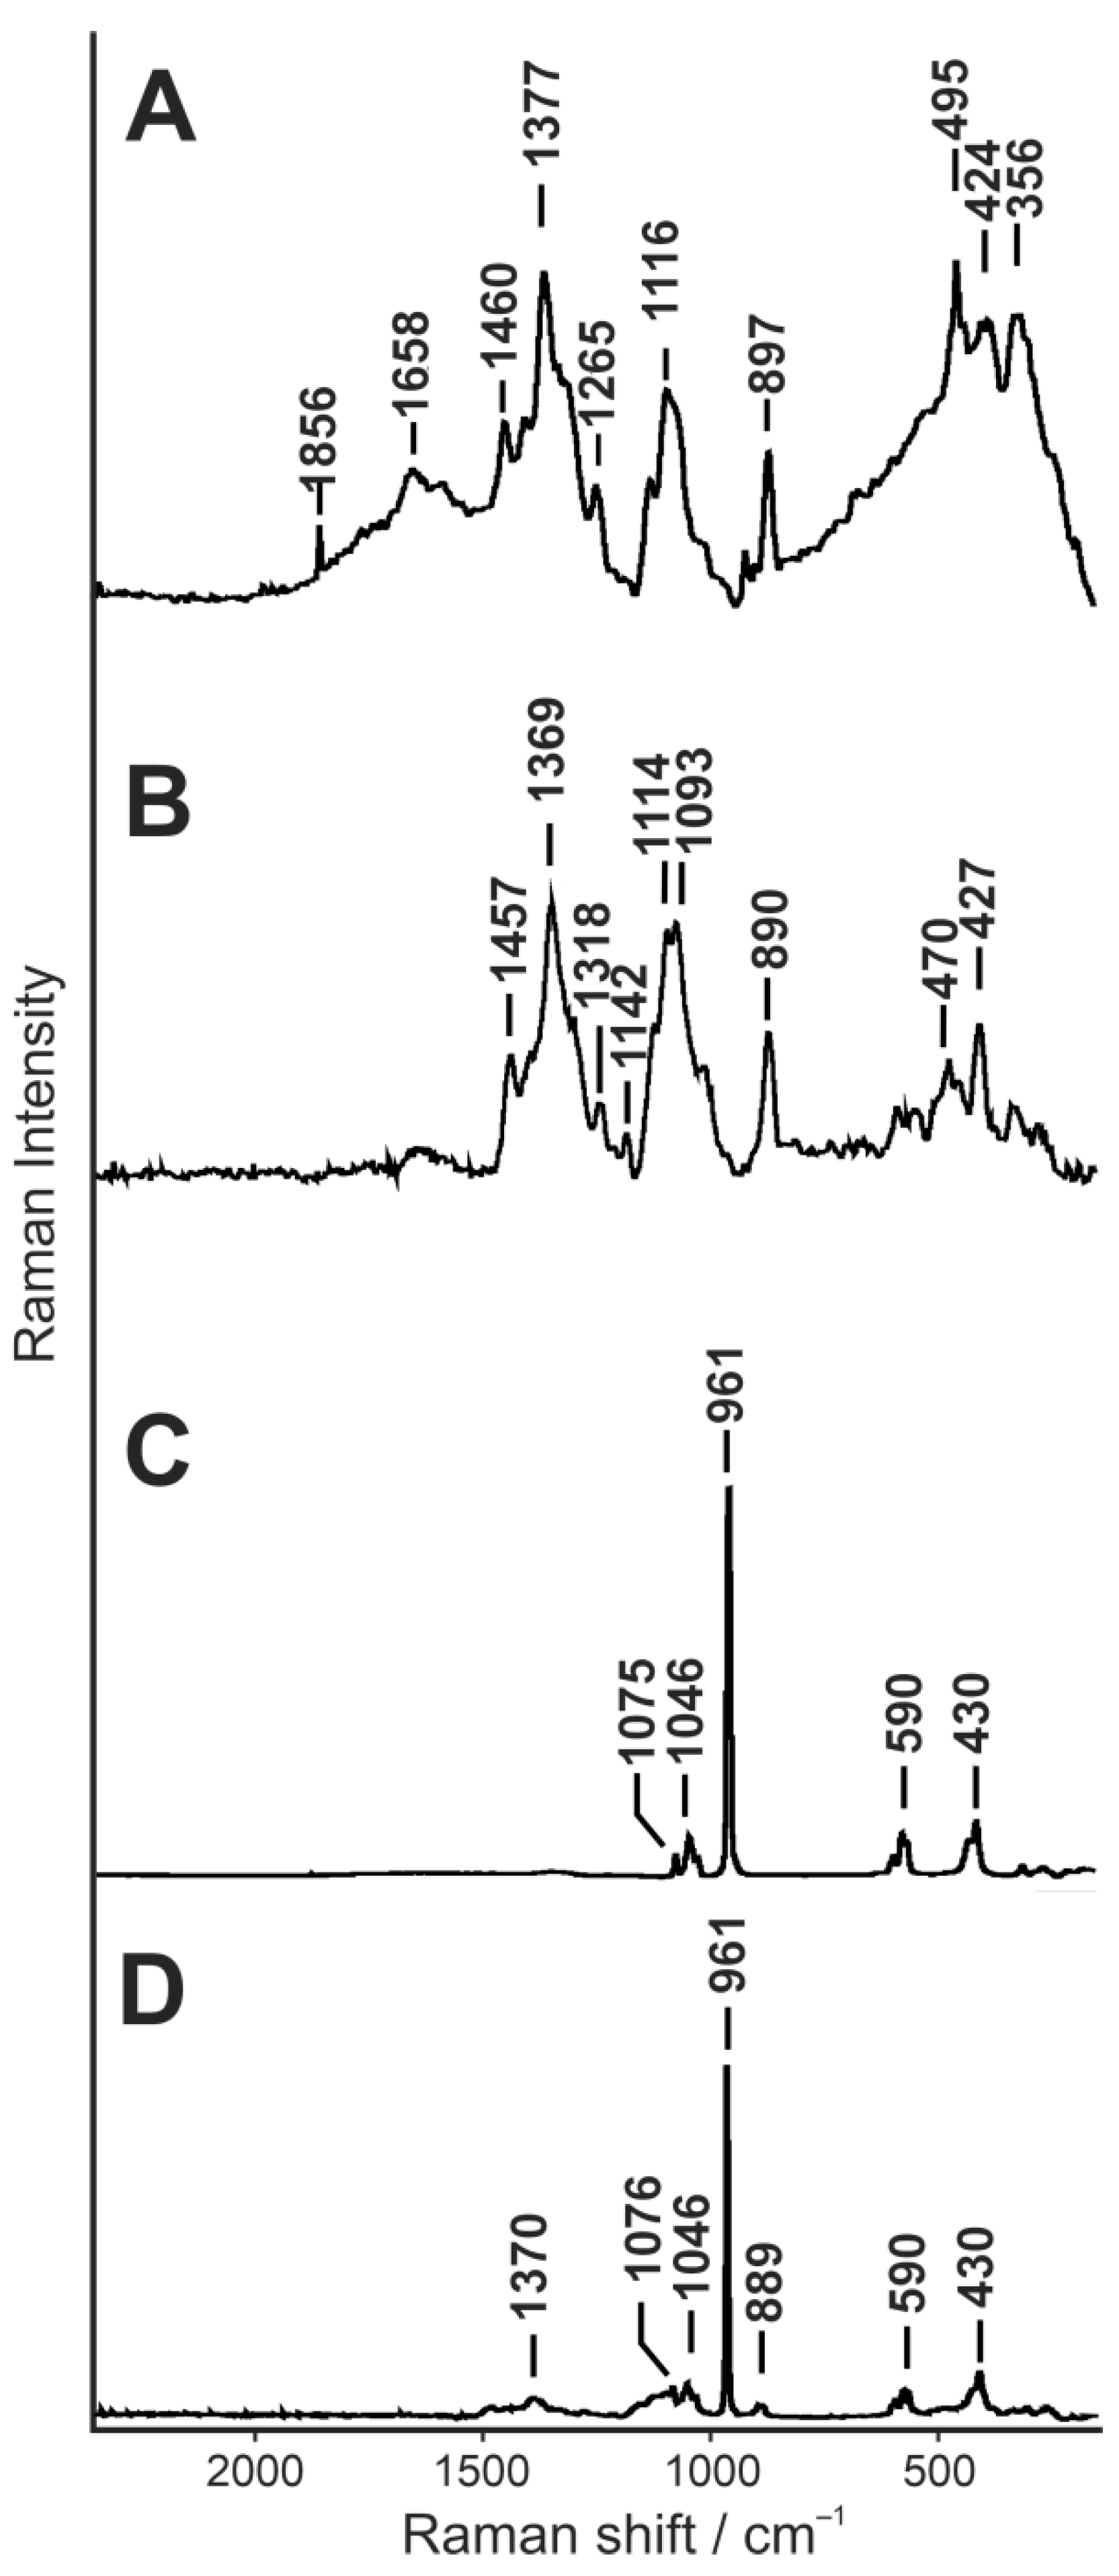
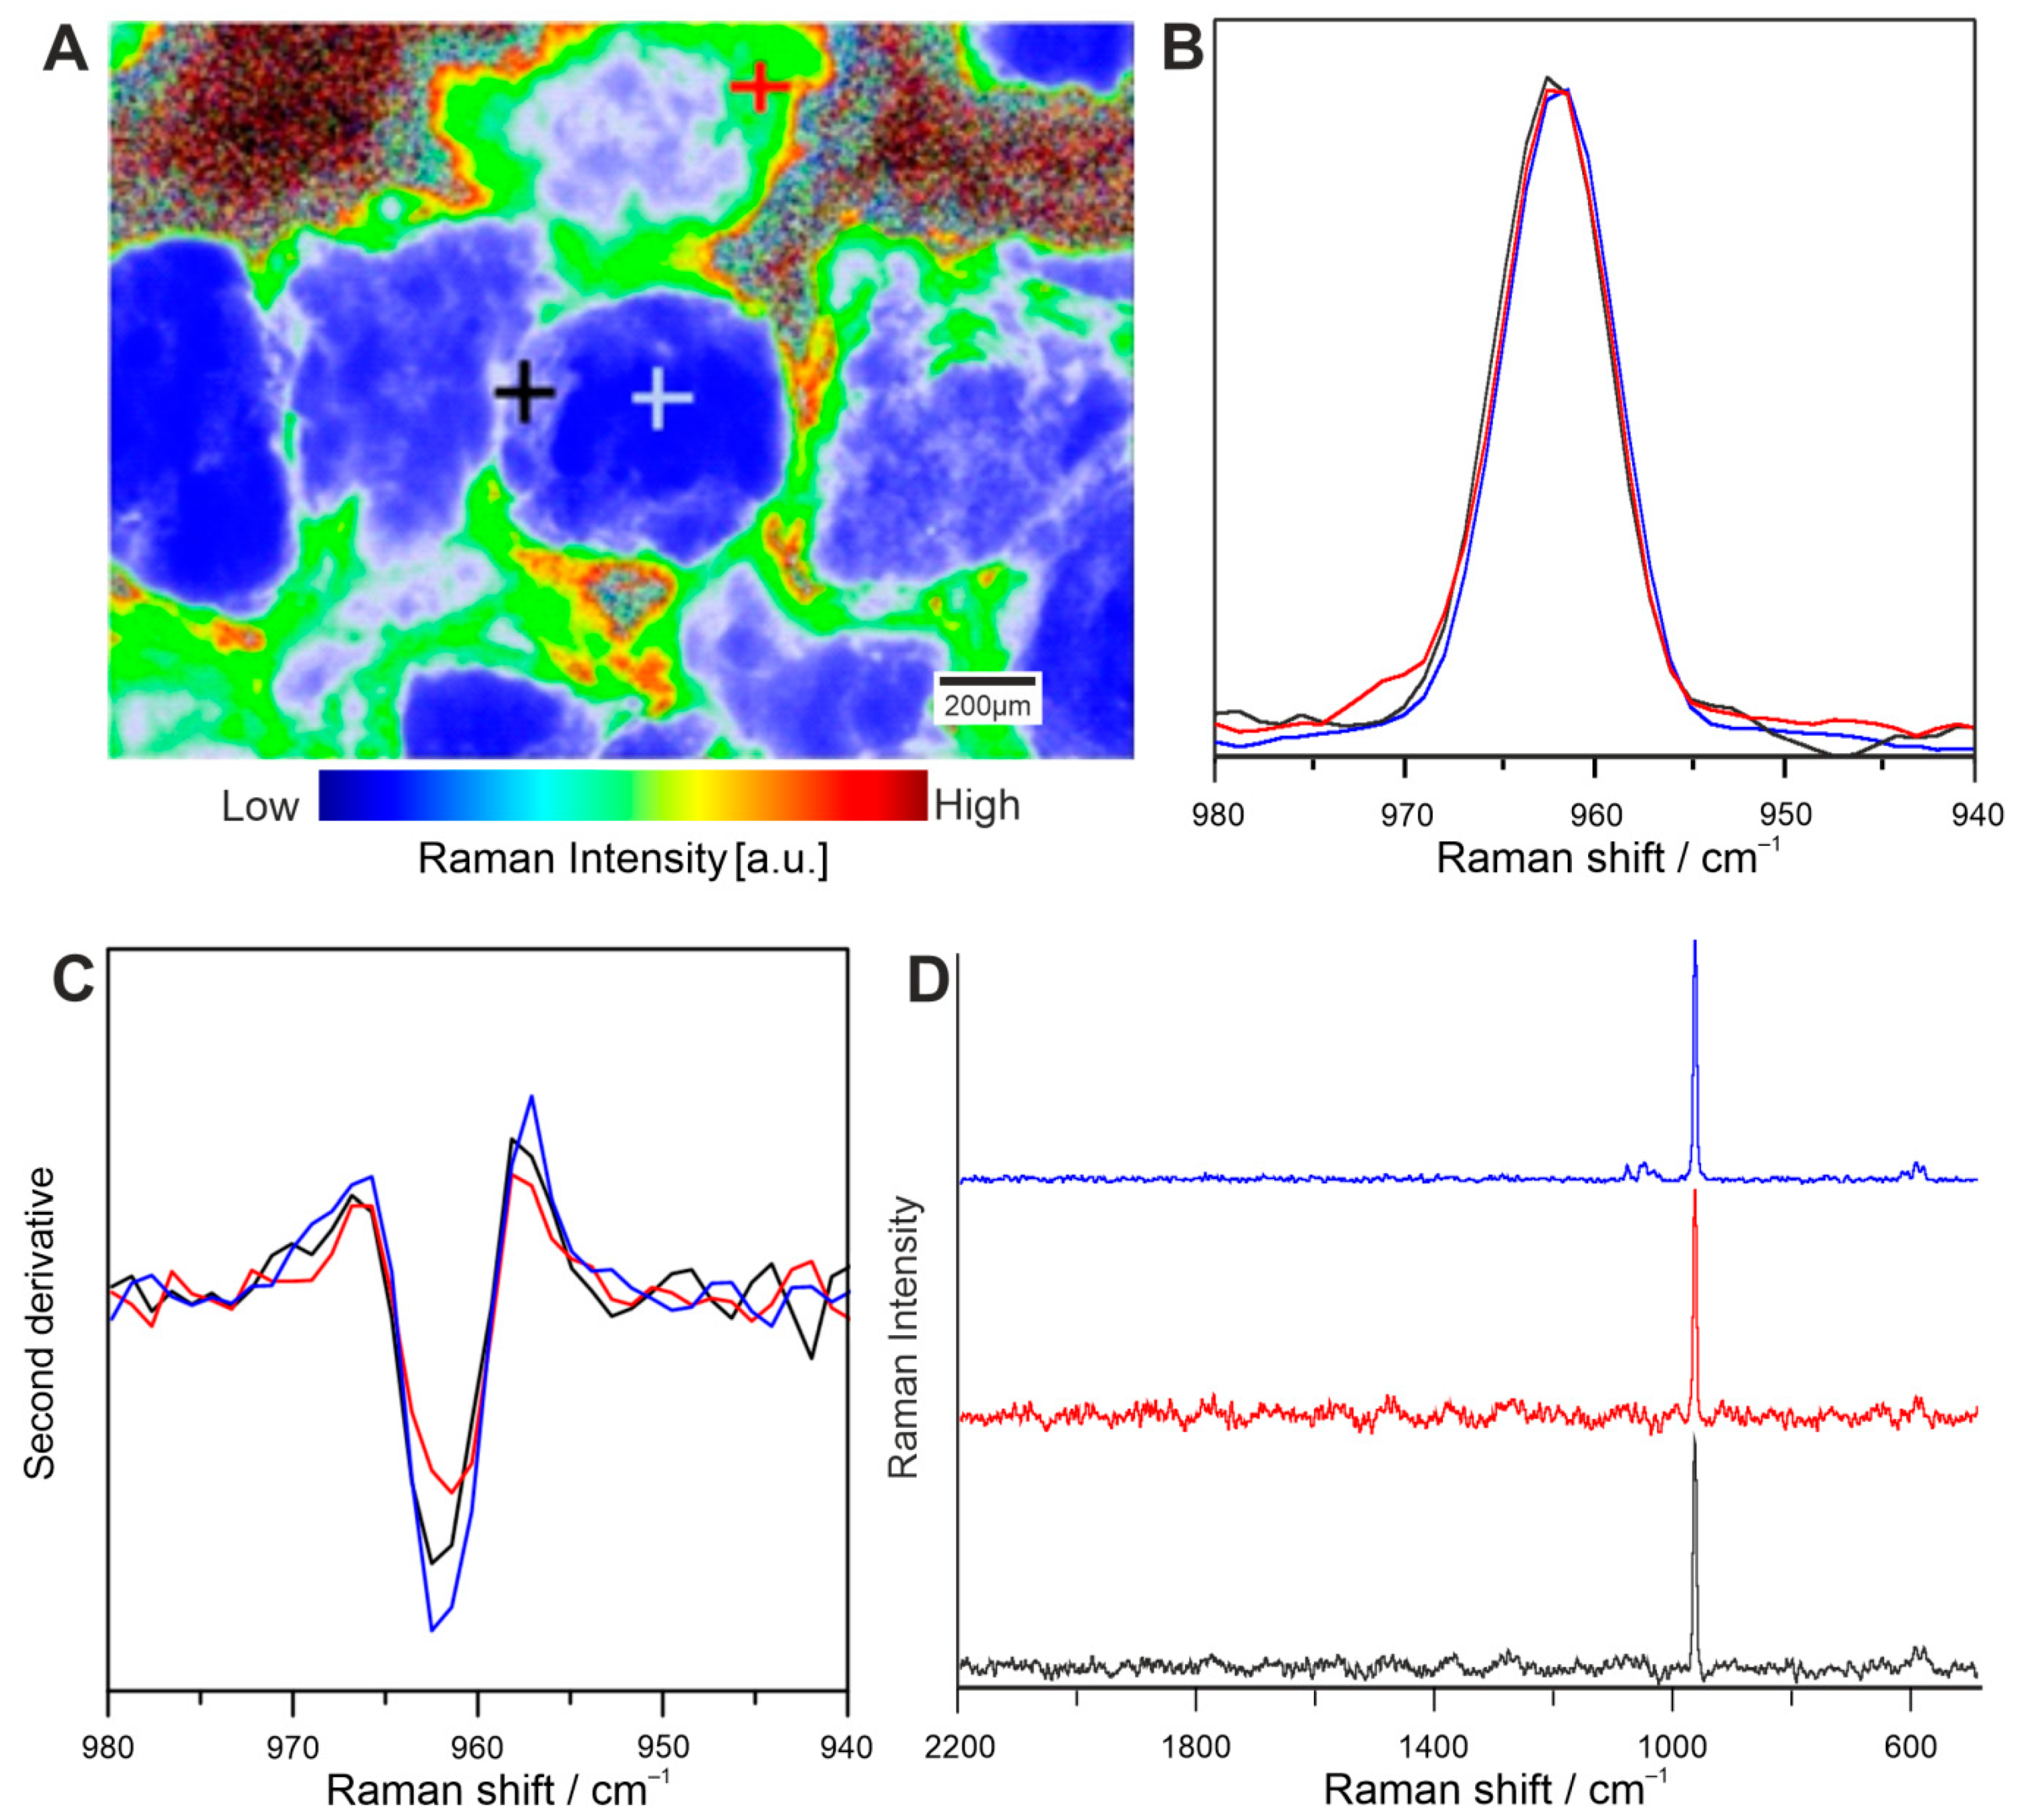
2.1. Raman Spectroscopy
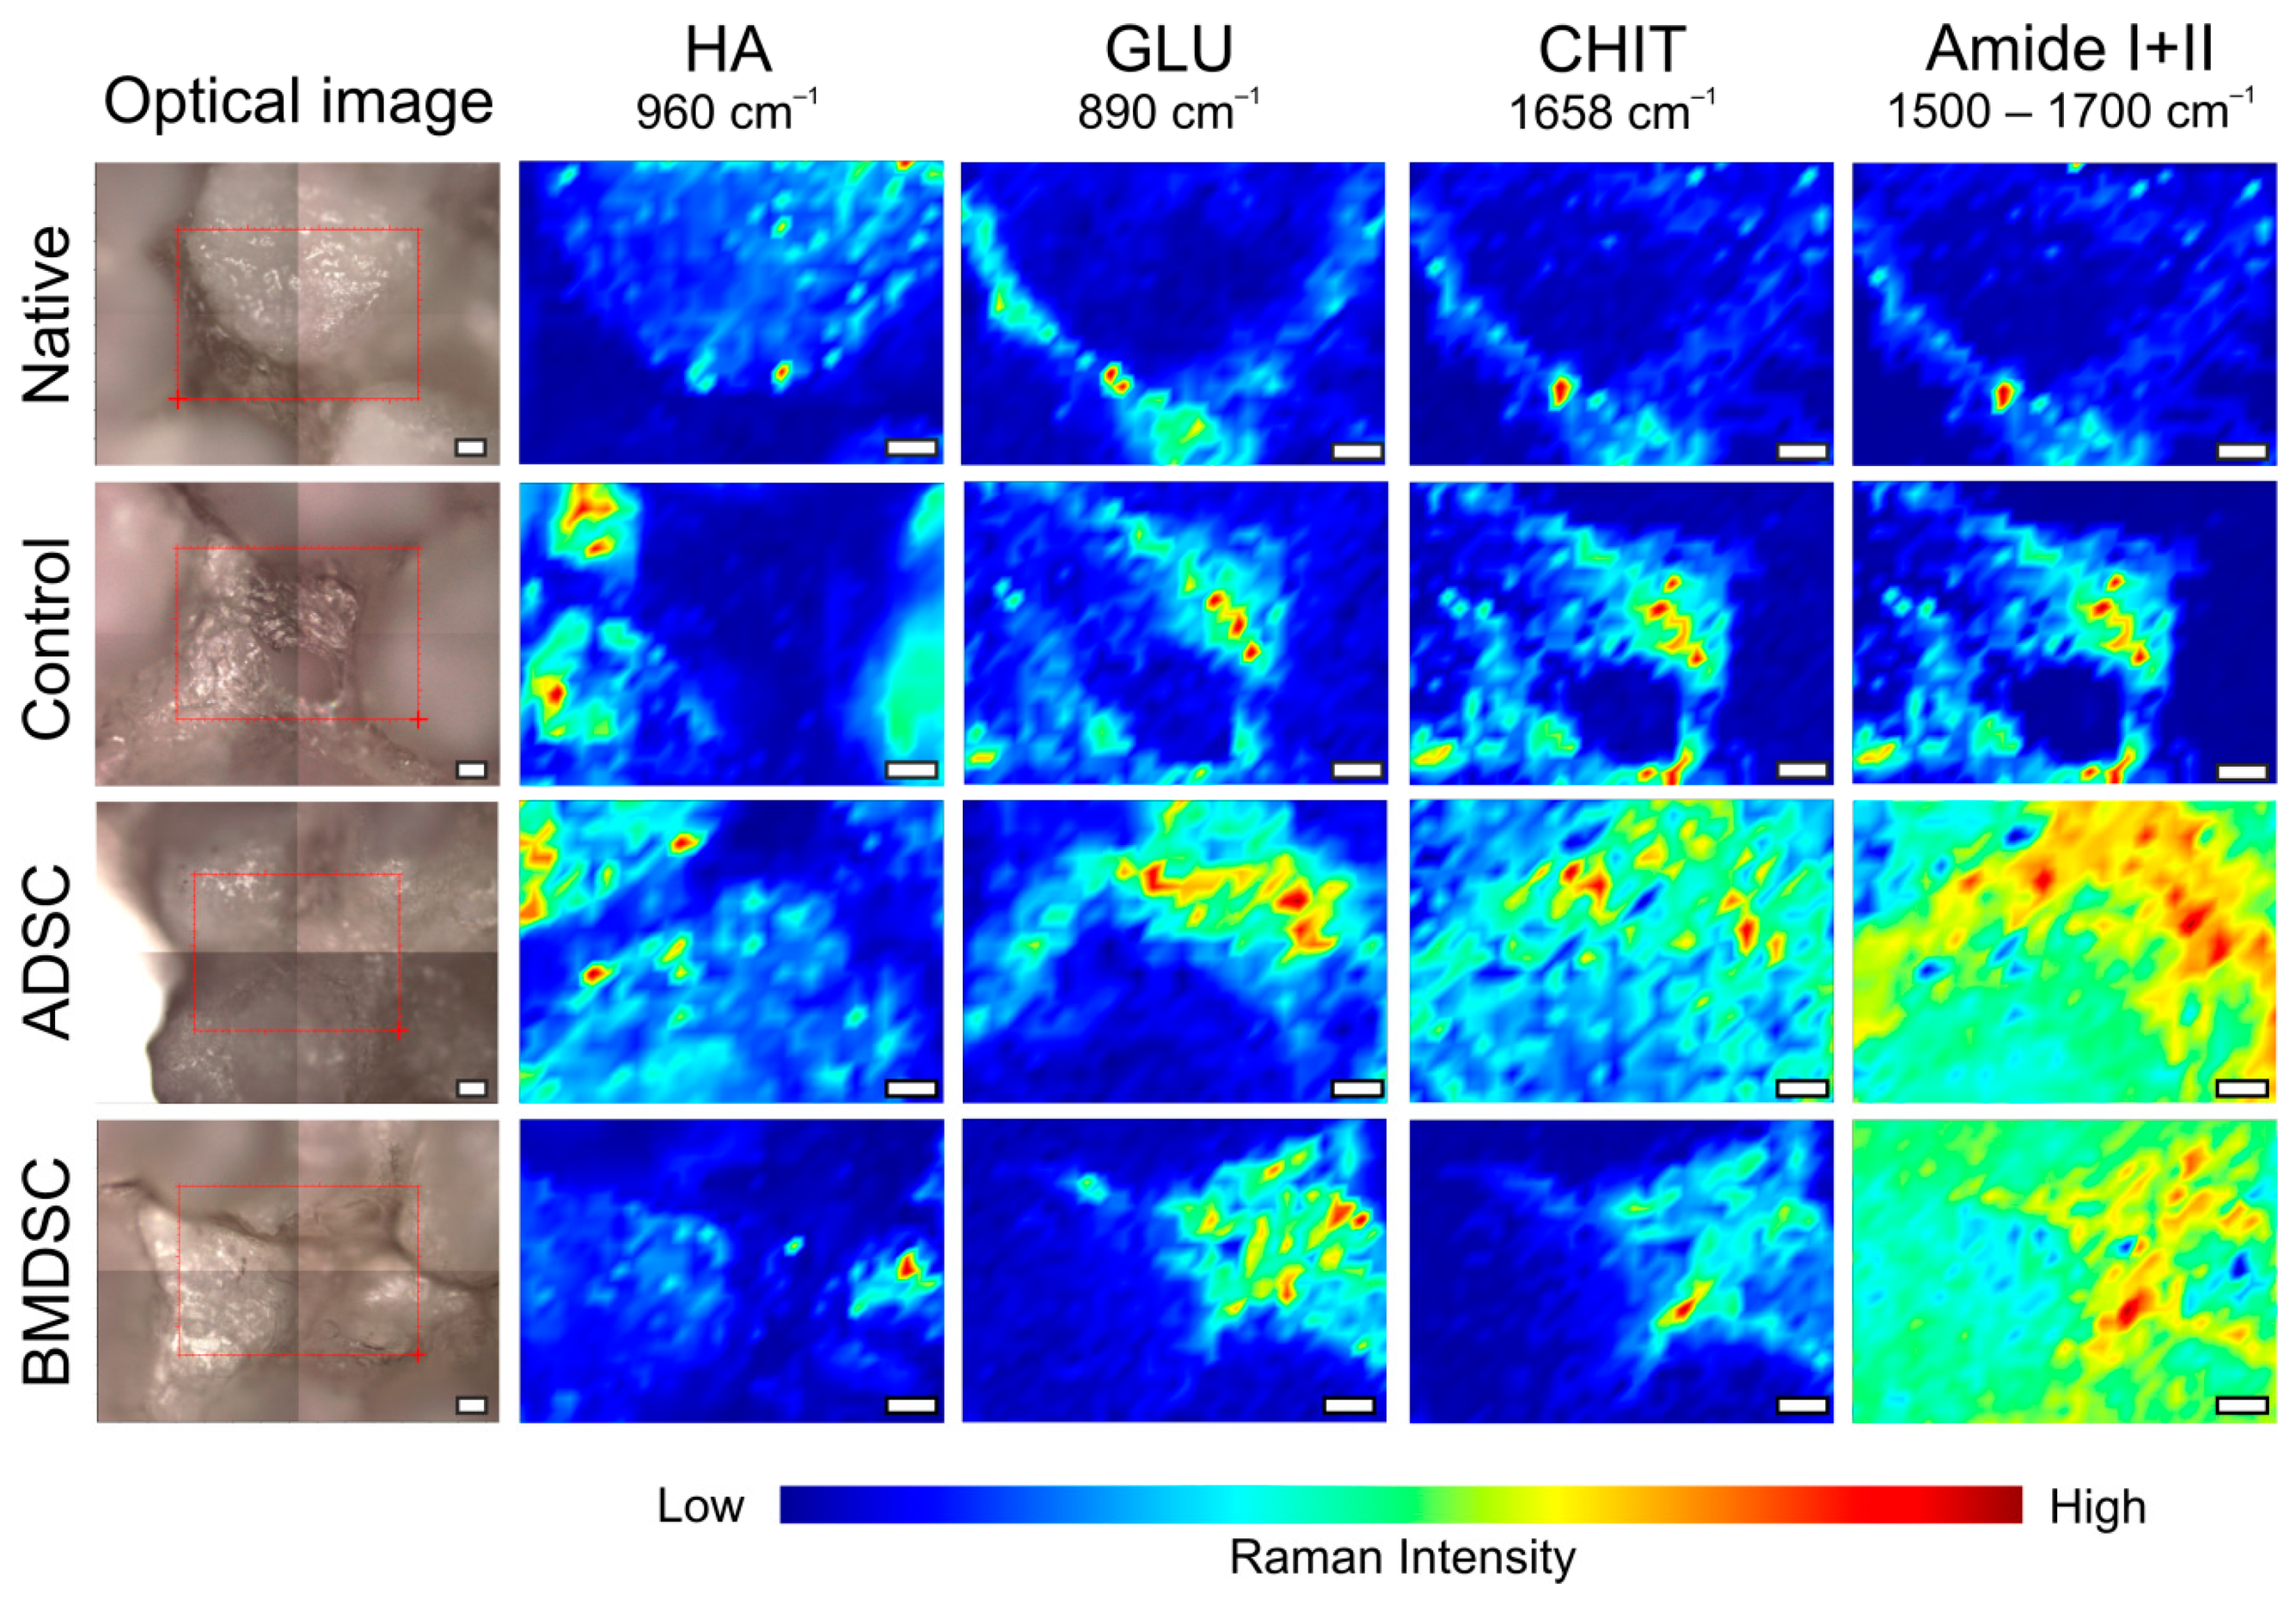
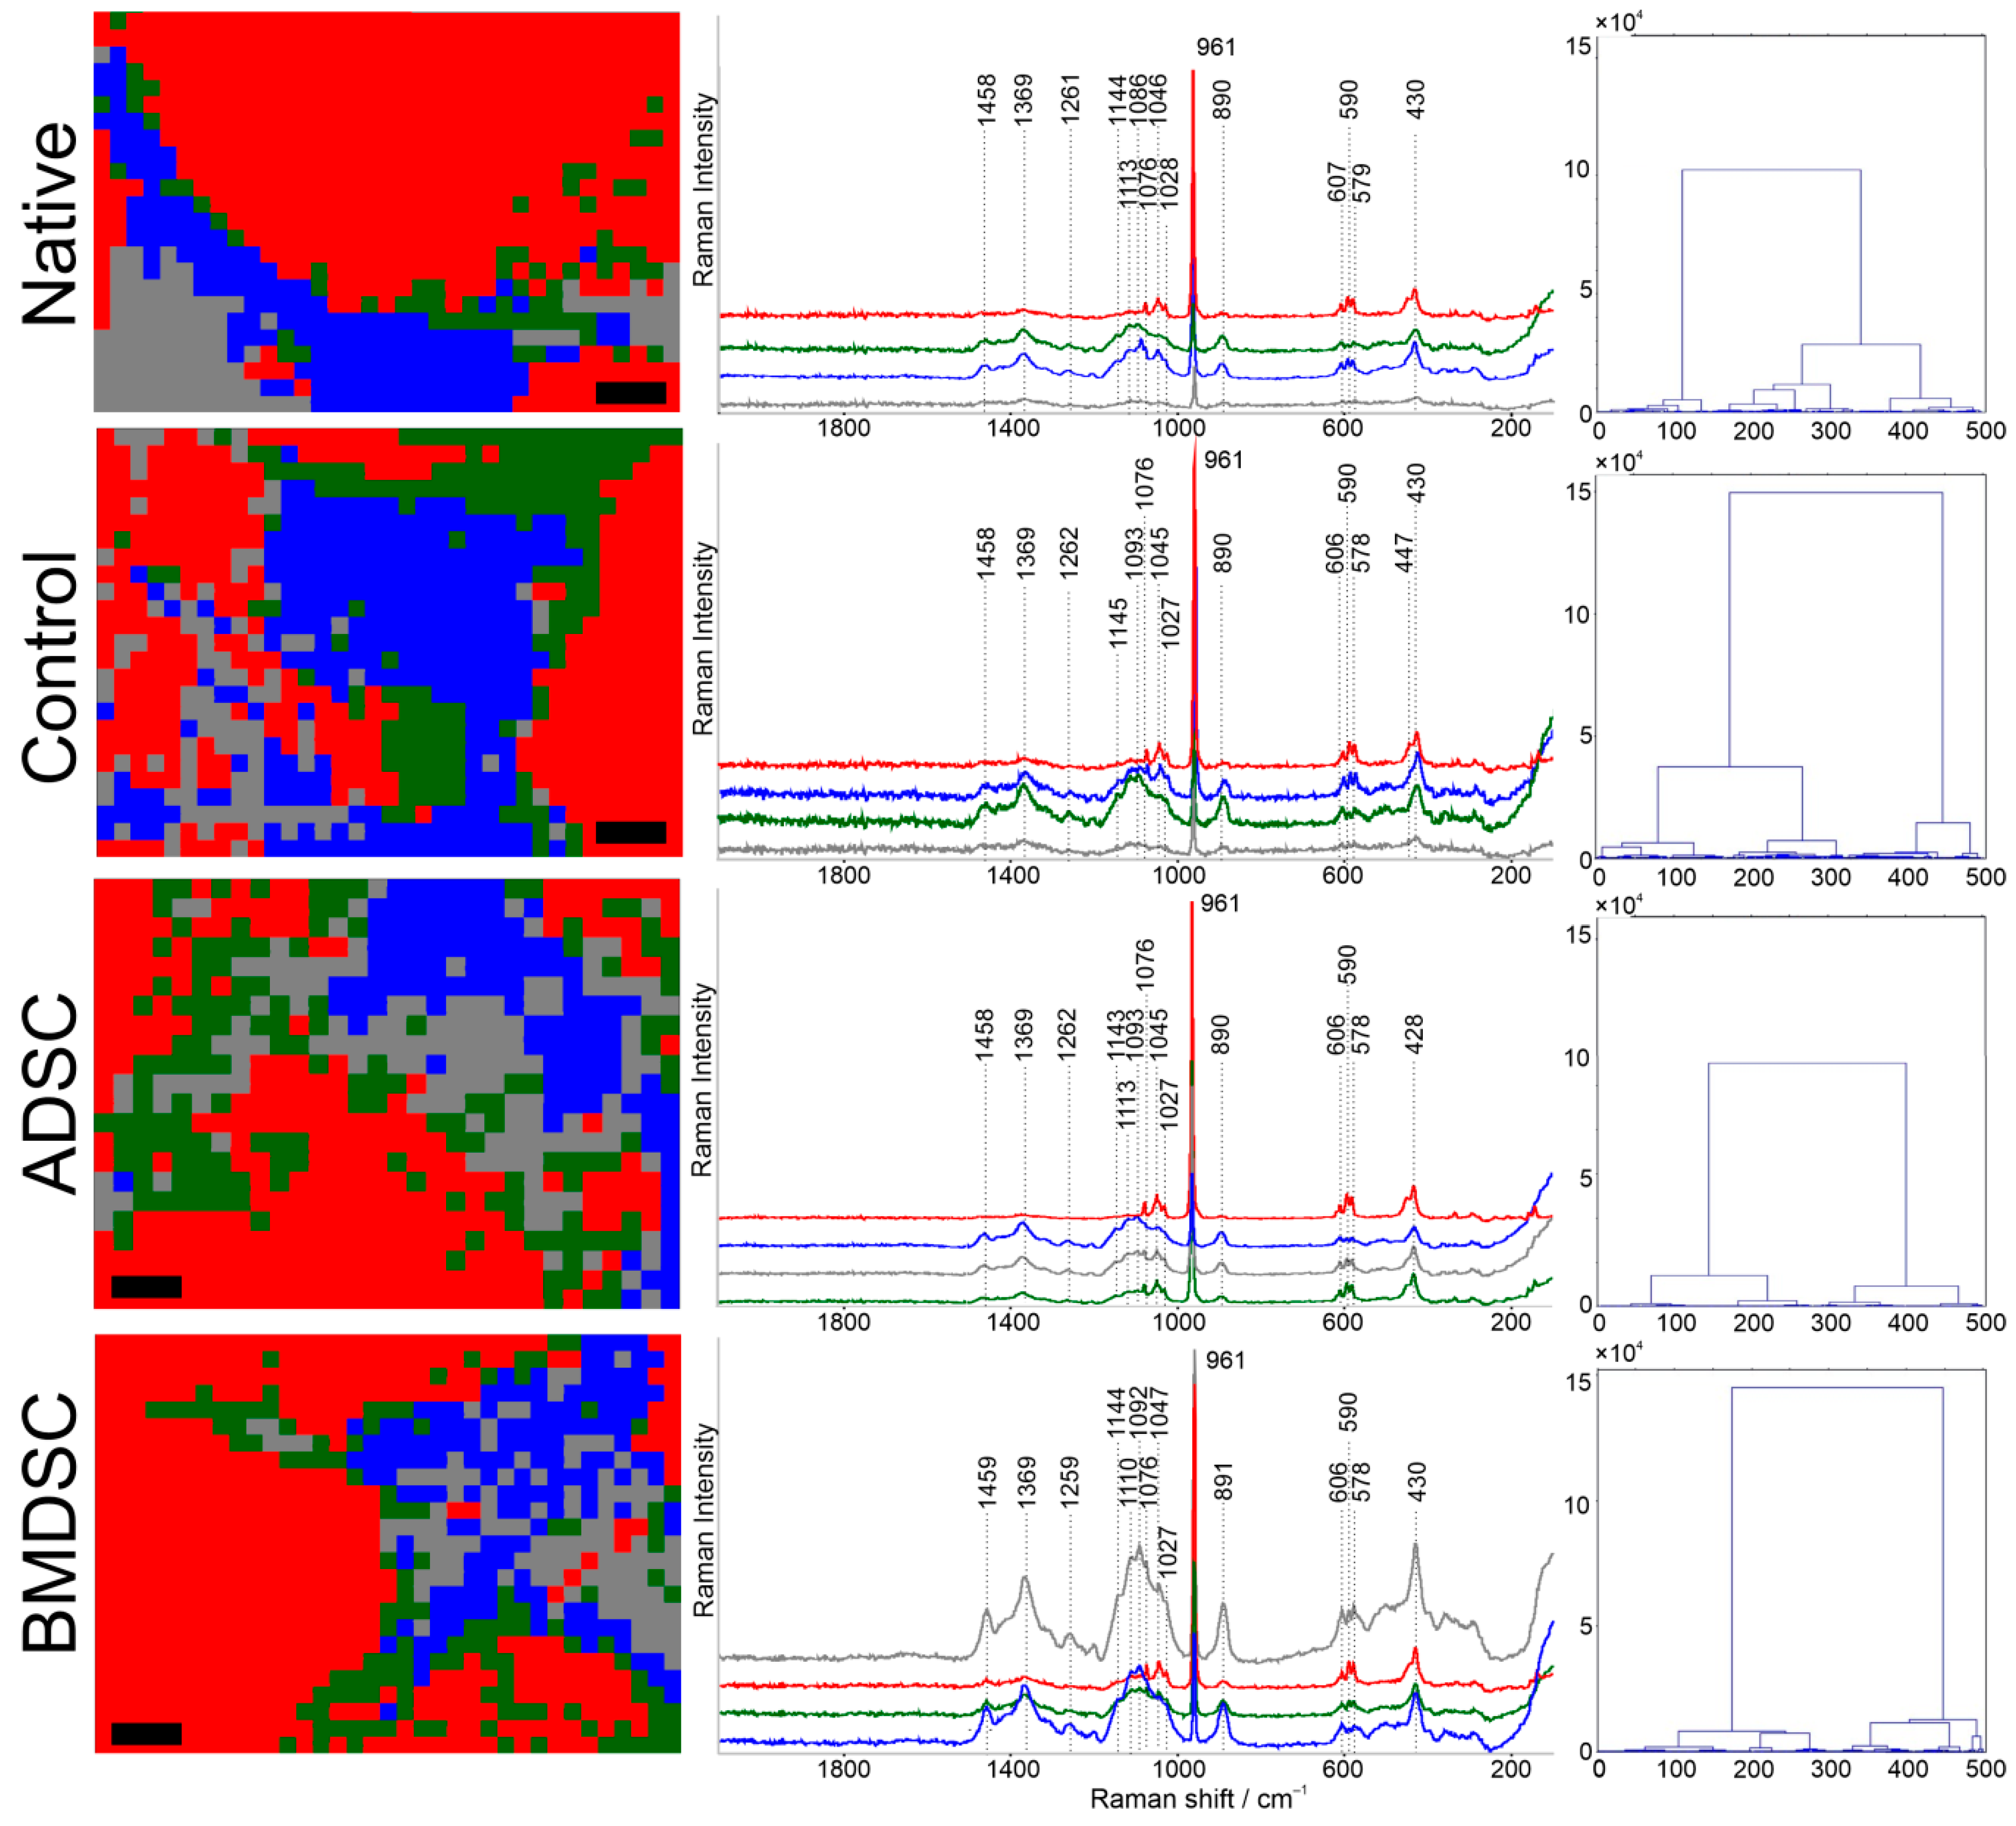
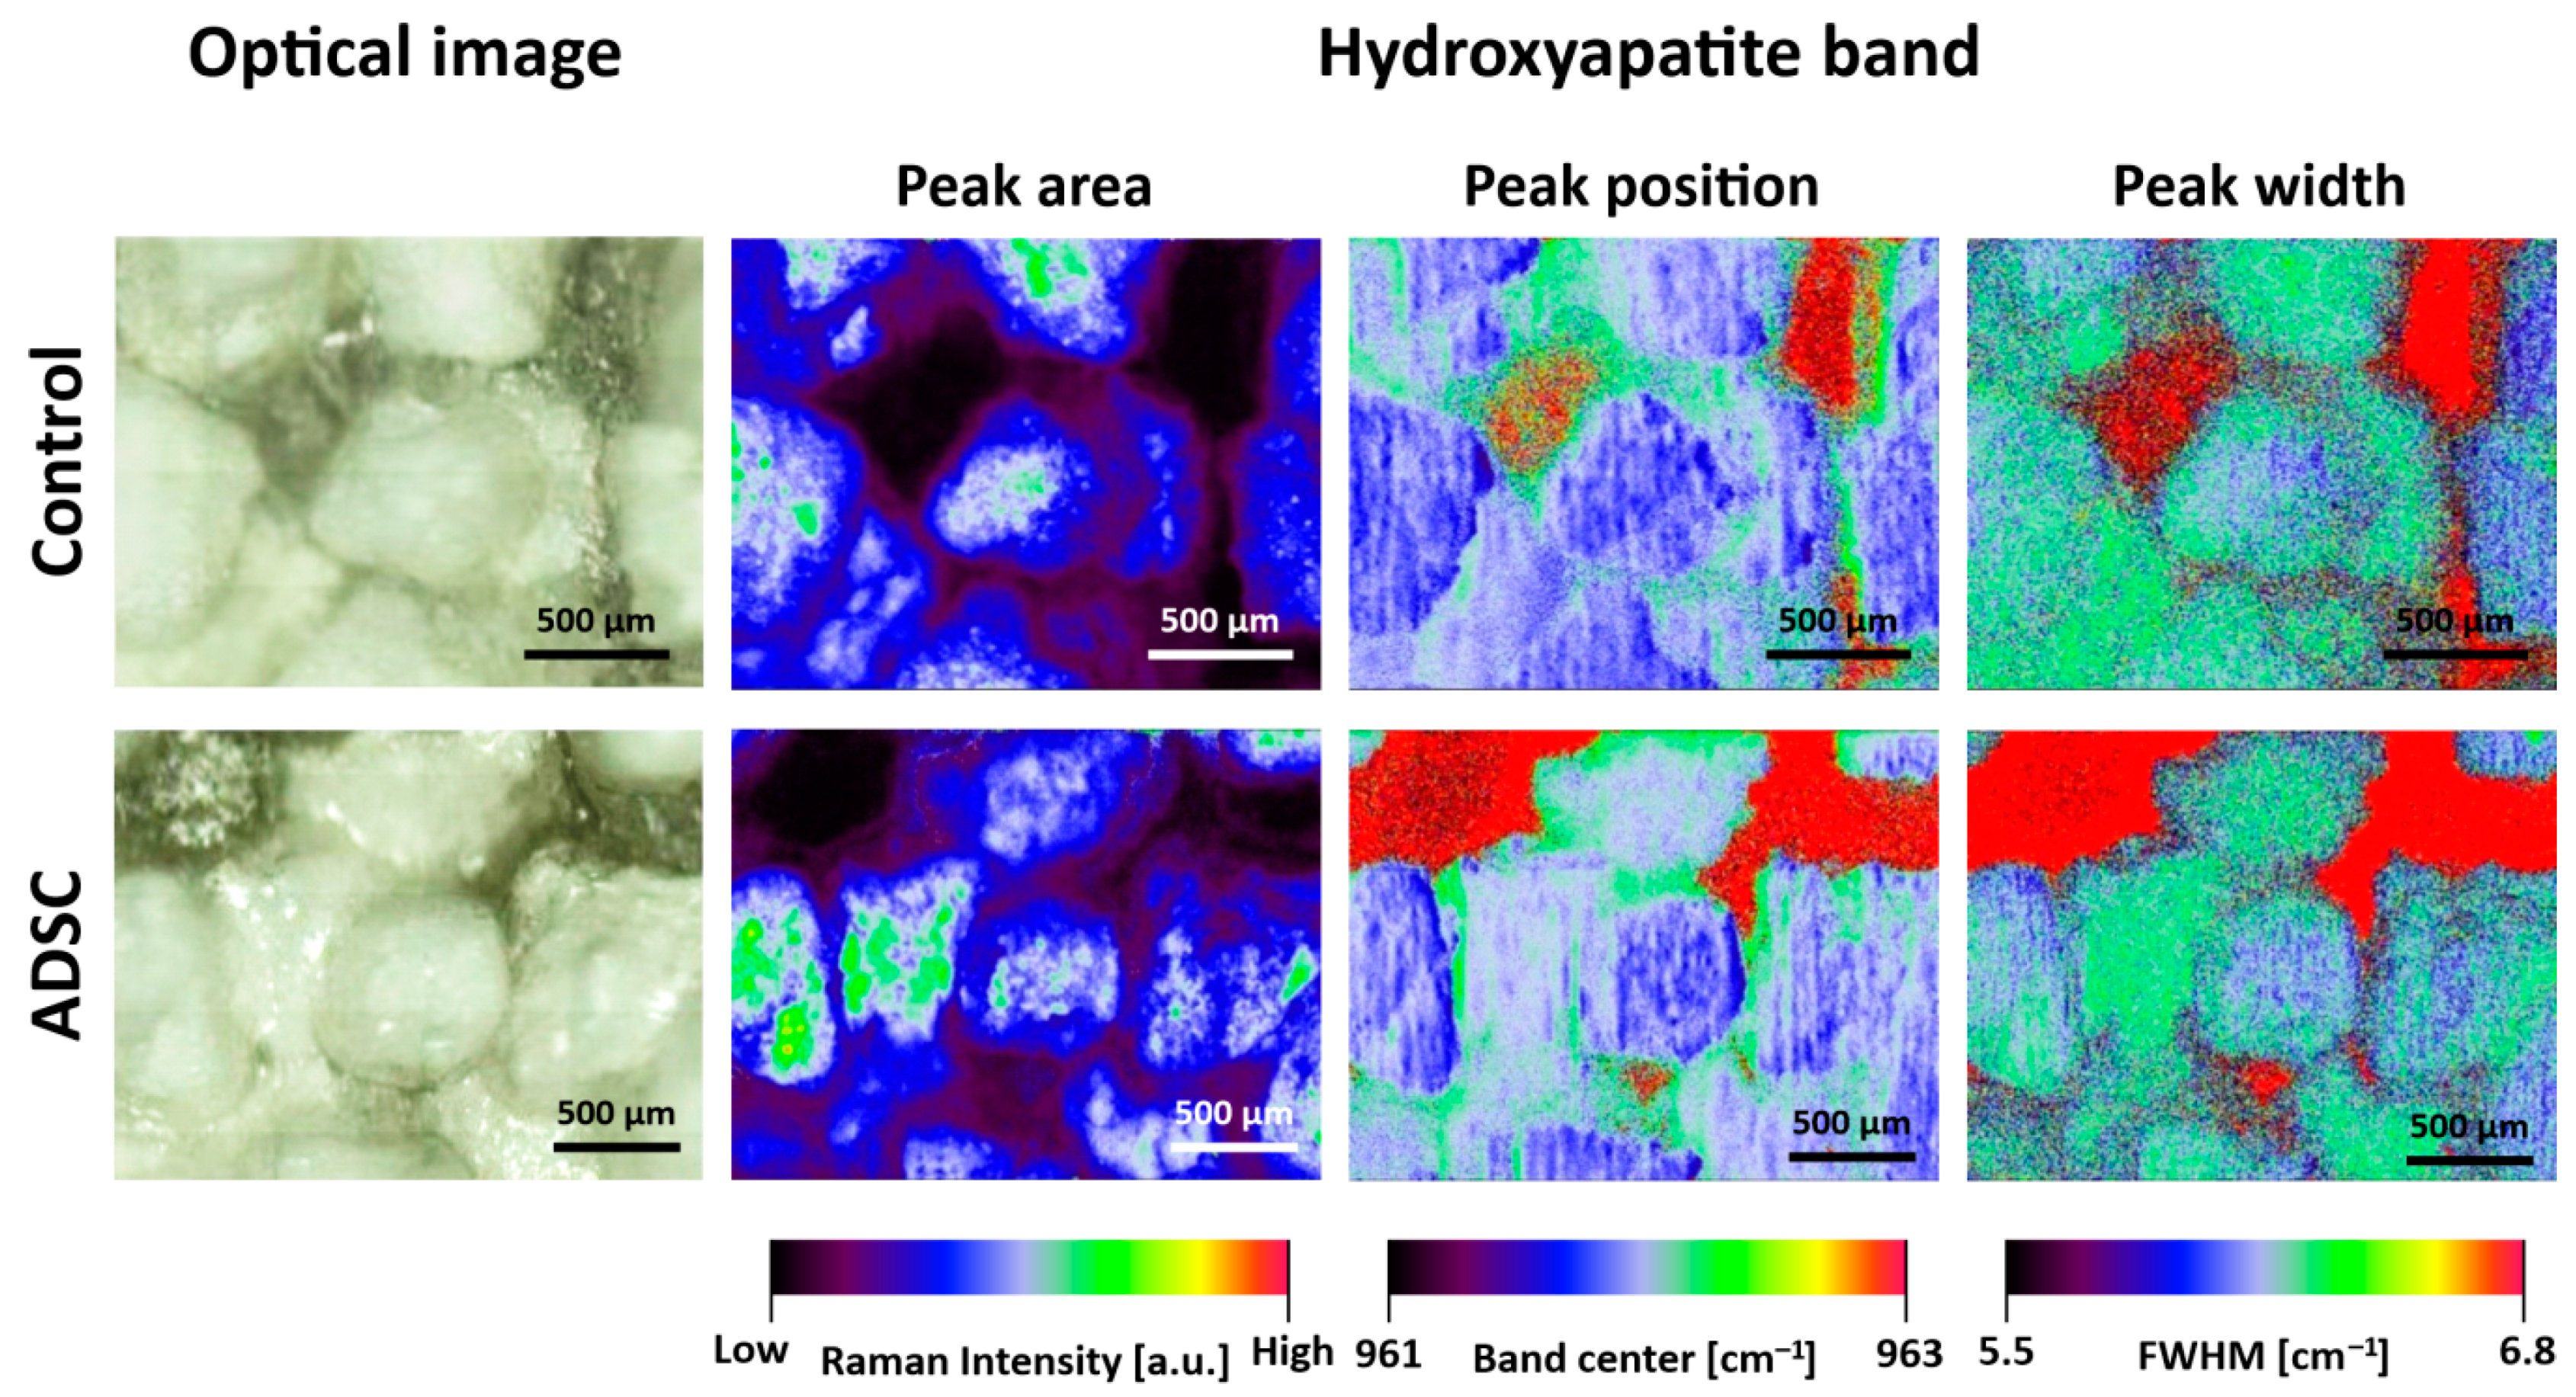
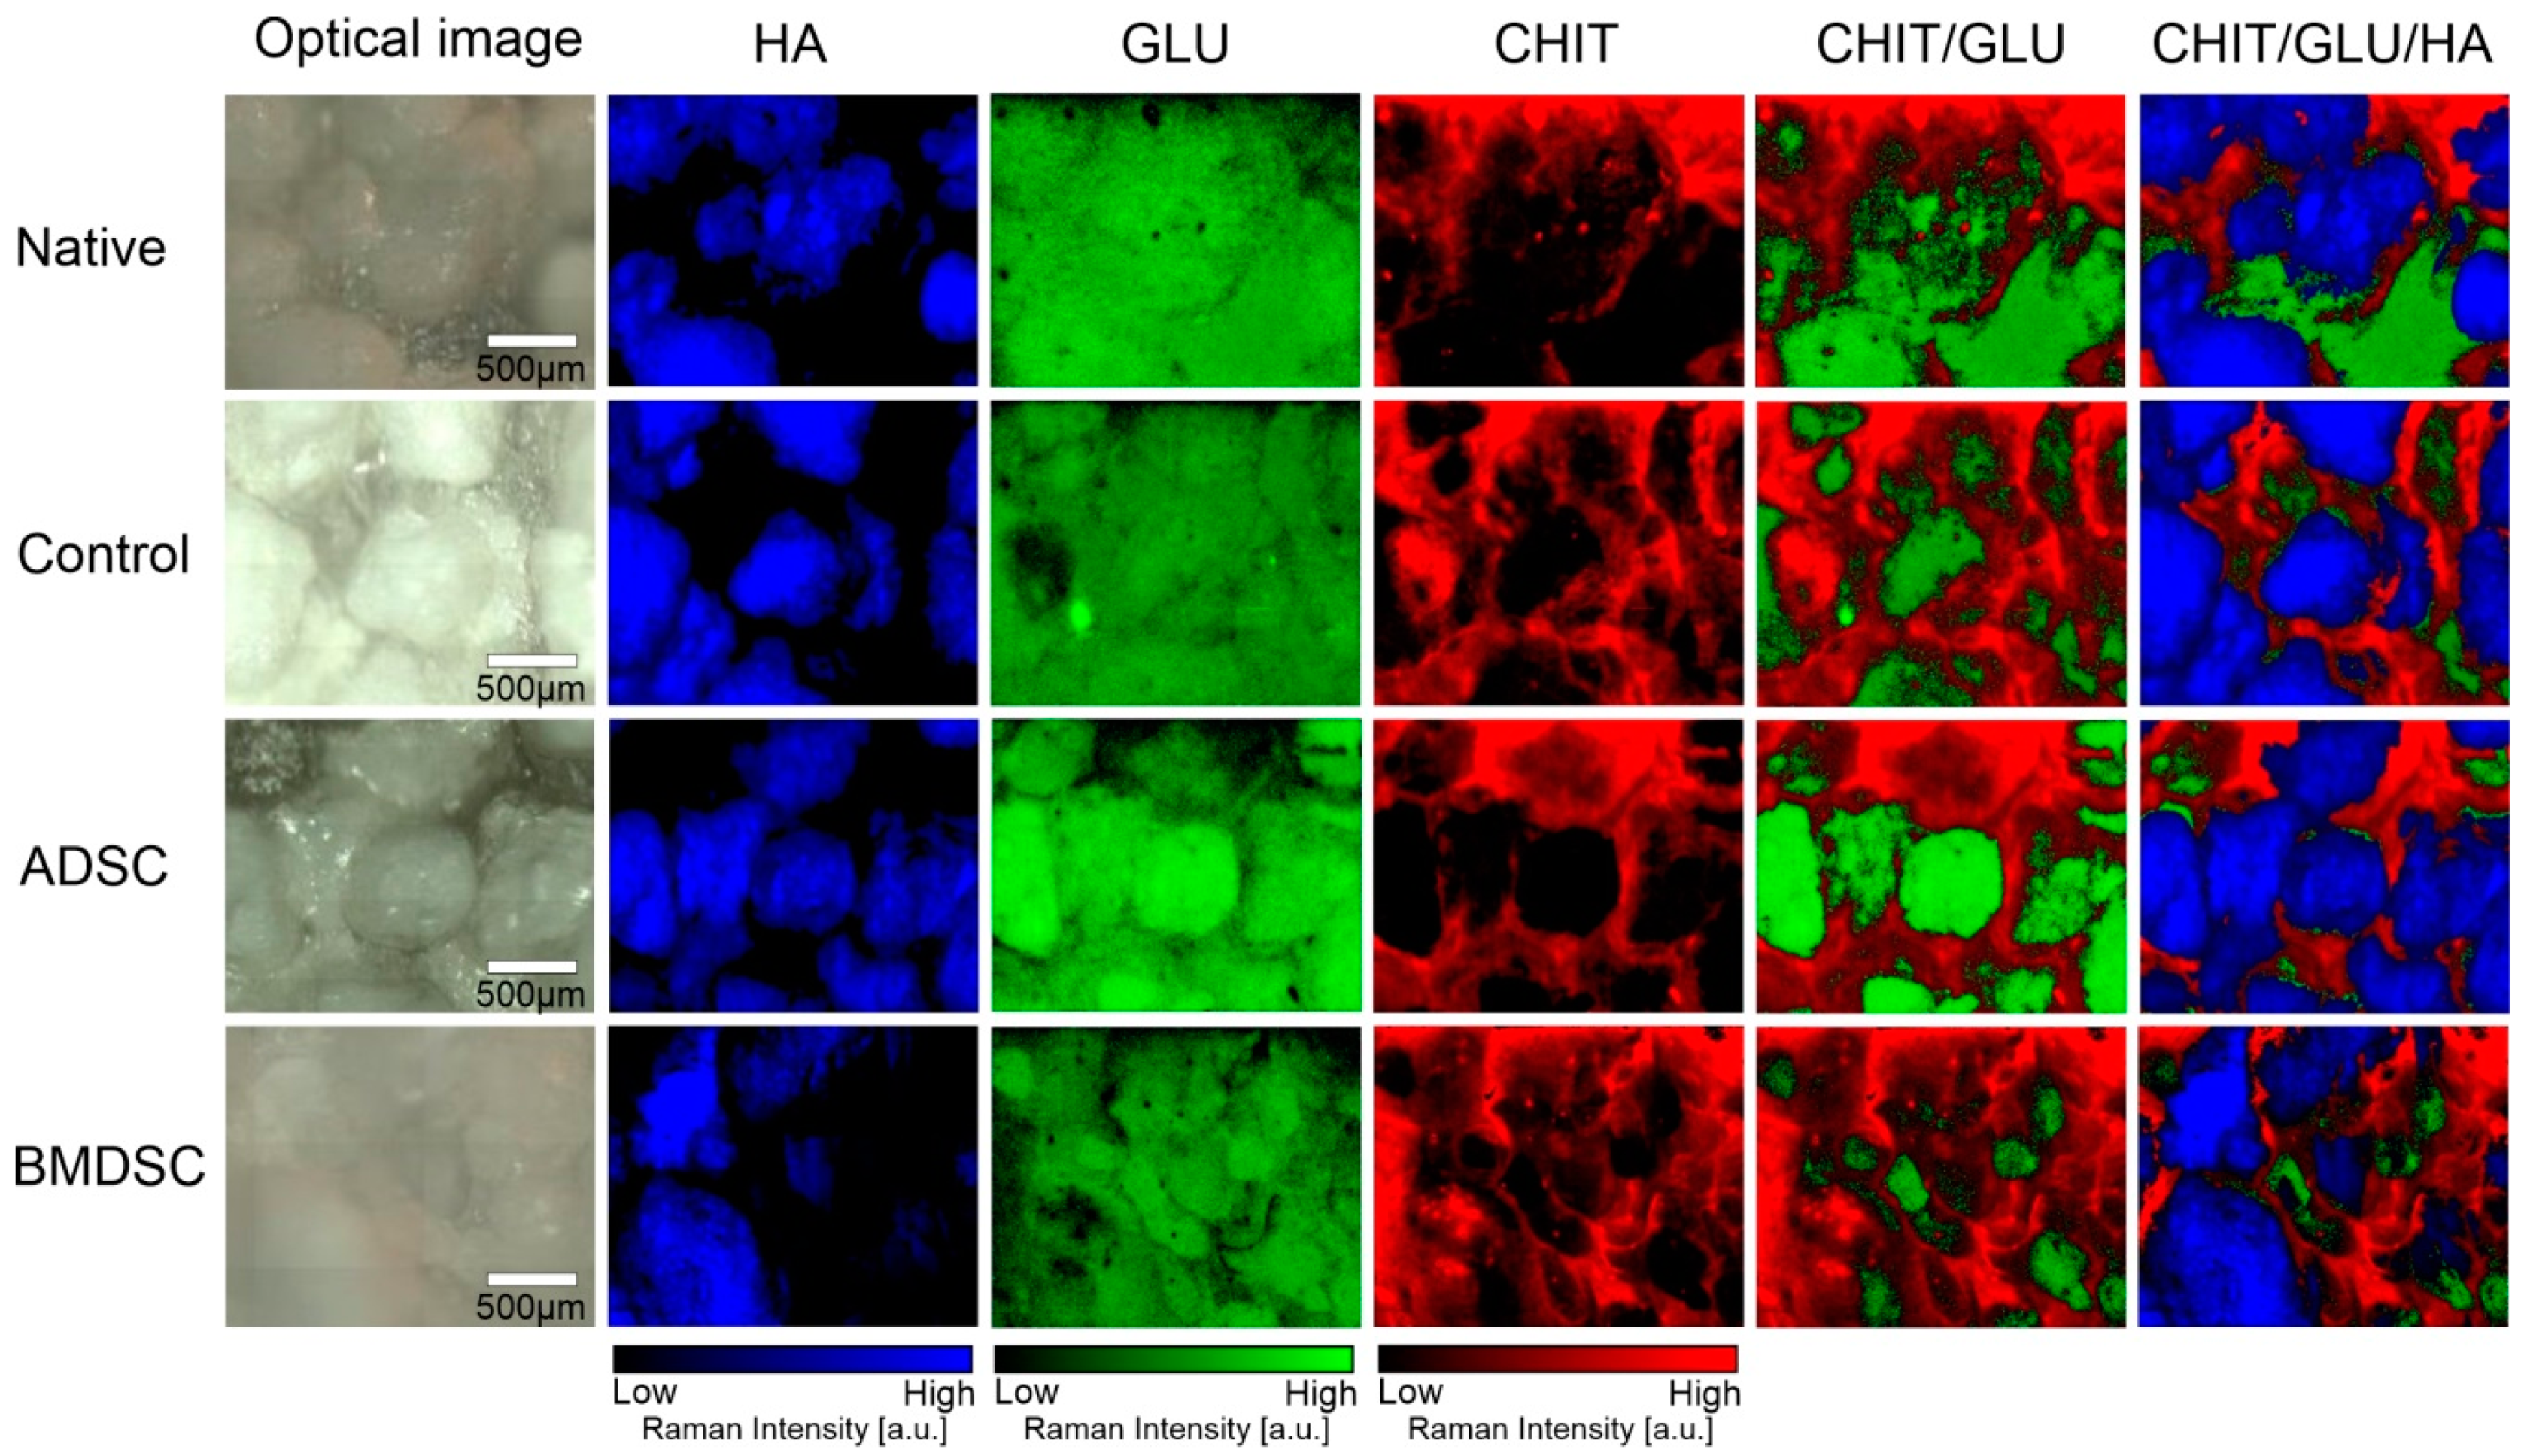
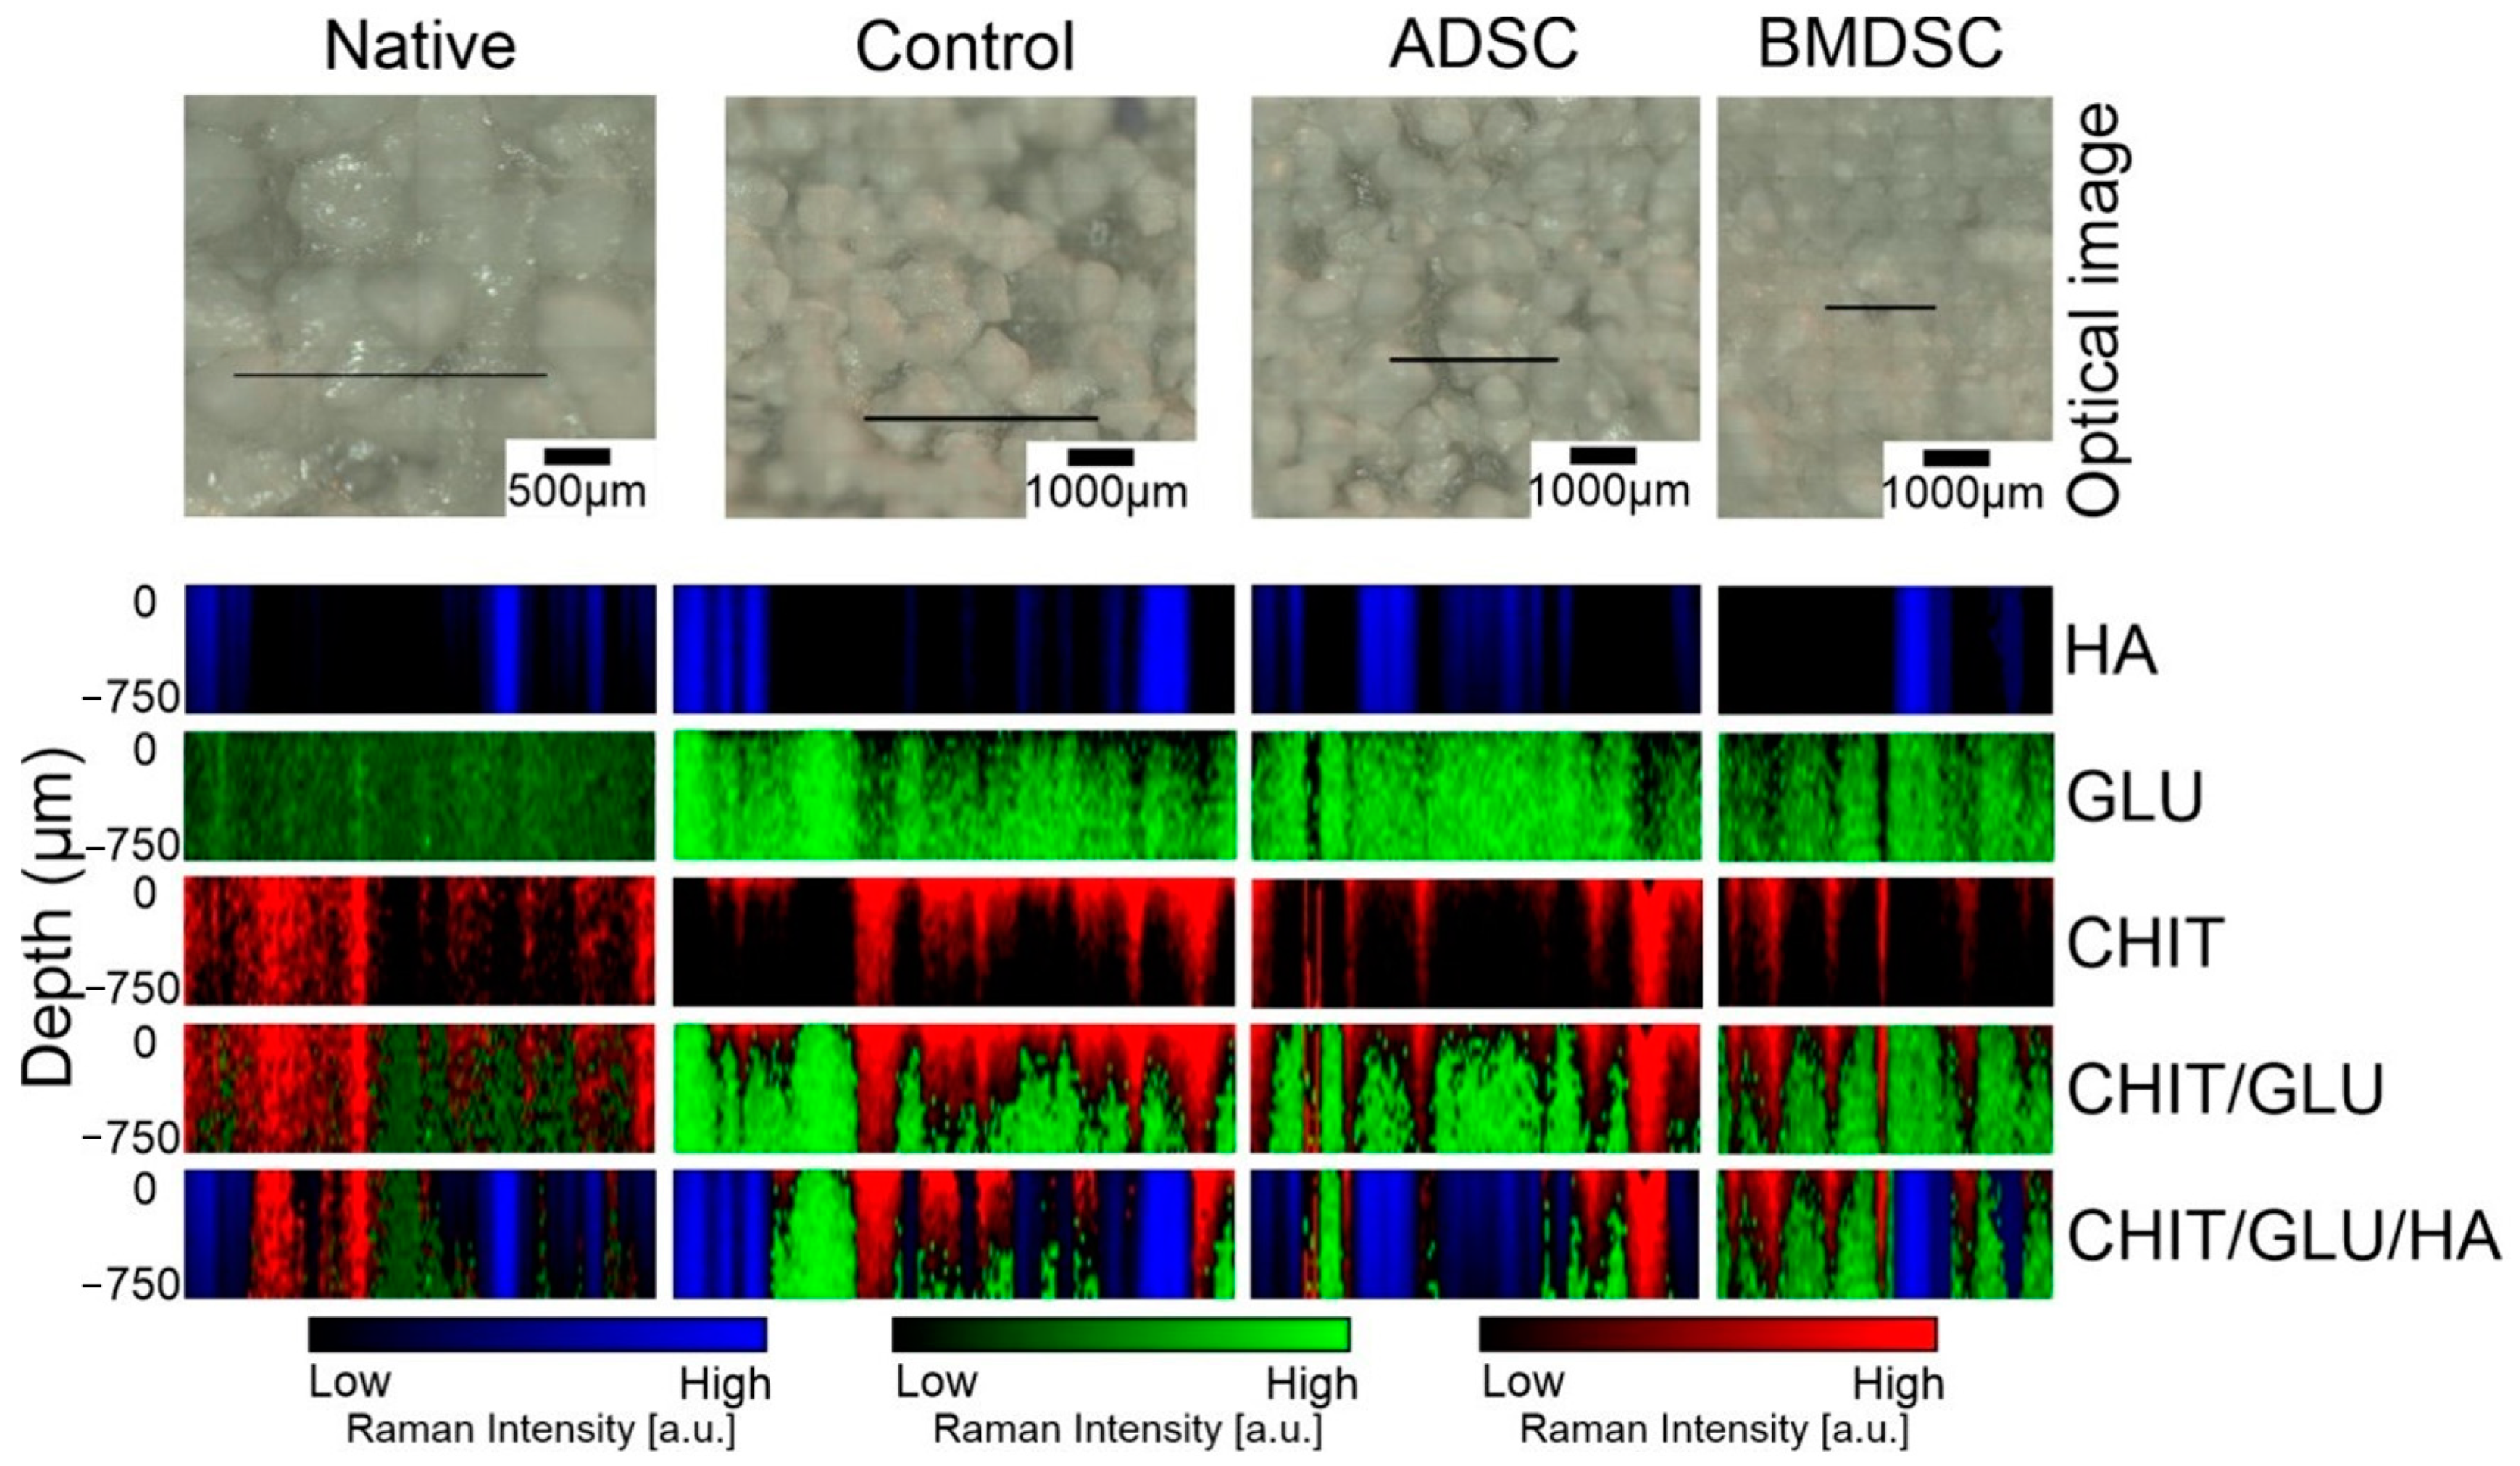
2.2. Raman Imaging
3. Discussion
4. Materials and Methods
4.1. Biomaterial and Individual Compounds Used
4.2. Cell Culture
4.3. Raman Imaging/Mapping
4.3.1. Raman Mapping
4.3.2. Raman Imaging
4.4. Data Analysis
5. Conclusions
Author Contributions
Funding
Data Availability Statement
Conflicts of Interest
Abbreviations
| TEP | Tissue engineered product |
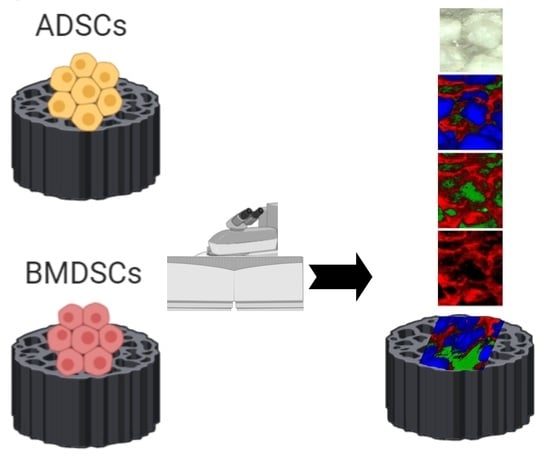
| ADSCs | Adipose-derived stem cells |
| BMDSCs | Bone marrow-derived stem cells |
| ECM | Extra cellular matrix |
| MSCs | Mesenchymal stem cells |
| HA | Hydroxyapatite |
| CHIT | Chitosan |
| GLU | β-1,3-d-glucan/curdlan |
| SNR | Signal-to-noise ratio |
| HCA | Hierarchical cluster analysis |
| MRI | Magnetic resonance imaging |
| XMA | X-ray Motion |
| XPS | X-ray photoelectron spectroscopy |
| CLSM | Confocal laser scanning microscope |
References
- Kapoor, S.K.; Thiyam, R. Management of infection following reconstruction in bone tumors. J. Clin. Orthop. Trauma 2015, 6, 244–251. [Google Scholar] [CrossRef] [PubMed] [Green Version]
- Global Bone Grafts and Substitutes Market to Reach US$ 3.9 Bn by 2026; Rise in the Incidence of Cardiovascular, Respiratory, and Abdominal Disorders to Drive the Market: Transparency Market Research Report. Available online: https://www.transparencymarketresearch.com/pressrelease/bone-grafts-substitutes-market.html (accessed on 3 January 2020).
- Przekora, A.; Vandrovcova, M.; Travnickova, M.; Pajorova, J.; Molitor, M.; Ginalska, G.; Bacakova, L. Evaluation of the potential of chitosan/β -1,3-glucan/hydroxyapatite material as a scaffold for living bone graft production in vitro by comparison of ADSC and BMDSC behaviour on its surface. Biomed. Mater. 2017, 12, 015030. [Google Scholar] [CrossRef] [PubMed]
- Chen, F.M.; Liu, X.H. Advancing biomaterials of human origin for tissue engineering. Prog. Polym. Sci. 2016, 53, 86–168. [Google Scholar] [CrossRef] [PubMed] [Green Version]
- Malm, J.; Giannaras, D.; Riehle, M.O.; Gadegaard, N.; Sjövall, P. Fixation and Drying Protocols for the Preparation of Cell Samples for Time-of-Flight Secondary Ion Mass Spectrometry Analysis. Anal. Chem. 2009, 81, 7197–7205. [Google Scholar] [CrossRef]
- Yamachika, E.; Iida, S. Bone regeneration from mesenchymal stem cells (MSCs) and compact bone-derived MSCs as an animal model. Jpn. Dent. Sci. Rev. 2013, 49, 35–44. [Google Scholar] [CrossRef] [Green Version]
- Spees, J.L.; Lee, R.H.; Gregory, C.A. Mechanisms of mesenchymal stem/stromal cell function. Stem Cell Res. Ther. 2016, 7, 1–13. [Google Scholar] [CrossRef] [Green Version]
- Liang, X.; Ding, Y.; Zhang, Y.; Tse, H.F.; Lian, Q. Paracrine Mechanisms of Mesenchymal Stem Cell-Based Therapy: Current Status and Perspectives. Cell Transplant. 2014, 23, 1045–1059. [Google Scholar] [CrossRef] [Green Version]
- Qazi, T.H.; Mooney, D.J.; Duda, G.N.; Geissler, S. Biomaterials that promote cell-cell interactions enhance the paracrine function of MSCs. Biomaterials 2017, 140, 103–114. [Google Scholar] [CrossRef]
- Kazimierczak, P.; Syta, E.; Przekora, A.; Ginalska, G. Comparison of osteogenic differentiation abilitybetween bone marrow-derived mesenchymalstem cells and adipose tissue-derived mesenchymal stem cells. Med. Ogólna Nauk. Zdrowiu 2018, 24, 101–106. [Google Scholar] [CrossRef]
- Caplan, A.I. Mesenchymal Stem Cells: Cell-Based Reconstructive Therapy in Orthopedics. Tissue Eng. 2005, 11, 1198–1211. [Google Scholar] [CrossRef] [Green Version]
- Przekora, A.; Palka, K.; Ginalska, G. Chitosan/β-1,3-glucan/calcium phosphate ceramics composites—Novel cell scaffolds for bone tissue engineering application. J. Biotechnol. 2014, 182, 46–53. [Google Scholar] [CrossRef] [PubMed]
- Gieroba, B.; Sroka-Bartnicka, A.; Kazimierczak, P.; Kalisz, G.; Lewalska-Graczyk, A.; Vivcharenko, V.; Nowakowski, R.; Pieta, I.S.; Przekora, A. Spectroscopic studies on the temperature-dependent molecular arrangements in hybrid chitosan/1,3-β-D-glucan polymeric matrices. Int. J. Biol. Macromol. 2020, 159, 911–921. [Google Scholar] [CrossRef] [PubMed]
- Przekora, A.; Benko, A.; Blazewicz, M.; Ginalska, G. Hybrid chitosan/β -1,3-glucan matrix of bone scaffold enhances osteoblast adhesion, spreading and proliferation via promotion of serum protein adsorption. Biomed. Mater. 2016, 11, 045001. [Google Scholar] [CrossRef] [PubMed]
- Goodyear, S.R.; Aspden, R.M. Raman Microscopy of Bone. In Bone Research Protocols, 2nd ed.; Helfrich, M.H., Ralston, S.H., Eds.; Springer US: New York, NY, USA, 2012; pp. 527–536. [Google Scholar]
- Goodyear, S.R.; Gibson, I.R.; Skakle, J.M.S.; Wells, R.P.K.; Aspden, R.M. A comparison of cortical and trabecular bone from C57 Black 6 mice using Raman spectroscopy. Bone 2009, 44, 899–907. [Google Scholar] [CrossRef] [Green Version]
- Penel, G.; Delfosse, C.; Descamps, M.; Leroy, G. Composition of bone and apatitic biomaterials as revealed by intravital Raman microspectroscopy. Bone 2005, 36, 893–901. [Google Scholar] [CrossRef]
- Akkus, O.; Adar, F.; Schaffler, M.B.; Polyakova-Akkus, A. Aging of Microstructural Compartments in Human Compact Bone. J. Bone Miner. Res. 2003, 18, 1012–1019. [Google Scholar] [CrossRef]
- Ramasamy, J.G.; Akkus, O. Local variations in the micromechanical properties of mouse femur: The involvement of collagen fiber orientation and mineralization. J. Biomech. 2007, 40, 910–918. [Google Scholar] [CrossRef]
- Leong, K.F.; Chua, C.K.; Sudarmadji, N.; Yeong, W.Y. Engineering functionally graded tissue engineering scaffolds. J. Mech. Behav. Biomed. Mater. 2008, 1, 140–152. [Google Scholar] [CrossRef]
- Kong, K.; Kendall, C.; Stone, N.; Notingher, I. Raman spectroscopy for medical diagnostics—From in-vitro biofluid assays to in-vivo cancer detection. Adv. Drug Deliv. Rev. 2015, 89, 121–134. [Google Scholar] [CrossRef] [Green Version]
- Chocholata, P.; Kulda, V.; Babuska, V. Fabrication of Scaffolds for Bone-Tissue Regeneration. Materials 2019, 12, 568. [Google Scholar] [CrossRef] [Green Version]
- Kim, Y.S.; Smoak, M.M.; Melchiorri, A.J.; Mikos, A.G. An Overview of the Tissue Engineering Market in the United States from 2011 to 2018. Tissue Eng. Part A 2019, 25, 1–8. [Google Scholar] [CrossRef]
- European Union. Directive 2010/63/EU of the European Parliament and of the Council of 22 September 2010 on the protection of animals used for scientific purposes. Off. J. EU 2010, 276, 33–79. [Google Scholar]
- Louhimies, S. Directive 86/609/EEC on the protection of animals used for experimental and other scientific purposes. Altern. Lab. Anim. 2002, 30. [Google Scholar] [CrossRef] [PubMed]
- Biniaś, D.; Biniaś, W.; Janicki, J. Application of Raman Spectroscopy for Evaluation of Chemical Changes in Dibutyrylchitin Fibres. Fibres Text. East. Eur. 2016, 24, 27–38. [Google Scholar] [CrossRef]
- Babatunde, E.O.; Ighalo, J.O.; Akolo, S.A.; Adeniyi, A.G.; Adepoju, L. Investigation of Biomaterial Characteristics of Chitosan Produced from Crab Shells. Mat. Int. 2020, 2, 0303–0310. [Google Scholar] [CrossRef]
- Eddya, M.; Tbib, B.; El-Hami, K. A comparison of chitosan properties after extraction from shrimp shells by diluted and concentrated acids. Heliyon 2020, 6, e03486. [Google Scholar] [CrossRef] [PubMed] [Green Version]
- Przekora, A.; Palka, K.; Ginalska, G. Biomedical potential of chitosan/HA and chitosan/β-1,3-glucan/HA biomaterials as scaffolds for bone regeneration—A comparative study. Mater. Sci. Eng. C 2016, 58, 891–899. [Google Scholar] [CrossRef]
- Borkowski, L.; Sroka-Bartnicka, A.; Polkowska, I.; Pawlowska, M.; Pałka, K.; Zieba, E.; Slosarczyk, A.; Jozwiak, K.; Ginalska, G. New approach in evaluation of ceramic-polymer composite bioactivity and biocompatibility. Anal. Bioanal. Chem. 2017, 409, 5747–5755. [Google Scholar] [CrossRef] [Green Version]
- Mangolim, C.S.; Da Silva, T.T.; Fenelon, V.C.; do Nascimento, A.; Sato, F.; Matioli, G. Use of FT-IR, FT-Raman and thermal analysis to evaluate the gel formation of curdlan produced by Agrobacterium sp. IFO 13140 and determination of its rheological properties with food applicability. Food Chem. 2017, 232, 369–378. [Google Scholar] [CrossRef]
- Borkowski, L.; Sroka-Bartnicka, A.; Draczkowski, P.; Ptak, A.; Zięba, E.; Ślósarczyk, A.; Ginalska, G. The comparison study of bioactivity between composites containing synthetic non-substituted and carbonate-substituted hydroxyapatite. Mater. Sci. Eng. C 2016, 62, 260–267. [Google Scholar] [CrossRef]
- Przekora, A. The summary of the most important cell-biomaterial interactions that need to be considered during in vitro biocompatibility testing of bone scaffolds for tissue engineering applications. Mater. Sci. Eng. C 2019, 97, 1036–1051. [Google Scholar] [CrossRef] [PubMed]
- Sroka-Bartnicka, A.; Kimber, J.A.; Borkowski, L.; Pawlowska, M.; Polkowska, I.; Kalisz, G.; Belcarz, A.; Jozwiak, K.; Ginalska, G.; Kazarian, S.G. The biocompatibility of carbon hydroxyapatite/β-glucan composite for bone tissue engineering studied with Raman and FTIR spectroscopic imaging. Anal. Bioanal. Chem. 2015, 407, 7775–7785. [Google Scholar] [CrossRef] [PubMed]
- Wang, L.; Jeong, K.J.; Chiang, H.H.; Zurakowski, D.; Behlau, I.; Chodosh, J.; Dohlman, C.H.; Langer, R.; Kohane, D.S. Hydroxyapatite for Keratoprosthesis Biointegration. Investig. Ophthalmol. Vis. Sci. 2011, 52, 7392–7399. [Google Scholar] [CrossRef] [Green Version]
- Calciolari, E.; Mardas, N.; Dereka, X.; Anagnostopoulos, A.K.; Tsangaris, G.T.; Donos, N. Protein expression during early stages of bone regeneration under hydrophobic and hydrophilic titanium domes. A pilot study. J. Periodontal Res. 2018, 53, 174–187. [Google Scholar] [CrossRef]
- Knight, A. Weighing the Costs and Benefits of Animal Experiments. In Proceedings of the ALTEX Proceedings, Montreal, QC, Canada, 21–25 August 2011; pp. 289–294. [Google Scholar]
- Brauchle, E.; Carvajal Berrio, D.; Rieger, M.; Schenke-Layland, K.; Reinert, S.; Alexander, D. Raman Spectroscopic Analyses of Jaw Periosteal Cell Mineralization. Stem Cells Int. 2017, 2017, 1–12. [Google Scholar] [CrossRef]
- Timchenko, P.E.; Timchenko, E.V.; Pisareva, E.V.; Vlasov, M.Y.; Volova, L.T.; Frolov, O.O.; Kalimullina, A.R. Experimental studies of hydroxyapatite by Raman spectroscopy. J. Opt. Technol. 2018, 85, 130. [Google Scholar] [CrossRef]
- Sun, M.; Chi, G.; Xu, J.; Tan, Y.; Xu, J.; Lv, S.; Xu, Z.; Xia, Y.; Li, L.; Li, Y. Extracellular matrix stiffness controls osteogenic differentiation of mesenchymal stem cells mediated by integrin α5. Stem Cell Res. Ther. 2018, 9, 1–13. [Google Scholar] [CrossRef] [PubMed]
- Ravindran, S.; Gao, Q.; Kotecha, M.; Magin, R.L.; Karol, S.; Bedran-Russo, A.; George, A. Biomimetic Extracellular Matrix-Incorporated Scaffold Induces Osteogenic Gene Expression in Human Marrow Stromal Cells. Tissue Eng. Part A 2012, 18, 295–309. [Google Scholar] [CrossRef] [Green Version]
- Gieroba, B.; Przekora, A.; Kalisz, G.; Kazimierczak, P.; Song, C.L.; Wojcik, M.; Ginalska, G.; Kazarian, S.G.; Sroka-Bartnicka, A. Collagen maturity and mineralization in mesenchymal stem cells cultured on the hydroxyapatite-based bone scaffold analysed by ATR-FTIR spectroscopic imaging. Mater. Sci. Eng. C 2020, 119, 111634. [Google Scholar] [CrossRef]


| Native | Control | ADSCs | BMDSCs | |
|---|---|---|---|---|
| HA | 92.93% | 71.13% | 80.81% | 73.44% |
| GLU | 6.01% | 28.85% | 19.07% | 26.53% |
| CHIT | 1.06% | 0.02% | 0.12% | 0.03% |
Publisher’s Note: MDPI stays neutral with regard to jurisdictional claims in published maps and institutional affiliations. |
© 2021 by the authors. Licensee MDPI, Basel, Switzerland. This article is an open access article distributed under the terms and conditions of the Creative Commons Attribution (CC BY) license (http://creativecommons.org/licenses/by/4.0/).
Share and Cite
Kalisz, G.; Przekora, A.; Kazimierczak, P.; Gieroba, B.; Jedrek, M.; Grudzinski, W.; Gruszecki, W.I.; Ginalska, G.; Sroka-Bartnicka, A. Application of Raman Spectroscopic Imaging to Assess the Structural Changes at Cell-Scaffold Interface. Int. J. Mol. Sci. 2021, 22, 485. https://0-doi-org.brum.beds.ac.uk/10.3390/ijms22020485
Kalisz G, Przekora A, Kazimierczak P, Gieroba B, Jedrek M, Grudzinski W, Gruszecki WI, Ginalska G, Sroka-Bartnicka A. Application of Raman Spectroscopic Imaging to Assess the Structural Changes at Cell-Scaffold Interface. International Journal of Molecular Sciences. 2021; 22(2):485. https://0-doi-org.brum.beds.ac.uk/10.3390/ijms22020485
Chicago/Turabian StyleKalisz, Grzegorz, Agata Przekora, Paulina Kazimierczak, Barbara Gieroba, Michal Jedrek, Wojciech Grudzinski, Wieslaw I. Gruszecki, Grazyna Ginalska, and Anna Sroka-Bartnicka. 2021. "Application of Raman Spectroscopic Imaging to Assess the Structural Changes at Cell-Scaffold Interface" International Journal of Molecular Sciences 22, no. 2: 485. https://0-doi-org.brum.beds.ac.uk/10.3390/ijms22020485