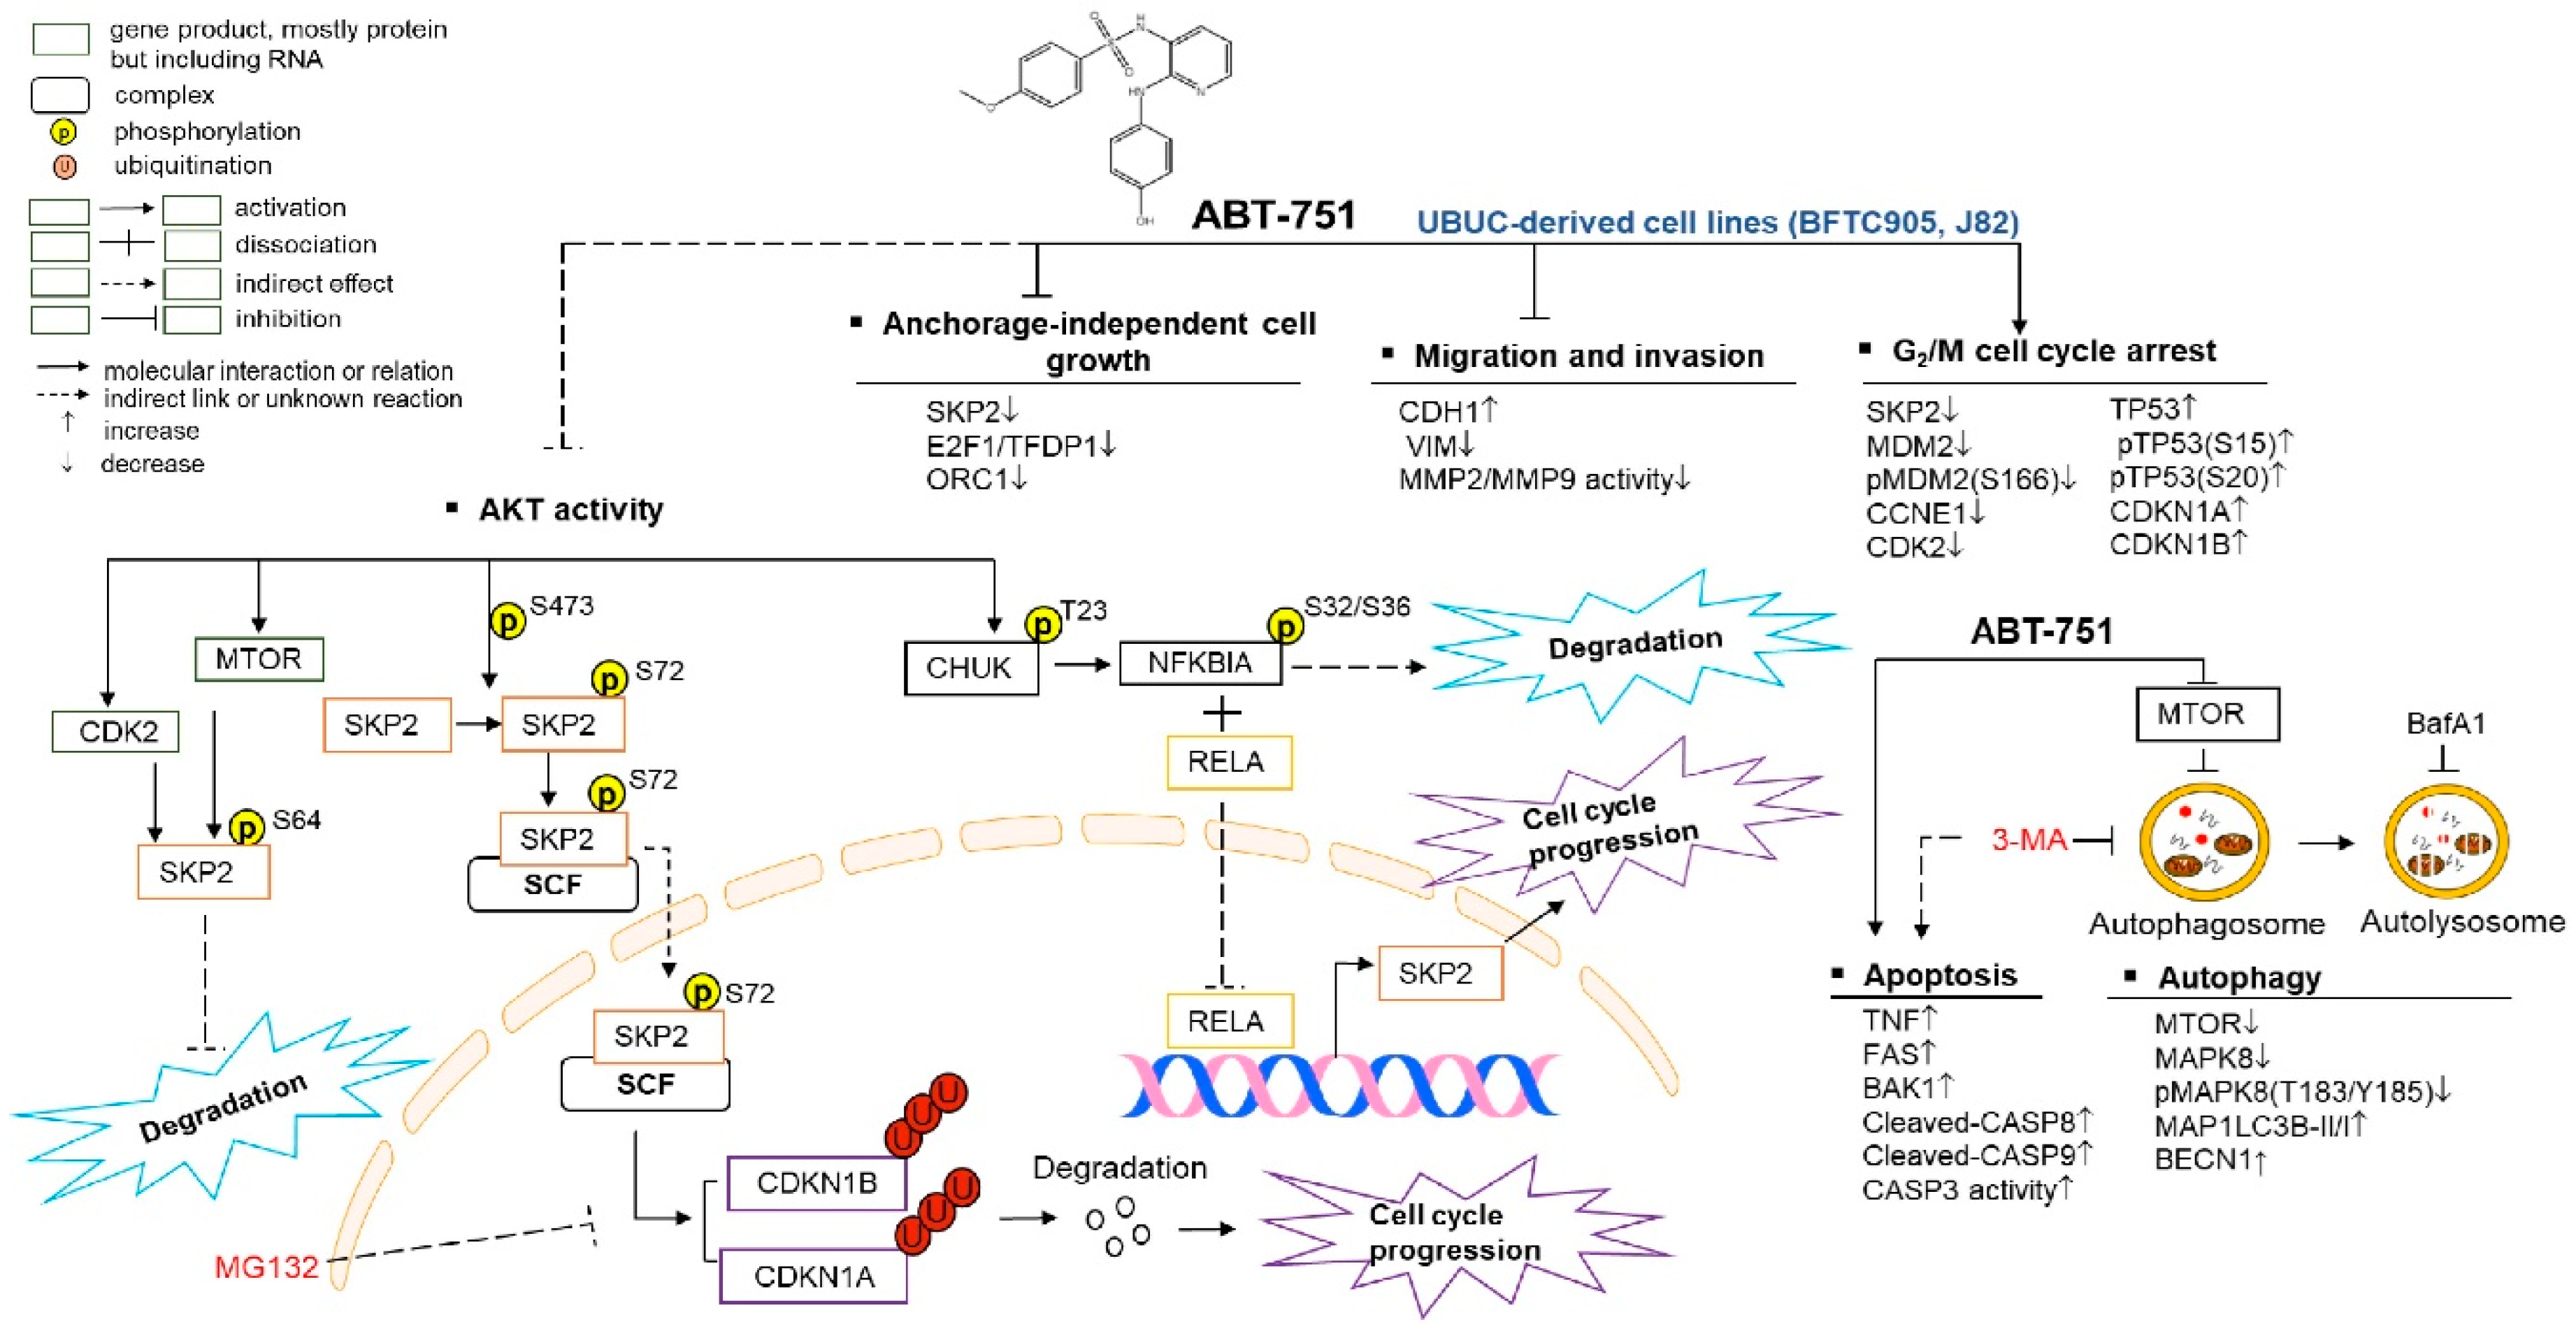
ABT-751 Induces Multiple Anticancer Effects in Urinary Bladder Urothelial Carcinoma-Derived Cells: Highlighting the Induction of Cytostasis through the Inhibition of SKP2 at Both Transcriptional and Post-Translational Levels

 , and
, and 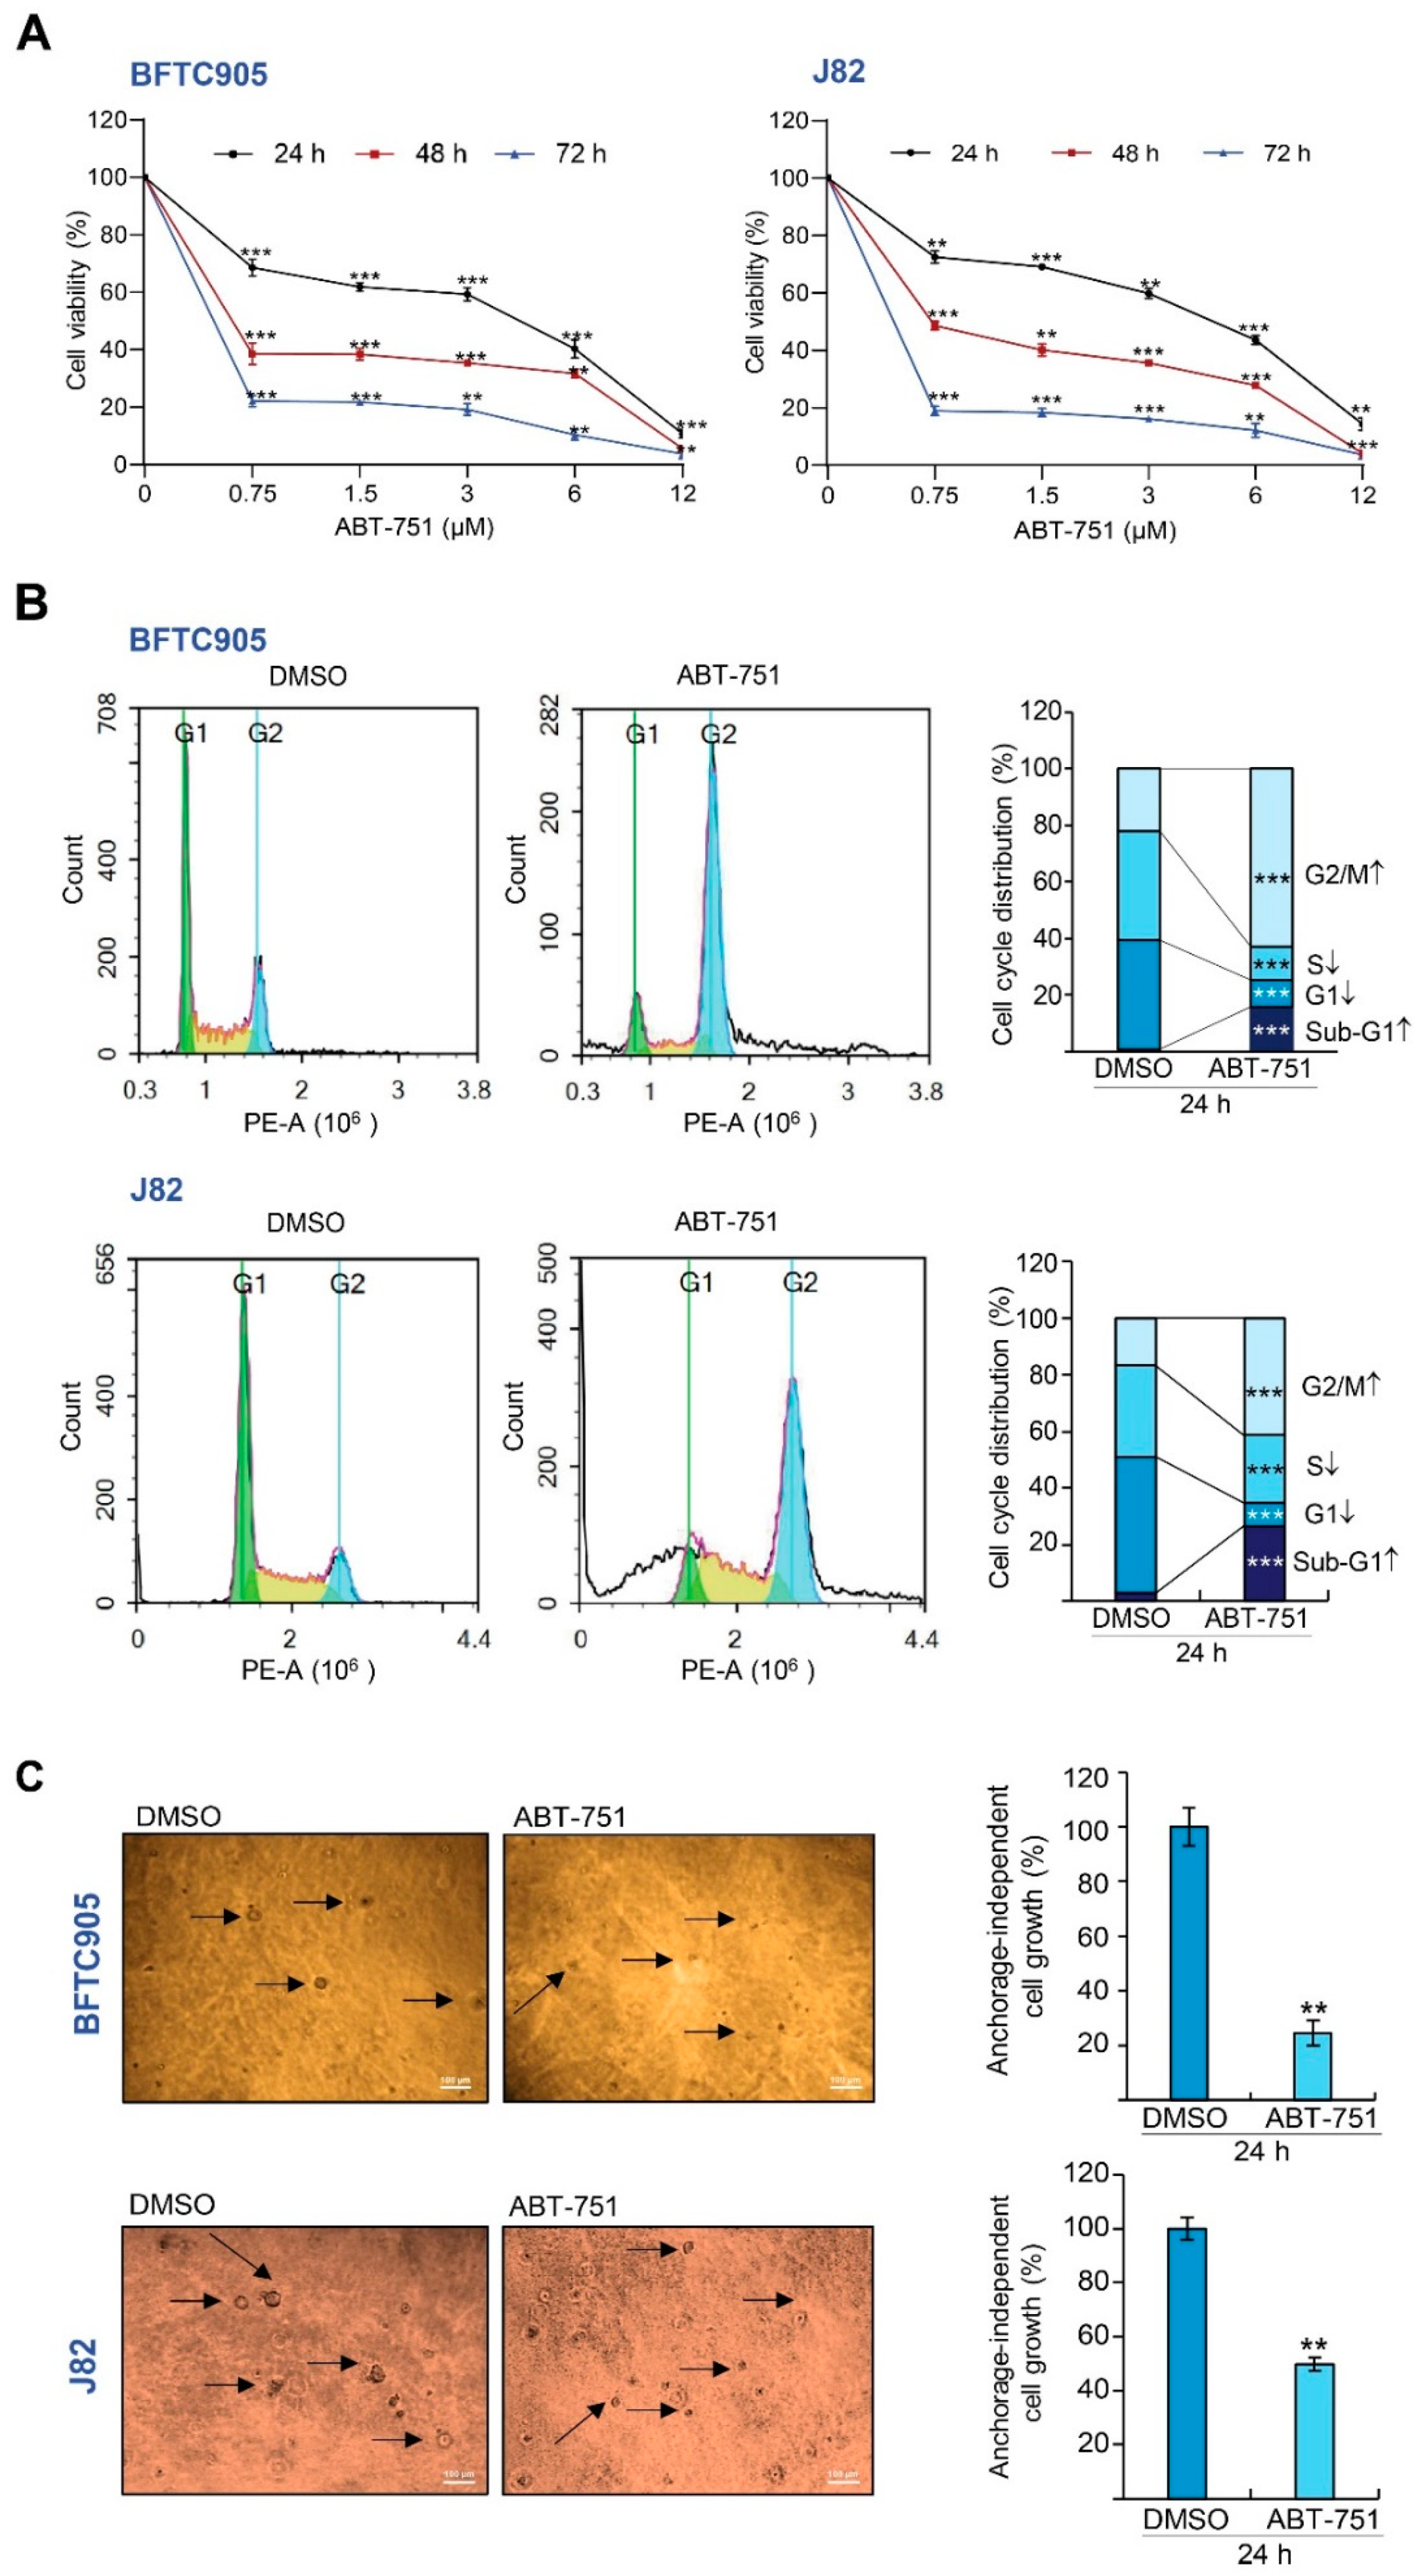
Abstract
:1. Introduction
2. Results
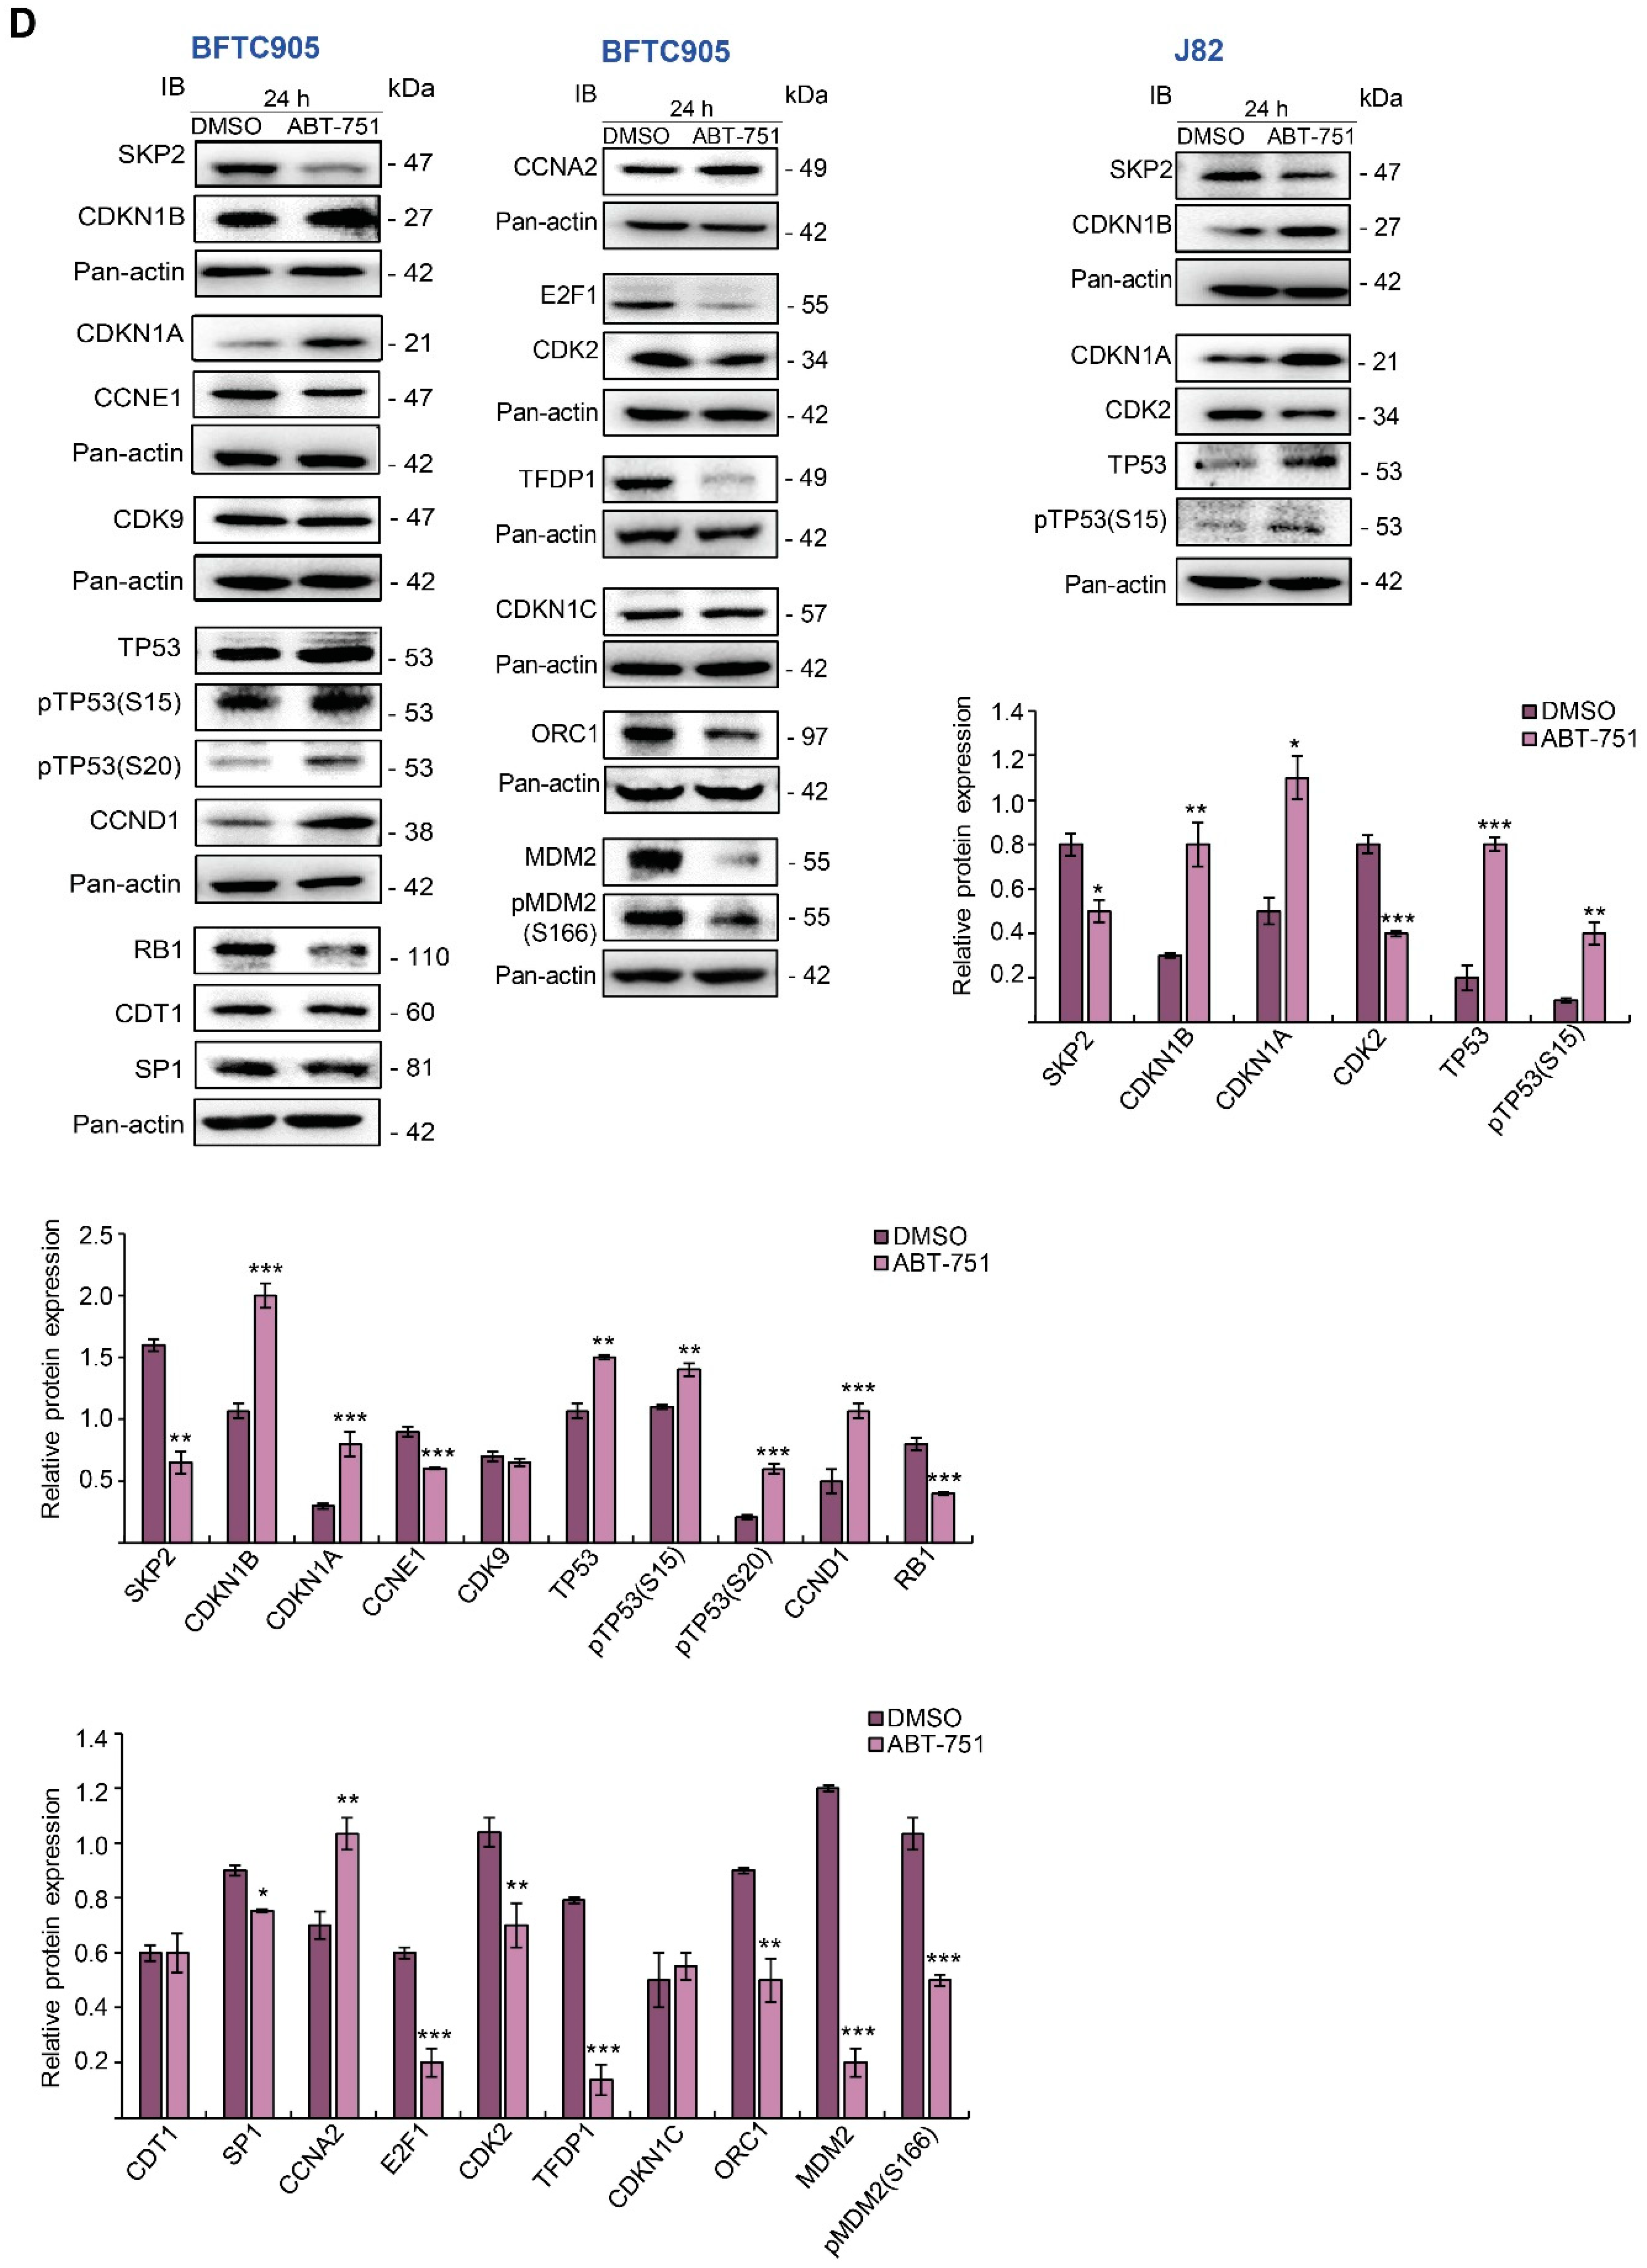
2.1. ABT-751 Decreased Cell Number in the S Phase of the Cell Cycle and Suppresses Colony Formation/Anchorage-Independent Cell Growth along with Alteration of the Expression Levels of Several Cell Cycle Regulators in BFTC905 and J82 Cells
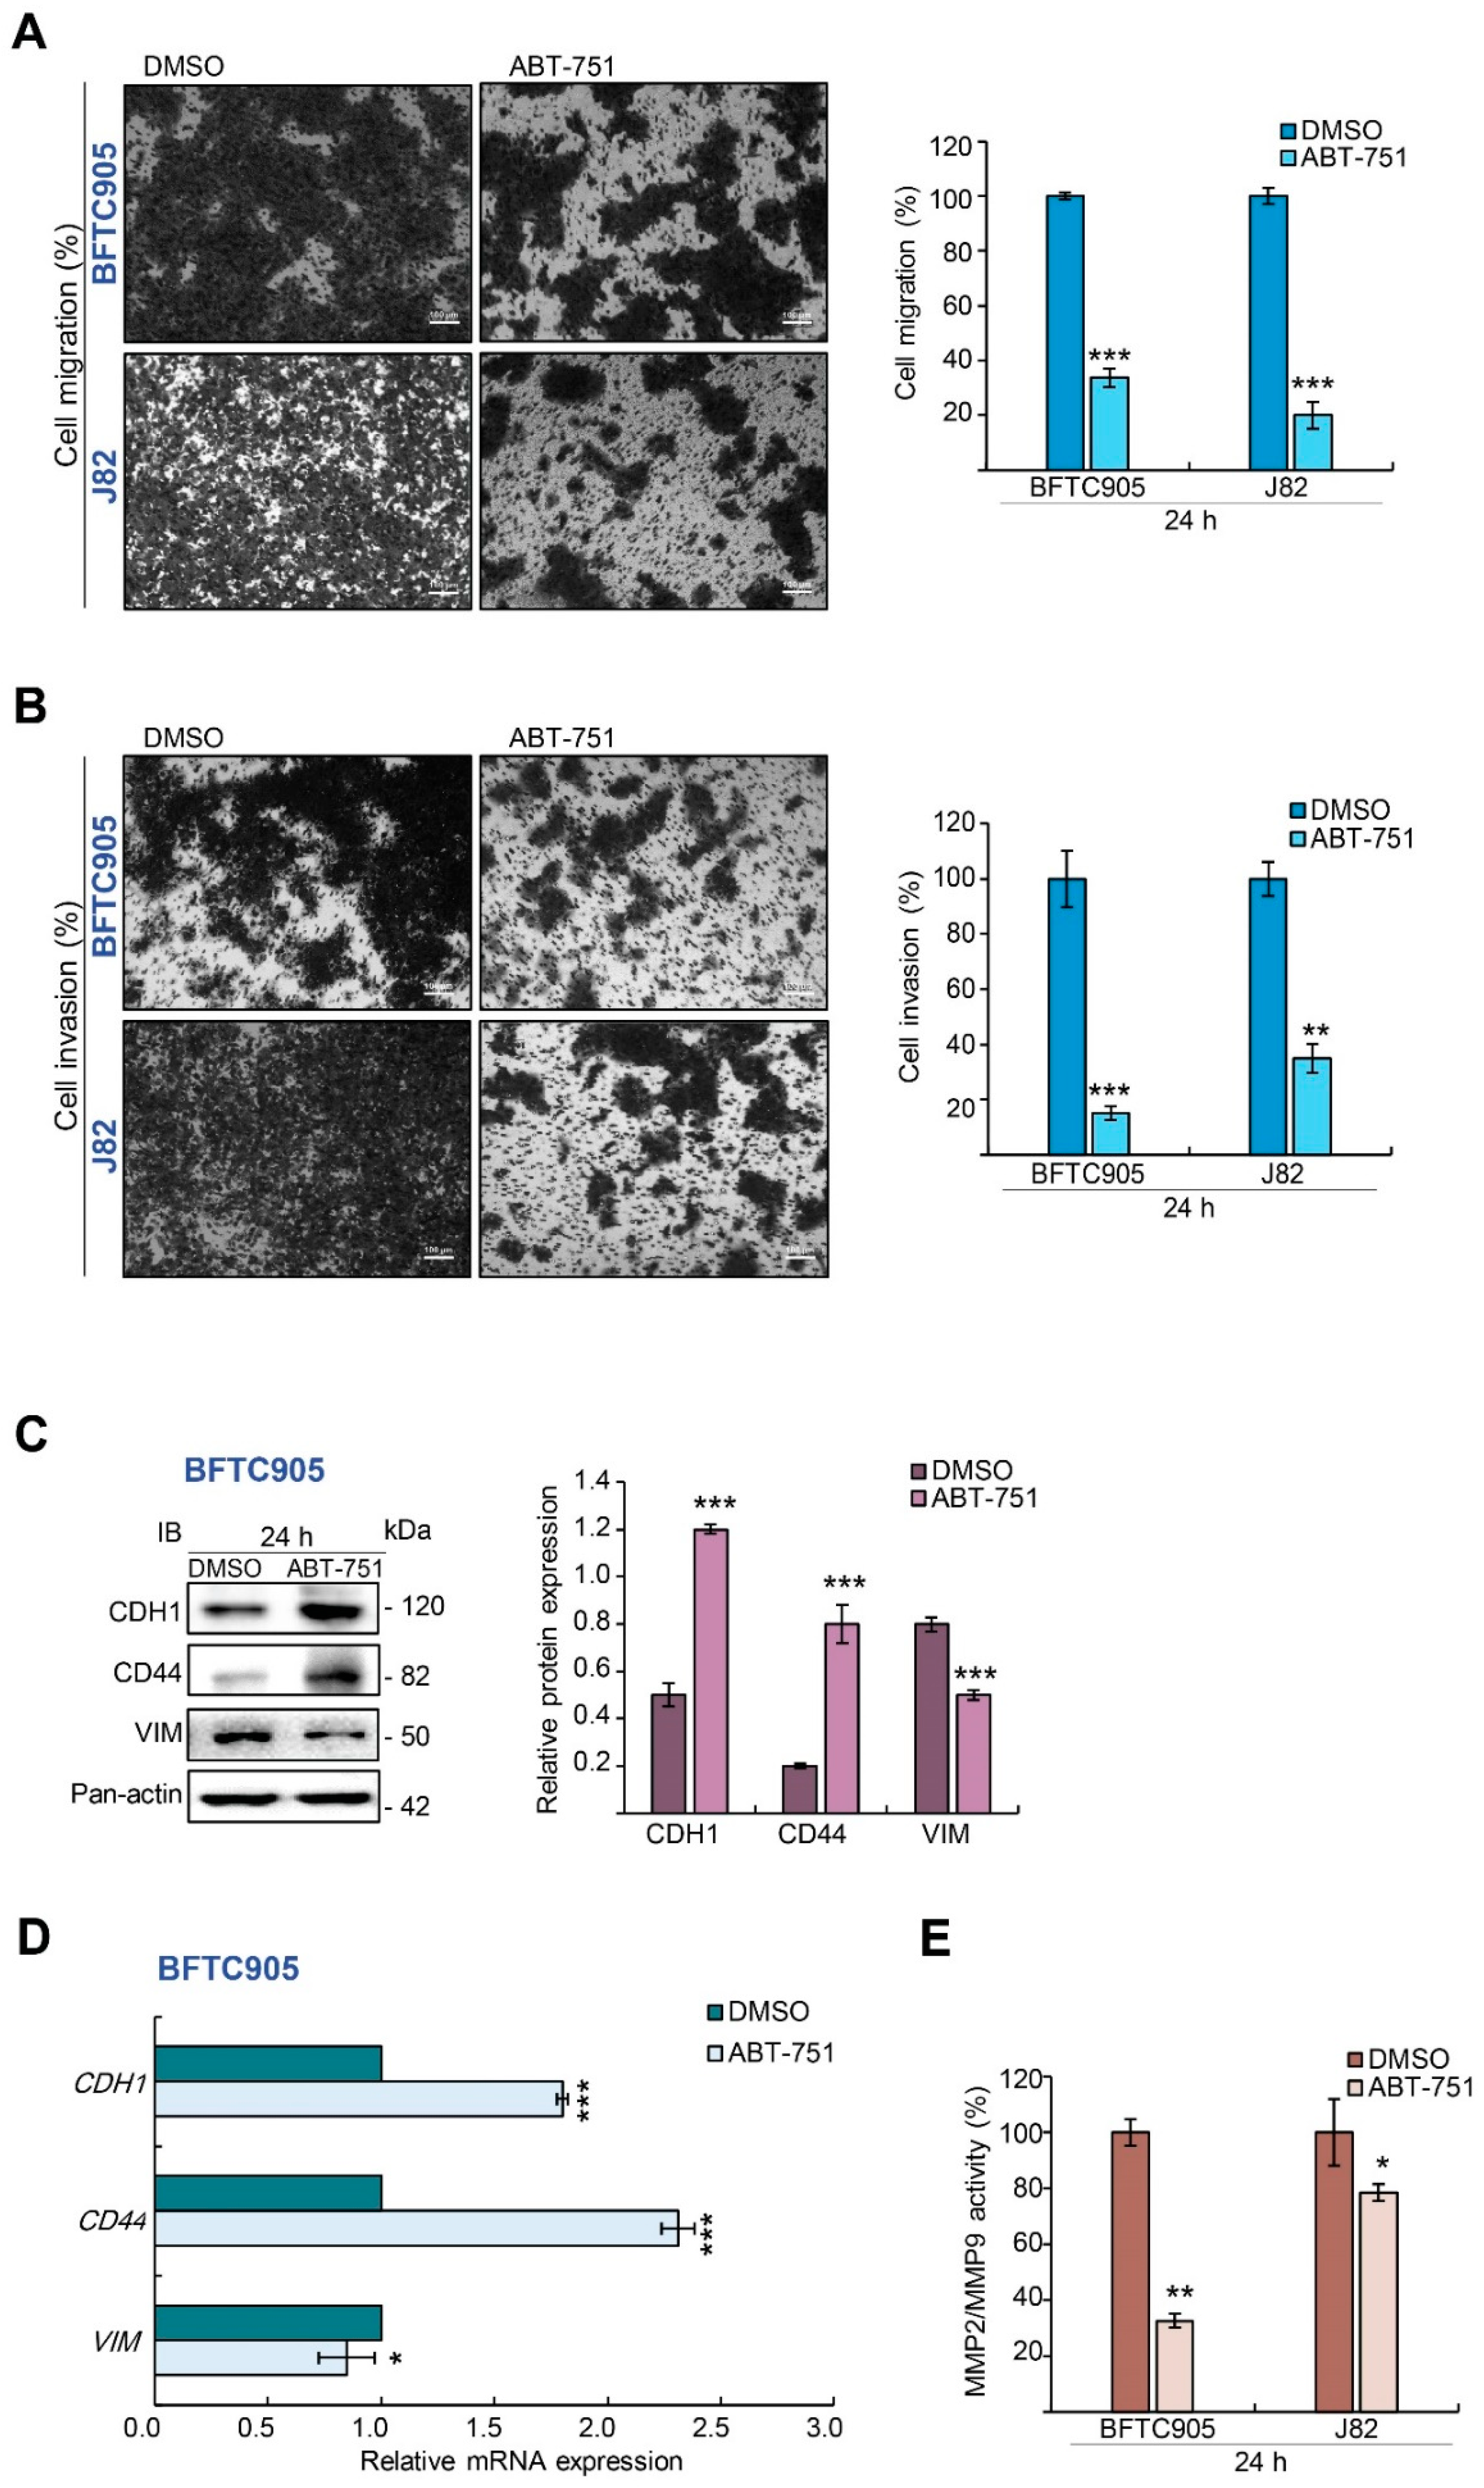
2.2. ABT-751 Inhibits Migration and Invasion in BFTC905 Cells
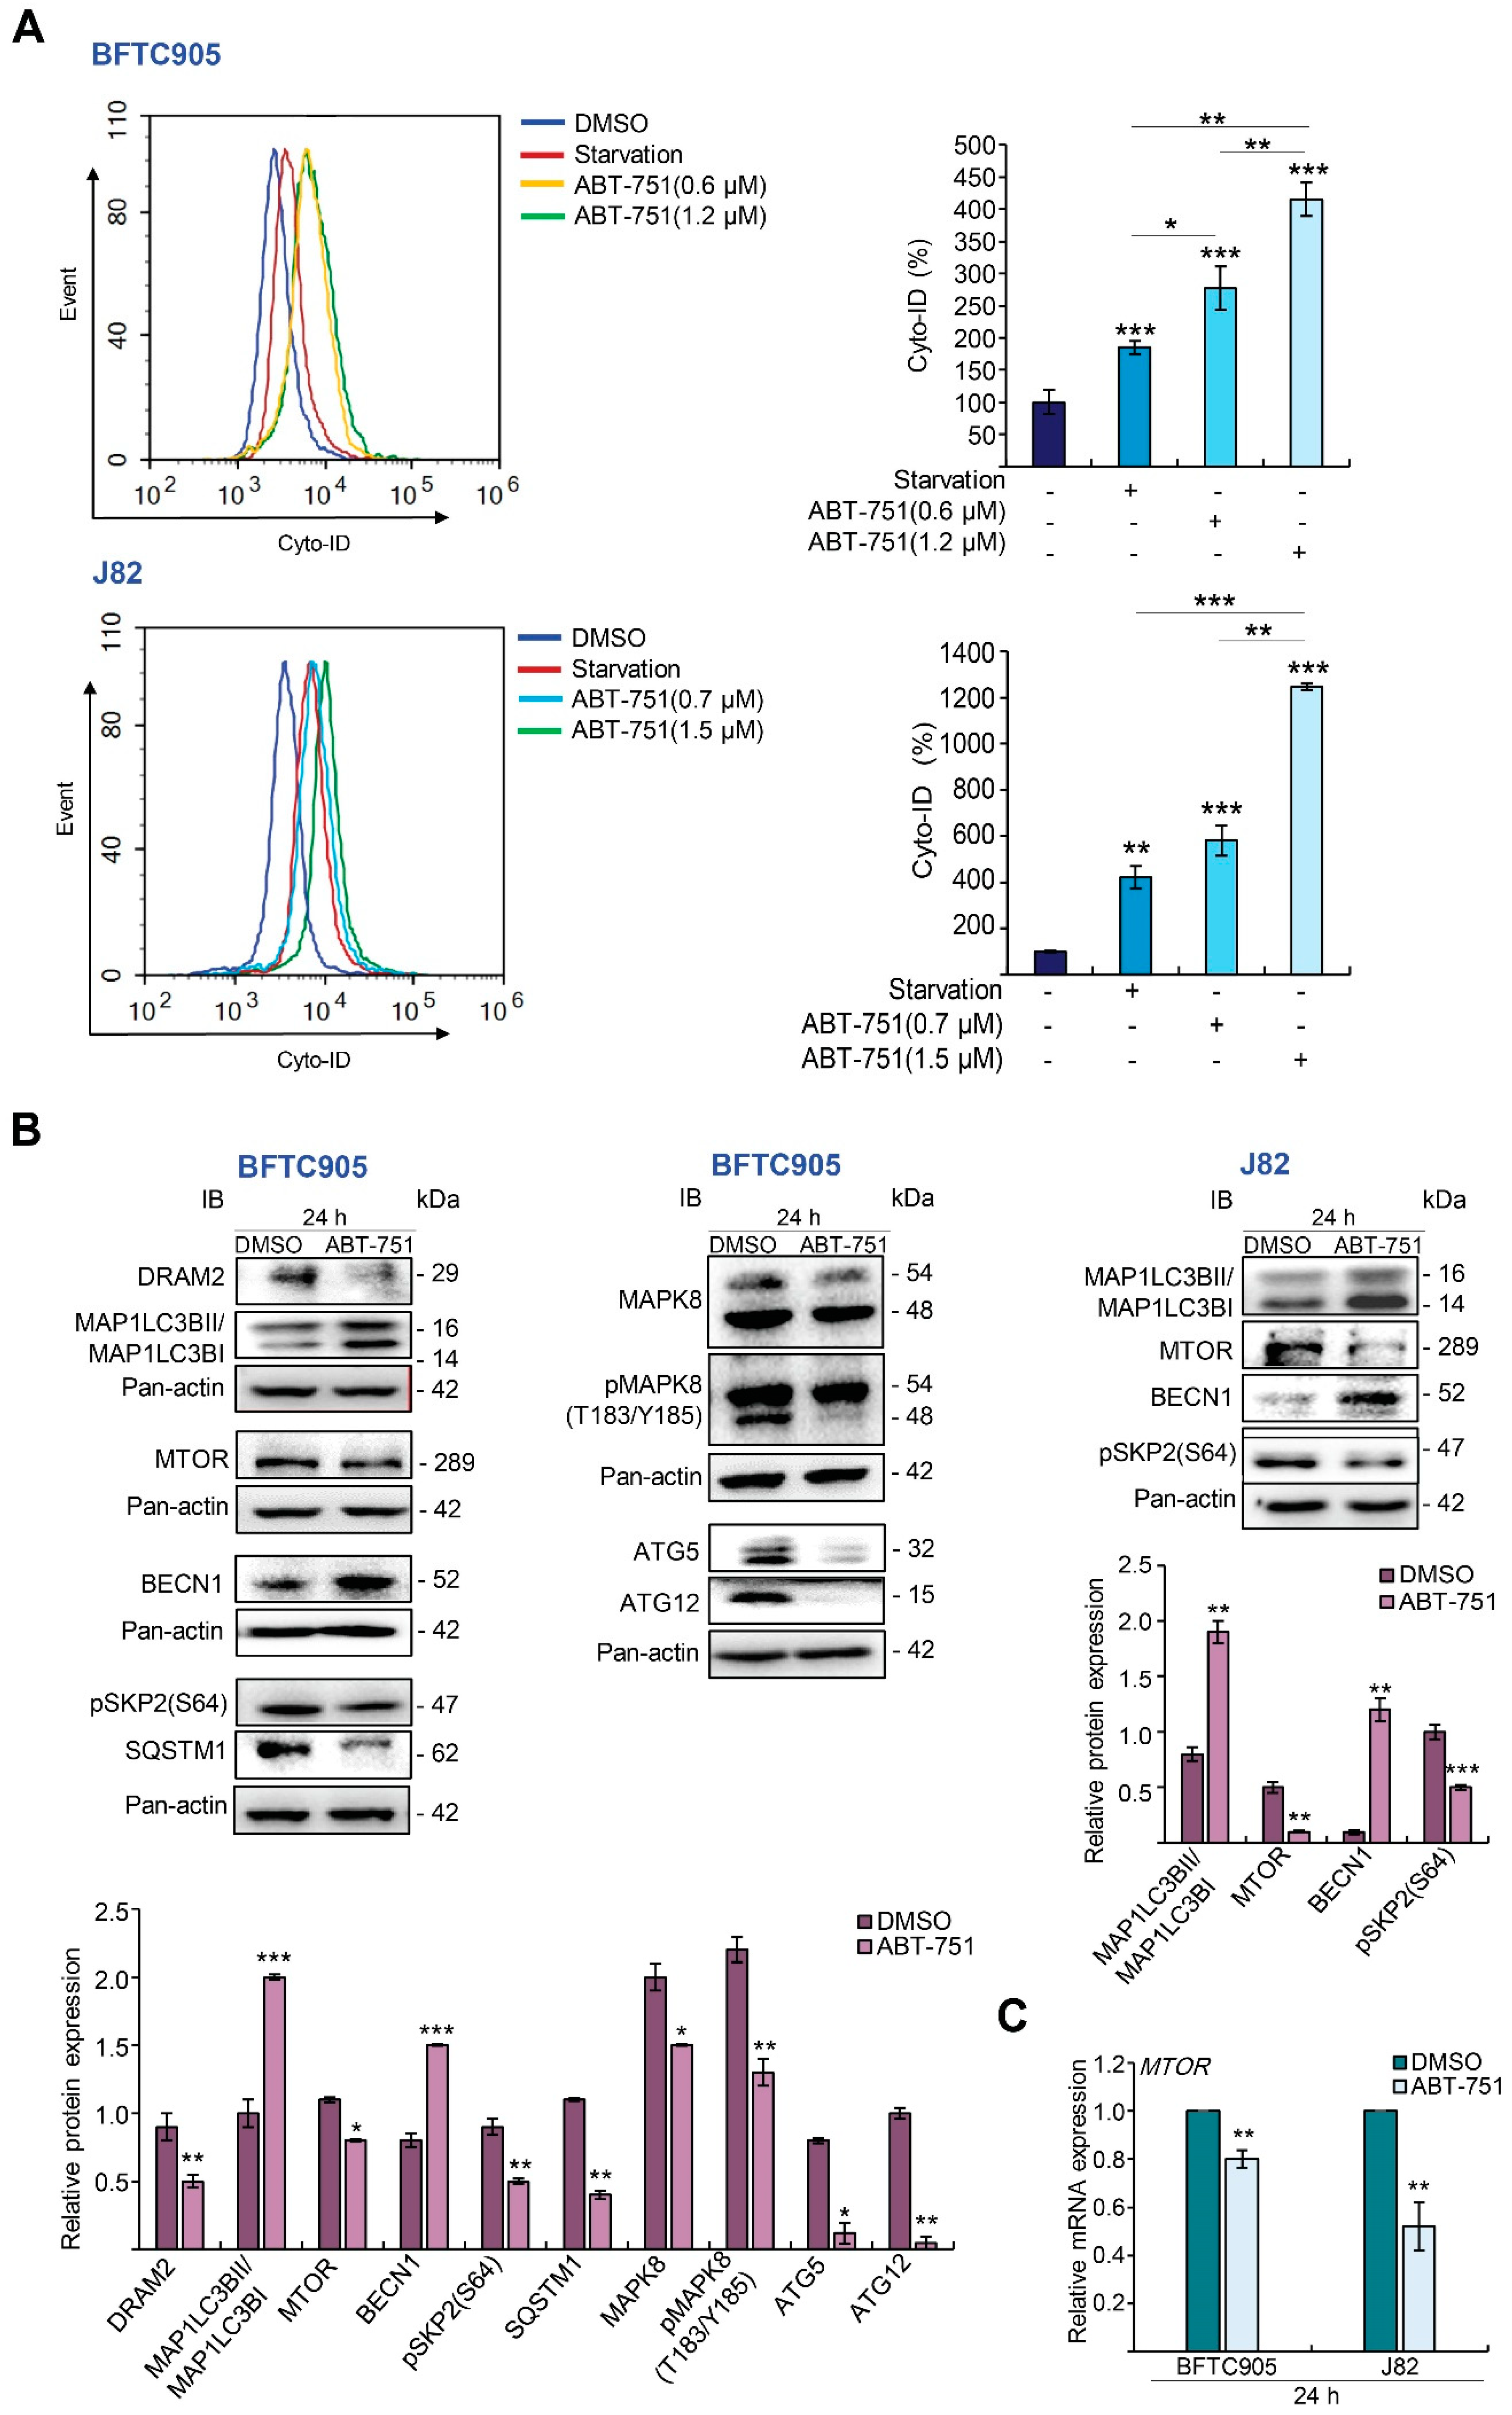
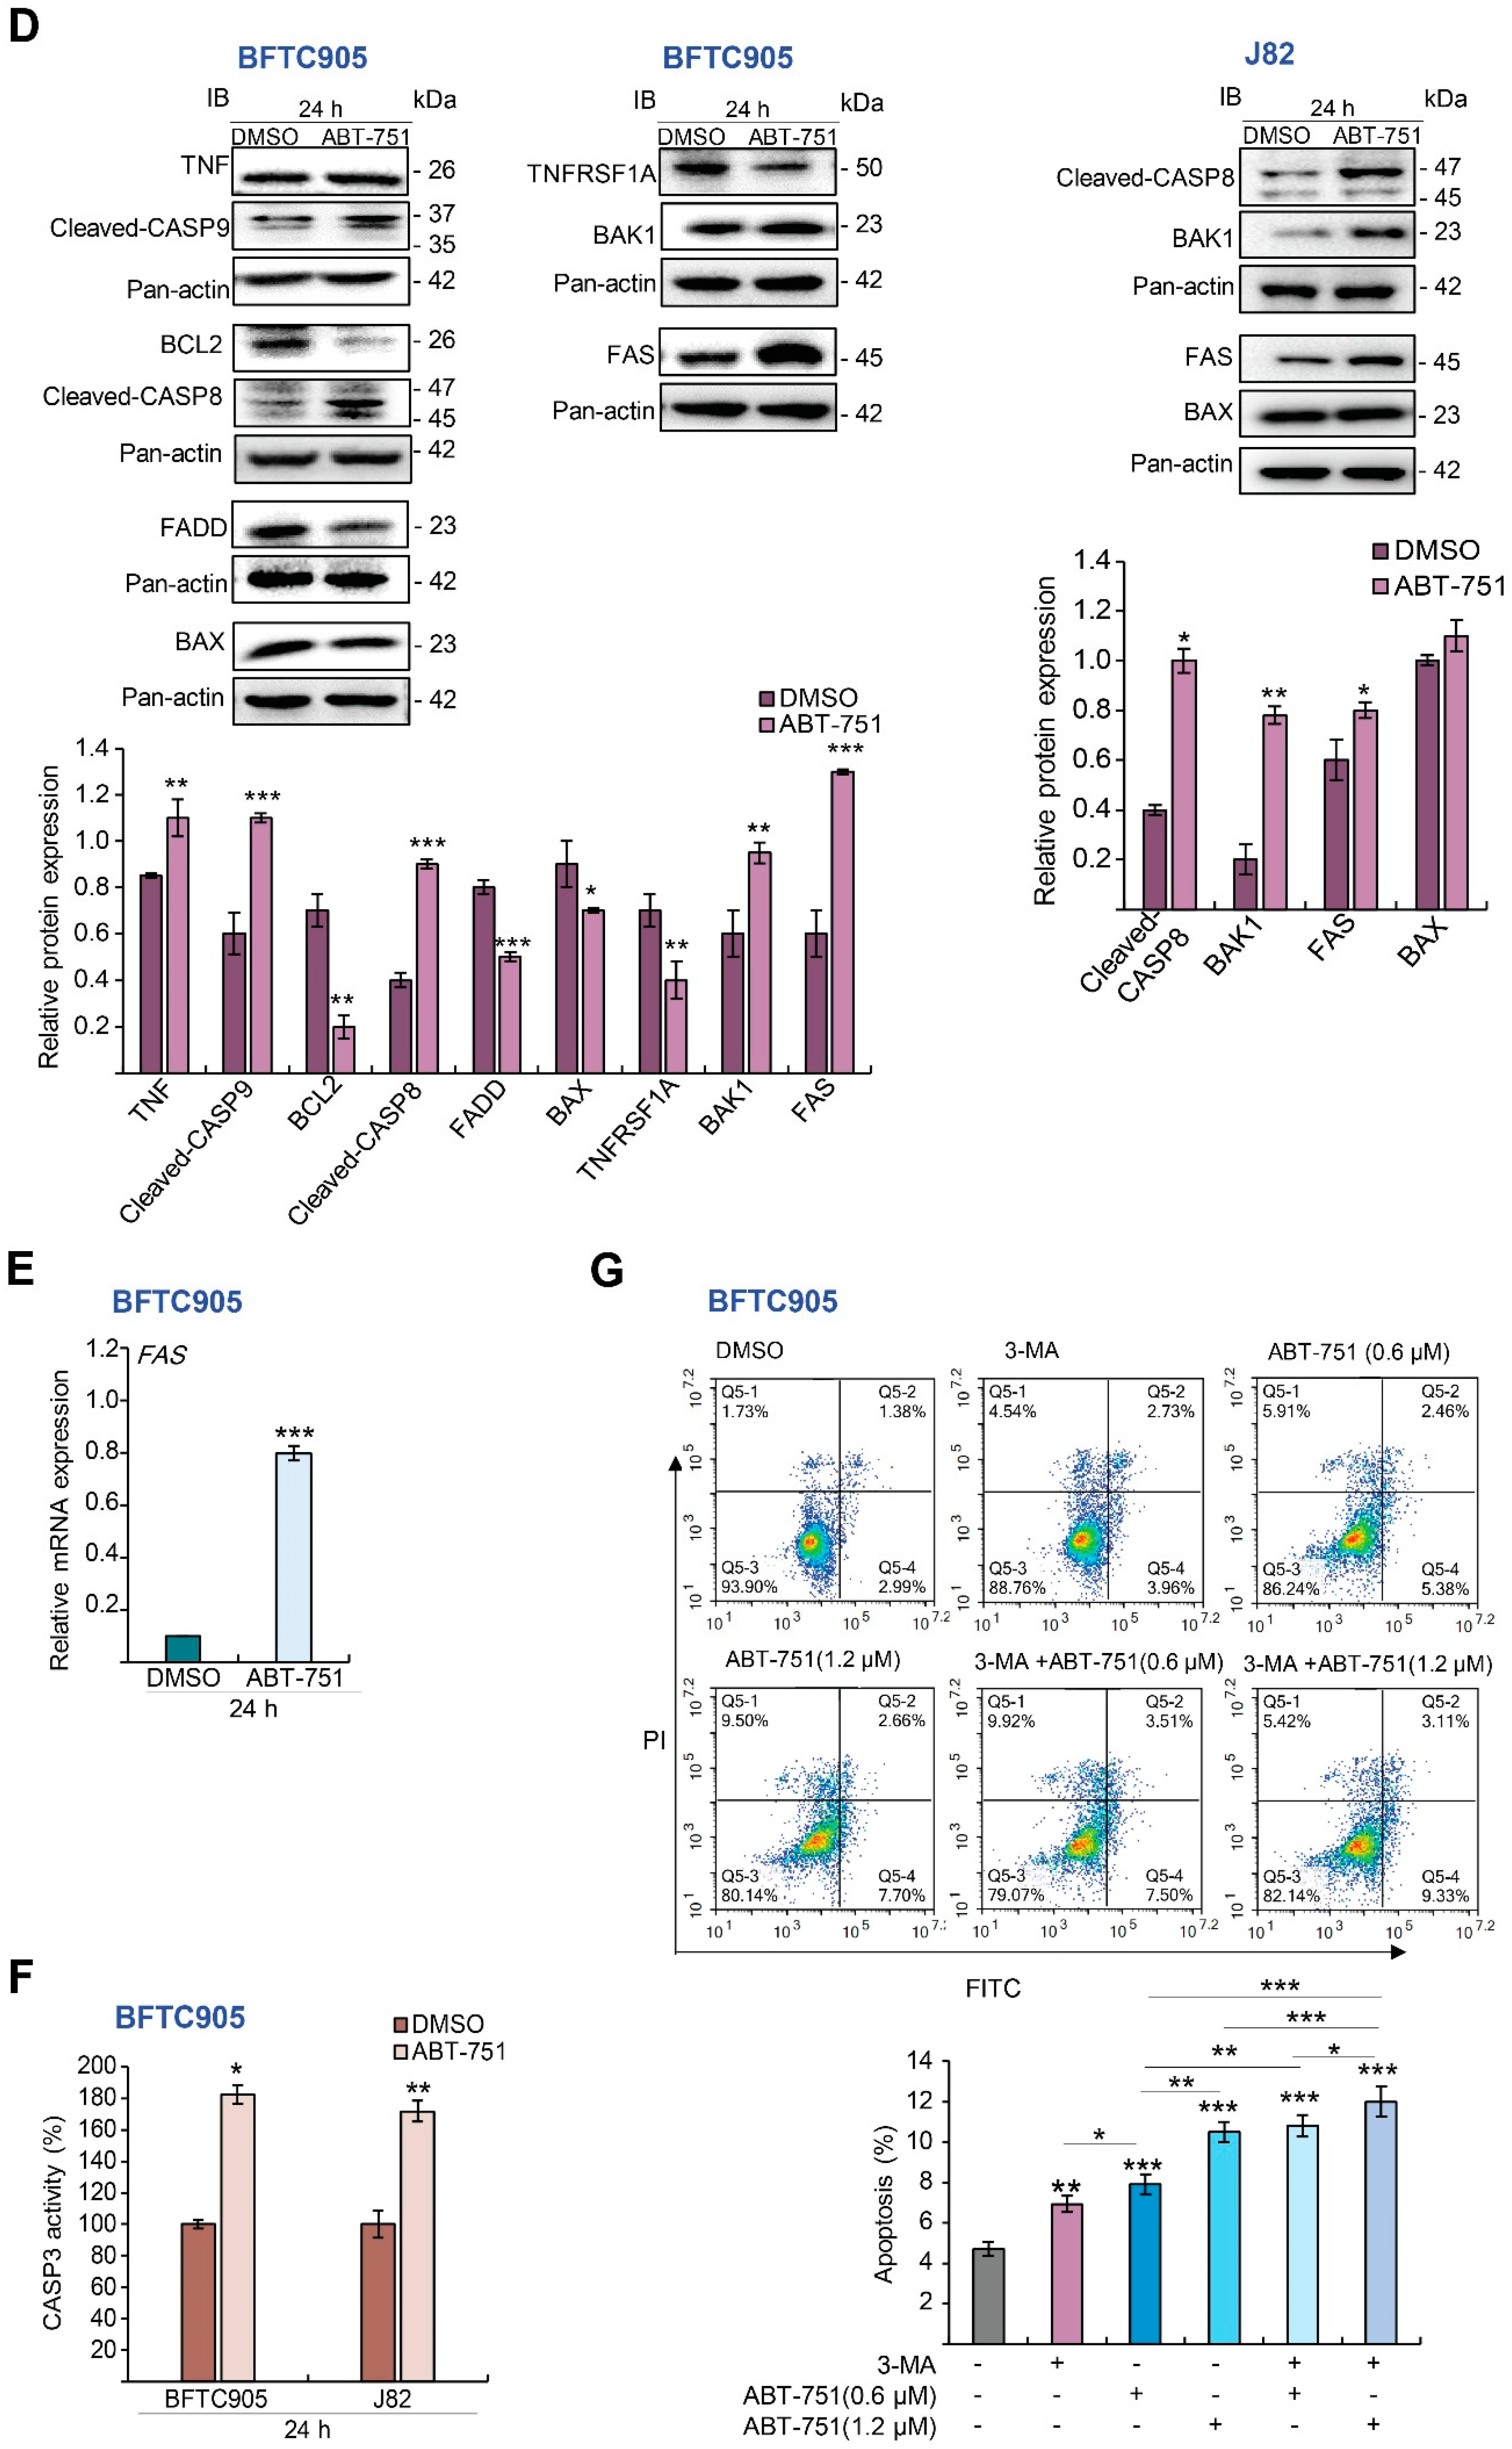
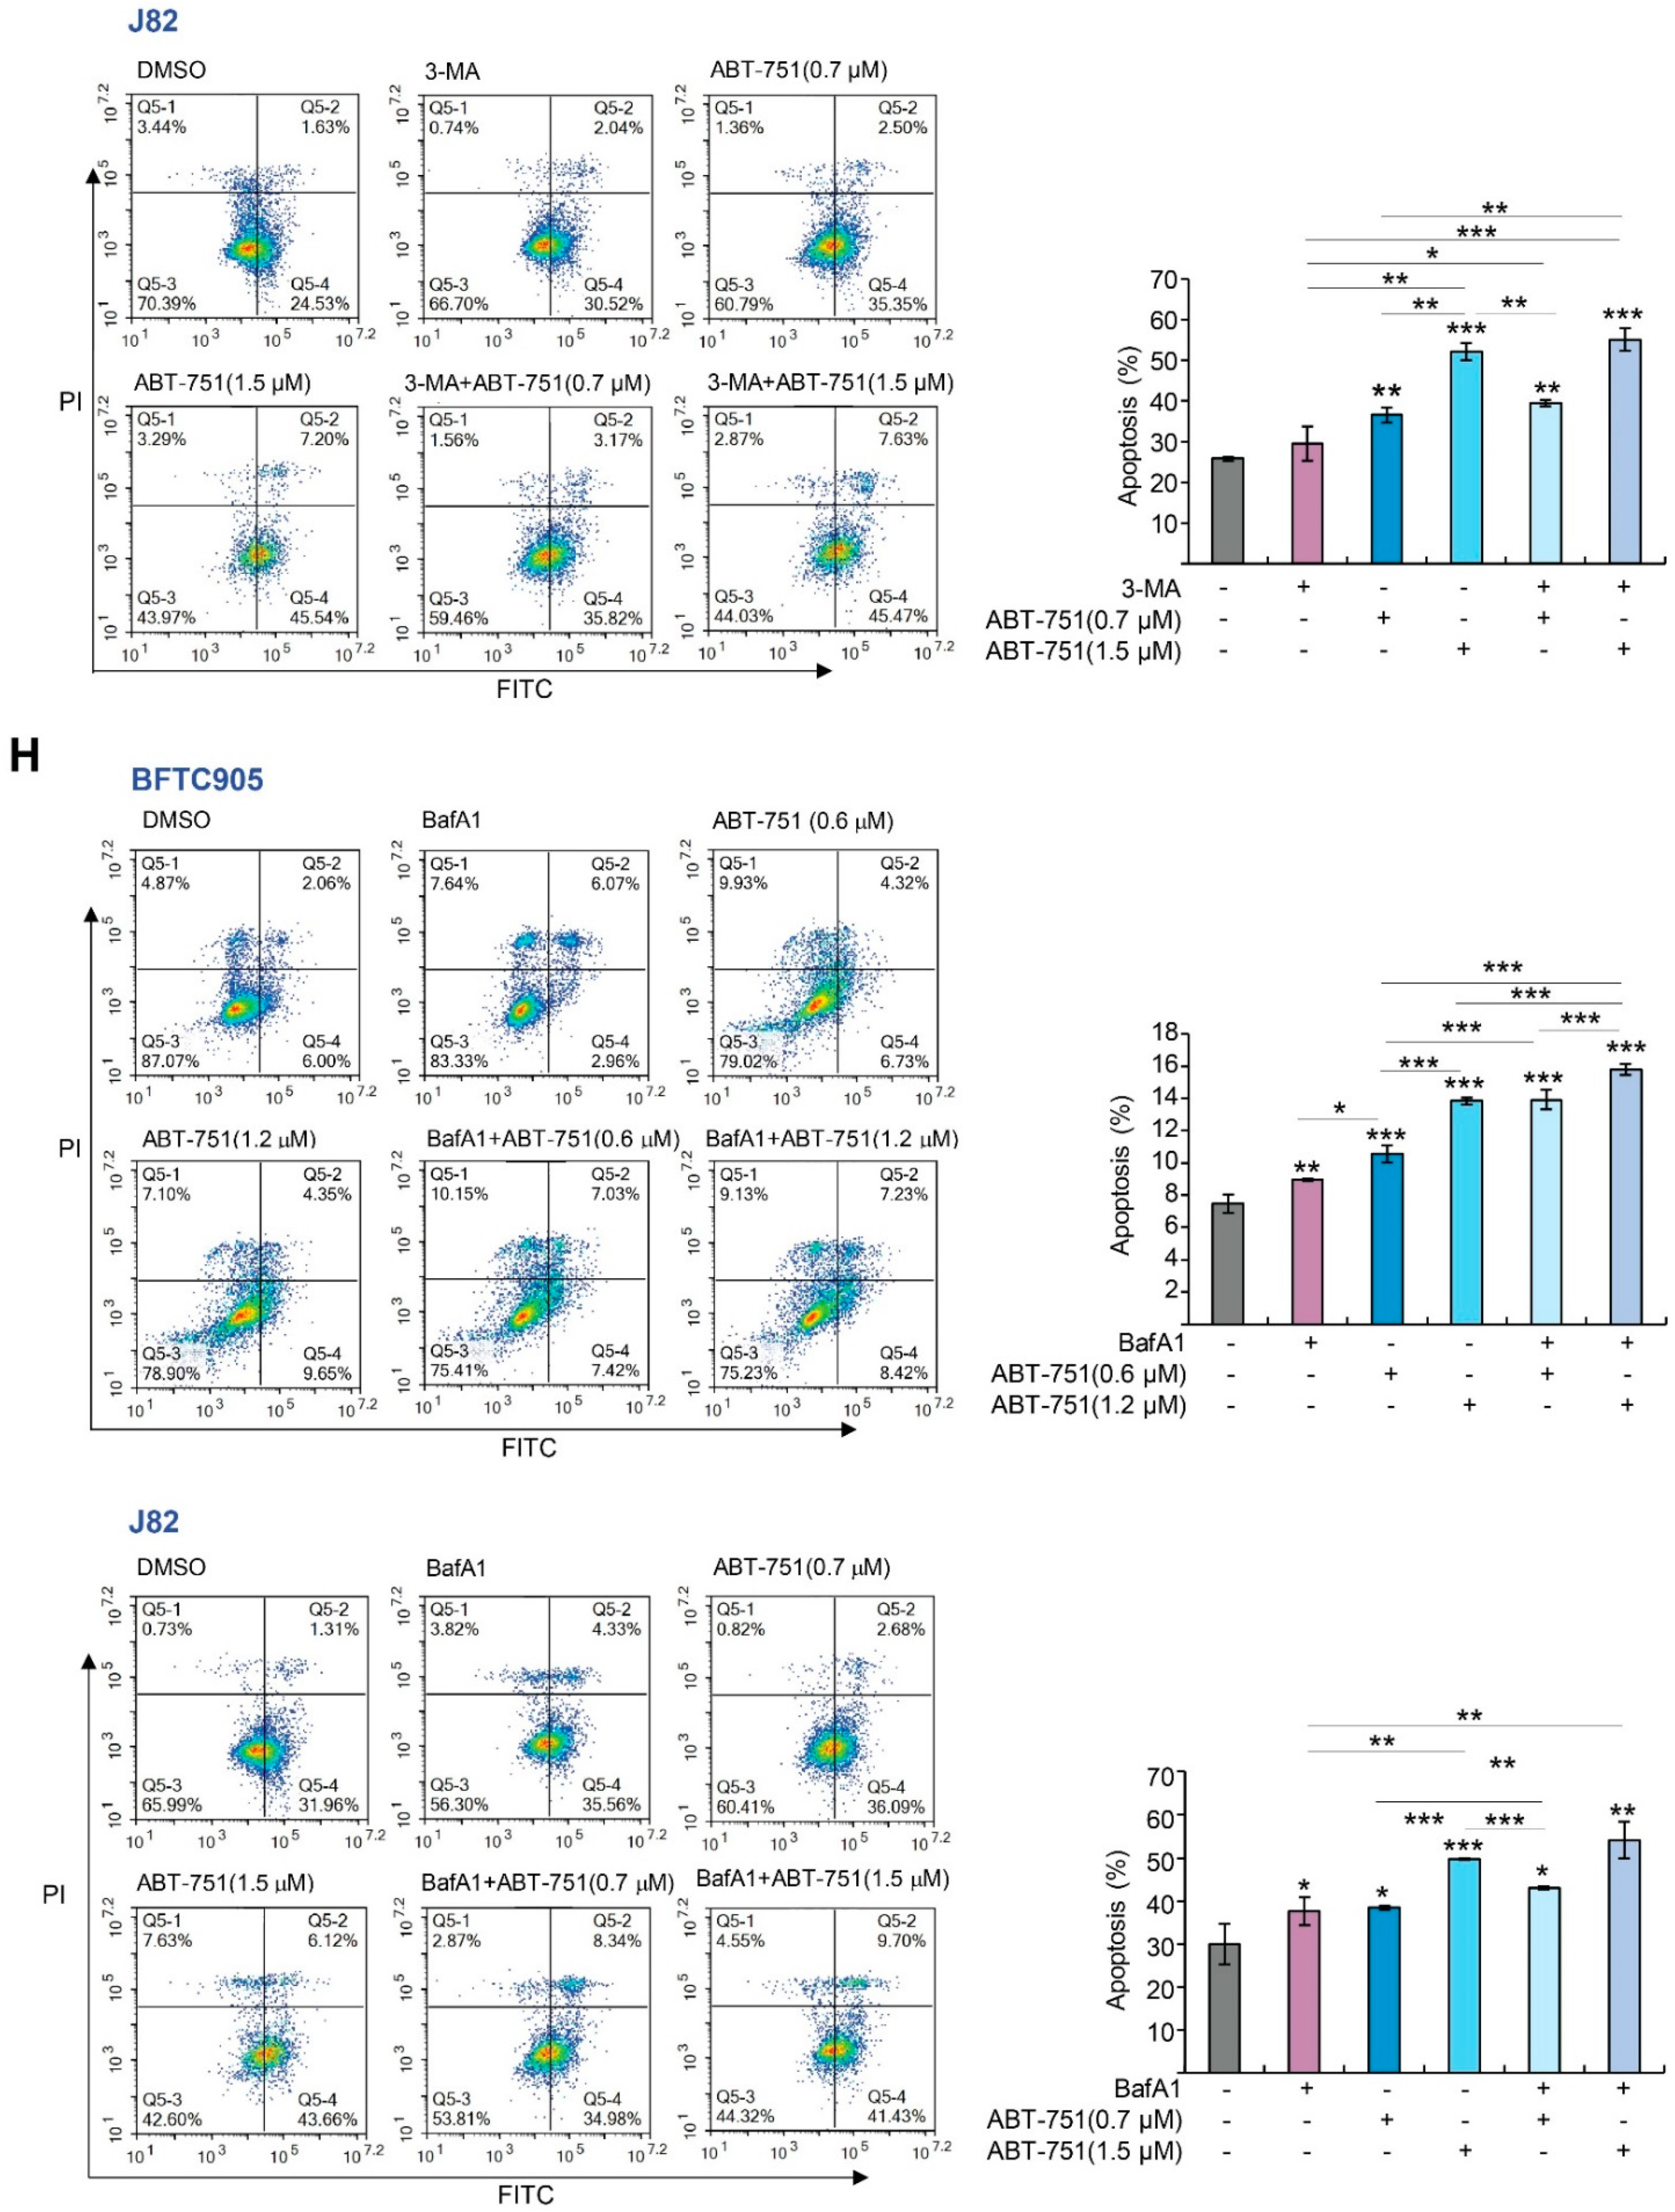
2.3. ABT-751 Induces Autophagy, Apoptosis and Inhibition of the Formation of Autophagosome Augments ABT-751-Induced Apoptosis in BFTC905 and J82 Cells
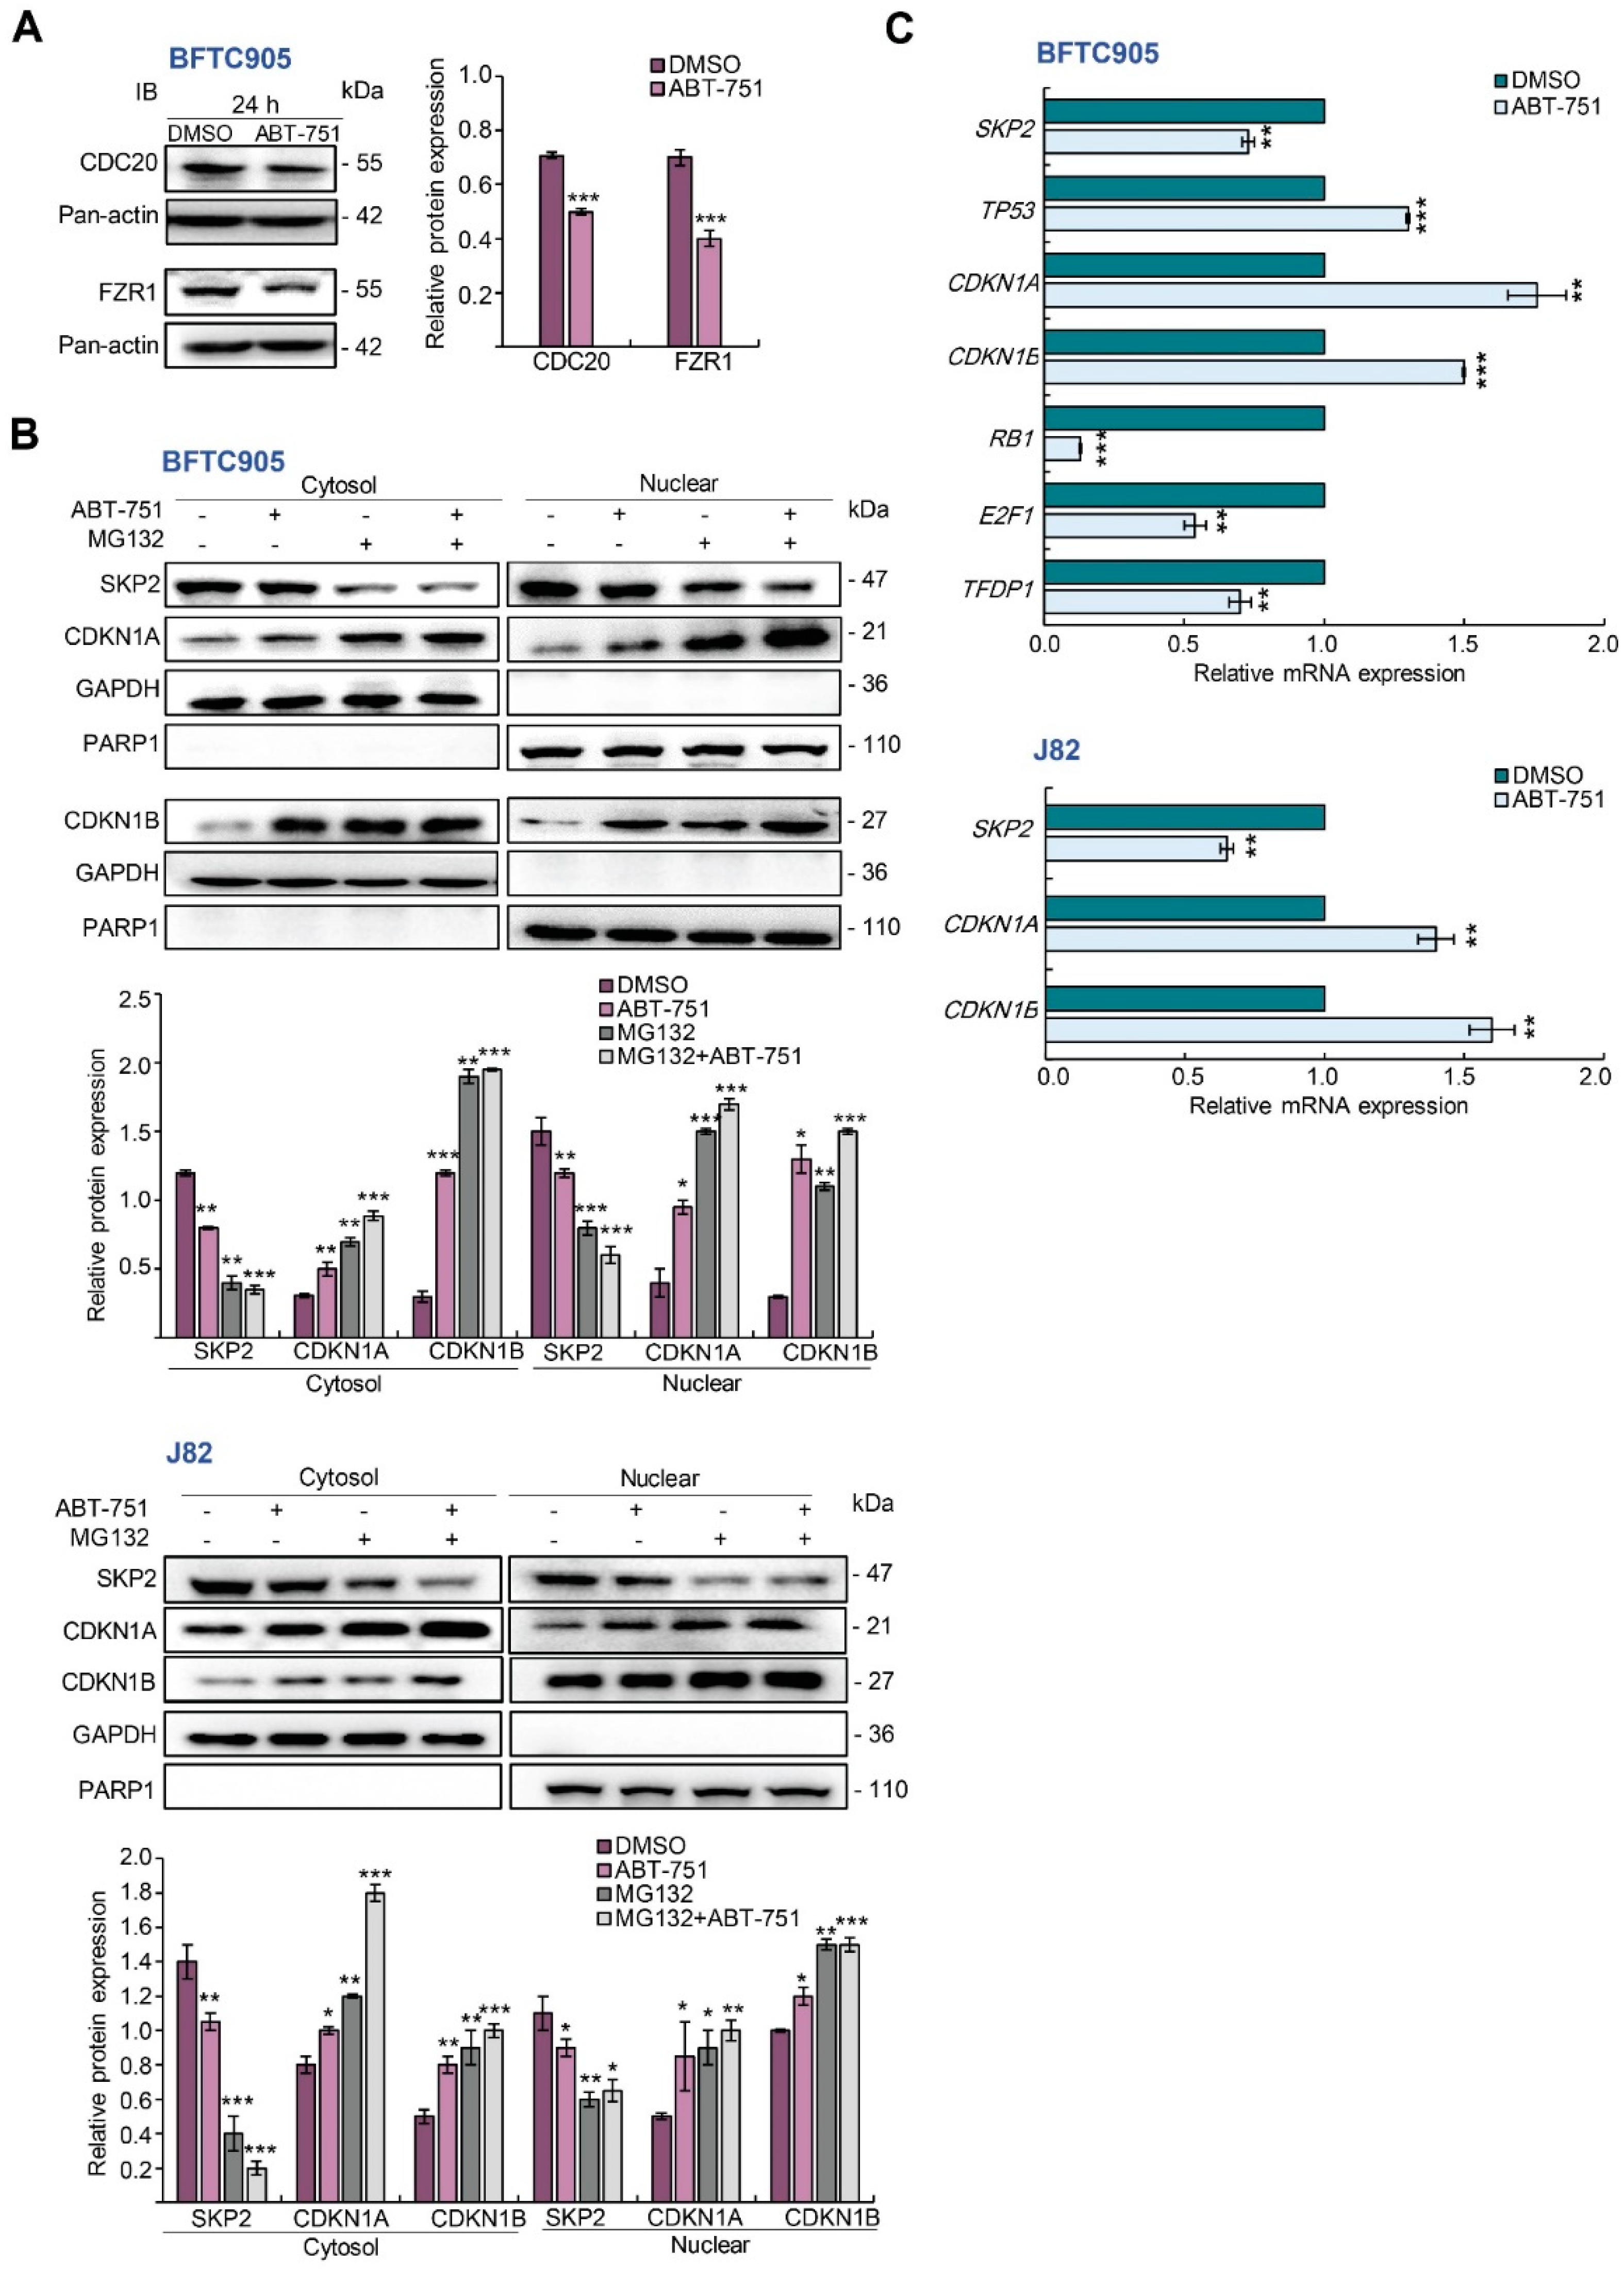
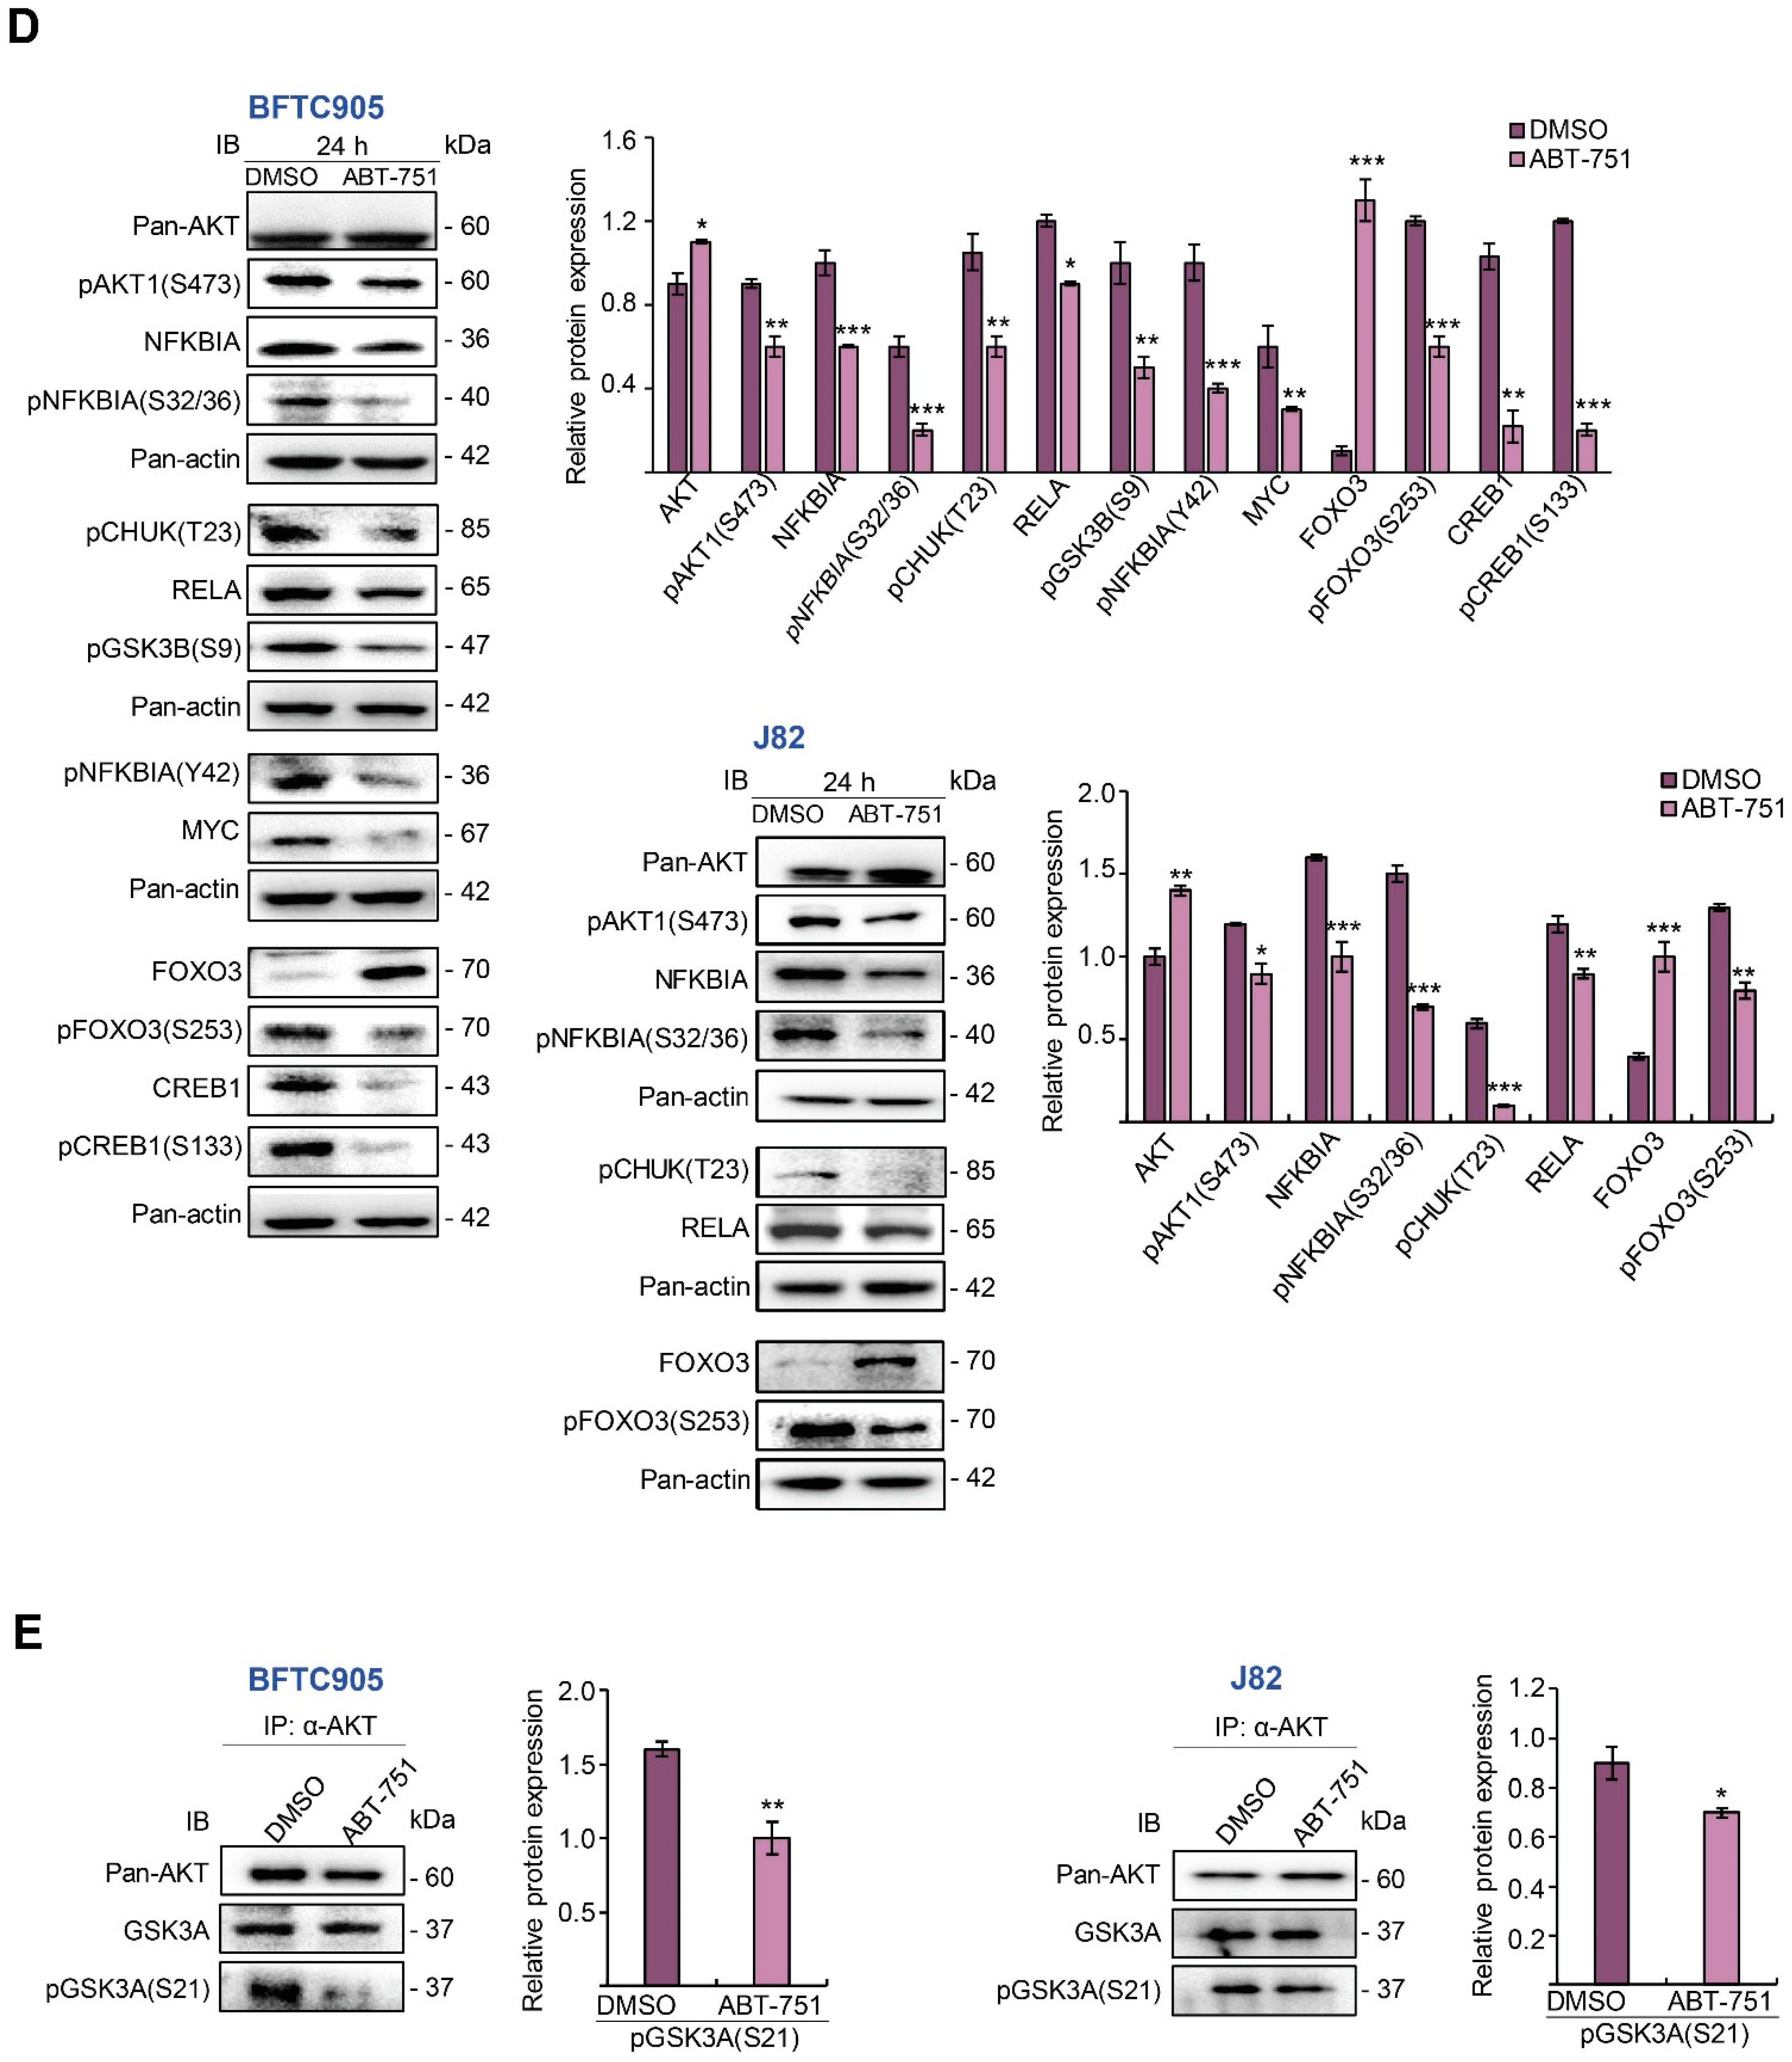
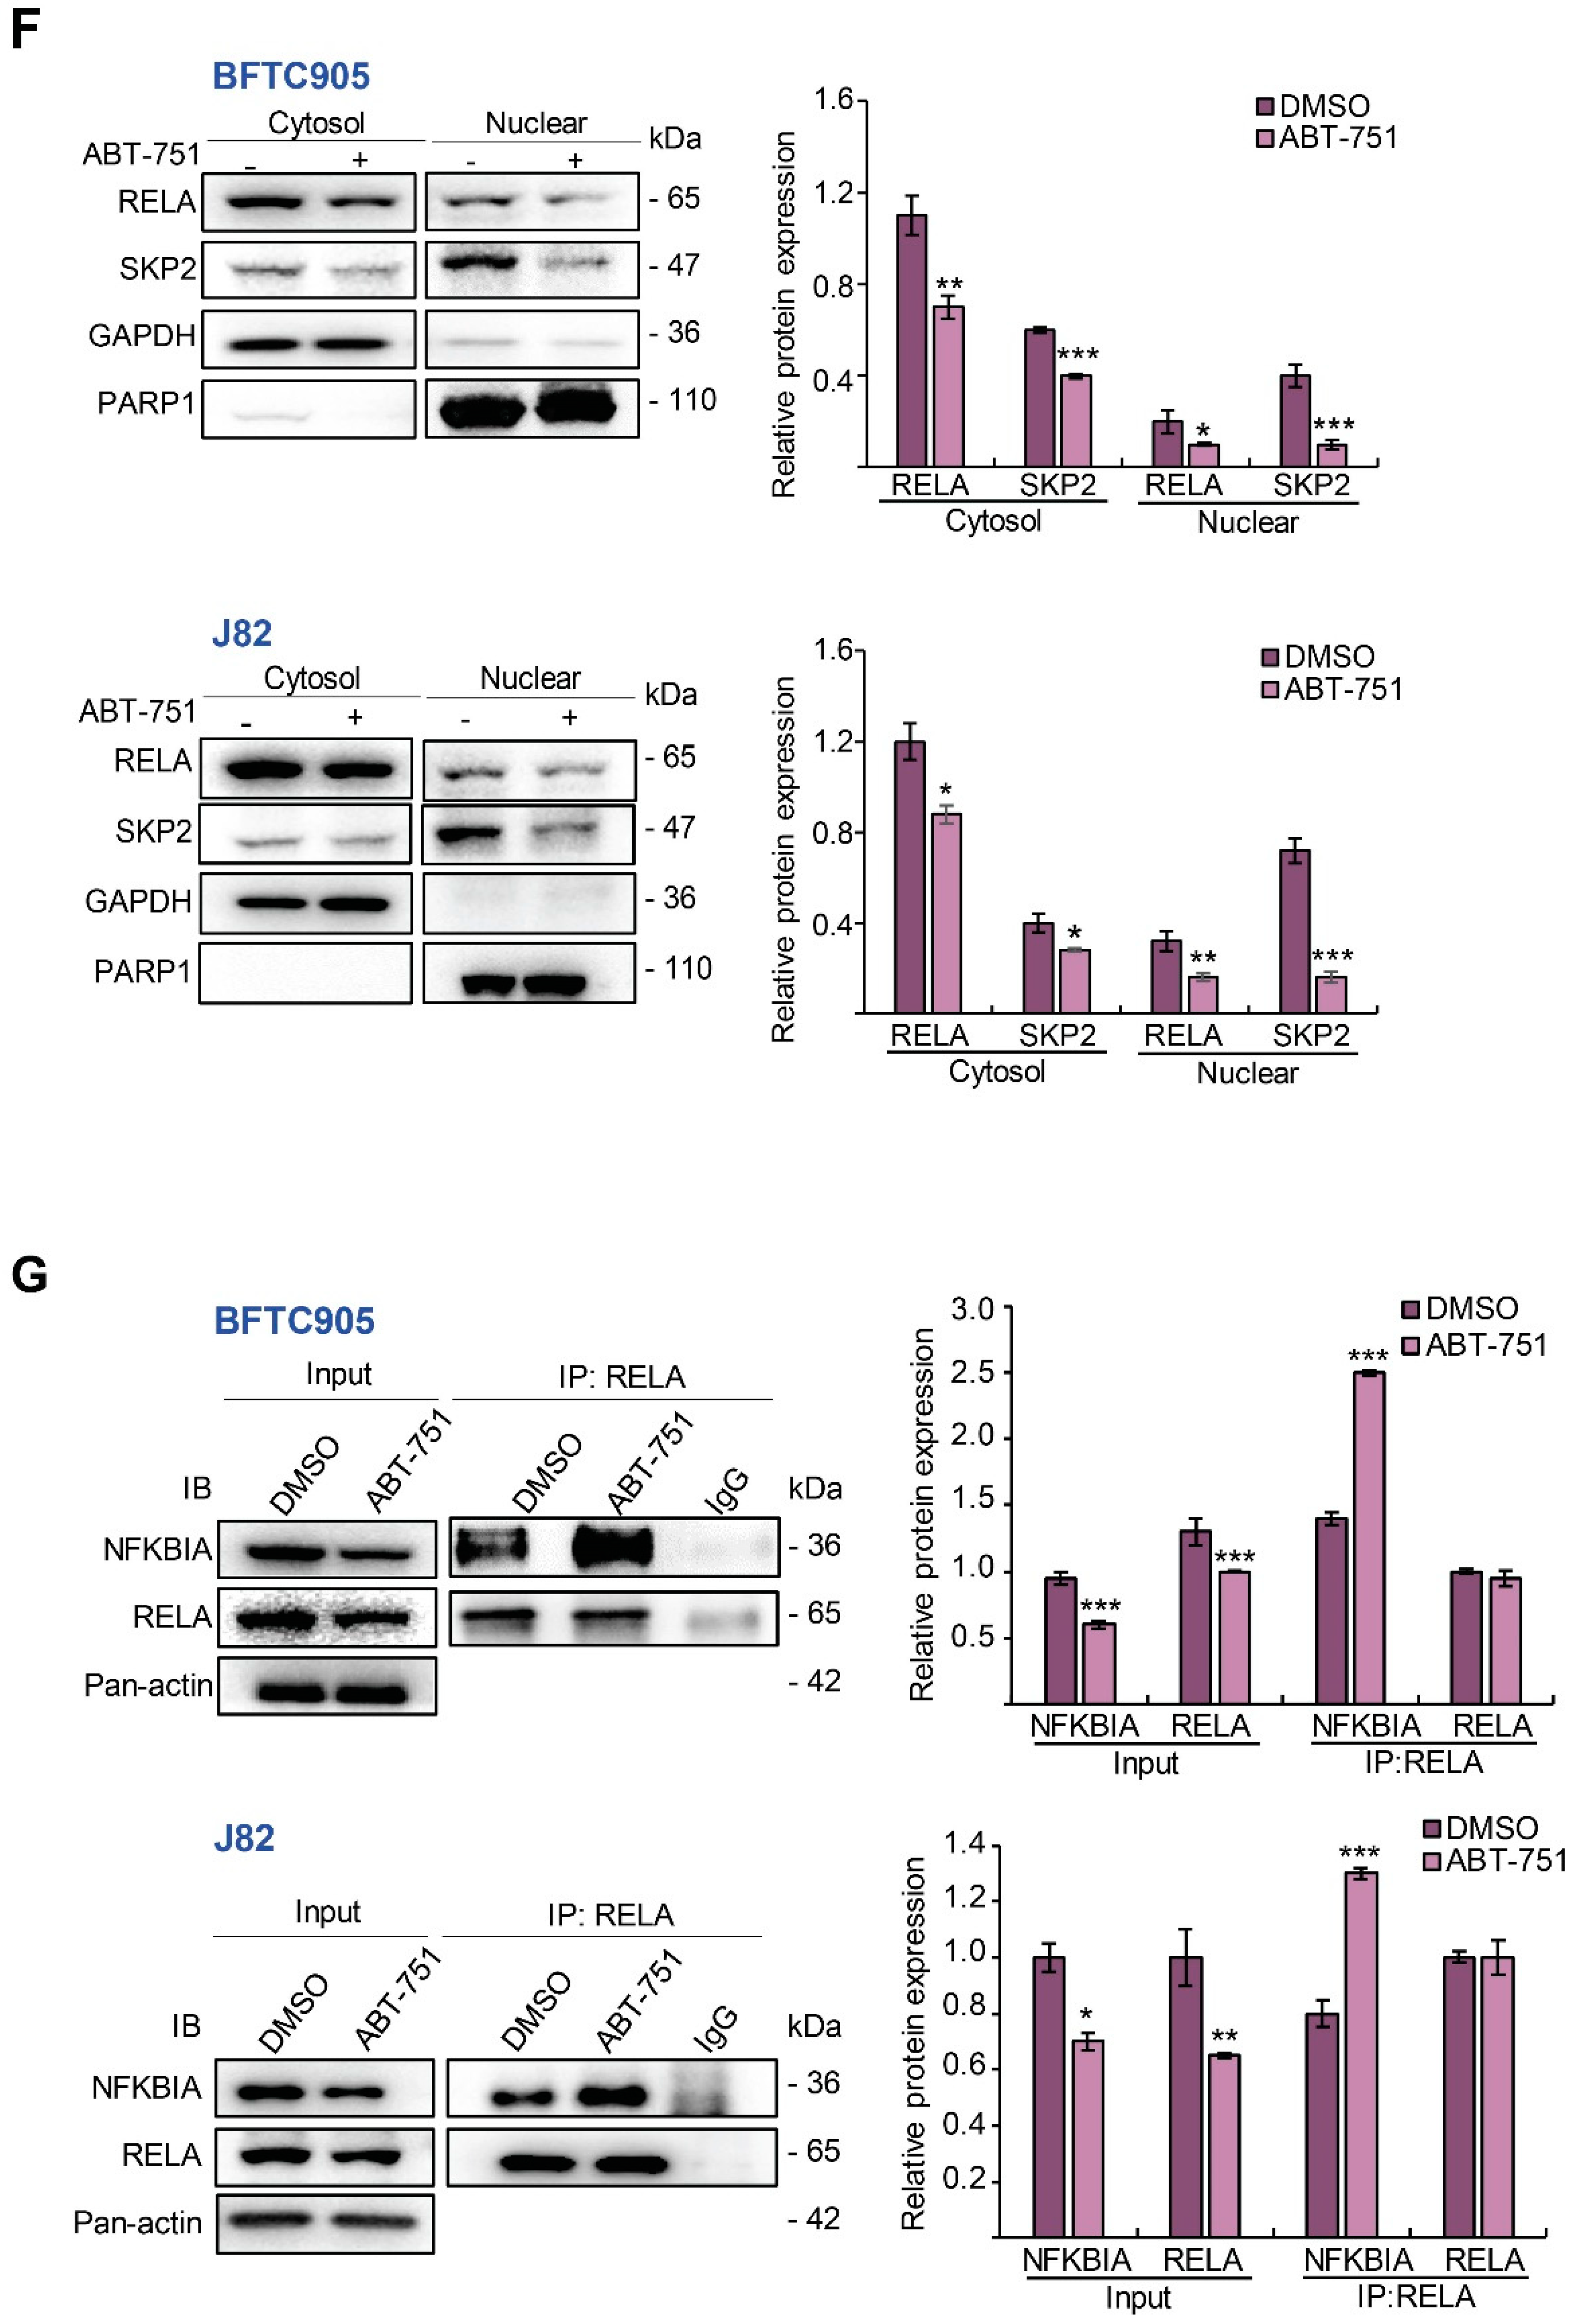
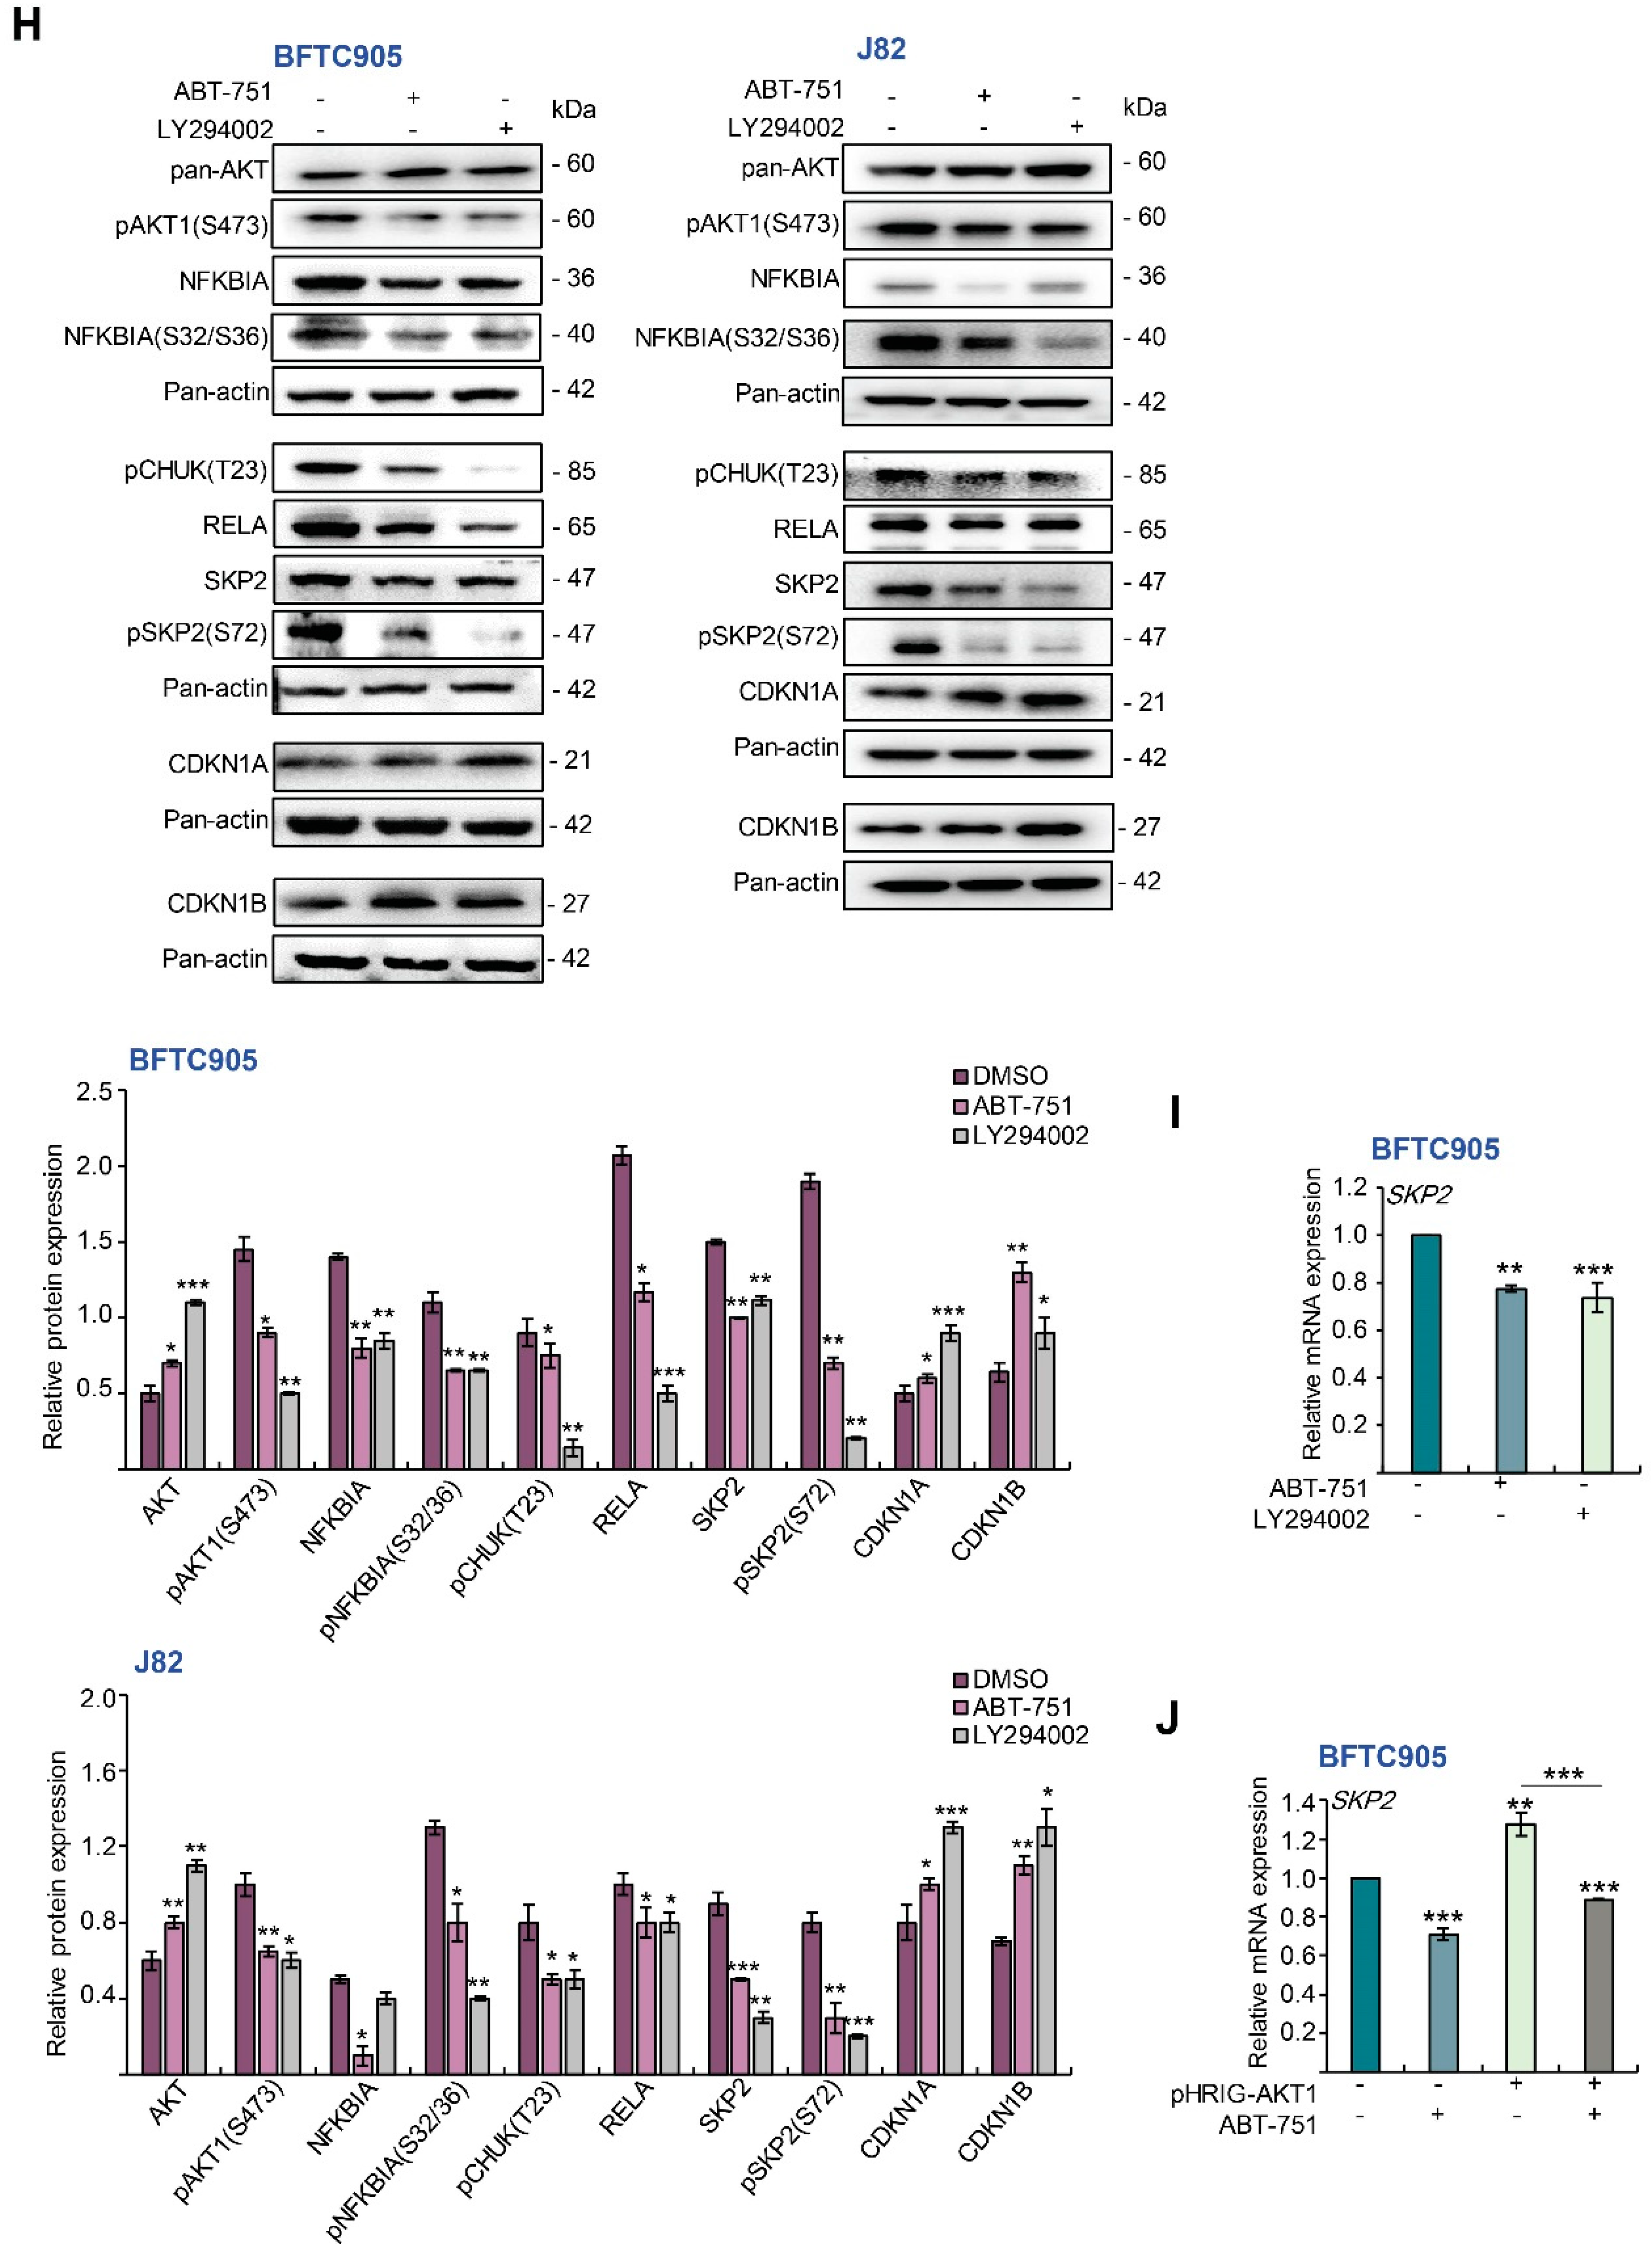
2.4. ABT-751 Suppresses SKP2 Transcription and Subsequent Translation through the Inhibition of AKT Serine/Threonine Kinase–Nuclear Factor Kappa B Signaling Pathway in BFTC905 and J82 Cells
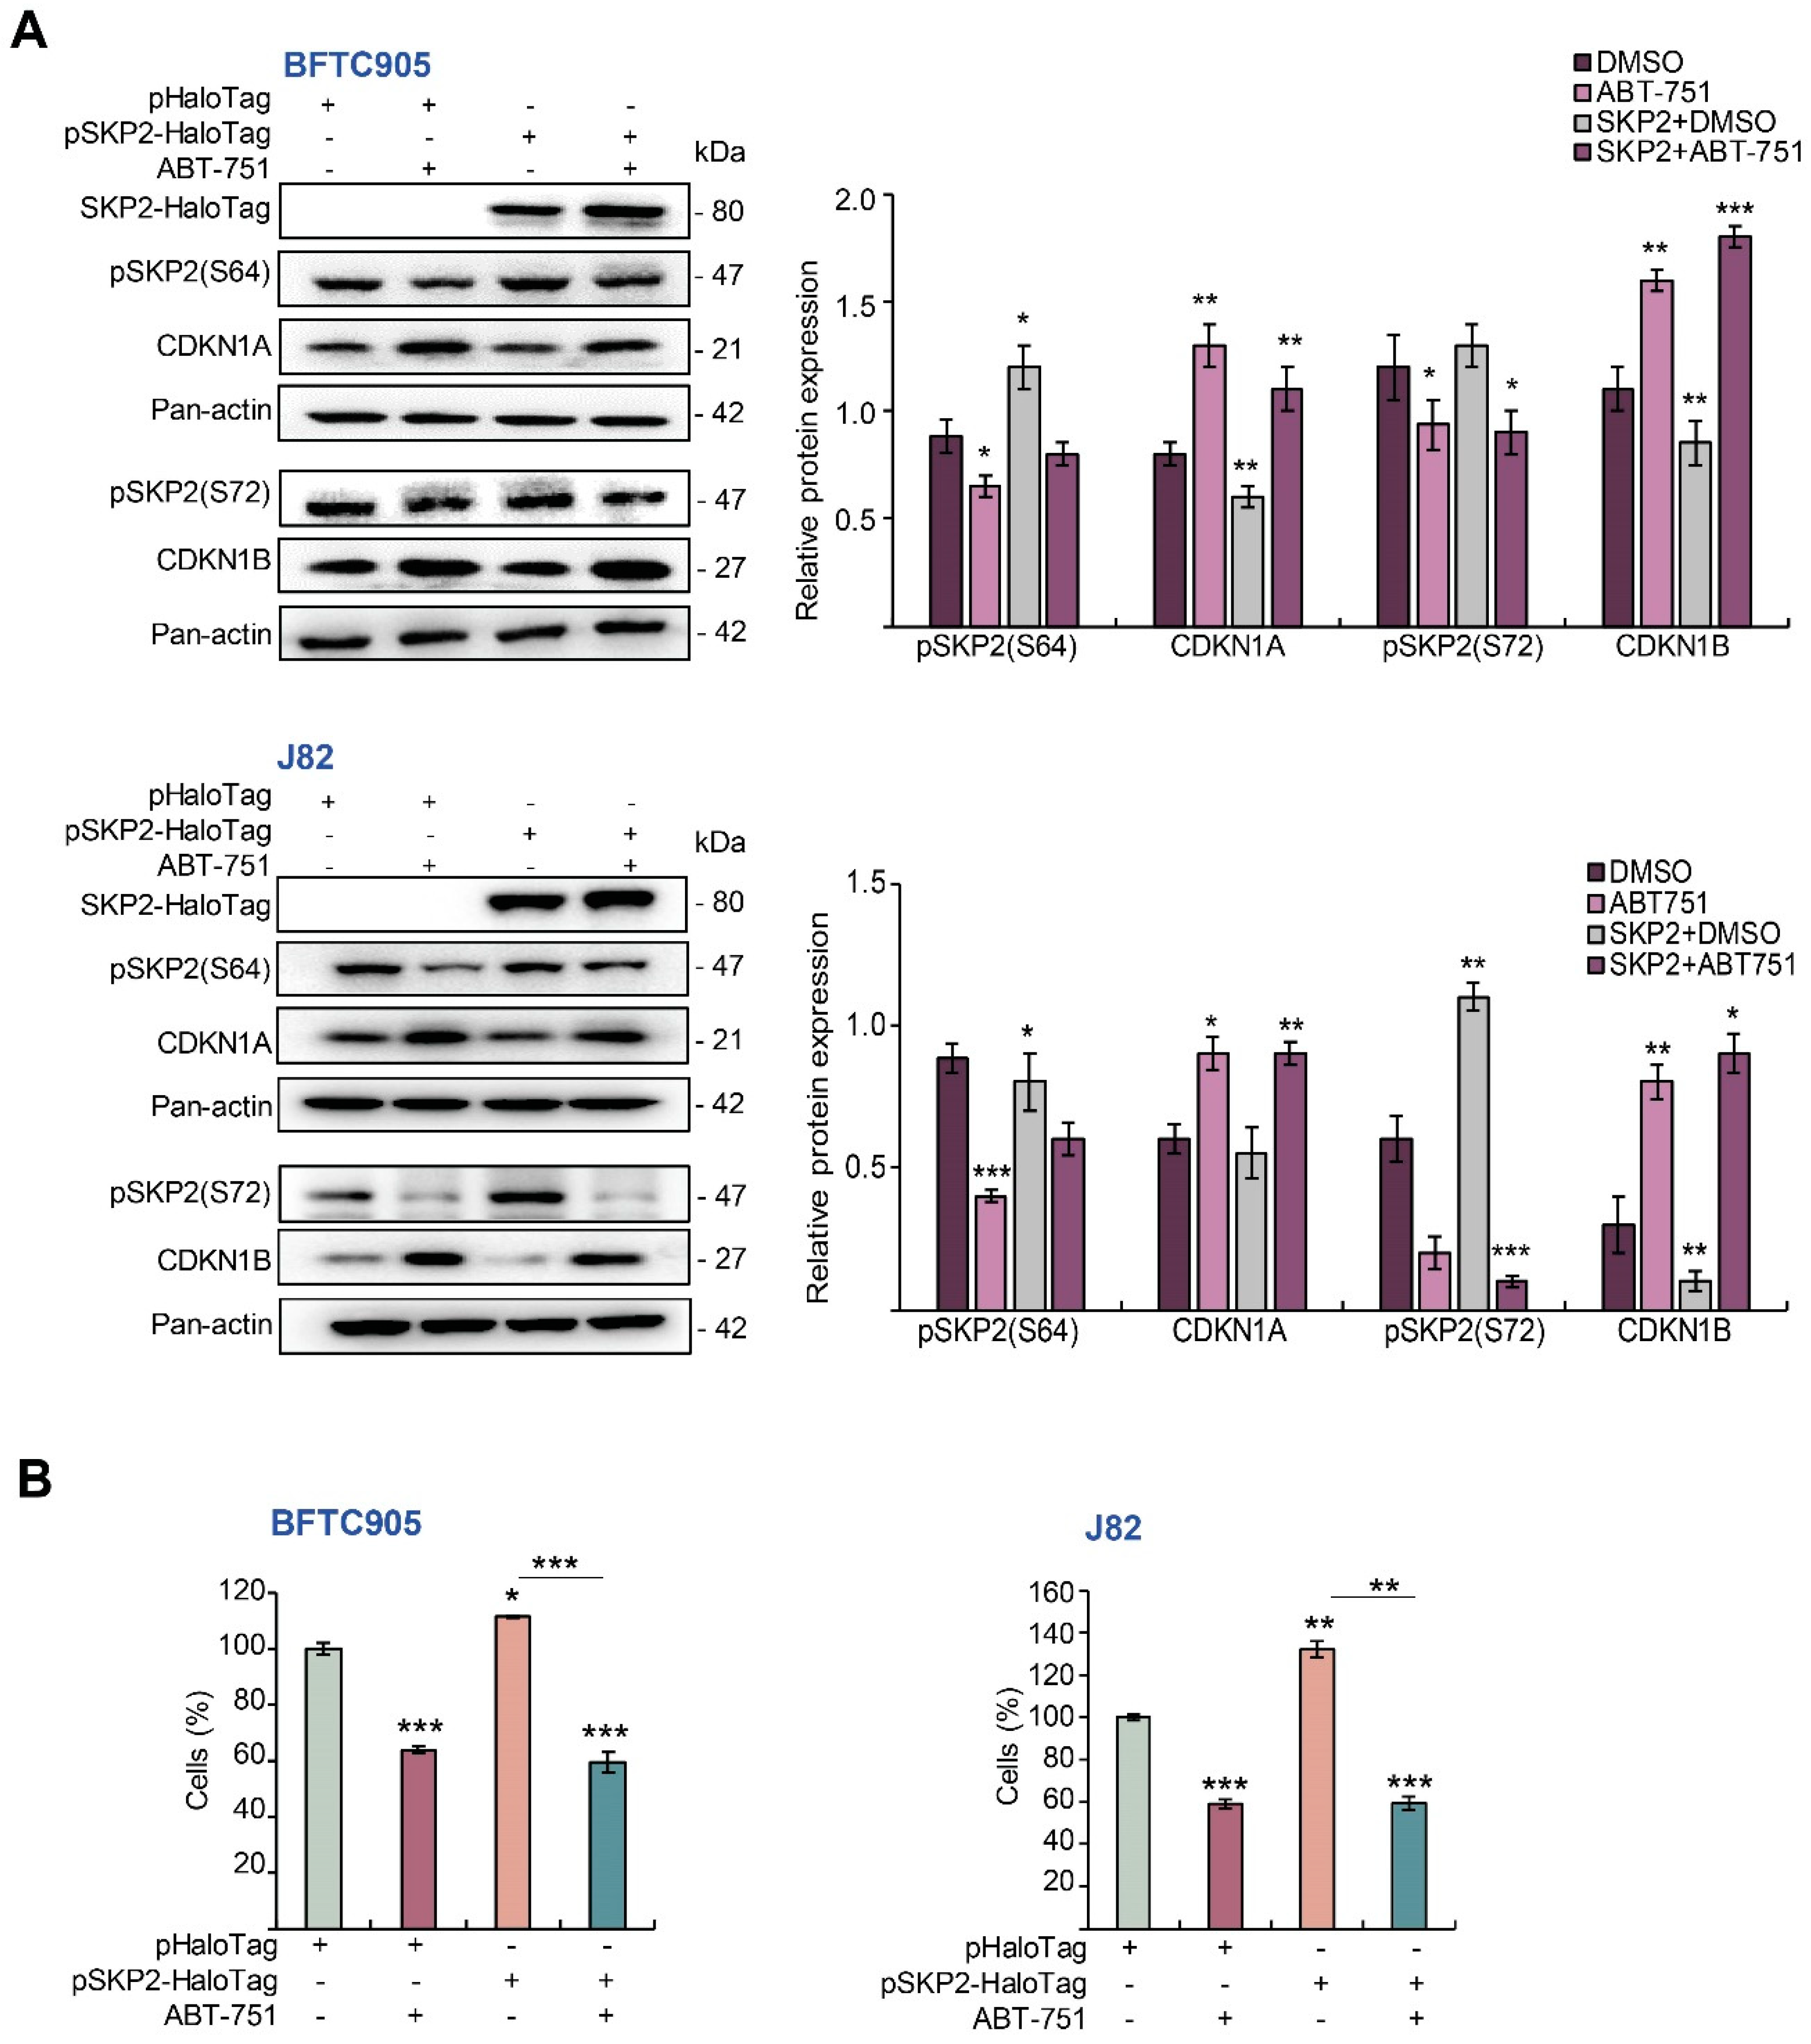
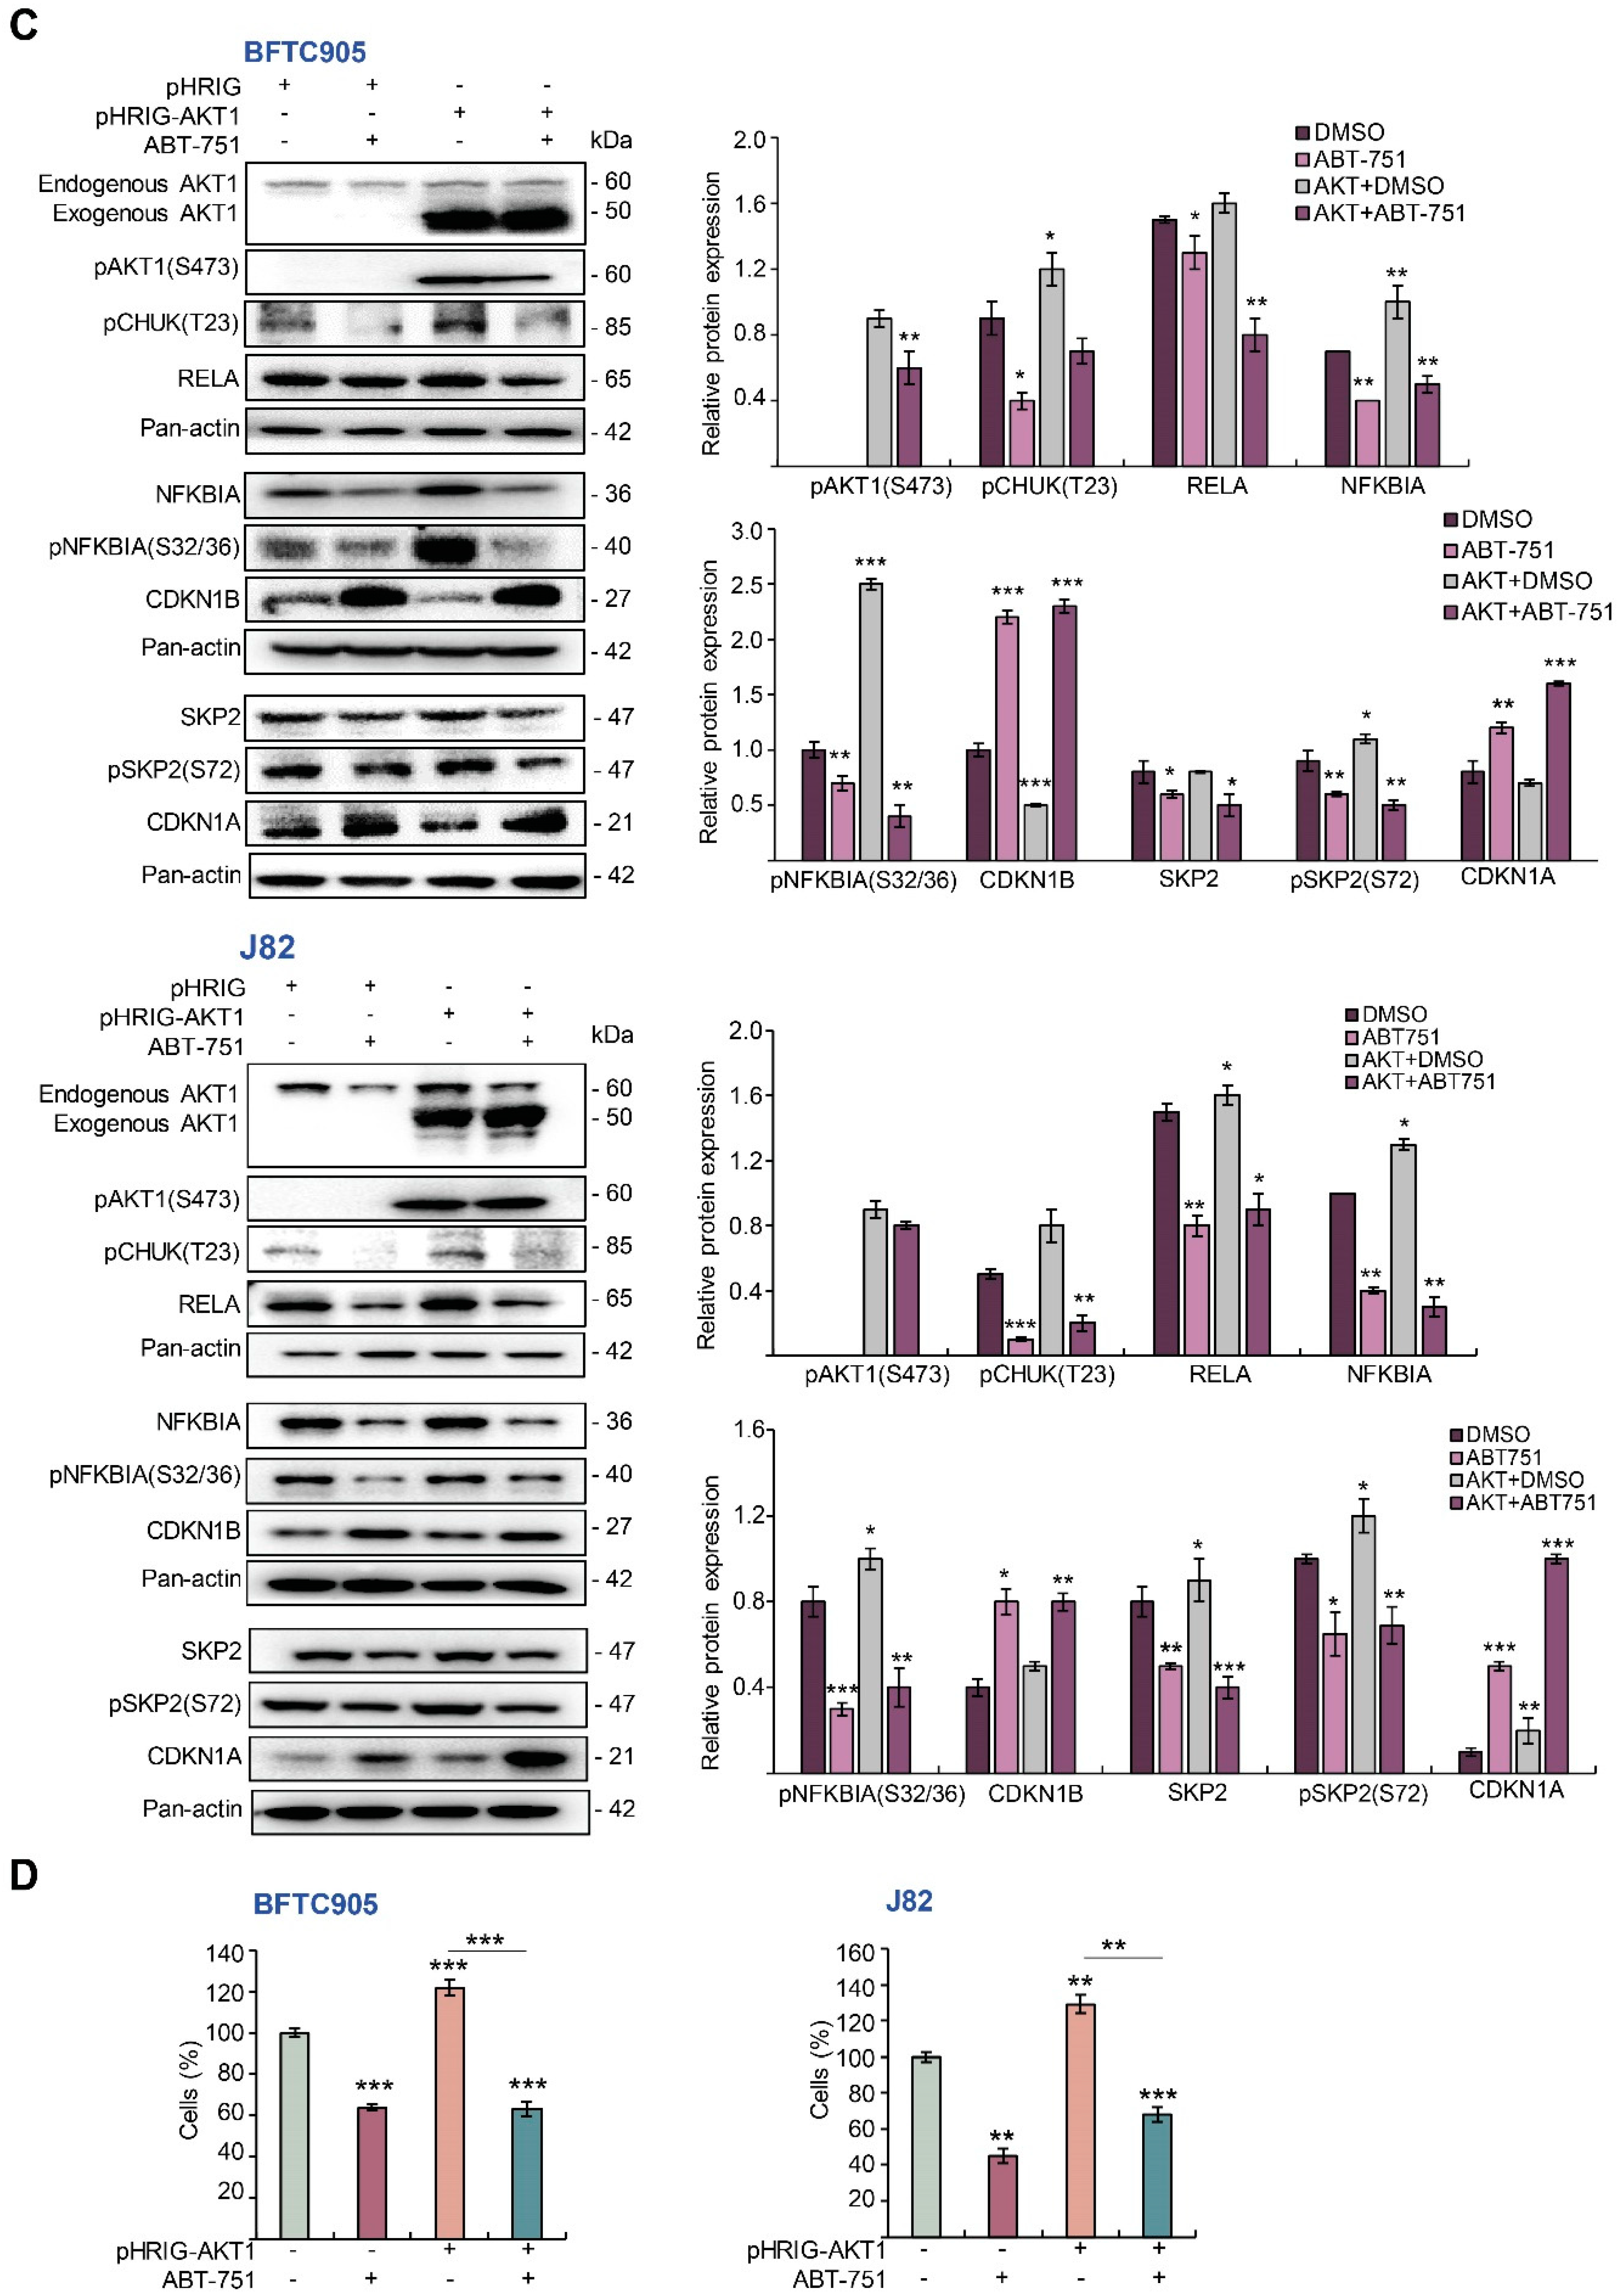
2.5. ABT-751 Suppresses SKP2 via the Inhibition of AKT Signaling Pathway at Post-Translational Level in UBUC-Derived Cells
3. Discussion
4. Materials and Methods
4.1. Cell Culture
4.2. Chemicals
4.3. Cell Viability Assay
4.4. Flow Cytometric Assays
4.5. Soft Agar Assays
4.6. Immunoblot Assay, Antibodies and Nuclear/Cytosol Fractionation
4.7. Transwell Migration, Transwell Invasion and Matrix Metallopeptidase 2/9 Activity Assays
4.8. Quantitative Reverse Transcription-Polymerase Chain Reaction
4.9. Colorimetric Assay of the Caspase 3 Activity
4.10. AKT Activity Assay and Co-Immunoprecipitation
4.11. Plasmids and Transient Transfection
4.12. Cell Proliferation Assay
4.13. Statistical Analysis
Supplementary Materials
Author Contributions
Funding
Institutional Review Board Statement
Informed Consent Statement
Data Availability Statement
Conflicts of Interest
References
- Eble, J.N.; Sauter, G.; Epstein, J.I.; Sesterhenn, I.A. World Health Organization Classification Of Tumour. Pathology and Genetics of Tumours of the Urinary System and Male Genital Organs; International Agency for Research on Cancer (IARC) Press: Lyon, France, 2004. [Google Scholar]
- Lichtenstein, P.; Holm, N.V.; Verkasalo, P.K.; Iliadou, A.; Kaprio, J.; Koskenvuo, M.; Pukkala, E.; Skytthe, A.; Hemminki, K. Environmental and heritable factors in the causation of cancer—analyses of cohorts of twins from Sweden, Denmark, and Finland. N. Engl. J. Med. 2000, 343, 78–85. [Google Scholar] [CrossRef]
- Shipley, W.U.; Kaufman, D.S.; Tester, W.J.; Pilepich, M.V.; Sandler, H.M. Overview of bladder cancer trials in the Radiation Therapy Oncology Group. Cancer 2003, 97 (Suppl. 8), 2115–2119. [Google Scholar] [CrossRef] [PubMed]
- Urbanowicz, R.J.; Andrew, A.S.; Karagas, M.R.; Moore, J.H. Role of genetic heterogeneity and epistasis in bladder cancer susceptibility and outcome: A learning classifier system approach. J. Am. Med. Inform. Assoc. JAMIA 2013, 20, 603–612. [Google Scholar] [CrossRef] [PubMed] [Green Version]
- Volanis, D.; Papadopoulos, G.; Doumas, K.; Gkialas, I.; Delakas, D. Molecular mechanisms in urinary bladder carcinogenesis. J. BU ON J. Balk. Union Oncol. 2011, 16, 589–601. [Google Scholar]
- Skaar, J.R.; Pagano, M. Control of cell growth by the SCF and APC/C ubiquitin ligases. Curr. Opin. Cell Biol. 2009, 21, 816–824. [Google Scholar] [CrossRef] [Green Version]
- Rabbani, F.; Koppie, T.M.; Charytonowicz, E.; Drobnjak, M.; Bochner, B.H.; Cordon-Cardo, C. Prognostic significance of p27Kip1 expression in bladder cancer. BJU Int. 2007, 100, 259–263. [Google Scholar] [CrossRef]
- Dumontet, C.; Jordan, M.A. Microtubule-binding agents: A dynamic field of cancer therapeutics. Nat. Rev. Drug Discov. 2010, 9, 790–803. [Google Scholar] [CrossRef] [Green Version]
- Albany, C.; Sonpavde, G. Docetaxel for the treatment of bladder cancer. Expert Opin. Investig. Drugs 2015, 24, 1657–1664. [Google Scholar] [CrossRef]
- Sideris, S.; Aoun, F.; Zanaty, M.; Martinez, N.C.; Latifyan, S.; Awada, A.; Gil, T. Efficacy of weekly paclitaxel treatment as a single agent chemotherapy following first-line cisplatin treatment in urothelial bladder cancer. Mol. Clin. Oncol. 2016, 4, 1063–1067. [Google Scholar] [CrossRef] [Green Version]
- Hansch, C.; Verma, R.P. Understanding tubulin/microtubule-taxane interactions: A quantitative structure-activity relationship study. Mol. Pharm. 2008, 5, 151–161. [Google Scholar] [CrossRef] [PubMed]
- Kuppens, I.E. Current state of the art of new tubulin inhibitors in the clinic. Curr. Clin. Pharmacol. 2006, 1, 57–70. [Google Scholar] [CrossRef]
- Yoshimatsu, K.; Yamaguchi, A.; Yoshino, H.; Koyanagi, N.; Kitoh, K. Mechanism of action of E7010, an orally active sulfonamide antitumor agent: Inhibition of mitosis by binding to the colchicine site of tubulin. Cancer Res. 1997, 57, 3208–3213. [Google Scholar] [PubMed]
- Rudin, C.M.; Mauer, A.; Smakal, M.; Juergens, R.; Spelda, S.; Wertheim, M.; Coates, A.; McKeegan, E.; Ansell, P.; Zhou, X.; et al. Phase I/II study of pemetrexed with or without ABT-751 in advanced or metastatic non-small-cell lung cancer. J. Clin. Oncol. 2011, 29, 1075–1082. [Google Scholar] [CrossRef] [PubMed] [Green Version]
- Luo, Y.; Hradil, V.P.; Frost, D.J.; Rosenberg, S.H.; Gordon, G.B.; Morgan, S.J.; Gagne, G.D.; Cox, B.F.; Tahir, S.K.; Fox, G.B. ABT-751, a novel tubulin-binding agent, decreases tumor perfusion and disrupts tumor vasculature. Anticancer Drugs 2009, 20, 483–492. [Google Scholar] [CrossRef]
- Koyanagi, N.; Nagasu, T.; Fujita, F.; Watanabe, T.; Tsukahara, K.; Funahashi, Y.; Fujita, M.; Taguchi, T.; Yoshino, H.; Kitoh, K. In vivo tumor growth inhibition produced by a novel sulfonamide, E7010, against rodent and human tumors. Cancer Res. 1994, 54, 1702–1706. [Google Scholar] [PubMed]
- Jorgensen, T.J.; Tian, H.; Joseph, I.B.; Menon, K.; Frost, D. Chemosensitization and radiosensitization of human lung and colon cancers by antimitotic agent, ABT-751, in athymic murine xenograft models of subcutaneous tumor growth. Cancer Chemother. Pharm. 2007, 59, 725–732. [Google Scholar] [CrossRef] [PubMed]
- Wei, R.J.; Lin, S.S.; Wu, W.R.; Chen, L.R.; Li, C.F.; Chen, H.D.; Chou, C.T.; Chen, Y.C.; Liang, S.S.; Chien, S.T.; et al. A microtubule inhibitor, ABT-751, induces autophagy and delays apoptosis in Huh-7 cells. Toxicol. Appl. Pharm. 2016, 311, 88–98. [Google Scholar] [CrossRef] [PubMed]
- Wei, R.J.; Wu, W.R.; Pan, C.T.; Yu, C.Y.; Li, C.F.; Chen, L.R.; Liang, S.S.; Shiue, Y.L. Inhibition of the formation of autophagosome but not autolysosome augments ABT-751-induced apoptosis in TP53-deficient Hep-3B cells. J. Cell. Physiol. 2019, 234, 9551–9563. [Google Scholar] [CrossRef]
- Bernstein, C.; Bernstein, H.; Payne, C.M.; Garewal, H. DNA repair/pro-apoptotic dual-role proteins in five major DNA repair pathways: Fail-safe protection against carcinogenesis. Mutat. Res. 2002, 511, 145–178. [Google Scholar] [CrossRef]
- Ohtani, K.; DeGregori, J.; Nevins, J.R. Regulation of the cyclin E gene by transcription factor E2F1. Proc. Natl. Acad. Sci. USA 1995, 92, 12146–12150. [Google Scholar] [CrossRef] [PubMed] [Green Version]
- DePamphilis, M.L. The ‘ORC cycle’: A novel pathway for regulating eukaryotic DNA replication. Gene 2003, 310, 1–15. [Google Scholar] [CrossRef]
- Chan, C.H.; Lee, S.W.; Wang, J.; Lin, H.K. Regulation of Skp2 expression and activity and its role in cancer progression. Sci. World J. 2010, 10, 1001–1015. [Google Scholar] [CrossRef] [PubMed]
- Zheng, N.; Zhou, Q.; Wang, Z.; Wei, W. Recent advances in SCF ubiquitin ligase complex: Clinical implications. Biochim. Biophys. Acta 2016, 1866, 12–22. [Google Scholar] [CrossRef] [Green Version]
- Kawakami, K.; Enokida, H.; Tachiwada, T.; Nishiyama, K.; Seki, N.; Nakagawa, M. Increased SKP2 and CKS1 gene expression contributes to the progression of human urothelial carcinoma. J. Urol. 2007, 178, 301–307. [Google Scholar] [CrossRef] [PubMed]
- Cardozo, T.; Pagano, M. The SCF ubiquitin ligase: Insights into a molecular machine. Nat. Rev. Mol. Cell Biol. 2004, 5, 739–751. [Google Scholar] [CrossRef] [PubMed]
- Toledo, F.; Wahl, G.M. Regulating the p53 pathway: In vitro hypotheses, in vivo veritas. Nat. Rev. Cancer 2006, 6, 909–923. [Google Scholar] [CrossRef]
- Audenet, F.; Attalla, K.; Sfakianos, J.P. The evolution of bladder cancer genomics: What have we learned and how can we use it? Urol. Oncol. 2018, 36, 313–320. [Google Scholar] [CrossRef] [PubMed]
- Hacker, H.; Karin, M. Regulation and function of IKK and IKK-related kinases. Sci. STKE Signal Transduct. Knowl. Environ. 2006, 2006, re13. [Google Scholar] [CrossRef]
- Ghoneum, A.; Said, N. PI3K-AKT-mTOR and NFkappaB Pathways in Ovarian Cancer: Implications for Targeted Therapeutics. Cancers 2019, 11, 949. [Google Scholar] [CrossRef] [PubMed] [Green Version]
- Brown, K.; Gerstberger, S.; Carlson, L.; Franzoso, G.; Siebenlist, U. Control of I kappa B-alpha proteolysis by site-specific, signal-induced phosphorylation. Science 1995, 267, 1485–1488. [Google Scholar] [CrossRef]
- Gao, D.; Inuzuka, H.; Tseng, A.; Chin, R.Y.; Toker, A.; Wei, W. Phosphorylation by Akt1 promotes cytoplasmic localization of Skp2 and impairs APCCdh1-mediated Skp2 destruction. Nat. Cell Biol. 2009, 11, 397–408. [Google Scholar] [CrossRef] [PubMed]
- Rodier, G.; Coulombe, P.; Tanguay, P.L.; Boutonnet, C.; Meloche, S. Phosphorylation of Skp2 regulated by CDK2 and Cdc14B protects it from degradation by APC(Cdh1) in G1 phase. EMBO J. 2008, 27, 679–691. [Google Scholar] [CrossRef]
- Geng, Q.; Liu, J.; Gong, Z.; Chen, S.; Chen, S.; Li, X.; Lu, Y.; Zhu, X.; Lin, H.K.; Xu, D. Phosphorylation by mTORC1 stablizes Skp2 and regulates its oncogenic function in gastric cancer. Mol. Cancer 2017, 16, 83. [Google Scholar] [CrossRef] [PubMed] [Green Version]
- Bashir, T.; Dorrello, N.V.; Amador, V.; Guardavaccaro, D.; Pagano, M. Control of the SCF(Skp2-Cks1) ubiquitin ligase by the APC/C(Cdh1) ubiquitin ligase. Nature 2004, 428, 190–193. [Google Scholar] [CrossRef] [PubMed]
- Bacevic, K.; Lossaint, G.; Achour, T.N.; Georget, V.; Fisher, D.; Dulic, V. Cdk2 strengthens the intra-S checkpoint and counteracts cell cycle exit induced by DNA damage. Sci. Rep. 2017, 7, 13429. [Google Scholar] [CrossRef] [PubMed]
- Karimian, A.; Mir, S.M.; Parsian, H.; Refieyan, S.; Mirza-Aghazadeh-Attari, M.; Yousefi, B.; Majidinia, M. Crosstalk between Phosphoinositide 3-kinase/Akt signaling pathway with DNA damage response and oxidative stress in cancer. J. Cell. Biochem. 2019, 120, 10248–10272. [Google Scholar] [CrossRef]
- Ma, Y.; Vassetzky, Y.; Dokudovskaya, S. mTORC1 pathway in DNA damage response. Biochim. Biophys. Acta Mol. Cell Res. 2018, 1865, 1293–1311. [Google Scholar] [CrossRef]
- Bates, D.; Eastman, A. Microtubule destabilising agents: Far more than just antimitotic anticancer drugs. Br. J. Clin. Pharmacol. 2017, 83, 255–268. [Google Scholar] [CrossRef]
- Mook, O.R.; Frederiks, W.M.; Van Noorden, C.J. The role of gelatinases in colorectal cancer progression and metastasis. Biochim. Biophys. Acta 2004, 1705, 69–89. [Google Scholar] [CrossRef]
- Field, J.J.; Kanakkanthara, A.; Miller, J.H. Microtubule-targeting agents are clinically successful due to both mitotic and interphase impairment of microtubule function. Bioorg. Med. Chem. 2014, 22, 5050–5059. [Google Scholar] [CrossRef]
- Bhat, P.; Kriel, J.; Shubha Priya, B.; Basappa; Shivananju, N.S.; Loos, B. Modulating autophagy in cancer therapy: Advancements and challenges for cancer cell death sensitization. Biochem. Pharmacol. 2018, 147, 170–182. [Google Scholar] [CrossRef] [PubMed]
- Parker, A.L.; Kavallaris, M.; McCarroll, J.A. Microtubules and their role in cellular stress in cancer. Front. Oncol. 2014, 4, 153. [Google Scholar] [CrossRef] [Green Version]
- Dikic, I.; Elazar, Z. Mechanism and medical implications of mammalian autophagy. Nat. Rev. Mol. Cell Biol. 2018, 19, 349–364. [Google Scholar] [CrossRef] [PubMed]
- Rabinowitz, J.D.; White, E. Autophagy and metabolism. Science 2010, 330, 1344–1348. [Google Scholar] [CrossRef] [PubMed] [Green Version]
- White, E. Autophagy and p53. Cold Spring Harb. Perspect. Med. 2016, 6, a026120. [Google Scholar] [CrossRef] [PubMed]
- Tzeng, C.C.; Liu, H.S.; Li, C.; Jin, Y.T.; Chen, R.M.; Yang, W.H.; Lin, J.S. Characterization of two urothelium cancer cell lines derived from a blackfoot disease endemic area in Taiwan. Anticancer Res. 1996, 16, 1797–1804. [Google Scholar] [PubMed]
- Cheng, Y.T.; Li, Y.L.; Wu, J.D.; Long, S.B.; Tzai, T.S.; Tzeng, C.C.; Lai, M.D. Overexpression of MDM-2 mRNA and mutation of the p53 tumor suppressor gene in bladder carcinoma cell lines. Mol. Carcinog. 1995, 13, 173–181. [Google Scholar] [CrossRef] [PubMed]
- Li, C.F.; Wu, W.R.; Chan, T.C.; Wang, Y.H.; Chen, L.R.; Wu, W.J.; Yeh, B.W.; Liang, S.S.; Shiue, Y.L. Transmembrane and Coiled-Coil Domain 1 Impairs the AKT Signaling Pathway in Urinary Bladder Urothelial Carcinoma: A Characterization of a Tumor Suppressor. Clin. Cancer Res. Off. J. Am. Assoc. Cancer Res. 2017, 23, 7650–7663. [Google Scholar] [CrossRef] [Green Version]


Publisher’s Note: MDPI stays neutral with regard to jurisdictional claims in published maps and institutional affiliations. |
© 2021 by the authors. Licensee MDPI, Basel, Switzerland. This article is an open access article distributed under the terms and conditions of the Creative Commons Attribution (CC BY) license (http://creativecommons.org/licenses/by/4.0/).
Share and Cite
Dehghanian, S.Z.; Pan, C.-T.; Lee, J.M.; Shiue, Y.-L. ABT-751 Induces Multiple Anticancer Effects in Urinary Bladder Urothelial Carcinoma-Derived Cells: Highlighting the Induction of Cytostasis through the Inhibition of SKP2 at Both Transcriptional and Post-Translational Levels. Int. J. Mol. Sci. 2021, 22, 945. https://0-doi-org.brum.beds.ac.uk/10.3390/ijms22020945
Dehghanian SZ, Pan C-T, Lee JM, Shiue Y-L. ABT-751 Induces Multiple Anticancer Effects in Urinary Bladder Urothelial Carcinoma-Derived Cells: Highlighting the Induction of Cytostasis through the Inhibition of SKP2 at Both Transcriptional and Post-Translational Levels. International Journal of Molecular Sciences. 2021; 22(2):945. https://0-doi-org.brum.beds.ac.uk/10.3390/ijms22020945
Chicago/Turabian StyleDehghanian, Seyedeh Zahra, Cheng-Tang Pan, Jasmine Marianne Lee, and Yow-Ling Shiue. 2021. "ABT-751 Induces Multiple Anticancer Effects in Urinary Bladder Urothelial Carcinoma-Derived Cells: Highlighting the Induction of Cytostasis through the Inhibition of SKP2 at Both Transcriptional and Post-Translational Levels" International Journal of Molecular Sciences 22, no. 2: 945. https://0-doi-org.brum.beds.ac.uk/10.3390/ijms22020945