1. Introduction
The tumor suppressor protein p53 coded by
TP53 gene is activated by stress factors acting under natural conditions, e.g., UV radiation, oxidative stress, oncogene activation. However, the protein is also activated by stress factors, associated with anticancer therapy, e.g., high-dose ionizing radiation, chemotherapeutic DNA-damaging agents. These p53 activators are not found in the natural environment but they exploit the ability of p53 to induce cell cycle arrest or apoptosis. There are also experimental anticancer drugs (e.g., nutlin-3a), which were designed specifically to activate p53 by antagonizing MDM2 protein, which is negative regulator of p53 [
1].
We found that two anticancer agents actinomycin D and nutlin-3a acting together (A + N) synergize in activation of p53 protein and consequently, they synergize in stimulation of p53-regulated genes [
2]. The strong activation of p53 by these agents allowed to identify genes, whose regulation by p53 was not observed before, e.g., the genes coding for proteins involved in innate immunity:
TREM2,
TMEM173 (
STING1),
NLRP1,
NLRX1,
SOCS1 [
3,
4]. The synergy between actinomycin D and nutlin-3a in activation of some genes is exceptionally strong. This group includes
CASP1 and
H19 as well as the aforementioned
TREM2 and
STING1 [
3,
4,
5].
CASP1 codes for caspase-1, an innate immunity protein, which induces programmed cell death called pyroptosis associated with secretion of pro-inflammatory cytokines-interleukin-1β and interleukin-18 [
6].
H19 gene directs the production of long non-coding RNA molecules with anti-apoptotic activity [
7].
Unexpectedly, we found that in A549 lung cancer cell line the drug combination A + N induced the expression of several elements of a signaling pathway encompassing TREM2 (a receptor), TYROBP (a co-receptor), SYK (a kinase) and BLNK (an adaptor protein) [
3]. This signaling pathway is found principally in cells involved in innate immunity, e.g., microglial cells [
8], hence, its appearance in lung cancer cells exposed to A + N was very surprising. Interestingly, the induction of all these proteins was significantly attenuated by sub-micromolar concentration of CHIR-98014 (in the following part abbreviated to CHIR), which is considered as a specific inhibitor of glycogen synthase kinase 3, α and β isoforms coded by
GSK3A and
GSK3B genes, respectively [
9,
10]. This observation suggested that GSK-3 is indispensable for activation of p53 and stimulation of some of its target genes. This enzyme, not only regulates the synthesis of glycogen, but also regulates the plethora of other cellular processes, hence its name may be misleading suggesting exclusive role in cellular metabolism. GSK-3 influences embryonic development, neuronal function, cell proliferation and differentiation, apoptosis, inflammation and immune response [
10]. The p53 can be activated by phosphorylation catalyzed by GSK-3β [
11], hence our selection of CHIR to test the role of this kinase in activation of p53 triggered by A + N treatment.
In the current project we decided to perform global search for genes regulated by A + N as well as by CHIR. We started from transcriptome analysis of cells in control conditions or exposed to A + N, to A + N + CHIR or to CHIR alone. In this way we identified dozens of candidate p53-target genes and found what genes upregulated by A + N are additionally modulated by GSK-3 kinase inhibitor. Based on RNA-Seq data and on experiments with engineered p53-deficient cells, we found that p53 participates in upregulation of two genes-APOE and BLNK, coding for elements of TREM2 signaling pathway. Analysis of RNA-Seq results revealed that there are at least two groups of genes as far as CHIR is considered. One group consists of genes strongly upregulated by A + N, whose activation is substantially reduced by CHIR. The other group consists of genes, whose activation by A + N is not influenced by the inhibitor. Because the first group contains anti-apoptotic genes stimulated by p53 (e.g., CRYAB, H19) and the second group contains many well-known p53-activated pro-apoptotic genes (e.g., PMAIP, BBC3), we hypothesized that CHIR promotes apoptosis because it prevents expression of anti-apoptotic genes and does not influence the expression of pro-apoptotic ones. Biologically, the hypothesis was positively tested, i.e., CHIR promoted apoptosis in cells exposed to A + N. However, the molecular mechanism of the induction of apoptosis is more complicated than expected. The induction of pro-apoptotic caspase-3 by A + N + CHIR was visible also in p53-null cells and CHIR induced the expression of mRNAs coding for GDF15 or BCL2L15 pro-apoptotic proteins. Moreover, downregulation of GSK-3 did not mimic CHIR activity, suggesting that CHIR can act independently from inhibiting GSK-3. Thus, our data generate the hypothesis that CHIR inhibits a kinase, which participates in activation of p53 and upregulation of a subset of its target genes.
We selected A549 lung adenocarcinoma cell line for this study because it is a frequently used model of lung cancer with wild-type
TP53 employed by us earlier [
2,
3,
4,
5]. Moreover, to the best of our knowledge, the transcriptomic data on p53-target genes in A549 cell line were not published [
12]. Unexpectedly, in the course of our recent research we found that in cancer cells, strongly activated p53 was able to induce expression of many genes, which were known to be expressed only in immune cells [
3,
4]. Studying the regulation of immune-related genes in lung cancer cells may yield new valuable information concerning the quickly expanding field of immunotherapy of cancer.
3. Discussion
We screened by transcriptome sequencing for genes upregulated by p53 strongly activated with the combination of actinomycin D and nutlin-3a (A + N). Moreover, we screened for genes whose upregulation by A + N was modulated by CHIR, a compound considered as specific inhibitor of both isoforms (α and β) of GSK-3 kinase [
9]. The working hypothesis was that GSK-3 phosphorylates p53 and modifies its activity in a way that allows for strong activation of some p53-regulated genes like TREM2. This hypothesis was based on our earlier observations [
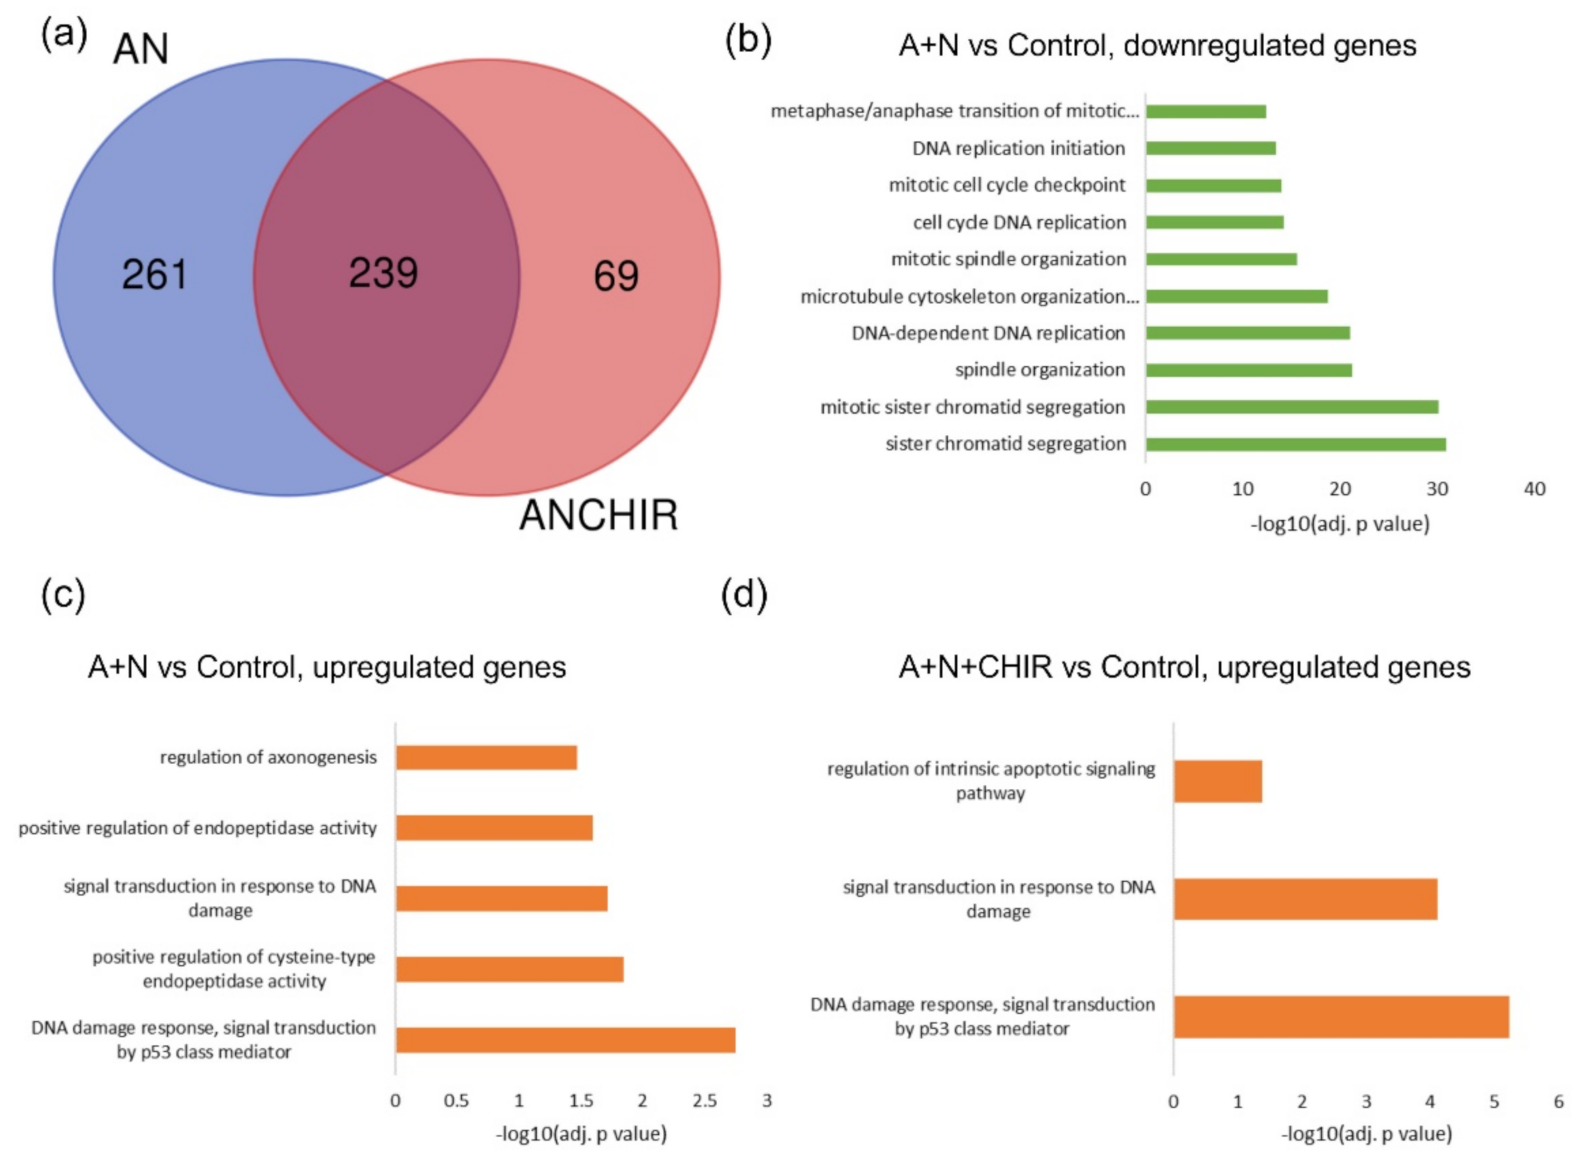
3]. We wanted to find out what other genes are regulated by GSK-3 through modification of p53. We validated the transcriptomic results for selected genes using RT-PCR or Western blotting. The result of sequencing itself and the outcome of its bioinformatic analysis were sound, judging by the fact that the overrepresentation analysis noticed activation of p53 signaling pathway (
Figure 1). The list of genes upregulated by A + N can be used as a collection of candidate p53-regulated genes for more in-depth analysis. For example, we selected
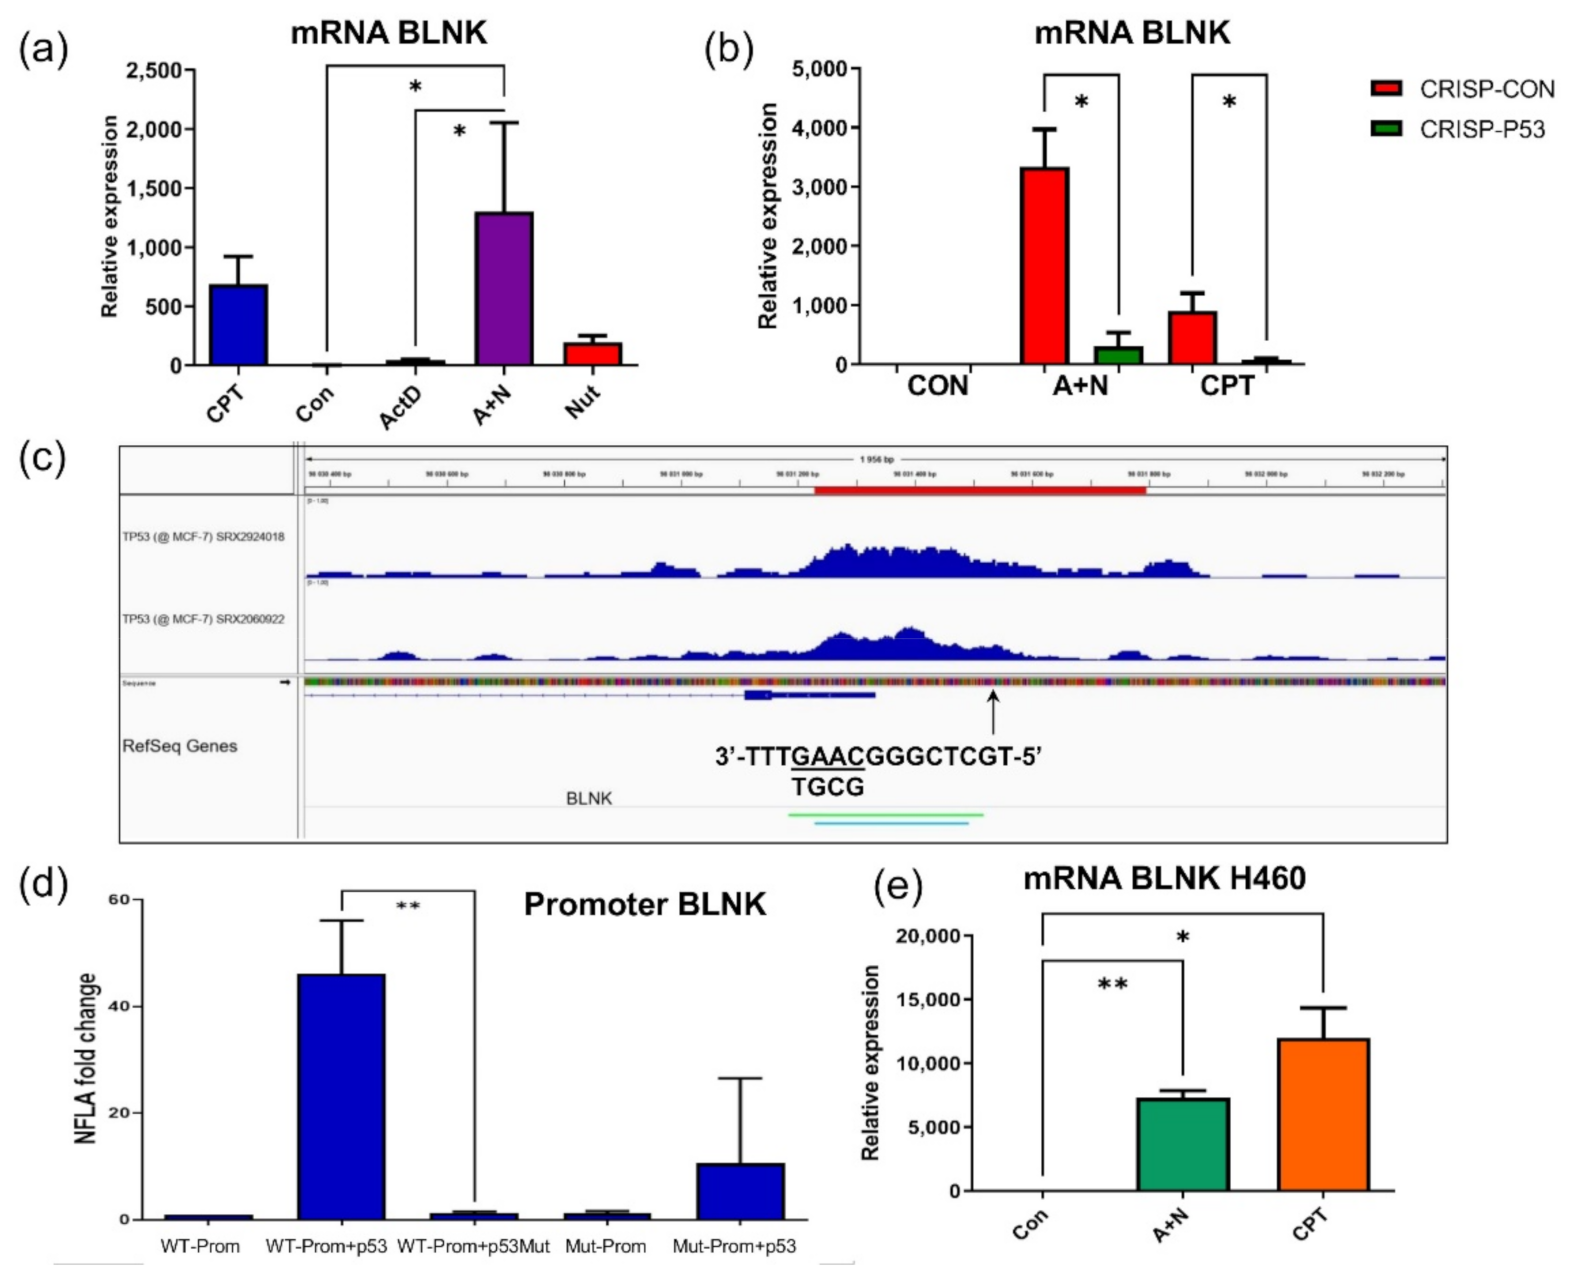
BLNK gene and we demonstrated that p53 participates in its upregulation. Moreover, we found p53 response element located in
BLNK promoter (
Figure 4). BLNK protein may be a part of the signaling pathway starting from TREM2 protein. Upon ligand binding, TREM2 indirectly activates SYK kinase. This kinase, in turn, utilizes BLNK protein for selection of downstream targets [
28]. The appearance of BLNK protein in A549 lung cancer cells exposed to A + N was very surprising, because the expression of
BLNK gene is limited to B cells, plasmacytoid dendritic cells and microglial cells. Most of our knowledge about functioning of BLNK is derived from studies on B-cells. The protein is an adapter linking activation of B-cell receptor and SYK kinase to the activation of phospholipase Cγ2 and Ca
2+ influx to cytosol [
29]. Our observations indicate that, for some reason, function of BLNK protein is required in lung cancer cells in stress conditions elicited by treatment with A + N.
Interestingly, activation of
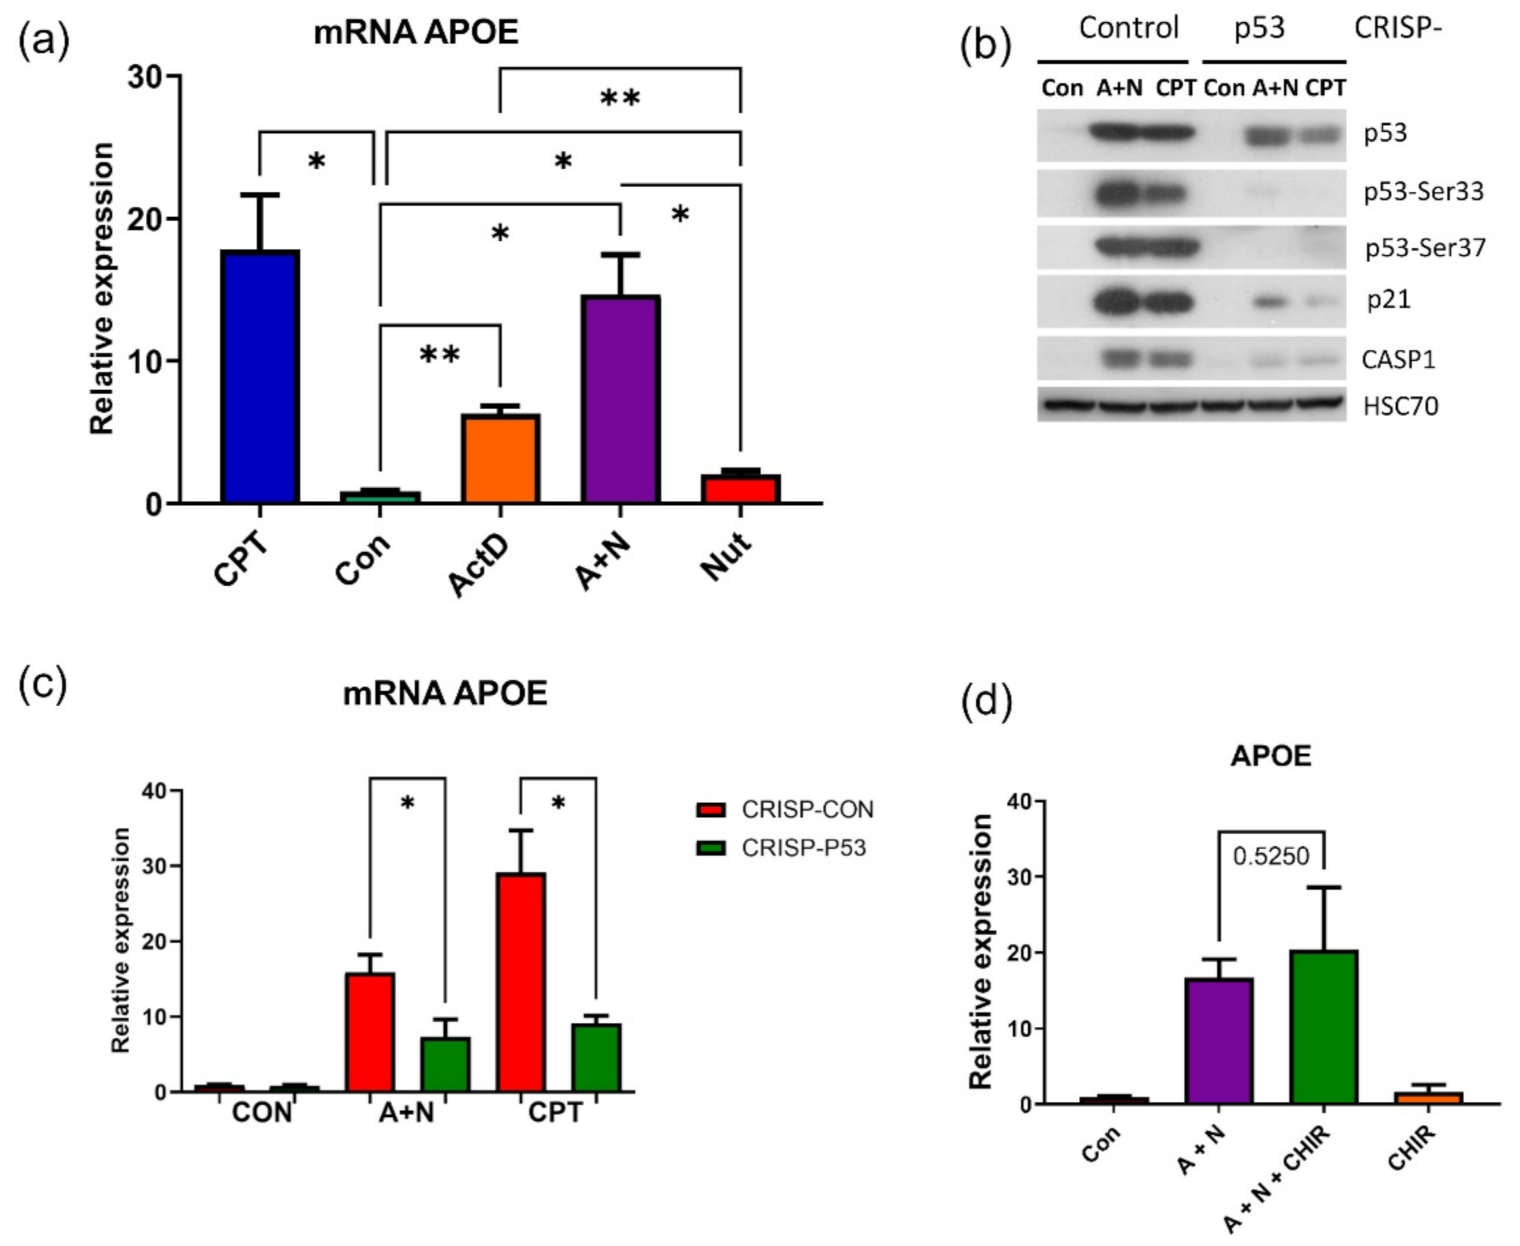
BLNK was visible in transcriptomic data although it did not reach statistical significance. This illustrates that for the screening purposes, or picking out candidate p53-regulated genes for extended analyses, our transcriptomic results can be used without strict adherence to the set level of statistical significance. Similarly, we demonstrated, that p53 participates in upregulation of
APOE gene (
Figure 3). Curiously, it appears that p53 controls at least two genes,
TREM2 and
APOE, whose polymorphisms are strongly associated with the risk of Alzheimer’s disease [
3,
8,
30].
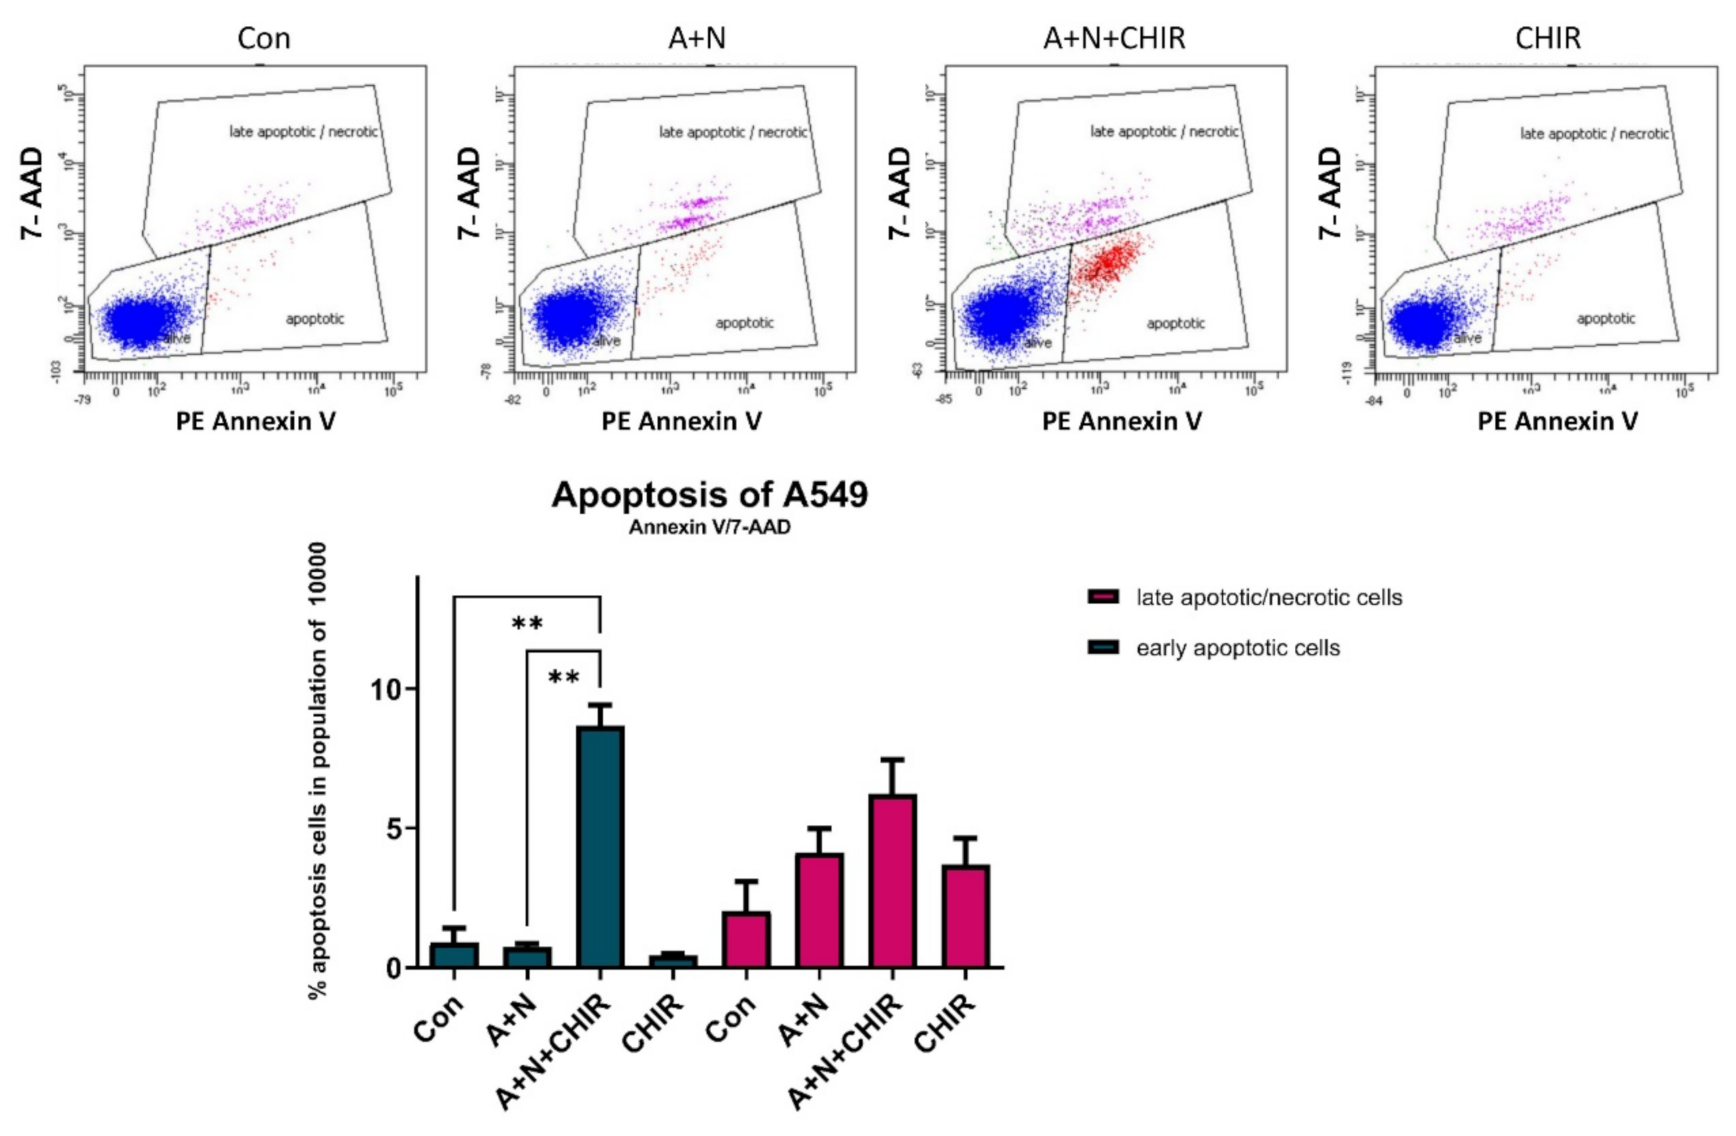
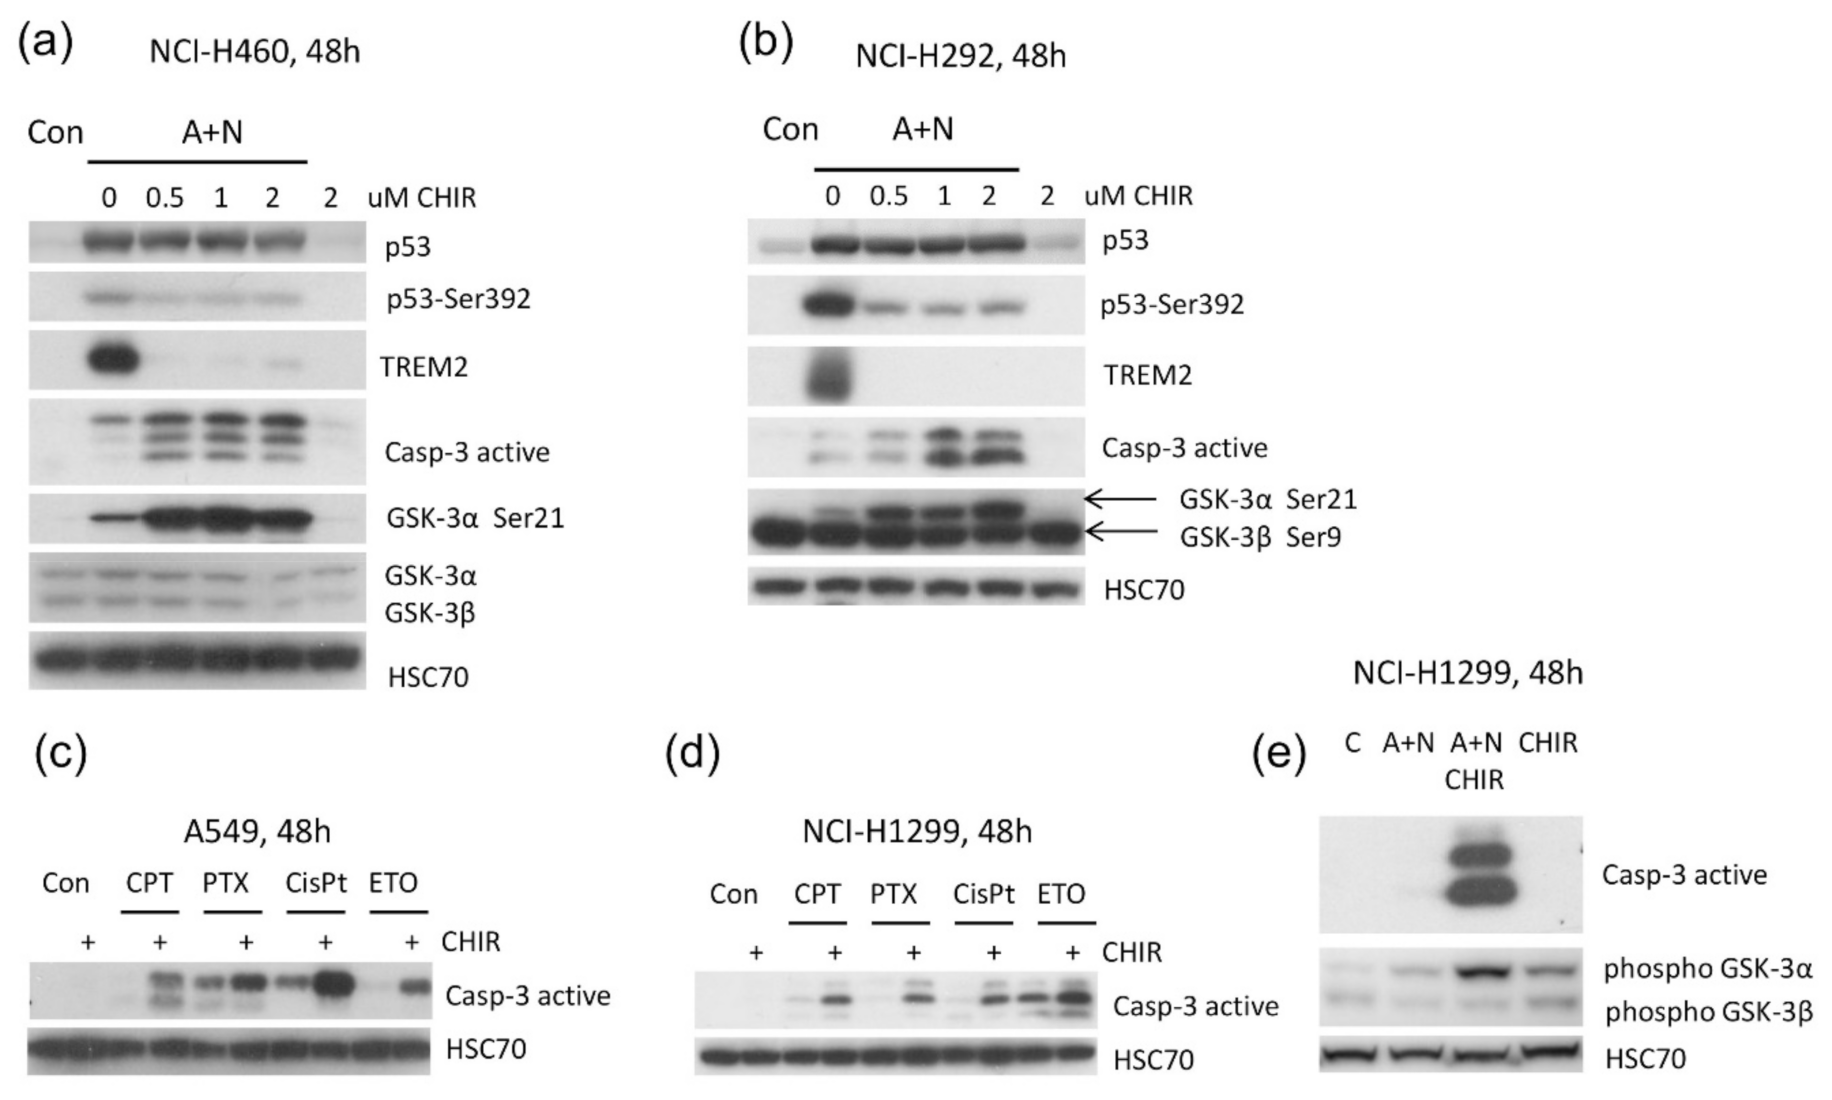
Because CHIR attenuated activation of some p53-regulated genes and inhibited p53 phosphorylation, initially we hypothesized that this inhibitor would attenuate apoptosis of cells exposed to A + N. To our surprise, we found elevated level of activated caspase-3 (
Figure 5a). Thus, in spite of attenuated p53 activation, the cells were more frequently undergoing apoptosis what was also demonstrated by flow cytometry analysis (
Figure 6). CHIR acting alone did not induce apoptosis (
Figure 5c and
Figure 6). Because we detected activating proteolytic cleavage of both, caspase-8 and caspase-9, we conclude that both apoptosis-inducing pathways, intrinsic and death receptor-driven, are activated in cells exposed to A + N and CHIR (
Figure 5c).
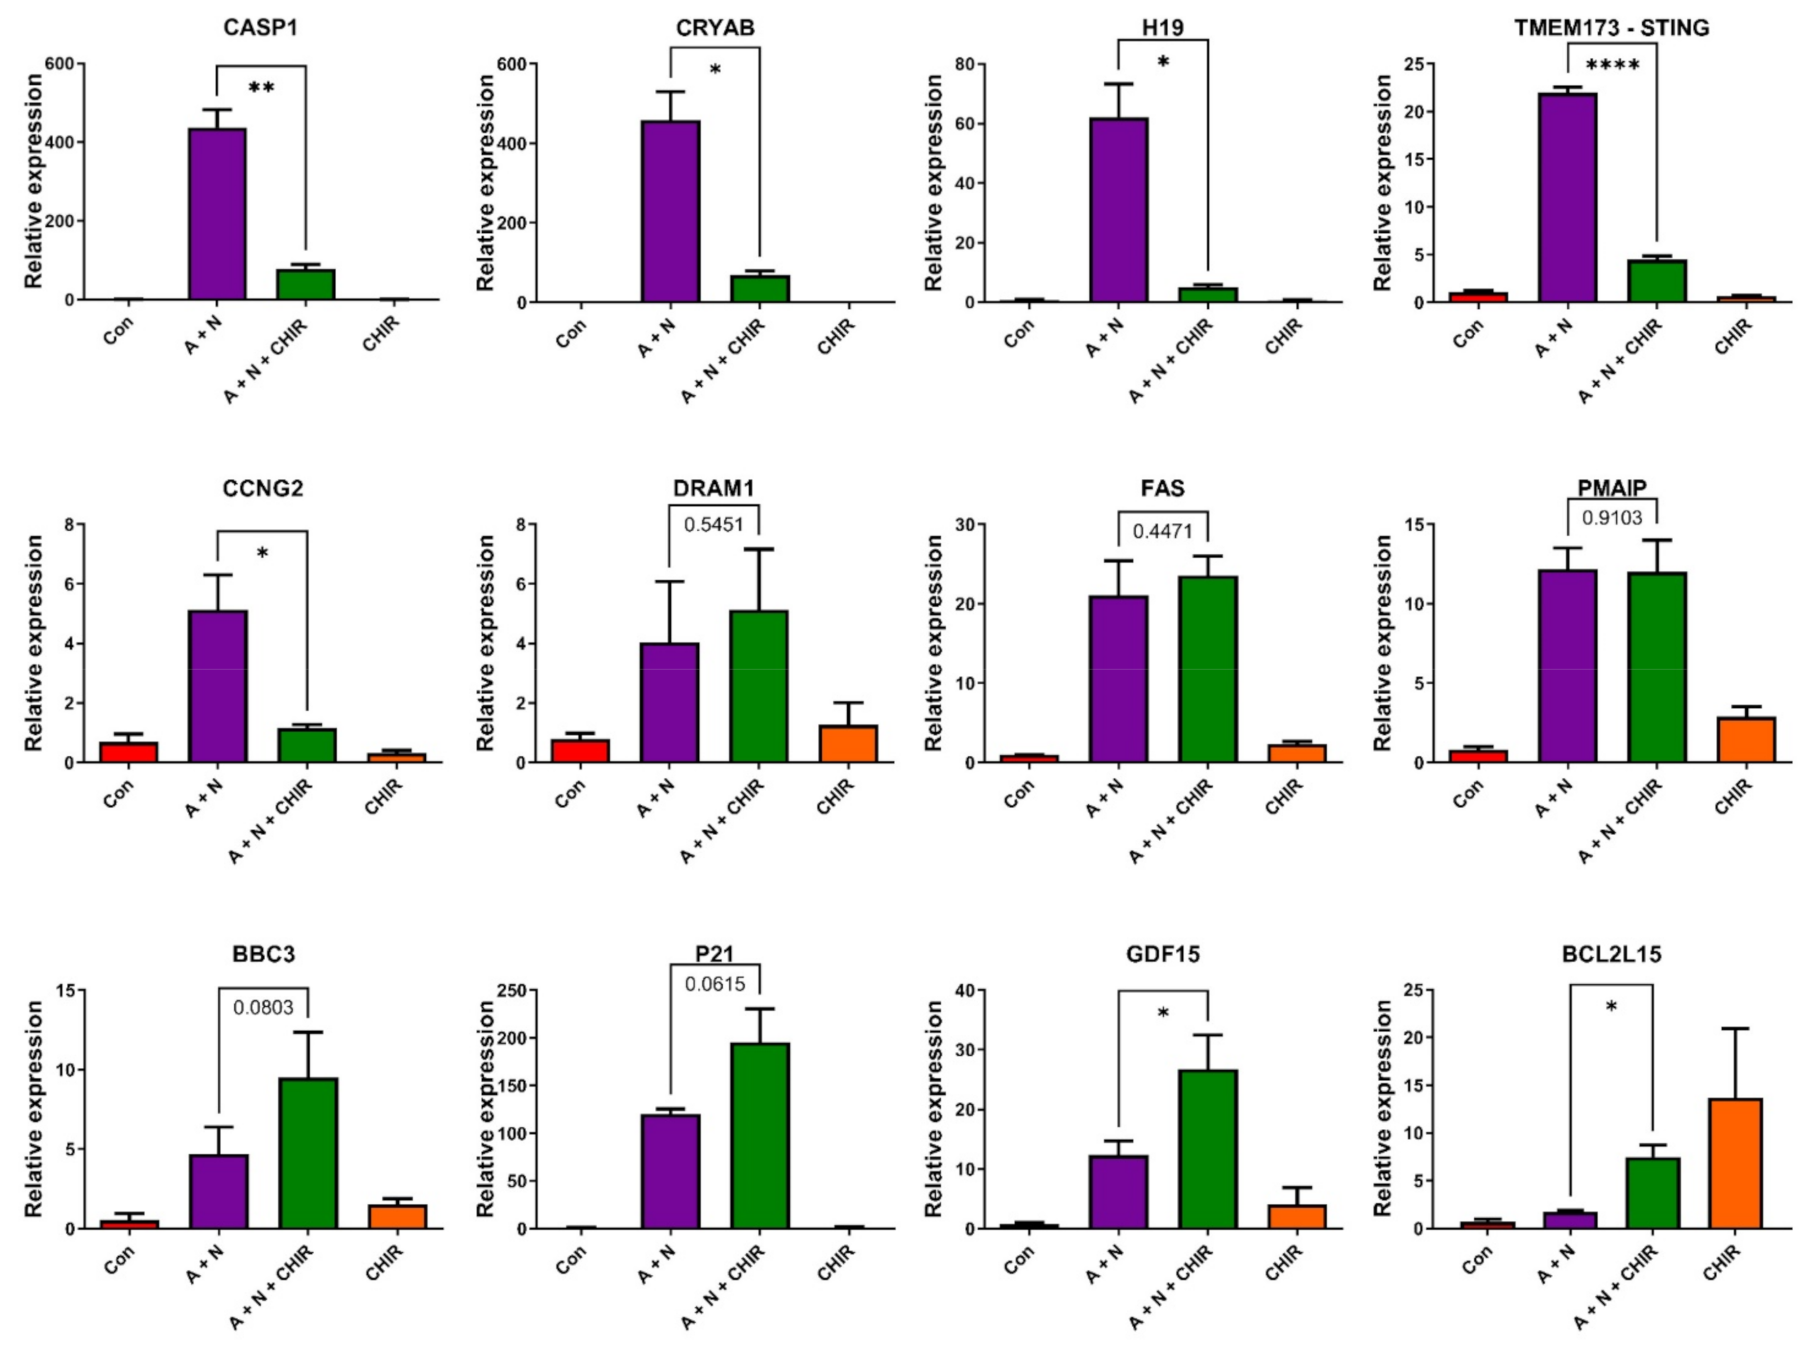
The transcriptomic data gave us unique opportunity for creating hypotheses concerning the apoptosis-promoting activity of CHIR. We noticed that CHIR prevented strong upregulation of two genes, known to be p53-targets, which have strong anti-apoptotic activity-
H19 [
5,
31] and
CRYAB [
18,
32] (
Figure 7). Moreover, CHIR enhanced upregulation of
GDF15-another p53 target with pro-apoptotic activity [
33,
34] and CHIR (but not A + N) strongly stimulated the expression of
BCL2L15, which codes for pro-apoptotic protein belonging to Bcl-2 family [
22]. It is not known, which genes have critical role in the induction of apoptosis triggered by A + N with CHIR. These are probably not p53-regulated genes because CHIR shows similar apoptosis-promoting activity in p53-null cell line NCI-H1299 (
Figure 8d,e). Moreover, CHIR enhances pro-apoptotic activity of other chemotherapeutic agents, which are routinely used in clinics like cisplatin, etoposide, paclitaxel or camptothecin (
Figure 8c,d). The pro-apoptotic activity of CHIR in mono-treatment was observed by others [
35]. It was associated with mitochondrial dysfunction and ROS generation after relatively long treatment (72 h). Moreover, CHIR together with an experimental substance inhibiting BET family proteins showed remarkable therapeutic effects in vitro and in vivo acting synergistically against liver cancer cells [
36].
Considering that CHIR is regarded as specific inhibitor of GSK-3 kinases [
9] our results suggested that one of its isoforms (or both) are involved in regulation of apoptosis and gene expression in cells exposed to A + N. One observation suggested that GSK-3α may be involved, because exposure to CHIR was associated with appearance of inhibitory phosphorylation of this enzyme on Ser21 (
Figure 5b and
Figure 8a,b). In order to test whether the impact of CHIR is through inhibition of GSK-3, we generated cell lines with the GSK-3 expression significantly attenuated. We silenced either
GSK3A or
GSK3B genes, but to our surprise the knockdown had no visible influence on the expression of the gene strongly inhibited by CHIR-
TREM2. The knockdown did not sensitize to apoptosis either (
Figure 9a). Thus, the knockdown of a single isoform of GSK3 did not mimic the activity of CHIR. It was plausible that the kinases could substitute each other in relevant activity. However, the knockdown of both isoforms influenced neither
TREM2 expression nor caspase-3 activation. Thus, we cannot argue that the effects of CHIR on apoptosis or gene expression that we observed in this work are mediated through the inhibition of GSK-3. It is safer to say that the effects are mediated through the inhibition of a kinase or even several kinases targeted by CHIR.
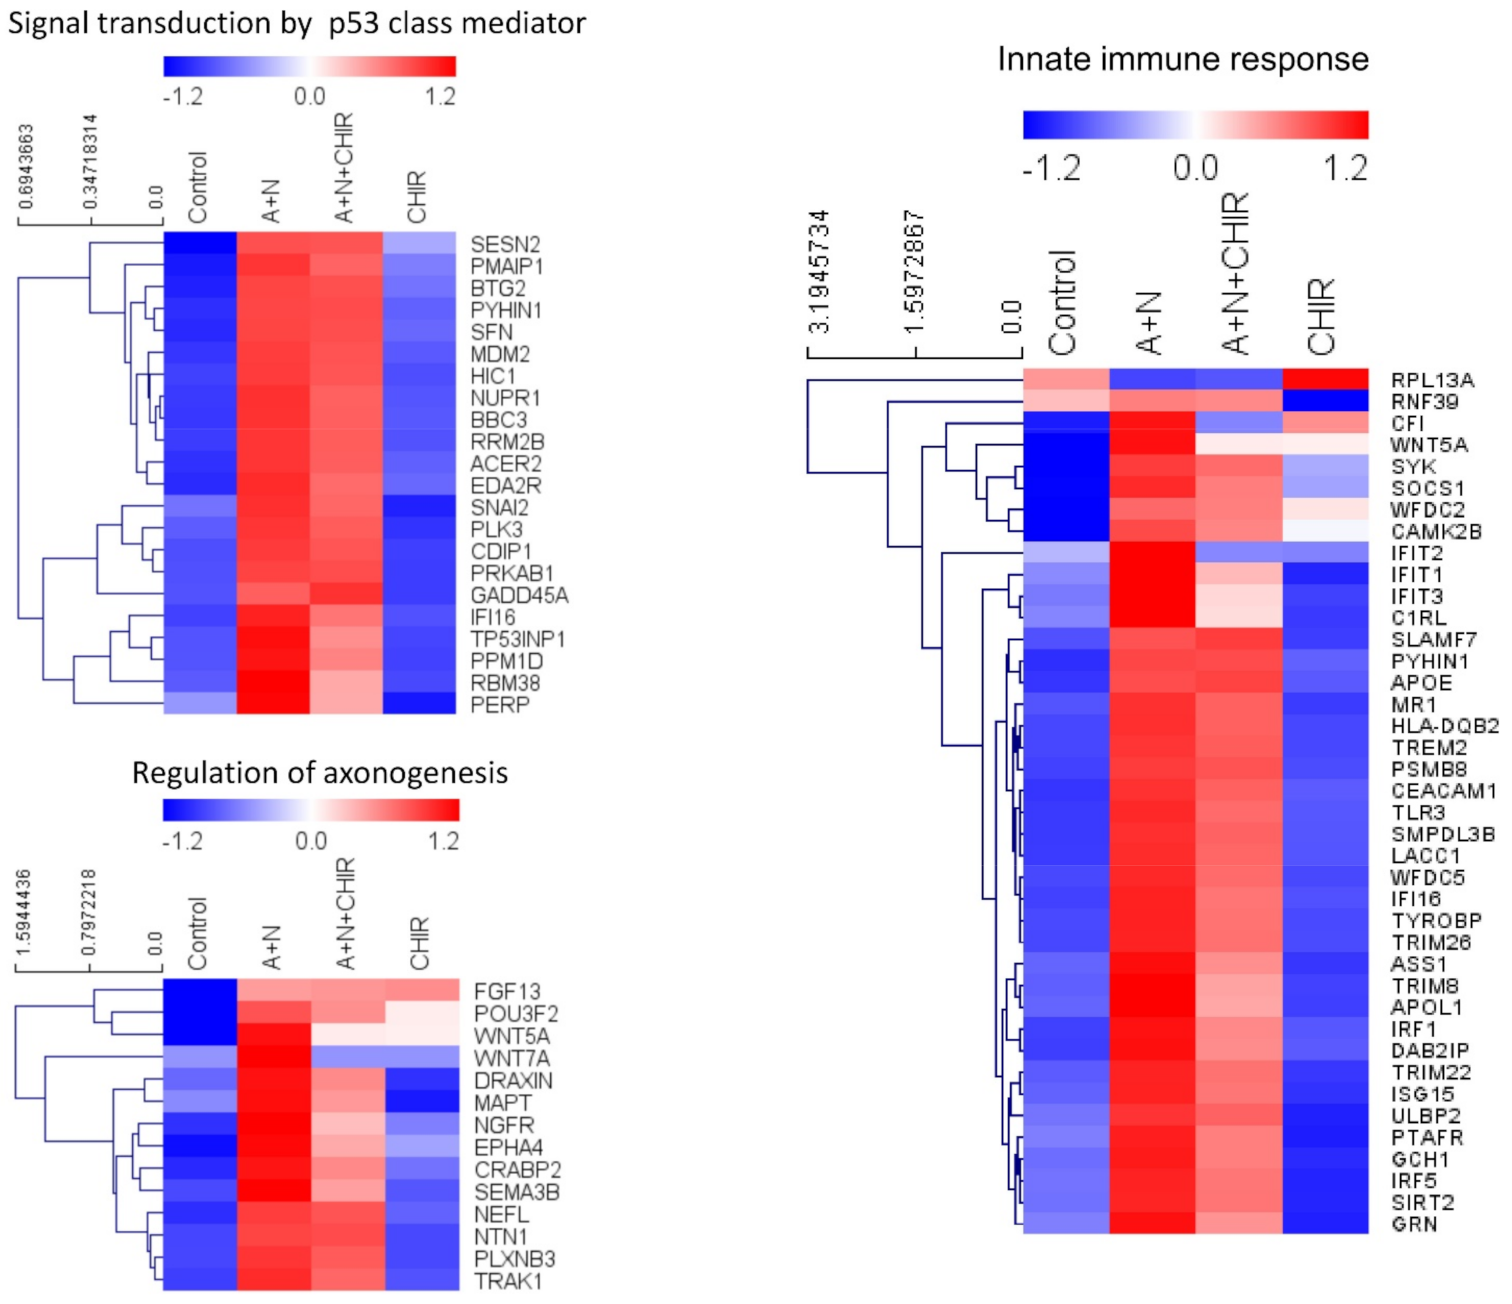
Our previously published data and current transcriptomic analysis demonstrated that A + N activated expression of several dozen innate immunity genes (
Figure 2 and [
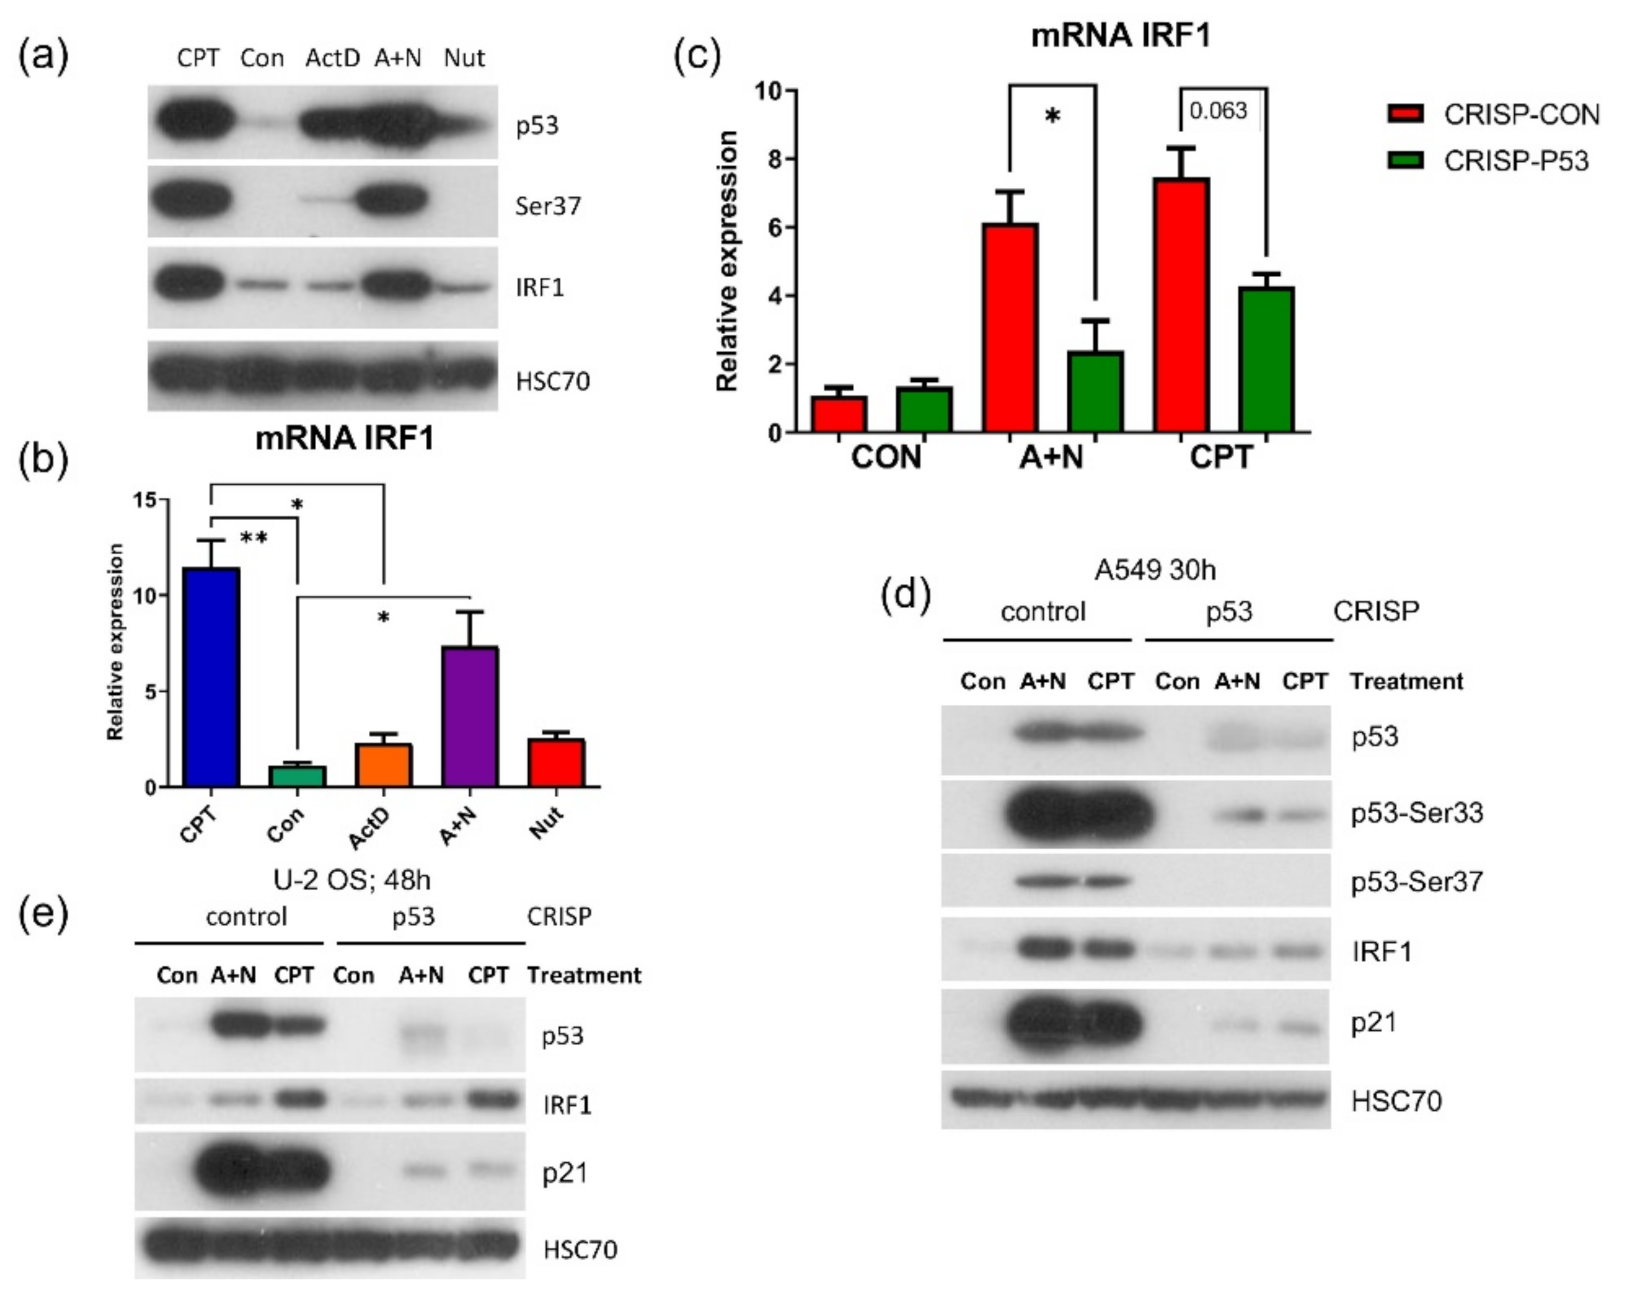
4]). One of the genes selected through transcriptomic analysis is
IRF1. It codes for a transcription factor controlling the expression of other innate immunity genes [
37]. Thus, by upregulating IRF1, the A + N combination could control the expression of many other genes. An intriguing possibility was that through activation of IRF1, the treatment with A + N could act independently of p53, because IRF1 gene was found to be stimulated by DNA damaging agents without the assistance of p53 [
27]. To our surprise, we observed that in p53–deficient A549 cells, IRF1 protein accumulated neither following exposure to A + N nor camptothecin. Upregulation of its mRNA was also attenuated (
Figure 10). Thus, definitely p53 participates in stimulation of IRF1 in A549 cells. However, p53 cannot activate this gene in U-2 OS cell line. In A549 cells IRF1 is upregulated only when p53 is strongly activated through phosphorylation (
Figure 10a). In U-2 OS cells there is a deficiency in p53 activation in some experimental conditions [
2]. We speculate that this may be the reason why U-2 OS cells are unable to activate IRF1 following exposure to A + N. On the other hand, in U-2 OS cells camptothecin stimulates IRF1 regardless of p53 status confirming the conclusions of Tanaka et al. [
27]. Thus, IRF1 can be upregulated by at least 3 factors: interferon gamma [
38], DNA damaging agents (
Figure 10e, [
27]) and strongly activated p53 (
Figure 10). Thus, upregulating IRF1 is another instrument for p53 to act as an antiviral molecule because IRF1 can activate several genes for antiviral proteins [
37].
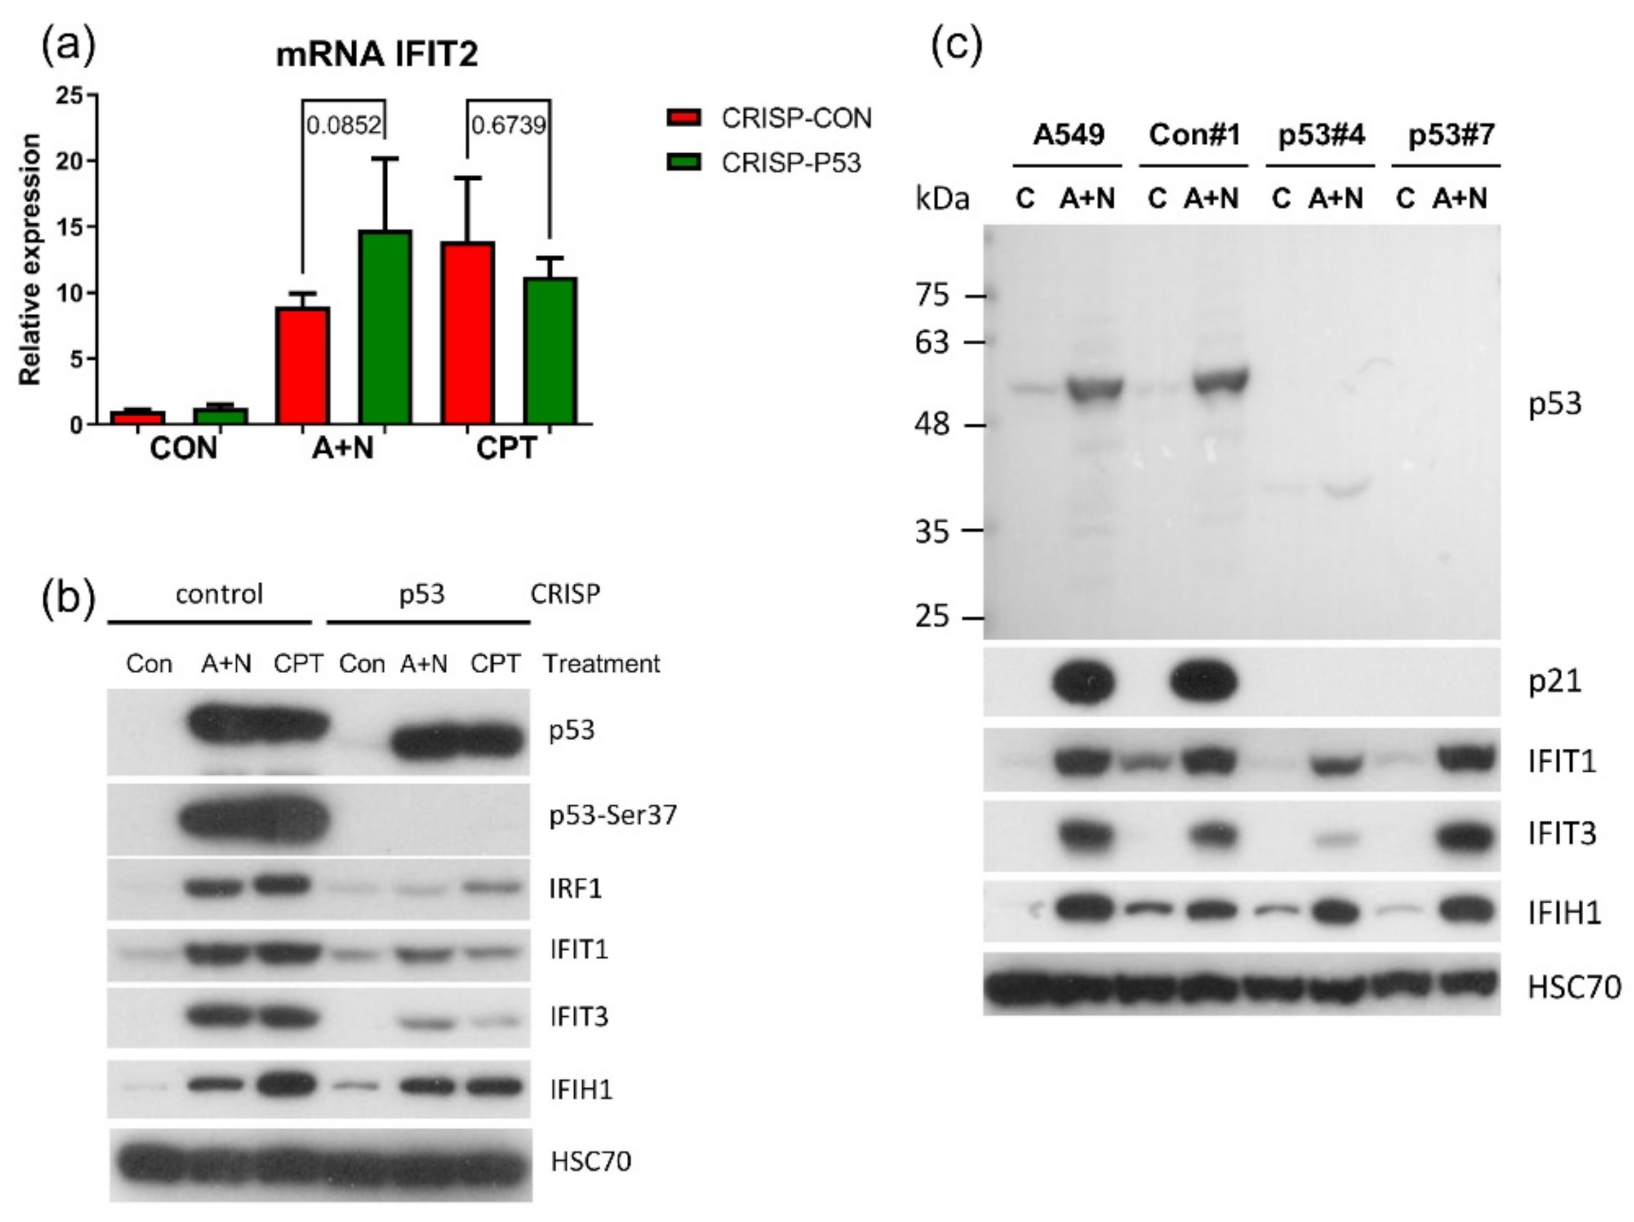
The
IFIT1 and
IFIT3 genes can be stimulated by IRF1-they contain IRF1 binding sites detected by ChIP-Seq method in monocytes [
26]. We observed that IFIT1 and IFIT3 proteins are strongly stimulated by A + N and by camptothecin. Using our earlier model, we did not find convincing evidence that p53 participates in their upregulation [
4]. Using A549 cells with p53 expression knocked down by CRISPR/Cas9 method we noticed that p53 can participate in their activation (
Figure 11b). In principle, p53 can do it directly or indirectly, through stimulation of IRF1. The detailed analysis of IRF1 target genes in lung cancer cells will be the subject of another, more extended study. Because the involvement of p53 in regulation of IFIT1 and IFIT3 was not clear-cut we decided to use another model. We selected clones of cells with the knockout of p53. We found two clones with no detectable p53. The cells did not activate gene for p21 protein, which is archetypal p53-regulated gene. Yet, these two clones were able to activate IFIT1, IFIT3 as well as IFIH1-another innate immunity gene selected through transcriptomic analysis. Moreover, the p53-null cell line NCI-H1299 also was able to activate IFIT1 and IFIT3 (
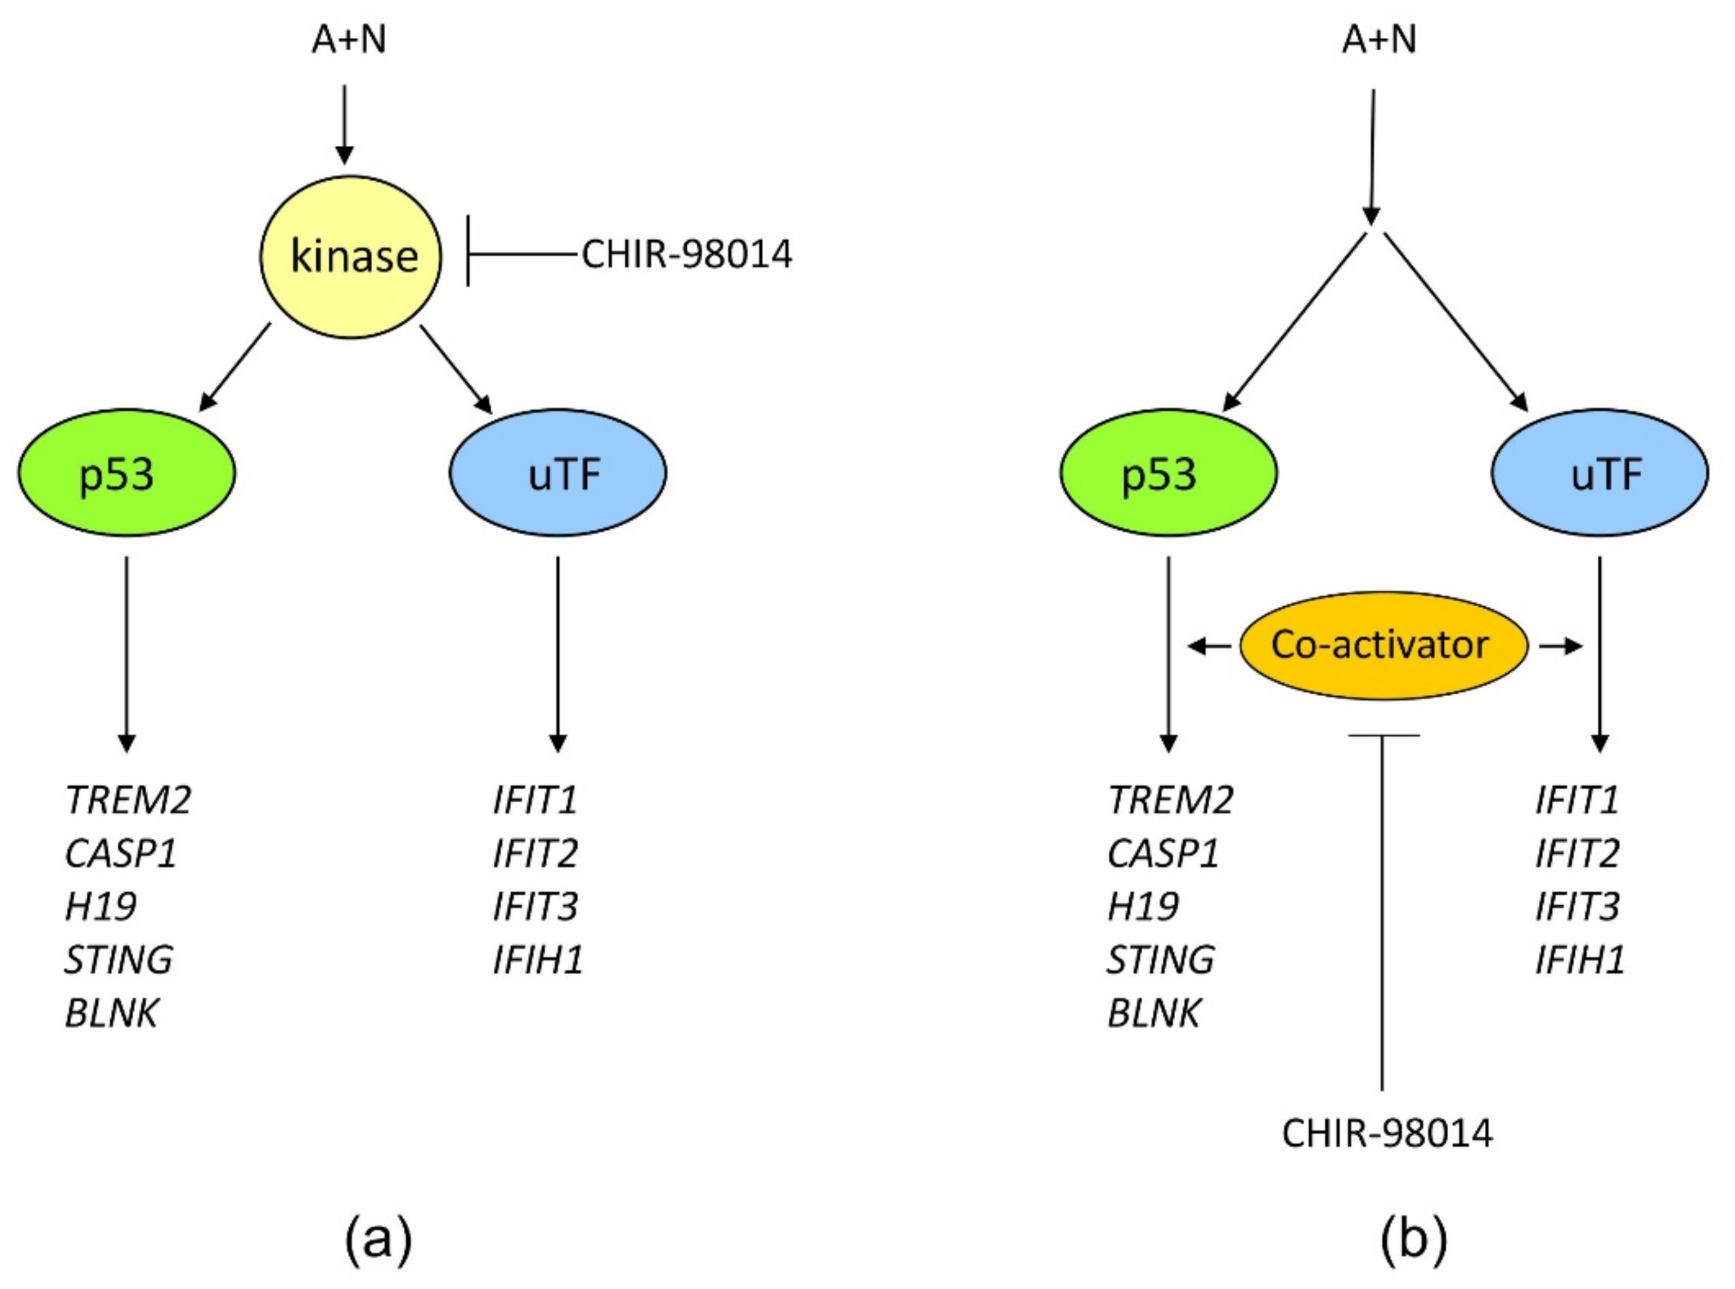
Figure 12). Thus, definitely, these two genes can be activated without assistance from p53 in cells exposed to A + N. So can be other innate immunity genes, which we picked out from transcriptomic analysis-IFIT2 and IFIH1. The expression of these four genes can be blocked or strongly attenuated by CHIR. Thus, surprisingly, this inhibitor can also attenuate the expression of the genes, which are not regulated by p53. Based on our results, we created two models explaining some of our observations (
Figure 13). In principle, they are not mutually exclusive. Treatment of cells with A + N triggers a signaling system containing an unidentified kinase, which is sensitive to the inhibitory activity of CHIR. This kinase can activate by phosphorylation an unidentified transcription factor, which stimulates the expression of IFIT1, IFIT2, IFIT3 and IFIH1 independently from p53. This kinase can also phosphorylate p53. The p53 as a transcription factor is not an on/off switch but its activity can be modulated by the number and type of posttranslational modifications. Thus, by getting a new modification, p53 can acquire the ability to interact with additional gene regulatory DNA sequences what enables the activation of new set of genes. Alternatively, new modification may enable p53 to interact with new transcriptional co-activator. Regardless the mechanism, additional modification can expand the set of regulated genes and/or it may increase the degree of gene activation [
14]. We suspect that the kinase inhibited by CHIR does to p53 what was hinted above. It modifies p53 in a way that allows for strong activation of some (e.g.,
TREM2,
BLNK,
TMEM173,
H19) but no other genes (
APOE,
FAS,
PMAIP,
BBC3) (
Figure 2 and
Figure 7). The Venn diagram shows (
Figure 1) that about half of genes upregulated by A + N is inhibited by CHIR to some degree. The genes very strongly influenced by CHIR can be seen on heatmaps (
Figure 2).
In the alternative scenario, the kinase inhibited by CHIR can act downstream from both transcription factors functioning as a common co-activator of both p53-regulated genes and the genes regulated by the other transcription factor.
In our opinion the most intriguing conclusion of our work is that there is a kinase, sensitive to CHIR, which is indispensable for activation of many innate immunity genes regulated by p53 and some other transcription factor. Moreover, this kinase has anti-apoptotic activity because its inhibition promotes apoptosis in several cell lines. Its identification will have the impact on our understanding of the interplay between cancer and immune cells.
4. Materials and Methods
4.1. Cell Culture, Reagents and Treatment
A549 (lung adenocarcinoma, American Type Culture Collection (ATCC, Manassas, VA, USA), NCI-H292 (lung cancer, ATCC), and U-2 OS (osteosarcoma, ATCC) cells were grown as previously described [
2]. NCI-H460 (lung cancer, ATCC) cells were grown at 37 °C/5% CO2 in RPMI-1640 supplemented with 2 mM L-glutamine, 4.5 g/L glucose and 1 mM sodium pyruvate, supplemented with 10% heat-inactivated fetal bovine serum (FBS; Invitrogen, Carlsbad, CA, USA) and 1% penicillin–streptomycin (Sigma-Aldrich, St. Louis, MO, USA).
The stock solutions of chemicals were prepared in DMSO: actinomycin D (10 μM; Sigma-Aldrich, St. Louis, MO, USA), camptothecin (10 mM; Calbiochem-Merck, Darmstadt, Germany), nutlin-3a (10 mM; Selleck Chemicals LLC, Houston, TX, USA), CHIR-98014 (5 mM, Selleck Chemicals, Houston, TX, USA), PHA-793887 (10 mM, Selleck Chemicals, Houston, TX, USA). Stock solutions were diluted in culture medium to the following concentrations: 5 nM actinomycin D, 5 μM nutlin-3a, 5 μM camptothecin. CHIR-98014 and PHA-793887 were diluted to concentrations indicated in the Results section. Control cells were mock-treated with medium containing DMSO.
The apoptotic cells were analyzed using PE Annexin V Apoptosis Detection Kit I (BD Biosciences, San Jose, CA, USA) according to manufacturer’s protocol using BD FACSCanto™ cytometer (Becton Dickinson, San Jose, CA, USA). The data were analyzed using BD FACSDiva™ (Becton Dickinson, San Jose, CA, USA) software.
4.2. The Knock-Down of Gene Expression
CRISPR Double Nickase Plasmids were used to disrupt expression of either TP53, GSK3A or GSK3B genes (Santa Cruz Biotechnology, Dallas, TX, USA). A set targeting a gene contains a pair of plasmids, not purified gRNAs and Cas9 nuclease. Each of the pair of plasmids encodes modified Cas9 nuclease and a unique, target-specific guide RNA (gRNA). Thus, these molecules are produced from plasmids in successfully transfected cells. Each gRNA targets a sequence on complementary DNA strand. The target sequences are offset by approximately 20 bp to allow for gene knockout with relatively high specificity. Following transfection, the Cas9 nuclease molecules guided by gRNAs on both DNA strands generate a staggered cut in target gene. This double-strand break is repaired in error prone fashion generating either frameshift mutations or amino acid deletions. The plasmids with the following catalogue numbers were employed: sc-416469-NIC for TP53, sc-400518-NIC for GSK3A, sc-400090-NIC for GSK3B. As a control we used Control Double Nickase Plasmid (sc-437281). For the transfection we employed a procedure suggested by the vendor. In short, cells were plated in the wells of the 6-well plate and after overnight culture in antibiotic-free medium, they were transfected with the plasmids. In order to get p53-deficient U-2 OS cells, they were transfected with UltraCruz Transfection reagent (Santa Cruz Biotechnology)-1 µg of DNA, 5 µL of the transfection reagent per well. In order to get p53-deficient or GSK-3-deficient A549 cells, they were transfected with FuGENE 6 transfection reagent (Promega, Madison, WI, USA)-2 µg of DNA, 6 µL of FuGENE 6). Following transfection the plasmids produced Cas9 nuclease, two guide RNA sequences and the puromycin resistance protein coded by one of the plasmids. Seventy two hours after start of transfection, puromycin was added to the medium. The selection with puromycin lasted for 72 h. The purpose of selection was to eliminate cells, which were not successfully transfected, hence expressed neither nuclease nor guide gRNAs able to disrupt expression of target genes. The selection was ended because transient transfection did not generate permanent puromycin resistance. After the transfection and puromycin selection most cells died because transfection is not 100% effective and most of the cells did not acquired plasmid with puromycin-resistance gene. However, the clones that regrew could be expanded and divided normally. At the end of selection, we had individual surviving cells, which could be expected to have the loss of function mutations in one or both copies of target genes. We incubated the cells in fresh, puromycin-free medium in order to expand the culture, what allowed for protein expression studies.
To select p53 knockout clones (or controls for knockout), the cells from the procedure described above were counted and seeded to round-bottom 96-well plate at the calculated density of 0.3 cells per well-hence we could expect to have one cell in every 3 wells. After 10–14 days of culture, the cell populations from individual wells were transferred to larger culture dishes, expanded and tested for p53 expression. The clones expressing no detectable p53 after exposure to A + N were selected for further analyses.
To perform a double-knockdown of GSK3A and GSK3B in A549 cells, we selected cells with the knockdown of GSK3B (or controls for knockdown) performed using CRISPR/Cas9 technology and we transduced them with lentiviruses expressing shRNA molecules directed against GSK3A mRNA (or with control lentiviruses). The lentiviruses were purchased from Santa Cruz Biotechnology (cat no. sc-29339 for anti-GSK3A lentivirus and no. sc-108080 for control lentivirus). The procedure was performed according to the manufacturer’s protocol. When the cell cultures were expanded, we assessed expression of both isoforms of GSK-3 by Western blotting.
4.3. Semi-Quantitative Real-Time RT-PCR
Total RNA samples were isolated from cells using the RNeasy mini kit (Qiagen, Hilden, Germany). The cDNA was synthesized with MuLV reverse transcriptase and random hexamers (Applied Biosystems, Foster City, CA, USA). Measurements of mRNA levels were performed using Real-Time 2 × PCR Master Mix SYBR (A&A Biotechnology, Gdynia, Poland). The sequence of primers used for RT-PCR are given in
Table S1. The primers for β-actin (internal reference gene) were: 5′-GCA AGC AGG AGT ATG ACG AG and 5’-CAA ATA AAG CCA TGC CAA TC (BioTeZ, Berlin, Germany). Amplification was performed on a CFX96 Real-Time System (Bio-Rad, Hercules, CA, USA). In each PCR run, cDNA samples were amplified in triplicate. Relative quantitation of mRNA was carried out using the ΔΔCT method with β-actin as a reference. Mean and standard deviation were calculated from three biological replicates.
4.4. Western Blotting
Whole-cell lysates were prepared using IP buffer, supplemented with protease and phosphatase inhibitors as described previously [
4]. Aliquots of lysates (35–50 µg) were separated by SDS-PAGE on 8% or 13% gels and electro-transferred onto PVDF membranes. Before incubation with primary antibody, the membranes were incubated for 1 h at room temperature in blocking solution (5% skim milk in PBS with 0.1% Tween-20). The following primary antibodies were obtained from Cell Signaling Technology (Danvers, MA, USA): anti-phospho-Ser33, anti–phospho-Ser37 p53, anti-phospho-Ser46, anti-phospho-Ser392, anti-phospho-GSK-3α (Ser21)(D1G2), anti-phospho-GSK-3β (Ser9)(5B3), anti-BLNK (D3P2H), anti-IFIT1 (D2X9Z), anti-STING (D2P2F), anti-IFI16 (D8B5T), anti-IRF1 (D5E4), anti-MDA5 (IFIH1) (D74E4), anti-TREM2 (D8I4C) anti-caspase-8 (1C12), anti-caspase-9 (rabbit polyclonal), anti-active caspase-3 (Asp 175)(5A1E). Anti-IFIT3 antibody (ab95989), anti-CASP1 antibody (ab179515) were from Abcam (Cambridge, UK). Anti-p53 (DO-1), anti-p21
WAF1 (F-5), anti-GSK-3α/β (0011-A) and loading control anti-HSC70 (B-6) antibodies were obtained from Santa Cruz Biotechnology. All incubations with primary antibodies were performed overnight at 4 °C in blocking solution. HRP-conjugated secondary antibodies (anti-mouse, anti-rabbit) were detected by chemiluminescence (SuperSignal West Pico or SuperSignal West Femto Chemiluminescent substrate, Thermo Fisher Scientific, Waltham, MA, USA).
4.5. Molecular Cloning, Site-Directed Mutagenesis and Luciferase Reporter Assay
The promoter region of BLNK was cloned into the pGL3-Basic reporter vector, which encodes firefly luciferase (Promega, Madison, WI, USA). The human BLNK promoter was amplified by PCR from a genomic DNA sample (A549 cells) using primers: 5′- TTTT GAGCTC TGT TAC CAC CAT GCC ACTG and 5′- TTTT ACGCGT CAG CAT GGT AAG CCT CTG GT. The primers were designed to contain the restriction sites (underlined) for SacI and MluI, respectively. Amplified DNA was ligated into the respective sites of pGL3-Basic. PCRs was performed with PfuPlus! DNA polymerase mix (EURx, Gdańsk, Poland) to ensure high fidelity DNA amplification. The inserted DNA was sequenced to ensure that the clone contained no mutations.
The mutations of CWWG (W-A or T) sequence in the putative p53 response element (RE) from BLNK promoter were created using GeneArt Site-Directed Mutagenesis PLUS kit (Life Technologies, Carlsbad, CA, USA) with forward (5′ GAC TAT GTG CTC GGG GCGT TTT TAC TTC TCC CTA 3’) and complementary reverse (5′ TAG GGA GAA GTA AAA ACGC CCC GAG CAC ATA GTC 3’) primers (the sites of mutation are underlined).
The luciferase reporter assay was performed as described recently [
4]. In short, U-2 OS cells were co-transfected using FuGENE 6 (Promega) with a combination of reporter vector, encoding firefly luciferase under the control of BLNK promoter (wild type or mutant), and expression vector pC53-SN3, encoding wild-type p53 or pC53-SCX3 encoding Val143Ala p53 mutant (a gift from Dr. Bert Vogelstein and Dr. Kenneth W. Kinzler from Johns Hopkins University, Baltimore, MD, USA) [
39]. As a negative control, the p53 plasmid was replaced by empty vector. The transfection mixture also contained pRL-TK, encoding Renilla sp. luciferase under the control of HSV-TK promoter (internal control). The next day, the cells were washed with culture medium and incubated with fresh medium for an additional 24 h. The cells were lysed with PLB buffer from the Dual Luciferase Reporter Assay system (Promega, Madison, WI, USA) and the activities of the luciferases were measured. Firefly luciferase activity was normalized against Renilla sp. luciferase activity. Each transfection was performed in triplicate in three independent experiments.
4.6. RNA-Seq and the Analysis of Results
A549 cells were treated for 30 h with 5 nM actinomycin D and 5 μM nutlin-3a (A + N), with A + N in the presence of 1 μM CHIR-98014 or with 1 μM CHIR-98014 acting alone. Control cells were mock-treated with culture medium containing solvent (DMSO). At the end of treatment cells were harvested by trypsinization. After washing in PBS, the cell pellets were frozen in −70 °C. Total RNA samples were prepared using the RNeasy mini kit with on-column digestion with DNAse (Qiagen, Hilden, Germany). The quality of RNA samples was determined using an Agilent Bioanalyzer (Agilent Technologies, Santa Clara, CA, USA). High quality RNA samples were prepared (OD 260/280 ratio ≥ 1.8, OD 260/230 ≥ 1.7, RNA integrity number, RIN ≥ 9.0). The RNA sequencing and expression analysis were outsourced to Eurofins Genomics Europe Sequencing (Constance, Germany). Sequencing using Genome Sequencer Illumina HiSeq4000 was performed on random primed cDNA library synthesized from poly-A containing mRNA molecules. Fifty-bp, single-end reads were performed. We had the following number of quality control clean reads: control-65,496,040, A + N-80,592,823, A + N + CHIR-63,207,428, CHIR-68,662,962. Clean reads constituted at least 99.6% of total reads. Quality filtered reads were aligned to the reference human genome (hg19). At least 98.6% of clean reads could be successfully mapped. RNA-Seq reads were aligned to the reference genome using Bowtie aligner (version 2.3.3.1) [
40]. TopHat (version 2.0.14) was used to identify the potential exon-exon splice junctions of the initial alignment [
41]. Subsequently, Cufflinks assembler and abundance estimation algorithms were employed to identify and quantify the transcripts from the preprocessed RNA-Seq alignment-assembly. After this, Cuffmerge algorithm merged the identified transcript pieces to full length transcripts and annotated the transcripts to the genome annotations (Gencode v27, Ensembl 90). Finally, merged transcripts from treated and control samples were compared using Cuffdiff utility to determine the differential expression levels of given transcripts including the measure of statistical significance of the differences (the
p-value of the test statistic and the False Discovery Rate-adjusted
p-value of the test statistic). This analysis was performed using open-source programs published by Trapnell et al. [
42].
List of significantly up-regulated and down-regulated genes was created only from transcripts with annotated gene symbols and refseq ID with mean expression > 1 FPKM. In order to avoid dividing by zero for log2FC (fold change) calculations, undetectable expression was transformed into half on minimal detected expression value. Upregulated genes were considered those with log2FC > 1 and p value < 0.05 and down-regulated with log2FC < −1 and p value < 0.05. Due to exploratory nature of our RNA-seq experiment and further validation of selected gene expression, we used unadjusted p value threshold for gene selection.
For functional analysis of significantly up- and down-regulated genes we used g: Profiler tool [
43]. Top overrepresented pathways with adjusted
p value < 0.05, size < 200 and intersection to query size ratio > 0.03 were shown in the
Figure 1. All results of functional analysis are shown in
Supplementary Tables S5–S10.


 ,
, 


