Article

OCT1 Is a Poor Prognostic Factor for Breast Cancer Patients and Promotes Cell Proliferation via Inducing NCAPH

1
Department of Systems Aging Science and Medicine, Tokyo Metropolitan Institute of Gerontology, 35-2 Sakae-cho, Itabashi-ku, Tokyo 173-0015, Japan
2
Department of Breast and Endocrine Surgery, Toranomon Hospital, 2-2-2 Toranomon, Minato-ku, Tokyo 105-8470, Japan
3
Department of Systems BioMedicine, Tokyo Medical and Dental University, 1-5-45 Yushima, Bunkyo-ku, Tokyo 113-8510, Japan
4
Department of Pathology, Toranomon Hospital, 2-2-2 Toranomon, Minato-ku, Tokyo 105-8470, Japan
5
Division of Systems Medicine and Gene Therapy, Saitama Medical University, 1397-1 Yamane, Hidaka-shi, Saitama 350-1241, Japan
*
Author to whom correspondence should be addressed.
Int. J. Mol. Sci. 2021, 22(21), 11505; https://0-doi-org.brum.beds.ac.uk/10.3390/ijms222111505
Submission received: 25 September 2021 / Revised: 16 October 2021 / Accepted: 21 October 2021 / Published: 25 October 2021
(This article belongs to the Special Issue Molecular Research and Treatment of Breast Cancer)

Abstract

:
Octamer transcription factor 1 (OCT1) is a transcriptional factor reported to be a poor prognostic factor in various cancers. However, the clinical value of OCT1 in breast cancer is not fully understood. In the present study, an immunohistochemical study of OCT1 protein was performed using estrogen receptor (ER)-positive breast cancer tissues from 108 patients. Positive OCT1 immunoreactivity (IR) was associated with the shorter disease-free survival (DFS) of patients (p = 0.019). Knockdown of OCT1 inhibited cell proliferation in MCF-7 breast cancer cells as well as its derivative long-term estrogen-deprived (LTED) cells. On the other hand, the overexpression of OCT1 promoted cell proliferation in MCF-7 cells. Using microarray analysis, we identified the non-structural maintenance of chromosomes condensin I complex subunit H (NCAPH) as a novel OCT1-taget gene in MCF-7 cells. Immunohistochemical analysis showed that NCAPH IR was significantly positively associated with OCT1 IR (p < 0.001) and that positive NCAPH IR was significantly related to the poor DFS rate of patients (p = 0.041). The knockdown of NCAPH inhibited cell proliferation in MCF-7 and LTED cells. These results demonstrate that OCT1 and its target gene NCAPH are poor prognostic factors and potential therapeutic targets for patients with ER-positive breast cancer.

1. Introduction

Breast cancer is one of the most frequent malignant diseases worldwide. Breast cancer is the most commonly diagnosed cancer and was the leading cause of cancer deaths in women in 2020 [1]. The number of patients is expected to increase further in the future [2]. Among them, about 80% of patients are estimated to have estrogen receptor (ER)-positive breast cancer [3]. In recent years, drug therapy for ER-positive breast cancer has evolved. In addition to conventional endocrine therapy and chemotherapy, molecular targeted therapies are under investigation, and some of them are available in clinical settings [4,5]. However, in a certain percentage of patients, the cancer develops endocrine resistance [6]. Therefore, the emergence of new drug therapies that will further prolong the survival of breast cancer patients is aspired to.
In this study, we investigated the clinical value of Octamer transcription factor 1 (OCT1) in ER-positive breast cancer. OCT1 is a transcriptional factor that is also known as POU domain class 2 transcription factor 1 (POU2F1). It binds specifically to the octamer consensus sequence (ATGCAAAT) in the promoter region of the DNA of the target genes and regulates their transcription [7]. Acyl-CoA synthetase long chain family member 3 (ACSL3) [8], disks large-associated protein 5 (DLGAP5) [9], anillin actin binding protein (ANLN) [10], and cyclin D1 (CCND1) [11], which are involved in cell proliferation, were reported as target genes. In addition to these genes, several genes related to various functions, such as cellular stress response, metabolic regulation, and cancer metastasis, have been reported as OCT1-target genes [12,13,14,15,16,17].
Oct1 has been shown to be a prognostic factor in various carcinomas. We have previously reported that the high expression of OCT1 is a prognostic factor in prostate cancer patients [18]. Additionally, in gastric cancer patients [19], colorectal cancer patients [20], and hepatocellular carcinoma patients [21], the high expression of OCT1 has been reported as a poor prognostic factor. As far as we know, the effect of OCT1 on the prognosis in breast cancer patients has not been reported upon so far. In the present study, we showed that the immunoreactivity of OCT1 is associated with the poor prognosis of ER-positive breast cancer patients. The function of OCT1 in ER-positive breast cancer cells were also studied.

2. Results

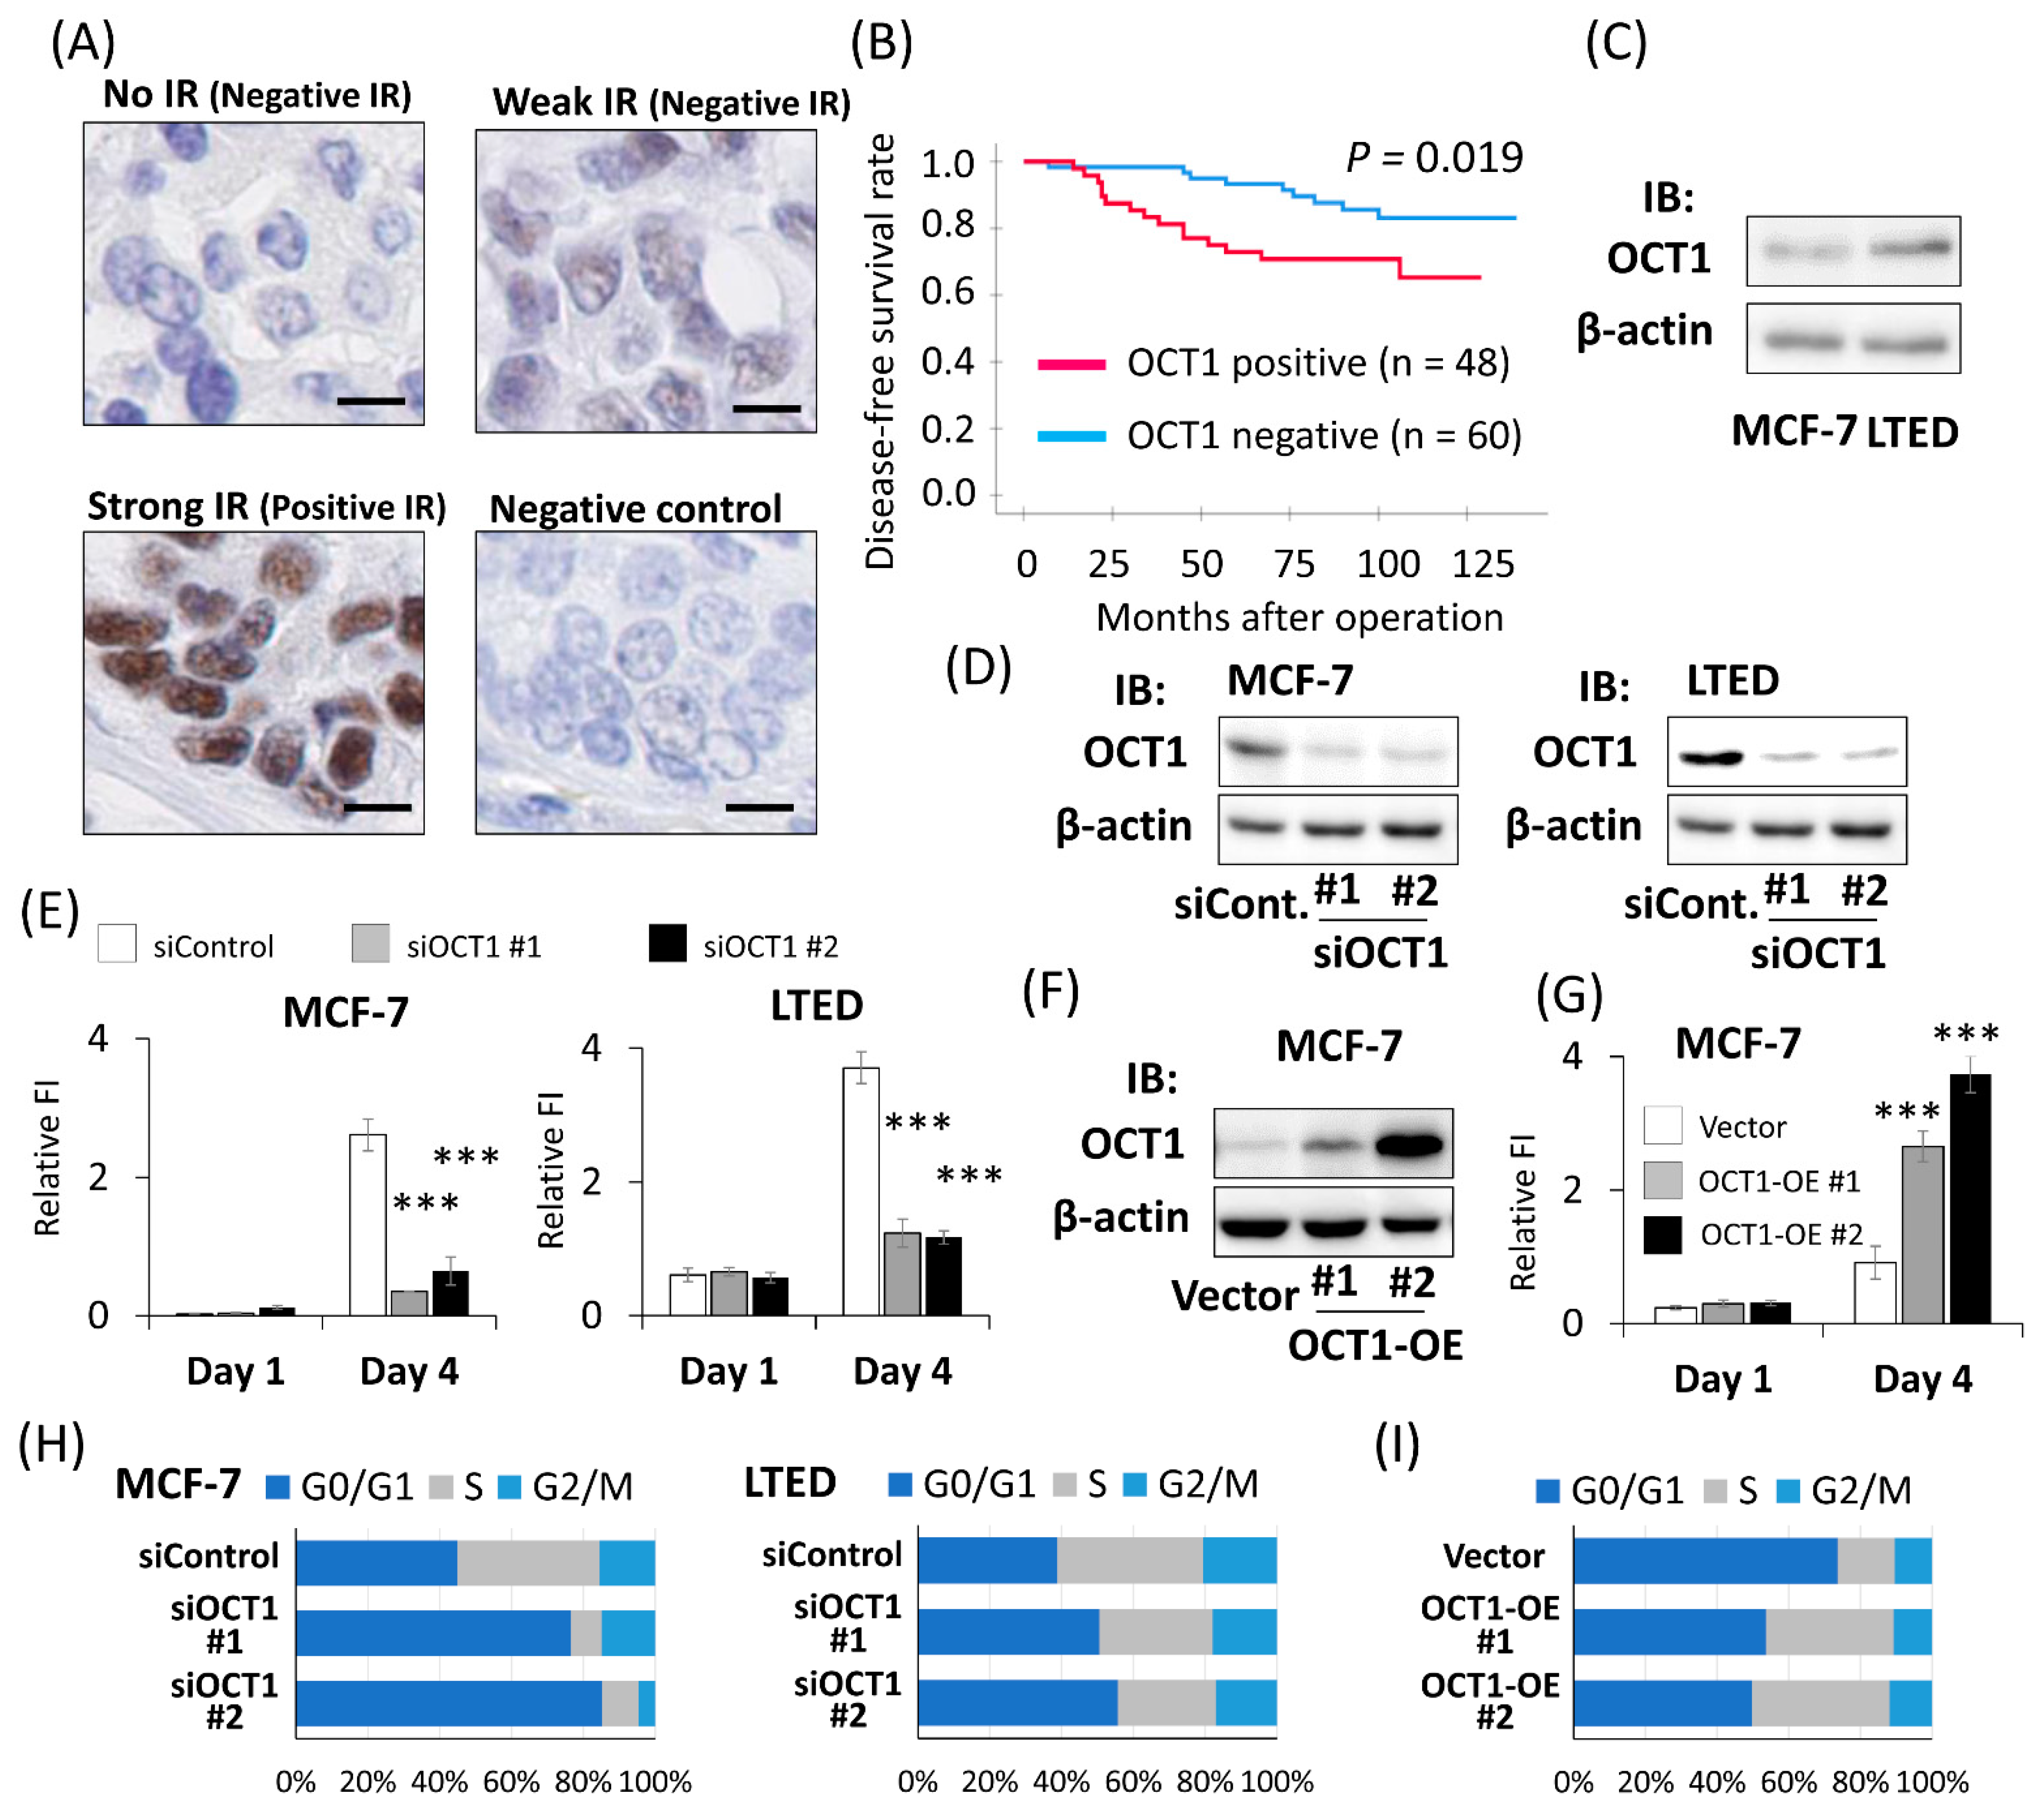
2.1. Positive OCT1 Immunoreactivity Was Associated with the Poor Prognosis of Breast Cancer Patients

To explore the clinical value of OCT1 expression in ER-positive breast cancer, immunohistochemical analysis was performed with 108 female patients with ER-positive breast cancer who had undergone the surgical resection of primary tumors. Prior to immunostaining, the specific reactivity of the antibody against OCT1 was confirmed by Western blotting using cell lysate derived from HEK293 cells and MCF-7 cells overexpressing human OCT1 (Figure S1). OCT1 staining was observed in the nucleus (Figure 1A). No significant relationship was found between OCT1 IR and any clinicopathological parameters that were analyzed (Table 1). In terms of the relationship between OCT1 IR and clinical prognosis, positive OCT1 IR was significantly associated with a shorter DFS (p = 0.019) (Figure 1B). Univariate analysis using the Cox proportional hazard model demonstrated that OCT1 status, invasive tumor size, lymph node status, and nuclear grade were significant prognostic factor for DFS. Multivariate analysis of these factors showed that OCT1 status was the only independent prognostic factor (Table 2). The present results of OCT1 IR were in line with the analysis of OCT1 mRNA expression using public databases. High expression of OCT1 was significantly associated with poor prognosis in KM Plotter [22] (Figure S2A). According to the expression analysis using Oncomine [23], the OCT1 mRNA expression level was significantly increased in invasive ductal breast cancer tissues compared to in the normal breast tissues (Figure S2B). We compared endogenous OCT1 expression in MCF-7 cells, which are ER-positive breast cancer cells, and their derivative LTED cells, a model of endocrine therapy-resistant breast cancer. Both mRNA and the protein expression levels of OCT1 were higher in LTED cells compared to those in MCF-7 cells Figure S3A and Figure 1C).

2.2. OCT1 Promoted the Cell Proliferation of Breast Cancer Cells

We investigated the biological function of OCT1 in ER-positive breast cancer cells. We performed the knockdown of OCT1 using siRNAs (siOCT1 #1, siOCT1 #2) in MCF-7 and LTED cells (Figure S3B and Figure 1D). The fluorescence intensity of Hoechst 33342 on the fourth day after siRNA transfection was decreased by silencing OCT1 in both MCF-7 and LTED cells (Figure 1E). Then, the effect of OCT1 knockdown on cell viability was analyzed by means of 3-(4,5-dimethylthiazol-2-yl)-5-(3-carboxymethoxyphenyl)-2-(4-sulfophenyl)-2H-tetrazolium (MTS) assay. The absorbance of 490 nm on the fourth day after siRNA transfection was suppressed by OCT1 knockdown in both MCF-7 and LTED cells (Figure S4A). Then, we established two clones of MCF-7 cells stably expressing OCT1 and an MCF-7 clone transfected with an empty vector (Figure S3C and Figure 1F). The fluorescence intensity of Hoechst 33342 on the fourth day after seeding was increased by OCT1 overexpression (Figure 1G). Next, we investigated the effect of OCT1 on the cell cycle of breast cancer cells using flow cytometry. The percentage of cells in the G0/G1 phase increased and that of cells in the S phase decreased in the cells treated by siOCT1 (Figure 1H and Figure S4B). Then, we examined the effect of OCT1 overexpression on the cell cycle. The percentage of cells in the G0/G1 phase decreased and that in the S phase increased in the OCT1 overexpressing cells (Figure 1I and Figure S4C).

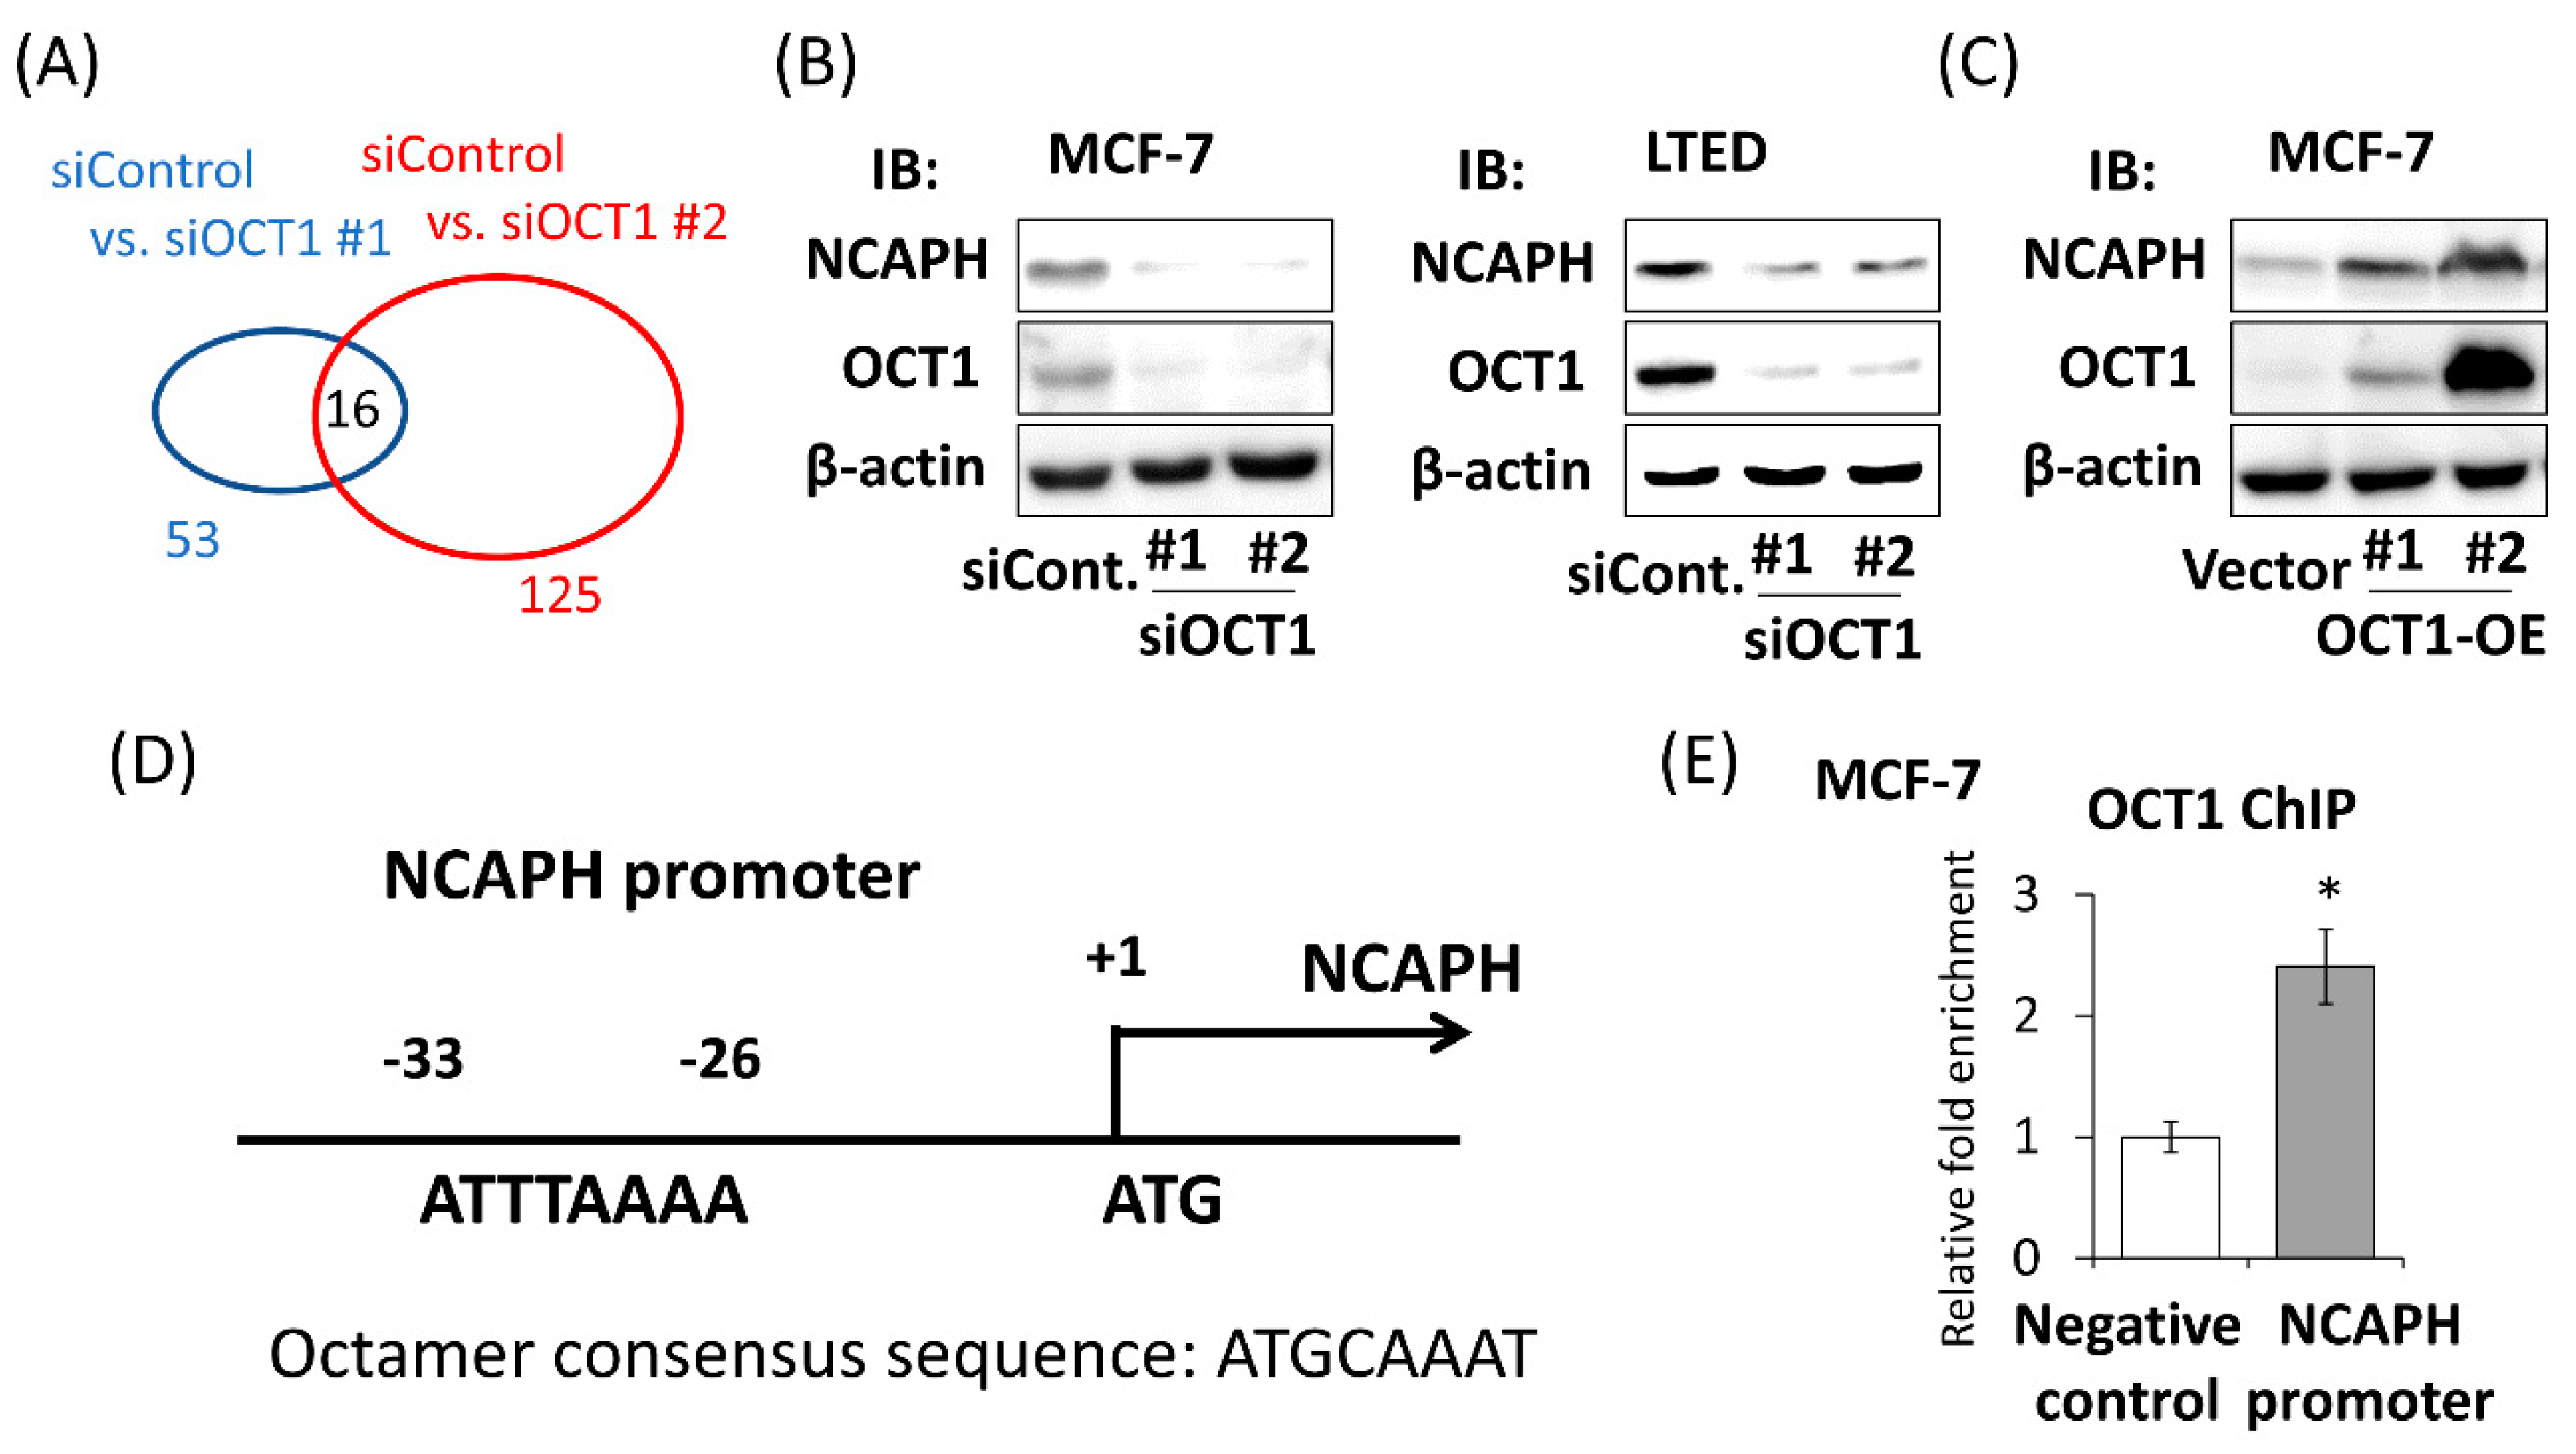
2.3. Identification of OCT1-Induced Genes

To further investigate the function of OCT1 in breast cancer cells, microarray analysis was performed using MCF-7 cells treated with siControl, siOCT1 #1, or siOCT1 #2. We compared the gene expression of siControl-treated cells with siOCT1 #1-treated cells and detected 53 genes as genes that are downregulated with an eight-fold change or more. We compared the gene expression of siControl-treated cells with siOCT1 #2-treated cells and detected 125 genes as genes that are downregulated with an eight-fold change or more. Among these genes, 16 genes were extracted in common (Figure 2A and Table S1). A total of 5 of 16 genes, namely ribonucleotide reductase regulatory subunit M2 (RRM2), cell division cycle associated 3 (CDCA3), non-SMC condensin I complex subunit H (NCAPH), centrosomal protein 55 (CEP55), and kinesin family member 20A (KIF20A), were associated with a poor prognosis of ER-positive breast cancer in a public dataset using KM Plotter (Figure S5A–E). These are novel candidates of OCT1-induced genes that potentially mediate the tumor promoting effect of OCT1. Among these genes, we focused on NCAPH, of which no functional analysis in breast cancer has been reported so far to the best of our knowledge. NCAPH is one of the subunits of condensin I, which is involved in the condensation and stabilization of chromosomes during mitosis [24,25]. To confirm the result of the microarray analysis, we evaluated the change of the NCAPH expression level when the expression of OCT1 was manipulated. Both mRNA and protein expression levels were suppressed by silencing OCT1 in MCF-7 and LTED cells (Figure S7A and Figure 2B). On the other hand, the mRNA and protein expression levels of NCAPH were elevated in the OCT1 overexpressing MCF-7 cells in proportion to its expression level (Figure S7B and Figure 2C).
In breast cancer cell lines, it has been reported that OCT1 binds to the promoter region of ESR1 encoding ERα and induces its transcription [26,27]. To determine whether the regulation of NCAPH is mediated by ERα, MCF-7 cells were treated with estradiol (E2). The expression of NCAPH was not affected by E2 treatment in the condition where GREB1, a typical estrogen-responsive gene, was significantly affected (Figure S7C,D). To investigate the possibility that OCT1 directly regulates the transcription of NCAPH, we searched the NCAPH promoter region to determine whether octamer consensus sequences existed in the region. We found a putative octamer consensus sequence at 26 base pairs upstream from the translation initiation site (Figure 2D). Then, we performed a chromatin immunoprecipitation (ChIP) assay to investigate whether OCT1 is associated with the NCAPH promoter region. In MCF-7 cells, the fold enrichment relative to IgG control in the NCAPH promoter was significantly higher compared to that in the irrelevant region in the first exon of the NCAPH gene (negative control) (Figure 2E).

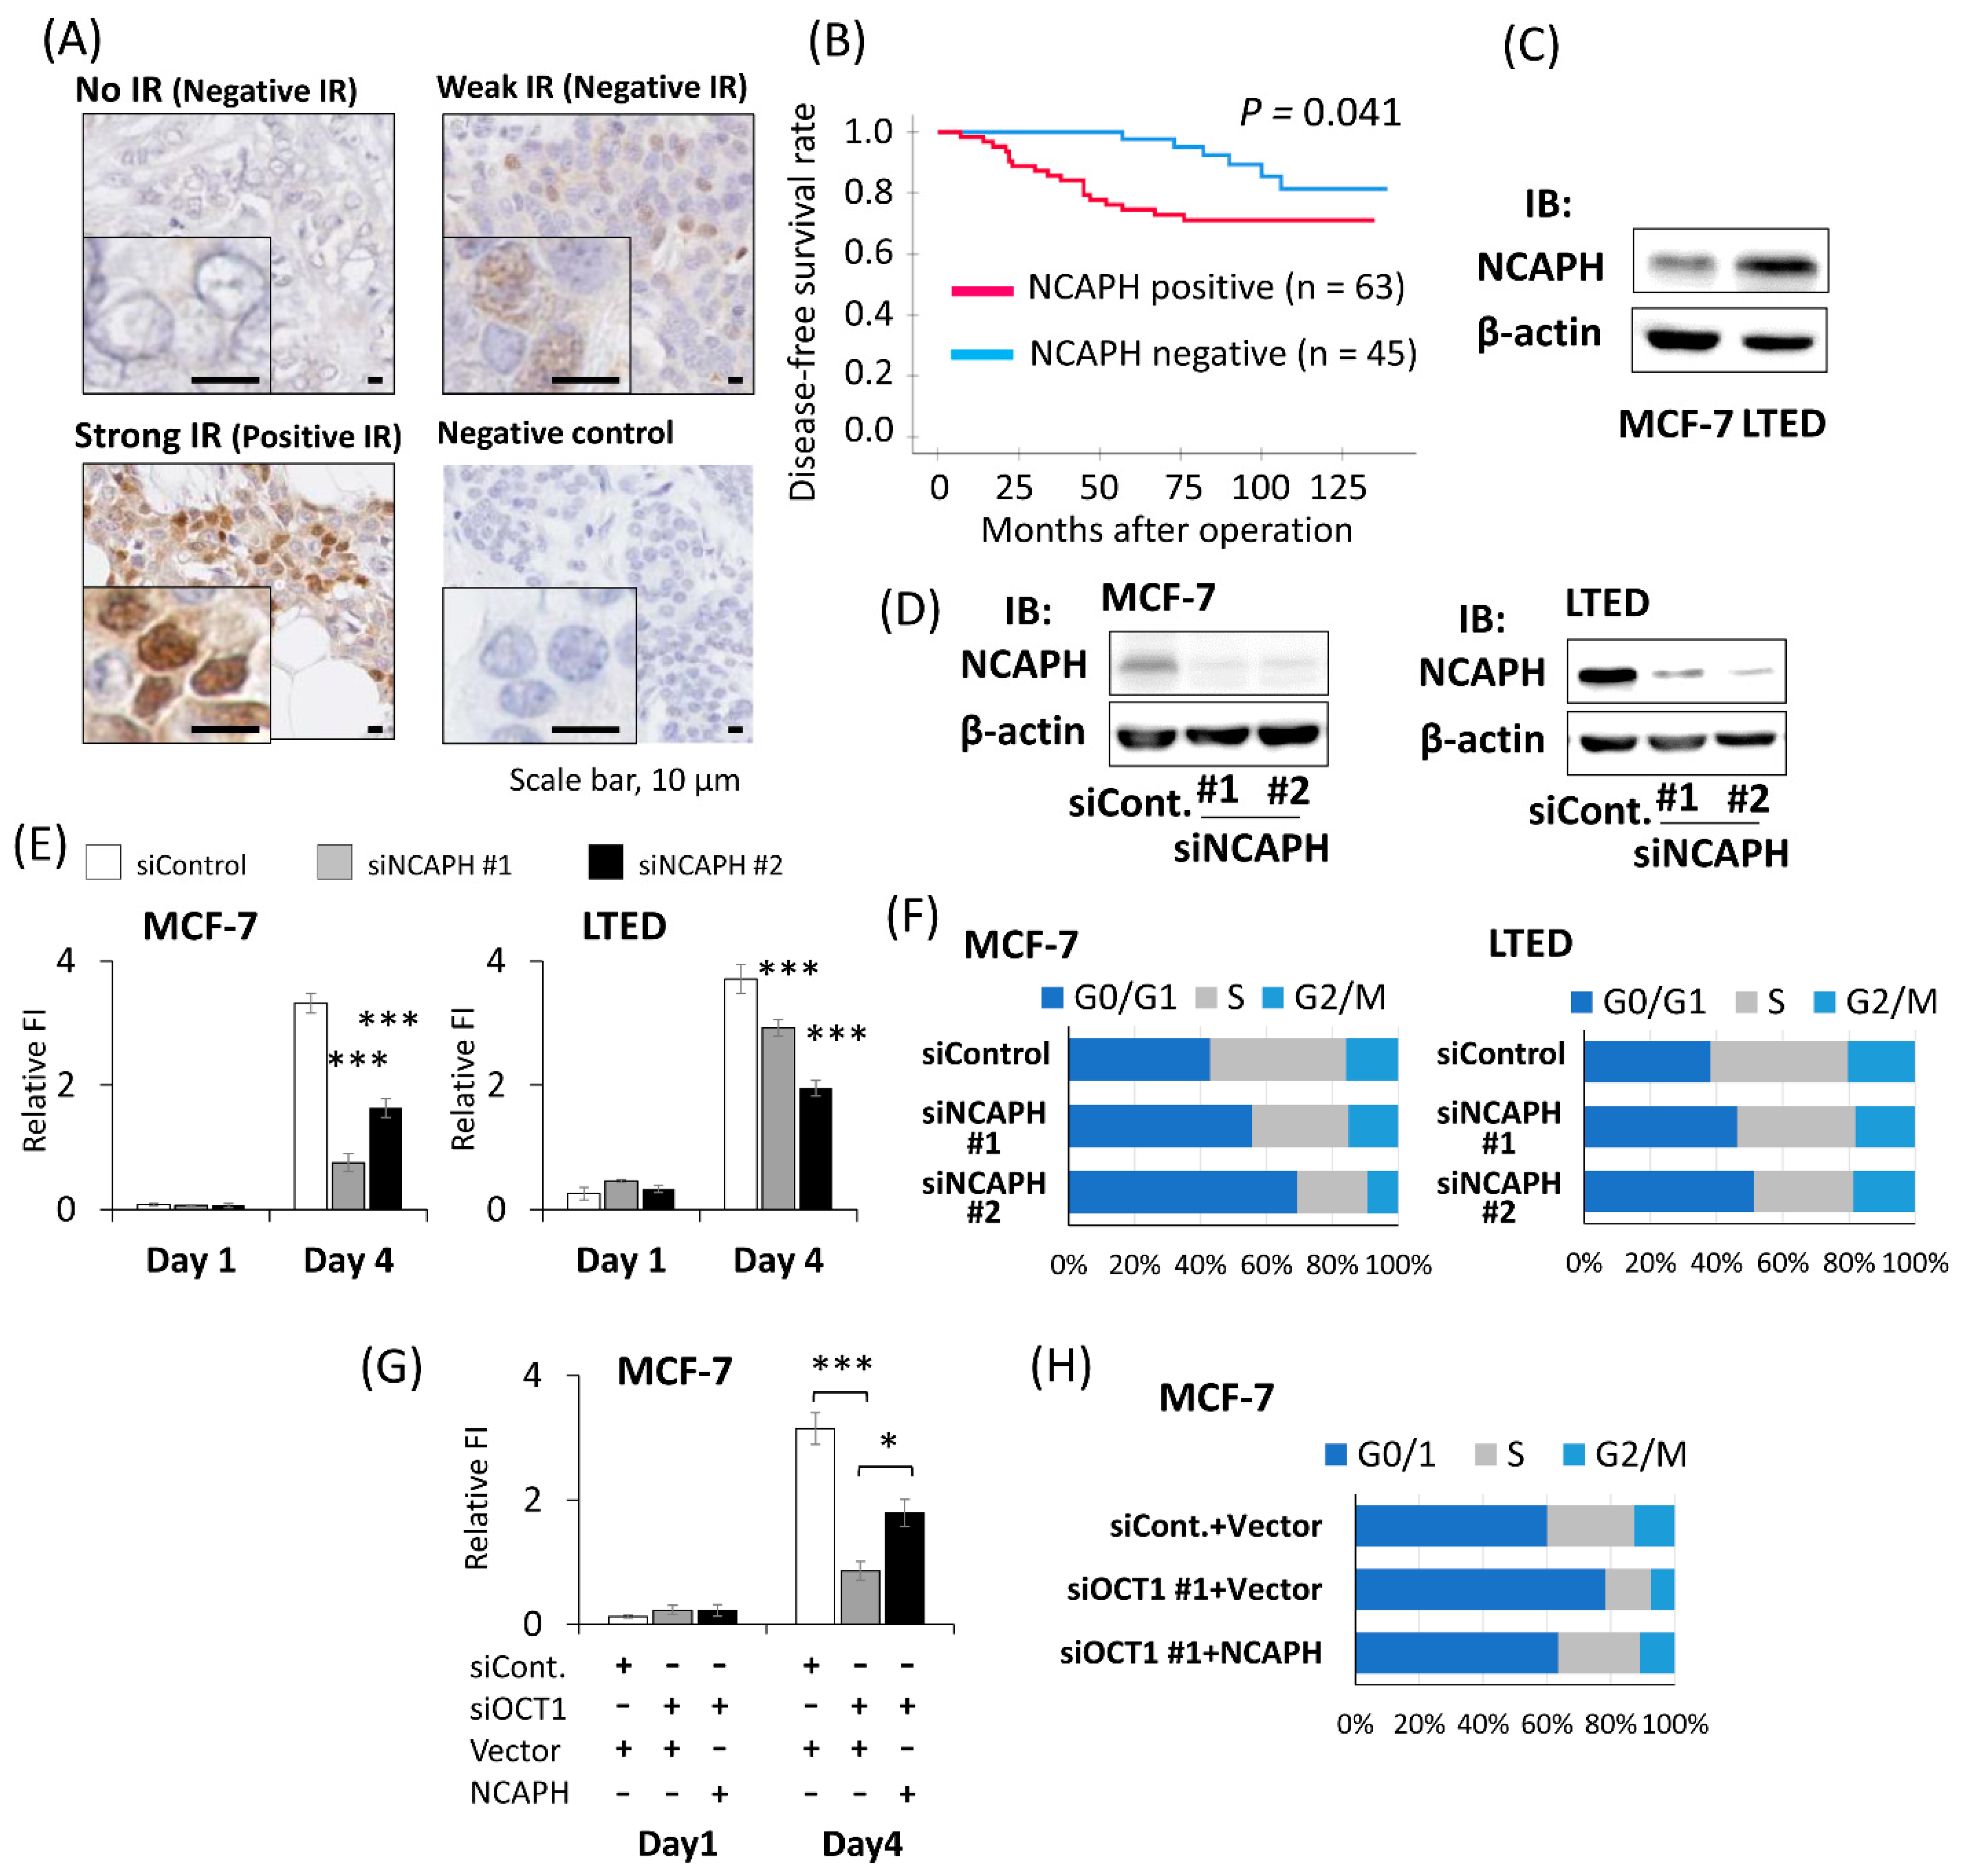
2.4. Positive NCAPH Immunoreactivity Was Associated with the Poor Prognosis of Breast Cancer Patients

To explore the clinical value of NCAPH expression in ER-positive breast cancer, immunohistochemical analysis was performed with the same 108 female breast cancer patients as in the analysis of OCT1. Prior to immunostaining, the specific reactivity of the antibody against NCAPH was confirmed by Western blotting using cell lysate derived from HEK293 cells and MCF-7 cells overexpressing human NCAPH (Figure S6). NCAPH staining was observed in both the nucleus and in the cytoplasm. In some cases, the nuclei were prominently stained (Figure 3A). NCAPH IR was significantly positively associated with OCT1 status (p < 0.001) (Table 3). In terms of relationship between NCAPH IR and clinical prognosis, positive NCAPH IR was significantly associated with a shorter DFS (p = 0.041) (Figure 3B). Univariate analysis using the Cox proportional hazard model demonstrated that NCAPH status, invasive tumor size, lymph node status, and nuclear grade were significant prognostic factors for DFS. Multivariate analysis of these factors showed that NCAPH status and invasive tumor size were independent prognostic factors (Table 4). These immunohistochemical results were in line with the prognostic analysis conducted using KM plotter (Figure S5C). According to the expression analysis using Oncomine, the NCAPH mRNA expression level was significantly increased in the invasive ductal breast cancer tissues compared to in normal breast tissue (Figure S7E). Then, we compared endogenous NCAPH expression in the human breast cancer cell line MCF-7 and LTED cells. Both the mRNA and protein expression levels in LTED cells were higher than those in MCF-7 cells (Figure S7F and Figure 3C).

2.5. Knockdown of NCAPH Suppressed the Proliferation of Breast Cancer Cells

To investigate the biological functions of NCAPH in breast cancer cells, we performed the knockdown of NCAPH using siRNAs (siNCAPH #1, siNCAPH #2) in MCF-7 cells and LTED cells. We confirmed that both the mRNA and protein expression levels of NCAPH were suppressed by siRNAs (Figure S7G and Figure 3D). The fluorescence intensity of Hoechst 33342 on the fourth day after siRNA transfection was decreased by silencing the NCAPH in both the MCF-7 and LTED cells (Figure 3E). When the cell viability was assessed using an MTS assay, an absorbance of 490 nm on the fourth day after siRNA transfection was suppressed by NCAPH knockdown in both the MCF-7 and LTED cells (Figure S8A). Then, we examined the effect of the knockdown of NCAPH on the cell cycle using flow cytometry. The percentage of cells in the G0/G1 phase increased, and the percentage of cells in the S phase decreased in the cells treated with siNCAPH (Figure 3F and Figure S8B).
Then, we overexpressed NCAPH in the MCF-7 cells where OCT1 was knocked down. The exogenous NCAPH partially rescued the suppressed fluorescence intensity of Hoechst 33342 on the fourth day after siOCT1 transfection (Figure 3G). When the cell cycle was analyzed via flow cytometry, NCAPH overexpression reversed the increased percentage of the cells in the G0/G1 phase and the decreased percentage of the cells in the S phase by knocking down OCT1 (Figure S9 and Figure 3H).

3. Discussion

In the present study, we demonstrated that positive OCT1 IR was associated with worse prognosis in ER-positive breast cancer patients. We also demonstrated that positive OCT1 IR was an independent predictive factor among other clinicopathological prognostic factors. As far as we know, this is the first report on the clinical value of OCT1 immunohistochemistry for breast cancer. We observed increased OCT1 expression in LTED cells. Considering that LTED cells are assumed as a refractory model for endocrine therapy with aromatase inhibitor, our clinical results suggest the possible involvement of OCT1 in the endocrine resistance that might occur in breast cancer.
As a transcription factor, OCT1, is reported to regulate various genes [8,9,10,11,12,13,14,15,16,17]. Here, we added novel target gene candidates including RRM2, CDCA3, NCAPH, CEP55, and KIF20A. Through an analysis using a public database, we showed that the high expression of these genes is associated with the poor prognosis of ER-positive breast cancer patients. It may be assumed that the induction of these genes mediates cancer promotive effects of OCT1 in breast cancer cells, which is further supported by previous reports on the functions of these genes [28,29,30,31], with the exception of NCAPH. Since information on the roles of NCAPH in breast cancer was limited, we further analyzed the clinical value of NCAPH. With immunohistochemical analysis, we demonstrated that positive NCAPH IR was associated with the poor prognosis of ER-positive breast cancer patients. We also revealed that positive NCAPH IR was an independent predictive factor among other clinicopathological prognostic factors. In this analysis, we observed a significant positive correlation between OCT1 IR and NCAPH IR, which was in line with NCAPH being an OCT1-induced gene.
We demonstrated that the knockdown of NCAPH suppressed the proliferation of breast cancer cells. The growth promoting effect of NCAPH was also reported in several other cancer cells [32,33,34,35,36]. NCAPH is one of the subunits of condensin I, which is responsible for the condensation and stabilization of chromosomes in the M phase of the cell cycle [24,25]. In fact, in colorectal cancer cells, the knockdown of NCAPH induced cell cycle arrest at the G2/M phase [33]. In contrast, our data suggest that NCAPH promotes the transition from the G1 to the S phase in breast cancer cells. This might indicate that NCAPH has novel functions in the nucleus during the interphase other than regulating mitosis in the M phase. In recent years, it has been reported that condensin I may be involved in gene regulation [37,38], which suggests that an unknown function of condensin I exists during interphase. Meanwhile, NCAPG, another subunit of condensin I, has been reported to regulate the G1 phase in gastric cancer [39,40], which may further support the novel function of condensin I in the interphase. We showed that OCT1 promotes the proliferation of breast cancer cells by inducing a cell cycle transition from the G1 phase to the S phase, which was a similar target of action to NCAPH. These observations could be consistent with the hypothesis that the growth promoting effect of OCT1 is mediated by its transcriptional induction of NCAPH.
Our data showing a higher expression level of NCAPH in LTED cells compared to MCF-7 cells may suggest that NCAPH is related to endocrine resistance in breast cancer. It was reported that OCT1 binds to the promoter region of ESR1 and up-regulates ERα in breast cancer cells [26,27], which implies that some of the OCT1 induced genes may be dependent on ERα expression. In the case of NCAPH, the induction of NCAPH by OCT1 would be independent from ERα expression since we showed NCAPH is not an estrogen responsive gene. Our results from the ChIP assay showed OCT1 binding in the NCAPH promoter region, which suggests that the expression of NCAPH could be directly regulated by OCT1. We could speculate that the high expression of NCAPH predicts poor prognosis for breast cancer patients because the expression of NCAPH was not suppressed by endocrine therapy. In the present study, we showed that the silencing OCT1 or NCAPH suppressed the proliferation of MCF-7 and LTED cells, which suggests that OCT1 and NCAPH could be potential targets for breast cancer therapy. Our data will provide clue for developing an effective strategy for patients with ER-positive breast cancer.

4. Materials and Methods

4.1. Collection of Human Tissue Samples and Clinical Data

Tissue samples of ER-positive invasive breast cancer were obtained form 108 Japanese female breast cancer patients who had undergone surgical resection from 2006 to 2013 at Toranomon Hospital, Tokyo, Japan. No patients received preoperative endocrine therapy, chemotherapy, or molecular target therapy. All patients received postoperative standard adjuvant therapy according to the clinical practice guidelines of the National Comprehensive Cancer Network (USA) [41]. The staging of all of the breast cancer cases was re-evaluated in 2018 according to the “TNM classification of Malignant Tumours” (8th Edition) [42]. The clinical outcome was evaluated by disease-free survival (DFS). DFS was determined as the time span from the date of surgery to the first recurrence or last follow-up. The mean follow-up duration was 99 months (range 19–139 months). Signed informed consent was obtained from all patients. This study was approved by the Ethics Committees of Toranomon Hospital (approval number: 845/1327, approval dates: 3 April 2017/22 June 2018) and the Tokyo Metropolitan Institute of Gerontology (approval number: J48, approval date: 23 January 2019). All procedures performed in this study were in accordance with the Declaration of Helsinki.

4.2. Antibodies

Rabbit monoclonal antibodies for estrogen receptor alpha (ERα) (clone: SP1), progesterone receptor (PgR) (clone: 1E2), and human epidermal growth factor receptor 2 (HER2) (clone: 4B5) were purchased from Roche (Basel, Switzerland). Mouse monoclonal anti-β-actin antibody (A2228) was obtained from Sigma-Aldrich (St. Louis, MO, USA). Rabbit polyclonal anti-OCT1 antibody (ab15112) was purchased from Abcam (Cambridge, MA, USA). Rabbit polyclonal anti-NCAPH antibody (11515-1-AP) was obtained from Proteintech (Chicago, IL, USA). Rabbit polyclonal anti-IgG antibody (#2729) was purchased from Cell Signaling Technology (Danvers, MA, USA)

4.3. Immunohistochemical Analysis

Immunohistochemical analysis of OCT1 and NCAPH expression was performed using an EnVision+ visualization kit (Dako, Carpinteria, CA, USA). The tissue sections (4 μm) were deparaffinized, rehydrated with a graded ethanol series, and rinsed in pure water. For antigen retrieval, the sections were pretreated by being heated in a water bath at 95 °C for 30 min in 20 mM Envision FLEX Target Retrieval Solution Low pH buffer (Dako). After blocking the endogenous peroxidase with 3% H2O2, the primary antibodies against OCT1 (1:1600 dilution) or NCAPH (1:200 dilution) were applied to the sections, and they were incubated overnight at 4 °C. The sections were rinsed in EnVision FLEX Wash Buffer (Dako) and were incubated with EnVision + Dual Link System-HRP (Dako) for 30 min at room temperature. The antigen-antibody complex was visualized using the Dako Liquid DAB + Substrate Chromogen System. For negative controls, normal rabbit IgG was used instead of primary antibodies. Immunostained slides were evaluated for intensity and proportion. Staining intensity was classified as none, weak, and strong. Staining proportion was measured by the percentage of stained tumor cells. The immunoreactivity (IR) of OCT1 was defined as “positive” when the nuclei of over 1/3 of the tumor cells were stained as strong [43]. The IR of NCAPH was defined as “positive” when the nuclei of more than 1% of the tumor cells were stained as strong [44]. Two pathologists (T.O. and K.K.) evaluated the slides, and in case of disagreement between the two pathologists, a third pathologist (J.S.) evaluated the IR.
Immunostaining of ER, PgR, and HER2 was performed automatically using VENTANA BenchMark GX (Roche). ER and PgR status were judged as positive when nuclear staining of more than 1% of the tumor cells was observed according to the guidelines of the American Society of Clinical Oncology/College of American Pathologists (ASCO/CAP) [45]. HER2 status was judged based on the updated guidelines from ASCO/CAP [46].

4.4. Cell Culture

Human breast cancer cell line MCF-7 was obtained from American Type Culture Collection (Manassas, VA, USA). The HEK293 cell line was obtained from Clontech (Palo Alto, CA, USA). Short tandem repeat-based authentication of the cell line was verified by BEX Co., Ltd. (Tokyo, Japan). Long-term estrogen-deprived (LTED) cells were established through the long-term (>4 months) culturing MCF-7 cells without estrogen [47]. MCF-7 cells and HEK293 cells were cultured in Dulbecco’s modified Eagle’s medium (DMEM) supplemented with 10% fetal bovine serum (FBS) and 1% penicillin-streptomycin (Nacalai Tesque, Kyoto, Japan) at 37 °C with 5% CO2. LTED cells and estrogen-treated cells were cultured in phenol red-free DMEM containing 5% charcoal-stripped FBS and 1% penicillin-streptomycin at 37 °C with 5% CO2. DMEM was purchased from Nacalai Tesque. Estradiol (E2) was purchased from Sigma-Aldrich.

4.5. Quantitative Reverse Transcription Polymerase Chain Reaction (qRT-PCR) Analysis

Total RNA extraction was performed using Sepasol-RNA I super G (Nacalai Tesque) according to the manufacturer’s protocols and was followed by cDNA synthesis using PrimeScript (Takara, Kyoto, Japan). The cDNA was subjected to qRT-PCR using Applied Biosystems StepOnePlus (Thermo Fisher Scientific, Waltham, MA, USA) based on the detection of SYBR Green fluorescence (Kapa Biosystems, Wilmington, MA, USA). mRNA expression levels were normalized with GAPDH using the 2-ΔΔCt method [48]. The sequences of the primers were as follows:
GAPDH forward: 5′-TCTAGTAAAGTGGATATTGTTG-3′;
GAPDH reverse: 5′-GATGGTGATGGGATTTCC-3′;
OCT1 forward: 5′-GATGGCACCCTCACAGTTTG-3′;
OCT1 reverse: 5′-GCTCATTAGAGCTGGGCTGA-3′;
NCAPH forward: 5′-CTGATGGAAGTGCTACTGAAATGG-3′;
NCAPH reverse: 5′-TCTGAAACATGGGATCAATCTCAC-3′;
GREB1 forward: 5′-GCTGTCGGAGTTTATTGAATCCAC-3′;
GREB1 reverse: 5′-GCACGAGAACAAAGGTCCTG-3′.

4.6. Western Blot Analysis

Whole-cell lysates were prepared using lysis buffer containing 50 mM 4-(2-hydoroxyethyl)-1-piperazinly ethane-2-suffonic acid (HEPES), 150 mM NaCl, 10% glycerol, 1% Triton X-100, 1.5 mM MgCl2, and 1 mM ethylene glycol-bis(β-aminoethyl ether)-N,N,N’,N’-tetraacetic acid (EGTA). A proteinase inhibitor cocktail (Nacalai Tesque) was added before use. The protein concentration was determined using a Peirce BCA Protein Assay (Thermo Fisher Scientific). Cell lysates were separated on 10% sodium dodecyl sulfate polyacrylamide gel electrophoresis (SDS-PAGE) and were then transferred to polyvinylidene difluoride (PVDF) membranes (Millipore, Bedford, MA, USA). The membranes were blocked in Bullet Blocking One (Nacalai Tesque) for 5 min and were incubated with the primary antibodies followed by incubation with horseradish peroxidase (HRP)-conjugated secondary antibody (GE Healthcare, Buckinghamshire, UK). The bound antibodies were visualized using Chemi-Lumi One Ultra (Nacalai Tesque).

4.7. Small Interfering RNA Transfection

The knocking down the expression of OCT1 and NCAPH was conducted with small interfering RNA (siRNA) (10 nM) by a reverse transfection method using Lipofectamine RNAiMAX (Invitrogen, St. Louis, MO, USA) 48 h before harvesting the cells according to the manufacture’s protocols, unless otherwise indicated. Two specific siRNAs targeting OCT1 (siOCT1 #1 and siOCT1 #2), two specific siRNAs targeting NCAPH (siNCAPH #1 and siNCAPH #2), and one negative control siRNA targeting firefly luciferase (siControl) were purchased from Sigma-Aldrich. The sequences of the siRNAs were as follows: siOCT1 #1: 5′-GUGAAGGCUAGGUGAGUAAGC-3′; siOCT1 #2: 5′-GUGCUAGAUAGGUUUAUAAGU-3′; siNCAPH #1: 5′-UUUUUGAGCAUUCUAUAUACA-3′; siNCAPH #2: AAAUAACAGAUCAAUUUAGGA; siControl: 5′-GUGGAUUUCGAGUCGUCUUAA-3′.

4.8. Plasmid Construction and Transfection

We used the same OCT1 cDNA that we have used previously [8]. In brief, OCT1 cDNA was subcloned into mammalian expression plasmid pcDNA3.0 (Invitrogen), which was modified to generate the N-terminally flag-tagged protein. Expression vector encoding NCAPH was generated from the cDNA clone purchased from Promega (Madison, WI, USA). C-terminally flag-tagged NCAPH cDNA was amplified by polymerase chain reaction (PCR) with the following specific primers: NCAPH forward: 5′- CGGGATCCGCCACCATGGGACCTCCCGGCCCAG-3′; NCAPH-reverse: 5′- GCTCTAGATCACTTGTCATCGTCGTCCTTGTAGTCATCTCCTTGCCTCACAAGAACATC-3′. The generated amplicon was then subcloned into pcDNA3. The transfection of the expression vectors containing flag-tagged OCT1 or NACPH cDNA and empty vector alone was performed after 24 h using FuGENE HD (Promega), according to the manufacturer’s protocols. To establish stable transfectants, MCF-7 clones were selected using G418 (Nacalai Tesque) at a concentration of 600 μg/mL.

4.9. Cell Proliferation Assay

The cells were seeded at concentrations of 3.0 × 10⁴ cells/well (MCF-7) or 5.0 × 10⁴ cells/well (LTED), with indicated the siRNAs in a reverse transfection method in 96-well plates. Two kinds of clones stably expressing OCT1 (OCT1-OE #1 and #2) and cells transfected with empty vector (Vector) were seeded at the concentration of 2.0 × 10⁴ cells/well in 96-well plates. Cells were harvested on the 1st and 4th days, lysed with freeze-and-thaw, and buffered with 10 mM Tris-HCl, pH7.4, containing 100 mM NaCl and 1 mM EDTA. Extracted DNA was stained with Hoechst 33342 (Dojindo, Tokyo, Japan) at a final concentration of 20 μg/mL. The measurement of the DNA content in each well was performed using VICTOR Nivo (Perkin Elmer, Waltham, MA, USA). The wavelength of excitation was 355 nm, and the emission wavelength was 460 nm. Cell viability was evaluated by means of MTS assay after culturing the cells for the indicated duration using The Cell Titer 96 Aqueous One Solution Cell Proliferation Assay (Promega) according to the manufacturer’s instructions.

4.10. Flow Cytometric Analysis

The cells were harvested and fixed with 70% ethanol at −30 °C overnight. Fixed cells were treated with RNase A (Takara) and were stained with 50 μg/mL propidium iodide (PI) (Sigma-Aldrich). The cells were analyzed by means of a BD LSRFortessa (Becton Dickinson, Franklin Lakes, NJ, USA). The proportion of cells in the G0/G1, S, and G2/M phases of the cell cycle was evaluated using FlowJo software (Becton Dickinson).

4.11. Microarray Analysis

Total RNAs from MCF-7 cells transfected by a reverse transfection method with siRNAs (siControl, siOCT1 #1 and siOCT1 #2) were extracted by using Sepasol-RNA I super G (Nacalai Tesque) 48 h after the transfection of the siRNAs. For the gene expression microarray, the Clariom S Assay, human (Thermo Fisher Scientific) was used according to the manufacturer’s protocols. Data analysis was performed using Transcriptome Analysis Console (TAC) 4.0 Software. Data were deposited at Gene Expression Omnibus [49] as GEO accession number GSE179241.

4.12. ChIP Assay

ChIP and qRT-PCR were performed as previously described [10]. Briefly, for immunoprecipitation by the anti-OCT1 antibody, chromatin from crosslinked MCF-7 cells was sonicated and incubated with anti-OCT1 antibody or normal rabbit IgG at 4 °C overnight. The mixture was then incubated with protein G-Sepharose beads (GE Healthcare) at 4 °C for 2 h and were washed with radio-immunoprecipitation assay (RIPA) buffer, lithium buffer, and tris-EDTA (TE) buffer. The cross-linked DNA-protein complex was reversed through incubation at 65 °C overnight. Immunoprecipitated DNA was ethanol precipitated. The fold enrichment relative to the IgG control was measured by performing qPCR. The primer sequences for quantifying rgw OCT1-binding regions were as follows:
NCAPH promoter forward: 5′-CCCAAGAAGCCCAATCAGAC-3′;
NCAPH promoter reverse: 5′-CTTTCCTTGGCGTCTCCTG-3′;
Negative control forward: 5′-ACTGGTTAATGTGGTGACTGG-3′;
Negative control reverse: 5′-GGGTGAGGTATGGGCTAGAG-3′.

4.13. Statistical Analysis

SPSS Statics version 25 (IBM, Armonk, NY, USA) was used for all statistical analyses. Chi-square tests were used to evaluate the relationship between the immunoreactivity of the target protein and clinicopathological parameters. Disease-free survival was assessed using Kaplan–Meier curves, and statistical significance was calculated using the log-rank test. Univariate and multivariate analyses were evaluated using the Cox proportional hazard model. The statistical analyses of the qRT-PCR and proliferation assay were performed using Student’s t-test or one-way ANOVA followed by Dunnett’s test as a post hoc analysis. The p-value was based on the two-sided statistical analysis, and a value of p < 0.05 was considered to indicate a statistically significant difference.

Supplementary Materials

The following are available online at https://0-www-mdpi-com.brum.beds.ac.uk/article/10.3390/ijms222111505/s1, Table S1: Sixteen genes commonly regulated by siOCT1 #1 and siOCT1 #2 in MCF-7 cells, Figure S1: Specificity of anti-OCT1 antibody, Figure S2: Analysis of OCT1 expression using public database, Figure S3: OCT1 expression in breast cancer cells, Figure S4: OCT1 promotes cell proliferation and induces the cell cycle transition from G1 phase to S phase, Figure S5: Kaplan–Meier survival analysis of breast cancer patients for candidate OCT1-target genes identified in the present study, Figure S6: Specificity of anti-NCAPH antibody, Figure S7: NCAPH expression in breast cancer cells, Figure S8: Knockdown of NCAPH inhibited the cell cycle transition from G1 phase to S phase, Figure S9: Overexpression of NCAPH rescued the suppressed cell cycle transition from G1 phase to S phase by siOCT1.

Author Contributions

Conceptualization, T.O., K.A. and S.I.; investigation, T.O., J.S. and K.K.; resources, H.K. and K.-I.T.; data curation, T.O., K.A. and T.T.; writing—original draft preparation, T.O. and K.A.; writing—review and editing, J.S., K.K., K.-I.T., T.T., H.K. and S.I.; funding acquisition, S.I., K.A., J.S. and H.K. All authors have read and agreed to the published version of the manuscript.

Funding

This study was supported by grants from the P-CREATE (S.I.) from the Ministry of Education, Culture, Sports, Science, and Technology (MEXT), Japan; by Grants-in-Aid for S.I. (20K21667 and 21H04829) and K.A. (17K10571 and 20K08954) from the Japan Society for the Promotion of Science (JSPS), Japan; by a grant from Uehara Memorial Foundation (S.I.); by a grant from Yamaguchi Endocrine Research Foundation (K.A.); by a grant from Kao Health Science Foundation (K.A.); and by grants from the Okinaka Memorial Institute for Medical Research (H.K. and J.S.).

Institutional Review Board Statement

The study was conducted according to the guidelines of the Declaration of Helsinki and was approved by the Ethics Committee of Toranomon Hospital (approval number: 845/1327, approval dates: 3 April 2017/22 June 2018) and the Tokyo Metropolitan Institute of Gerontology (approval number: J48, approval date: 23 January 2019).

Informed Consent Statement

Signed informed consent was obtained from all subjects involved in the study.

Data Availability Statement

The microarray data were deposited at Gene Expression Omnibus [49] as GEO accession number GSE179241.

Acknowledgments

We thank H. Asahara for the critical discussions. We also thank K. Sato for the technical advice.

Conflicts of Interest

The authors declare no conflict of interest. The funders had no role in the design of the study; in the collection, analyses, or interpretation of data; in the writing of the manuscript; or in the decision to publish the results.

References

  1. Sung, H.; Ferlay, J.; Siegel, R.L.; Laversanne, M.; Soerjomataram, I.; Jemal, A.; Bray, F. Global Cancer Statistics 2020: GLOBOCAN Estimates of Incidence and Mortality Worldwide for 36 Cancers in 185 Countries. CA Cancer J. Clin. 2021, 71, 209–249. [Google Scholar] [CrossRef] [PubMed]
  2. Heer, E.; Harper, A.; Escandor, N.; Sung, H.; McCormack, V.; Fidler-Benaoudia, M.M. Global burden and trends in premenopausal and postmenopausal breast cancer: A population-based study. Lancet Glob. Health 2020, 8, e1027–e1037. [Google Scholar] [CrossRef]
  3. Acheampong, T.; Kehm, R.D.; Terry, M.B.; Argov, E.L.; Tehranifar, P. Incidence Trends of Breast Cancer Molecular Subtypes by Age and Race/Ethnicity in the US From 2010 to 2016. JAMA Netw. Open 2020, 3, e2013226. [Google Scholar] [CrossRef] [PubMed]
  4. Emens, L.A. Breast Cancer Immunotherapy: Facts and Hopes. Clin. Cancer Res. 2017, 24, 511–520. [Google Scholar] [CrossRef] [Green Version]
  5. Saji, S.; Kimura-Tsuchiya, R. Combination of molecular-targeted drugs with endocrine therapy for hormone-resistant breast cancer. Int. J. Clin. Oncol. 2015, 20, 268–272. [Google Scholar] [CrossRef]
  6. Clarke, R.; Tyson, J.J.; Dixon, J.M. Endocrine resistance in breast cancer—An overview and update. Mol. Cell. Endocrinol. 2015, 418, 220–234. [Google Scholar] [CrossRef] [Green Version]
  7. Sturm, R.A.; Das, G.; Herr, W. The ubiquitous octamer-binding protein Oct-1 contains a POU domain with a homeo box subdomain. Genes Dev. 1988, 2, 1582–1599. [Google Scholar] [CrossRef] [PubMed]
  8. Obinata, D.; Takayama, K.; Fujiwara, K.; Suzuki, T.; Tsutsumi, S.; Fukuda, N.; Nagase, H.; Fujimura, T.; Urano, T.; Homma, Y.; et al. Targeting Oct1 genomic function inhibits androgen receptor signaling and castration-resistant prostate cancer growth. Oncogene 2016, 35, 6350–6358. [Google Scholar] [CrossRef] [PubMed]
  9. Yamamoto, S.; Takayama, K.; Obinata, D.; Fujiwara, K.; Ashikari, D.; Takahashi, S.; Inoue, S. Identification of new octamer transcription factor 1-target genes upregulated in castration-resistant prostate cancer. Cancer Sci. 2019, 110, 3476–3485. [Google Scholar] [CrossRef] [PubMed] [Green Version]
  10. Takayama, K.-I.; Suzuki, Y.; Yamamoto, S.; Obinata, D.; Takahashi, S.; Inoue, S. Integrative Genomic Analysis of OCT1 Reveals Coordinated Regulation of Androgen Receptor in Advanced Prostate Cancer. Endocrinology 2019, 160, 463–472. [Google Scholar] [CrossRef]
  11. Boulon, S.; Dantonel, J.-C.; Binet, V.; Vié, A.; Blanchard, J.-M.; Hipskind, R.A.; Philips, A. Oct-1 Potentiates CREB-Driven Cyclin D1 Promoter Activation via a Phospho-CREB- and CREB Binding Protein-Independent Mechanism. Mol. Cell Biol. 2002, 22, 7769–7779. [Google Scholar] [CrossRef] [Green Version]
  12. Dalvai, M.; Schubart, K.; Besson, A.; Matthias, P. Oct1 is required for mTOR-induced G1cell cycle arrest via the control of p27Kip1expression. Cell Cycle 2010, 9, 3933–3944. [Google Scholar] [CrossRef] [Green Version]
  13. Fan, W.; Jin, S.; Tong, T.; Zhao, H.; Fan, F.; Antinore, M.J.; Rajasekaran, B.; Wu, M.; Zhan, Q. BRCA1 Regulates GADD45 through Its Interactions with the OCT-1 and CAAT Motifs. J. Biol. Chem. 2002, 277, 8061–8067. [Google Scholar] [CrossRef] [PubMed] [Green Version]
  14. Kang, H.-B.; Fan, J.; Lin, R.; Elf, S.; Ji, Q.; Zhao, L.; Jin, L.; Seo, J.H.; Shan, C.; Arbiser, J.L.; et al. Metabolic Rewiring by Oncogenic BRAF V600E Links Ketogenesis Pathway to BRAF-MEK1 Signaling. Mol. Cell 2015, 59, 345–358. [Google Scholar] [CrossRef] [Green Version]
  15. Maddox, J.; Shakya, A.; South, S.; Shelton, D.; Andersen, J.N.; Chidester, S.; Kang, J.; Gligorich, K.M.; Jones, D.A.; Spangrude, G.J.; et al. Transcription Factor Oct1 Is a Somatic and Cancer Stem Cell Determinant. PLoS Genet. 2012, 8, e1003048. [Google Scholar] [CrossRef]
  16. Sharpe, D.J.; Orr, K.S.; Moran, M.; White, S.J.; McQuaid, S.; Lappin, T.R.; Thompson, A.; James, J.A. POU2F1 activity regulates HOXD10 and HOXD11 promoting a proliferative and invasive phenotype in Head and Neck cancer. Oncotarget 2014, 5, 8803–8815. [Google Scholar] [CrossRef] [PubMed] [Green Version]
  17. Hwang-Verslues, W.W.; Chang, P.-H.; Jeng, Y.-M.; Kuo, W.-H.; Chiang, P.-H.; Chang, Y.-C.; Hsieh, T.-H.; Su, F.-Y.; Lin, L.-C.; Abbondante, S.; et al. Loss of corepressor PER2 under hypoxia up-regulates OCT1-mediated EMT gene expression and enhances tumor malignancy. Proc. Natl. Acad. Sci. USA 2013, 110, 12331–12336. [Google Scholar] [CrossRef] [Green Version]
  18. Obinata, D.; Takayama, K.-I.; Urano, T.; Murata, T.; Kumagai, J.; Fujimura, T.; Ikeda, K.; Horie-Inoue, K.; Homma, Y.; Ouchi, Y.; et al. Oct1 regulates cell growth of LNCaP cells and is a prognostic factor for prostate cancer. Int. J. Cancer 2011, 130, 1021–1028. [Google Scholar] [CrossRef] [PubMed]
  19. Qian, J.; Kong, X.; Deng, N.; Tan, P.; Chen, H.; Wang, J.; Li, Z.; Hu, Y.; Zou, W.; Xu, J.; et al. OCT1 is a determinant of synbindin-related ERK signalling with independent prognostic significance in gastric cancer. Gut 2014, 64, 37–48. [Google Scholar] [CrossRef] [PubMed] [Green Version]
  20. Wang, Y.-P.; Song, G.-H.; Chen, J.; Xiao, C.; Li, C.; Zhong, L.; Sun, X.; Wang, Z.-W.; Deng, G.-L.; Yu, F.-D.; et al. Elevated OCT1 participates in colon tumorigenesis and independently predicts poor prognoses of colorectal cancer patients. Tumor Biol. 2015, 37, 3247–3255. [Google Scholar] [CrossRef] [PubMed] [Green Version]
  21. Zhong, Y.; Huang, H.; Chen, M.; Huang, J.; Wu, Q.; Yan, G.-R.; Chen, D. POU2F1 over-expression correlates with poor prognoses and promotes cell growth and epithelial-to-mesenchymal transition in hepatocellular carcinoma. Oncotarget 2017, 8, 44082–44095. [Google Scholar] [CrossRef]
  22. Györffy, B.; Lanczky, A.; Eklund, A.C.; Denkert, C.; Budczies, J.; Li, Q.; Szallasi, Z. An online survival analysis tool to rapidly assess the effect of 22,277 genes on breast cancer prognosis using microarray data of 1809 patients. Breast Cancer Res. Treat. 2009, 123, 725–731. [Google Scholar] [CrossRef] [Green Version]
  23. Rhodes, D.R.; Yu, J.; Shanker, K.; Deshpande, N.; Varambally, R.; Ghosh, D.; Barrette, T.; Pander, A.; Chinnaiyan, A.M. ONCOMINE: A Cancer Microarray Database and Integrated Data-Mining Platform. Neoplasia 2004, 6, 1–6. [Google Scholar] [CrossRef] [Green Version]
  24. Hirano, T. Condensins: Universal organizers of chromosomes with diverse functions. Genes Dev. 2012, 26, 1659–1678. [Google Scholar] [CrossRef] [PubMed] [Green Version]
  25. Schleiffer, A.; Kaitna, S.; Maurer-Stroh, S.; Glotzer, M.; Nasmyth, K.; Eisenhaber, F. Kleisins: A Superfamily of Bacterial and Eukaryotic SMC Protein Partners. Mol. Cell 2003, 11, 571–575. [Google Scholar] [CrossRef]
  26. Hosey, A.M.; Gorski, J.J.; Murray, M.M.; Quinn, J.E.; Chung, W.Y.; Stewart, G.E.; James, C.R.; Farragher, S.M.; Mulligan, J.M.; Scott, A.N.; et al. Molecular Basis for Estrogen Receptor Deficiency in BRCA1-Linked Breast Cancer. J. Natl. Cancer Inst. 2007, 99, 1683–1694. [Google Scholar] [CrossRef] [PubMed] [Green Version]
  27. Harte, M.T.; O’Brien, G.J.; Ryan, N.M.; Gorski, J.J.; Savage, K.; Crawford, N.T.; Mullan, P.B.; Harkin, D.P. BRD7, a Subunit of SWI/SNF Complexes, Binds Directly to BRCA1 and Regulates BRCA1-Dependent Transcription. Cancer Res. 2010, 70, 2538–2547. [Google Scholar] [CrossRef] [Green Version]
  28. Wang, Y.; Jin, T.; Dai, X.; Xu, J. Lentivirus-mediated knockdown of CEP55 suppresses cell proliferation of breast cancer cells. Biosci. Trends 2016, 10, 67–73. [Google Scholar] [CrossRef] [Green Version]
  29. Shah, K.; Wilson, E.A.; Malla, R.; Elford, H.L.; Faridi, J.S. Targeting Ribonucleotide Reductase M2 and NF-κB Activation with Didox to Circumvent Tamoxifen Resistance in Breast Cancer. Mol. Cancer Ther. 2015, 14, 2411–2421. [Google Scholar] [CrossRef] [Green Version]
  30. Nakamura, M.; Takano, A.; Thang, P.M.; Tsevegjav, B.; Zhu, M.; Yokose, T.; Yamashita, T.; Miyagi, Y.; Daigo, Y. Characterization of KIF20A as a prognostic biomarker and therapeutic target for different subtypes of breast cancer. Int. J. Oncol. 2020, 57, 277–288. [Google Scholar] [CrossRef] [PubMed]
  31. Phan, N.N.; Wang, C.-Y.; Li, K.-L.; Chen, C.-F.; Chiao, C.-C.; Yu, H.-G.; Huang, P.-L.; Lin, Y.-C. Distinct expression of CDCA3, CDCA5, and CDCA8 leads to shorter relapse free survival in breast cancer patient. Oncotarget 2018, 9, 6977–6992. [Google Scholar] [CrossRef] [PubMed]
  32. Sun, C.; Huang, S.; Wang, H.; Xie, R.; Zhang, L.; Zhou, Q.; He, X.; Ju, W. Non-SMC condensin I complex subunit H enhances proliferation, migration, and invasion of hepatocellular carcinoma. Mol. Carcinog. 2019, 58, 2266–2275. [Google Scholar] [CrossRef]
  33. Yin, L.; Jiang, L.-P.; Shen, Q.-S.; Xiong, Q.-X.; Zhuo, X.; Zhang, L.-L.; Yu, H.-J.; Guo, X.; Luo, Y.; Dong, J.; et al. NCAPH plays important roles in human colon cancer. Cell Death Dis. 2017, 8, e2680. [Google Scholar] [CrossRef] [PubMed] [Green Version]
  34. Wang, M.; Qiao, X.; Cooper, T.; Pan, W.; Liu, L.; Hayball, J.; Lin, J.; Cui, X.; Zhou, Y.; Zhang, S.; et al. HPV E7-mediated NCAPH ectopic expression regulates the carcinogenesis of cervical carcinoma via PI3K/AKT/SGK pathway. Cell Death Dis. 2020, 11, 1049. [Google Scholar] [CrossRef]
  35. Kim, B.; Kim, S.W.; Lim, J.-Y.; Park, S.-J. NCAPH Is Required for Proliferation, Migration and Invasion of Non-small-cell Lung Cancer Cells. Anticancer. Res. 2020, 40, 3239–3246. [Google Scholar] [CrossRef]
  36. Shimomura, H.; Sasahira, T.; Nakashima, C.; Kurihara-Shimomura, M.; Kirita, T. Non-SMC Condensin I Complex Subunit H (NCAPH) Is Associated with Lymphangiogenesis and Drug Resistance in Oral Squamous Cell Carcinoma. J. Clin. Med. 2019, 9, 72. [Google Scholar] [CrossRef] [Green Version]
  37. Zhang, T.; Paulson, J.R.; Bakhrebah, M.; Kim, J.H.; Nowell, C.; Kalitsis, P.; Hudson, D.F. Condensin I and II behaviour in interphase nuclei and cells undergoing premature chromosome condensation. Chromosom. Res. 2016, 24, 243–269. [Google Scholar] [CrossRef] [PubMed]
  38. Wang, H.; Liu, X.; Li, G. Explore a novel function of human condensins in cellular senescence. Cell Biosci. 2020, 10, 147. [Google Scholar] [CrossRef]
  39. Sun, D.-P.; Lin, C.-C.; Hung, S.-T.; Kuang, Y.-Y.; Hseu, Y.-C.; Fang, C.-L.; Lin, K.-Y. Aberrant Expression of NCAPG is Associated with Prognosis and Progression of Gastric Cancer. Cancer Manag. Res. 2020, 12, 7837–7846. [Google Scholar] [CrossRef] [PubMed]
  40. Zhang, X.; Wang, H.; Han, Y.; Zhu, M.; Song, Z.; Zhan, D.; Jia, J. NCAPG Induces Cell Proliferation in Cardia Adenocarcinoma via PI3K/AKT Signaling Pathway. OncoTargets Ther. 2020, 13, 11315–11326. [Google Scholar] [CrossRef] [PubMed]
  41. NCCN Clinical Practice Guidelines in Oncology Breast Cancer, Version 8. 2021. Available online: https://www.nccn.org/professionals/physician_gls/PDF/breast.pdf (accessed on 22 September 2021).
  42. Brierley, J.D.; Gospodarowicz, M.K.; Wittekind, C. (Eds.) TNM Classification of Malignant Tumours, 8th ed.; John Wiley & Sons: Hoboken, NJ, USA, 2017. [Google Scholar]
  43. Kawabata, H.; Azuma, K.; Ikeda, K.; Sugitani, I.; Kinowaki, K.; Fujii, T.; Osaki, A.; Saeki, T.; Horie-Inoue, K.; Inoue, S. TRIM44 Is a Poor Prognostic Factor for Breast Cancer Patients as a Modulator of NF-κB Signaling. Int. J. Mol. Sci. 2017, 18, 1931. [Google Scholar] [CrossRef] [Green Version]
  44. Yamashita, H.; Ando, Y.; Nishio, M.; Zhang, Z.; Hamaguchi, M.; Mita, K.; Kobayashi, S.; Fuji, Y.; Iwase, H. Immunohistochemical evaluation of hormone receptor status for predicting response to endocrine therapy in metastatic breast cancer. Breast Cancer 2006, 13, 74–83. [Google Scholar] [CrossRef]
  45. Hammond, M.E.H.; Hayes, D.F.; Dowsett, M.; Allred, D.C.; Hagerty, K.L.; Badve, S.; Fitzgibbons, P.L.; Francis, G.; Goldstein, N.S.; Hayes, M.; et al. American Society of Clinical Oncology/College of American Pathologists Guideline Recommendations for Immunohistochemical Testing of Estrogen and Progesterone Receptors in Breast Cancer. J. Clin. Oncol. 2010, 28, 2784–2795. [Google Scholar] [CrossRef] [PubMed] [Green Version]
  46. Wolff, A.; Hammond, M.E.H.; Hicks, D.G.; Dowsett, M.; McShane, L.M.; Allison, K.H.; Allred, D.C.; Bartlett, J.M.; Bilous, M.; Fitzgibbons, P.; et al. Recommendations for Human Epidermal Growth Factor Receptor 2 Testing in Breast Cancer: American Society of Clinical Oncology/College of American Pathologists Clinical Practice Guideline Update. J. Clin. Oncol. 2013, 31, 3997–4013. [Google Scholar] [CrossRef]
  47. Ikeda, K.; Horie-Inoue, K.; Ueno, T.; Suzuki, T.; Sato, W.; Shigekawa, T.; Osaki, A.; Saeki, T.; Berezikov, E.; Mano, H.; et al. miR-378a-3p modulates tamoxifen sensitivity in breast cancer MCF-7 cells through targeting GOLT1A. Sci. Rep. 2015, 5, 13170. [Google Scholar] [CrossRef]
  48. Livak, K.J.; Schmittgen, T.D. Analysis of Relative Gene Expression Data Using Real-Time Quantitative PCR and the 2−ΔΔCT Method. Methods 2001, 25, 402–408. [Google Scholar] [CrossRef] [PubMed]
  49. Gene Expression Omnibus. Available online: https://0-www-ncbi-nlm-nih-gov.brum.beds.ac.uk/geo/ (accessed on 25 October 2021).
Figure 1. OCT1 was a poor prognostic factor in ER-positive breast cancer patients. (A) Representative micrographs of breast cancer tissues stained with OCT1 antibody. Strong immunoreactivity (IR) was defined as positive IR, whereas weak IR or no IR was defined as negative IR. A breast cancer tissue was applied to non-specific rabbit IgG antibody as a negative control. The scale bars represent 10 μm. (B) Disease-free survival of breast cancer patients with positive or negative OCT1 IR is shown by the Kaplan-Meier method. p-value was determined by the log-rank test. The red line represents cases with positive OCT1 IR (n = 48), and the blue line represents negative OCT1 IR (n = 60). (C) Western blot analysis for OCT1 expression in MCF-7 cells and LTED cells. β-actin protein was blotted as a loading control. IB, immunoblot. (D) Western blot analysis for OCT1 expression in MCF-7 cells and LTED cells treated with two kinds of siRNAs for OCT1 (siOCT1 #1 or #2) or siControl (siCont.). β-actin protein was blotted as a loading control. (E) DNA content of MCF-7 and LTED cells on indicated days after transfection of indicated siRNAs analyzed by Hoechst 33342 staining. Relative fluorescence intensity (FI) was shown as mean and SEM (n = 4). *** p < 0.001 compared to cells treated with siControl. (F) Western blot analysis for OCT1 expression in two clones of MCF-7 cells stably expressing OCT1 (OCT1-OE #1 and #2) and an MCF-7 clone transfected with empty vector (Vector). β-actin protein was blotted as a loading control. (G) DNA content of the OCT1-OE clones (#1 and #2) and the vector clone (Vector) on indicated days after seeding was analyzed by Hoechst 33342 staining. Relative fluorescence intensity (FI) was shown as mean and SEM (n = 4). *** p < 0.001 compared to the vector clone. (H) Proportions of cell populations in G0/G1, S, and G2/M phases of the cell cycle in MCF-7 and LTED cells transfected with indicated siRNAs. The results of flow cytometric analysis shown in Figure S4B were quantified. (I) Proportions of cell populations in G0/G1, S, and G2/M phases of the cell cycle in the OCT1-OE clones (#1 and #2) and the vector clone (Vector). The results of flow cytometric analysis shown in Figure S4C were quantified.
Ijms 22 11505 g001
Figure 2. NCAPH was one of the OCT1-regulated genes in MCF-7 cells. (A) The results of microarray analyses were summarized. Genes downregulated with a fold change ≥8 by silencing OCT1 with siOCT1 #1 (blue oval) or with siOCT1 #2 (red oval) compared to treatment with siControl are shown. The digits indicate the number of genes. Sixteen genes were downregulated in common. (B) Western blot analysis for NCAPH and OCT1 expressions in MCF-7 cells and LTED cells treated with two kinds of siRNAs for OCT1 (siOCT1 #1 or #2) or siControl (siCont.). β-actin protein was blotted as a loading control. IB, immunoblot. (C) Western blot analysis for NCAPH and OCT1 expressions in two clones of MCF-7 cells stably expressing OCT1 (OCT1-OE #1 and #2) and an MCF-7 clone transfected with empty vector (Vector). β-actin protein was blotted as a loading control. (D) Schema of NCAPH promoter region. A putative octamer consensus sequence (ATTTAAAA) exists at 26 base pairs upstream from the translation initiation site (ATG) of NCAPH gene. (E) Association of OCT1 in the promoter region of NCAPH in MCF-7 cells. ChIP assay for OCT1 or normal rabbit IgG was performed. The fold enrichments relative to IgG in NCAPH promoter and another locus in NCAPH (negative control) were measured by performing quantitative PCR (qPCR). Relative fold enrichment was shown as mean and SEM (n = 3). * p < 0.05.
Ijms 22 11505 g002
Figure 3. NCAPH was a poor prognostic factor in ER-positive breast cancer patients. (A) Representative micrographs of breast cancer tissues stained with NCAPH antibody. Strong immunoreactivity (IR) was defined as positive IR, whereas weak IR or no IR was defined as negative IR. One breast cancer tissue was applied with non-specific rabbit IgG antibody as a negative control. The scale bars represent 10 μm. (B) Disease-free survival of breast cancer patients with positive or negative NCAPH IR is shown by the Kaplan-Meier method. p-value was determined by the log-rank test. The red line represents cases with positive OCT1 IR (n = 63), and the blue line represents negative NCAPH IR (n = 45). (C) Western blot analysis for NCAPH expression in MCF-7 cells and LTED cells. β-actin protein was blotted as a loading control. IB, immunoblot. (D) Western blot analysis for NCAPH expression in MCF-7 cells and LTED cells treated with two kinds of siRNAs for NCAPH (siNCAPH #1 or #2) or siControl (siCont.). β-actin protein was blotted as a loading control. (E) DNA content of MCF-7 and LTED cells on indicated days after transfection of indicated siRNAs analyzed by Hoechst 33342 staining. Relative fluorescence intensity (FI) was shown as mean and SEM (n = 4). *** p < 0.001 compared to cells treated with siControl. (F) Proportions of cell populations in G0/G1, S and G2/M phase of cell cycle in MCF-7 and LTED cells transfected with indicated siRNAs. The results of flow cytometric analysis shown in Figure S8 were quantified. (G) DNA content of MCF-7 cells treated with indicated siRNAs and expression vectors on indicated days after transfection of siRNAs was analyzed by Hoechst 33342 staining. On the day 0, transfection with siRNAs (siControl or siOCT1 #1) was performed. On the first day (Day1), transfection with expression vector encoding NCAPH (NCAPH) or empty vector (Vector) was performed. Relative fluorescence intensity (FI) was shown as mean and SEM (n = 4). * p < 0.05, *** p < 0.001. (H) Proportions of cell populations in G0/G1, S and G2/M phase of cell cycle in MCF-7 cells transfected with indicated siRNAs and expression vectors. The results of the flow cytometric analysis shown in Figure S9 were quantified.
Ijms 22 11505 g003
Table 1. Relationship between OCT1 immunoreactivity and clinicopathological parameters in ER-positive breast cancer patients.
OCT1 Statusp-Value
Positive IR
(n = 48)
Negative IR
(n = 60)
Age≤50 years old26270.344
>50 years old2233
StageI17250.508
II, III3135
Invasive tumor size≤20 mm26340.795
>20 mm2226
Lymph node statusPositive21220.455
Negative2738
Nuclear grade124360.299
2, 32424
PgR statusPositive40520.628
Negative88
HER2 statusPositive680.898
Negative4252
Abbreviations: ER, estrogen receptor; HER2, human epidermal growth factor receptor 2; IR, immunoreactivity; PgR, progesterone receptor.
Table 2. Univariate and multivariate analyses of disease-free survival with clinicopathological parameters including OCT1 immunoreactivity in ER-positive breast cancer patients.
VariablesUnivariateMultivariate
p-ValueHazard Ratio95% CIp-Value
Age (≤50 vs. >50 years old)0.186
Invasivetumor size (≤20 vs. >20 mm)0.0122.390.99–5.750.052
Lymph node status (+ vs. −)0.0142.090.89–4.910.091
Nuclear grade (1 vs. 2, 3)0.0072.210.87–5.620.095
PgR status (+ vs. −)0.628
HER2 status (+ vs. −)0.656
OCT1 IR (+ vs. −)0.0242.381.03–5.520.043
Note: Significant p-values are expressed in bold. Abbreviations: CI, confidence interval; ER, estrogen receptor; HER2, human epidermal growth factor receptor 2; IR, immunoreactivity; PgR, progesterone receptor.
Table 3. Relationship between NCAPH immunoreactivity and clinicopathological parameters in ER-positive breast cancer patients.
NCAPH Statusp-Value
Positive IR
(n = 63)
Negative IR
(n = 45)
Age≤50 years old32210.344
>50 years old3124
StageI21210.161
II, III4224
Invasive tumor size≤20 mm35251.000
>20 mm2820
Lymph node statusPositive28150.245
Negative3530
Nuclear grade131290.116
2, 33216
PgR statusPositive51410.143
Negative124
HER2 statusPositive950.628
Negative5440
OCT1 statusPositive IR426<0.001
Negative IR2139
Note: Significant p-value is expressed in bold. Abbreviations: ER, estrogen receptor; HER2, human epidermal growth factor receptor 2; IR, immunoreactivity; PgR, progesterone receptor.
Table 4. Univariate and multivariate analyses of disease-free survival with clinicopathological parameters including NCAPH immunoreactivity in ER-positive breast cancer patients.
VariablesUnivariateMultivariate
p-ValueHazard Ratio95% CIp-Value
Age (≤50 vs. >50 years old)0.186
Invasive tumor size (≤20 vs. >20 mm)0.0122.761.15–6.670.024
Lymph node status (+ vs. −)0.0142.220.95–5.190.066
Nuclear grade (1 vs. 2, 3)0.0072.150.85–5.440.105
PgR status (+ vs. −)0.628
HER2 status (+ vs. −)0.656
NCAPH IR (+ vs. −)0.0492.611.01–6.780.048
Note: Significant p-values are expressed in bold. Abbreviations: CI, confidence interval; ER, estrogen receptor; HER2, human epidermal growth factor receptor 2; IR, immunoreactivity; PgR, progesterone receptor.
Publisher’s Note: MDPI stays neutral with regard to jurisdictional claims in published maps and institutional affiliations.

