2.1. Selection of Model Compounds and Structural Studies
Among different plant parts of
G. procumbens, the leaves and aerial parts (whole twigs with leaves) are the most frequently used for medicinal purposes [
7,
8]. In the present study, the aerial parts were used for QC method development because they combine the chemical matrices of leaves and stems (twigs). The plant material was extracted with methanol-water (75:25,
v/
v), the solvent optimised for the recovery of polyphenols from leaves and stems [
11,
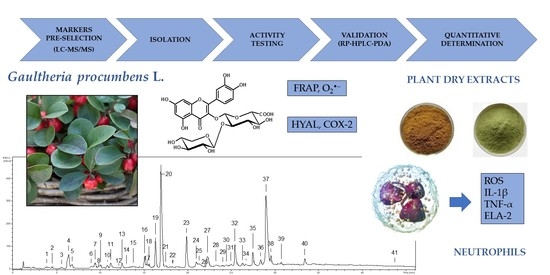
13]. The phytochemical profile of the extract (ME-AP) was studied by UHPLC-PDA-ESI-MS
3, and the analytes (UHPLC peaks 1–41,
Figure 1) were initially identified (
Table S1) by comparing their retention times, UV-vis spectra, and MS/MS fragmentation profiles with the standards and literature data [
22,
23,
24]. Considering the previously characterised profiles of leaves and stems [
11,
13], 11 compounds (coloured peaks in
Figure 1) were selected as model structures for
G. procumbens polyphenols.
They were assigned as GT, a representative of methyl salicylate glycosides; (−)-epicatechin (ECA) from the group of monomeric flavanols; procyanidin B2 (PB2) and a procyanidin A-type trimer (CB1) as oligomeric proanthocyanidins; chlorogenic acid (CHA), neochlorogenic acid (NCHA), and cryptochlorogenic acid (CCHA), three isomeric caffeoylquinic acids, and MQ, hyperoside (HY), and a quercetin pentoside-glucuronide (DGQ), representing the flavonoid glycosides. Moreover, a flavonoid aglycone quercetin (QU) was added to the set as a useful marker of hydrolytic degradation of the extracts during processing.
Two of the selected compounds, CB1 and DGQ, had to be isolated for complete structural identification. For isolation purposes, the defatted extract (MED-AP) of aerial parts was obtained on a preparative scale and fractionated by liquid-liquid partitioning for basic clean-up [
13]. The ballast substances, extracted with chloroform and diethyl ether, were discarded, and the target analytes were concentrated in the fractions of ethyl acetate (EAF-AP),
n-butanol (BF-AP), and water (WF-AP). Apart from CB1 and DGQ, also some relatively hydrophilic polyphenols, including flavonoid monoglycosides, were present in EAF-AP and BF-AP. However, despite similarities in LC-MS/MS profiles, the solubility of EAF-AP and BF-AP in methanol differed significantly. BF-AP was surprisingly hardly soluble and tended to precipitate some yellowish pigment. To explain this phenomenon, EAF-AP and BF-AP were subjected to GPC to separate the fractions of flavonoids and procyanidins and the sparingly soluble component (MQK) of BF-AP was obtained from the respective flavonoid fraction by crystallisation. Eventually, WF-AP and the procyanidin and flavonoid fractions of EAF-AP were chromatographed using GPC, flash chromatography, and preparative HPLC to yield the target compounds (CB1 and DGQ) and several accompanying constituents (GT, ECA, PB2, MQ, HY, IQ, GV, KG, DGK).
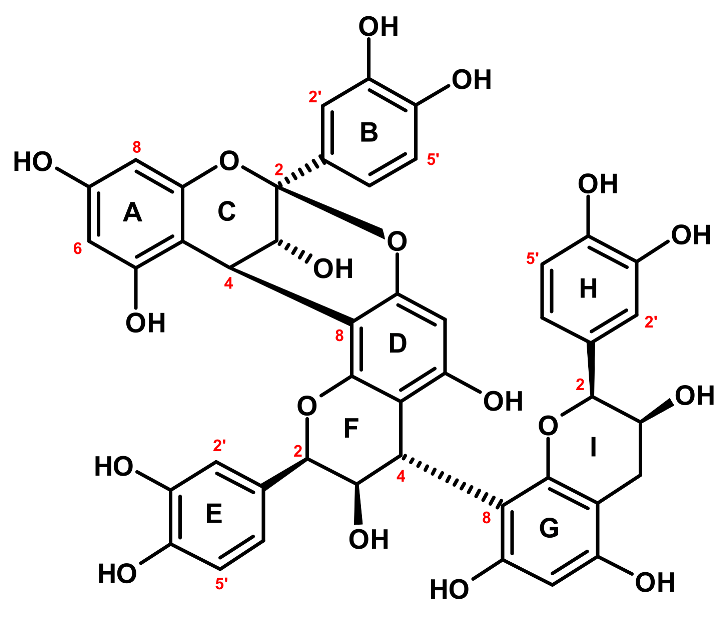
CB1 (
Figure 2) showed a UV absorption maximum at 278 nm and a [M − H]
− ion at 863
m/
z (LC-PDA-ESI-MS
3), suggesting that it is an A/B-type proanthocyanidin trimer with one A-type interflavan bond and the molecular formula of C
45H
36O
18 [
23]. The secondary ions (negative ions mode) at
m/
z 711, 573, 559, 407, 289, and 285 indicated that the trimer is composed of three (epi)catechin units and its fragmentation scheme (
Figure S1) was typical of both A- and B-type procyanidins [
23,
25]. The trimeric structure was confirmed by 45
13C NMR signals (
Table S2), including 3 sets of aliphatic carbon signals typical of C-2 (79.9–101.2 ppm), C-3 (68.2–73.6 ppm), and C-4 (29.9–39.3 ppm) positions in the pyran rings [
26]. The presence of one A-type interflavan linkage was confirmed by the downfield shift of one of the C-2 signals (101.2 ppm, typical of ketal carbons) in comparison to the other two resonances (79.9 and 81.4 ppm) [
26,
27]. Moreover, the
1H NMR spectrum exhibited the presence of 22 proton resonances (
Table S3) against 23 signals required for B-type procyanidins [
23,
26]. The complete signal assignments of the protons and carbon atoms were achieved using 2D NMR experiments (COSY, HMQC, HMBC). Accordingly, the A-type linkage was confirmed by the presence of two proton doublets at δ
H 3.34 ppm (1H,
d,
J = 3.4 Hz) and 4.19 ppm (1H,
d,
J = 3.4 Hz) corresponding to H-3 and H-4 in the ring C and the lack of H-2. The configuration of the interflavan bonds at C-4(C) and C-4(F) was established as
β according to the positive Cotton effect in the short wavelength region ([Θ]
228 + 2.3 × 10
4) of the CD spectrum, while the negative effect at 270–290 nm ([Θ]
270 − 2.5 × 10
4) suggested the
α orientation of the phenyl rings (B, E, H) [
28,
29]. One pair of doublets with a small vicinal coupling constant (
J = 3.4 Hz) corresponding to
trans relative substitution of H-3(C) and H-4(C), as well as four broad singlets of H-2(F/I) and H-3(F/I), according to
cis relative substitutions at C-2(C/F/I) and C-3(C/F/I), suggested that CB1 is composed of three (−)-epicatechin subunits [
30,
31]. The structure of the terminal unit was additionally supported by thiolysis of CB1 and detection of (−)-epicatechin by HPLC-PDA after separation on a chiral column. The specific positions of the B-type linkages between the subunits were established using a combination of 2D NMR through-bond and through-space correlations. The HMBC cross-peaks between the proton H-4(C) and the carbon atoms C-8(D) and C-7(D) indicated the interflavan bond location between the upper and middle subunits. It was further confirmed by the low-temperature ROESY experiment and the correlations between H-2′ and H-6′ of the ring E and H-4 of the ring C, resulting from their spatial proximity and being characteristic of 4→8 linkages [
30]. The 4→8 interflavan bond between the middle and the terminal (−)-epicatechin units was established analogously. Eventually, CB1 was identified as (−)-epicatechin-(4
β→8, 2
β→
O→7)-(−)-epicatechin-(4
β→8)-(−)-epicatechin (cinnamtannin B-1). CB1 is a rare procyanidin that was for the first time isolated from the bark of
Cinnamomum zeylanicum and is known for its potent antioxidant activity with neuro- and cardioprotective effects [
32].
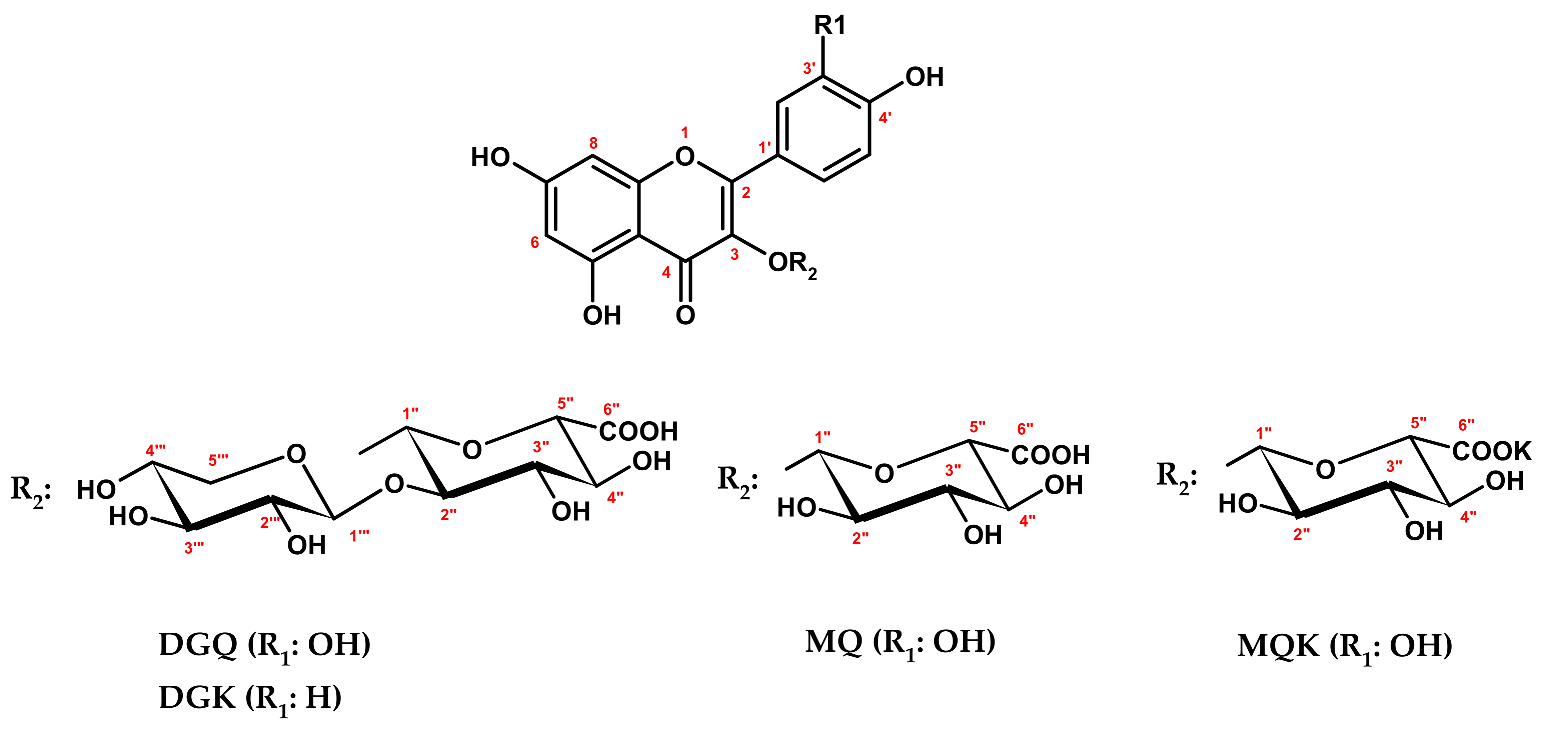
DGQ (
Figure 3) exhibited a UV-vis spectrum with two absorption maxima at 266 nm and 356 nm, diagnostic for flavonol glycosides. The HR-ESI-MS spectrum revealed a [M − H]
− ion at 609.1078
m/
z, which agrees with the mass (609.1092) calculated for the molecular formula C
26H
26O
17. The product ions at
m/
z 477 [M − 132 − H]
−, 433 [M − 176 − H]
−, and 301 [M − 132 − 176 − H]
− in LC-PDA-ESI-MS
3 assay indicated that DGQ is a quercetin pentoside hexuronide. The acid hydrolysis of the glycoside provided an aglycone, identified by HPLC-PDA as quercetin [
33], and two carbohydrates identified after conversion to the 1-[(
S)-
N-acetyl-methylbenzylamino]-1-deoxy-alditol pentaacetate derivatives [
34] as
d-xylose and
d-glucuronic acid. In the
1H NMR spectrum (D
2O,
Table 1), five characteristic aromatic proton signals of quercetin were present [
35], as well as two doublets of anomeric protons. One of these protons resonated in a relatively high field (δ
H 4.76 ppm), suggesting the presence of a disaccharide moiety and an interglycosidic linkage [
35]. Signals in the
1H and
13C NMR spectra were assigned by 2D experiments (COSY, HMQC, HMBC) and revealed that the terminal sugar is a pentose (
d-xylose). The attachment position of the disaccharide at the C-3-OH of the aglycone was concluded from the HMBC cross-peak between the anomeric proton signal of H-1″ (δ
H 5.29 ppm) and the carbon resonance of C-3 (δ
C 133.5 ppm). The large coupling constants (
J = 7.5 Hz) observed for both anomeric proton signals, typical of
trans-diaxial conformation, suggested
β-configuration of the glycosidic linkage and pyranoside form for both sugar units [
35,
36]. Two distinctive signals from H-5‴ protons at δ
H 3.83 ppm (1H,
dd,
J1 = 5.7 and
J2 = 10.5 Hz, signal of the equatorial proton H-5
e‴) and δ
H 3.19 ppm (1H,
dd,
J1 = 10.5 and
J2 = 9.6 Hz, signal of the axial proton H-5
a‴) further supported the pyranoside form of
d-xylose [
37]. The
13C NMR spectrum (D
2O,
Table 1) showed a sizeable upfield shift (Δδ
C = −5.6 ppm) for C-1″ and a downfield shift (Δδ
C = +3.6 ppm) for C-2″ when compared to the corresponding resonances of MQ. These shifts located the attachment of
d-xylose unit at C-2″ of
d-glucuronic acid [
36], which was confirmed by the HMBC cross-peak between the anomeric proton signal at δ
H 4.77 ppm and a carbon resonance at δ
C 80.1 ppm. Eventually, DGQ was identified as quercetin 3-
O-
β-
d-xylopyranosyl-(1→2)-
β-
d-glucuronopyranoside, a new natural product. The same analysis scheme was applied for DGK (
Figure 3,
Table 1), a minor component of MED-AP, which was identified as an analogue of DGQ, i.e., kaempferol 3-
O-
β-
d-xylopyranosyl-(1→2)-
β-
d-glucuronopyranoside, a new natural product as well. The trivial names wintergreenoside A and wintergreenoside B were proposed for DGQ and DGK, respectively.
Compounds MQK and MQ (
Figure 3) revealed in LC-PDA-ESI-MS
3 assay identical UV-vis and mass spectral profiles (
Table S1) corresponding to the standard of quercetin 3-glucuronide. On the other hand, both analytes strongly differed in solubility (see above) and melting points (m.p.); in contrast to MQ (m.p. 220–223 °C), MQK showed high m.p. values (>360 °C), not typical of flavonol glycosides. The HPLC-PDA analyses of the acid hydrolysates did not reveal any structural difference between MQ and MQK but confirmed the identity of the aglycone [
33] and the carbohydrate unit, including its absolute configuration D [
34]. In
1H NMR spectra (DMSO-
d6), only the signals expected for quercetin and glucuronic acid were present, however, with a large downfield shift (Δδ
H = + 0.76 ppm) for H-2′ and an upfield shift (Δδ
H = −0.27 ppm) for H-6′ of MQK in comparison to the corresponding resonances of MQ. In flavonoid glycosides, such phenomenon is usually an effect of structural differences within the sugar moiety [
35,
36], which suggests that MQK might be an inorganic salt of MQ. Dissociation of the salt in aqueous media, including mobile phases, explains the same retention observed for both compounds in LC. The flame photometric analysis of MQK revealed the presence of potassium ions. It was supported by HR-LSI-MS assay with direct injection of the analyte (in DMSO) to the ion source, which revealed a [M − H]
− ion of MQK at
m/
z 515.0234, corresponding to the molecular formula C
21H
17O
13K. The remaining structural data on the isolates, such as configuration and position of the glycosidic linkages and pyranose form of the sugar units, were deduced from 1D and 2D NMR (COSY, HMQC, HMBC) experiments. Eventually, MQK and MQ were identified as quercetin 3-
O-
β-
d-glucuronopyranoside potassium salt and quercetin 3-
O-
β-
d-glucuronopyranoside, respectively [
38,
39]. Because of rapid hydrolysis, salts of flavonoid uronides are rarely isolated from plant materials. This is the first report on the occurrence of MQ in the form of potassium salt. Previously, its sodium salt was found in the leaves of
Cyclocarya paliurus [
39].
The spectroscopic (1D and 2D NMR, ESI-MS
3, UV-vis, CD) and physicochemical studies (optical rotation, absolute configuration of sugar units) on the common extracts components, including GT, ECA, PB2, HY, GV (guaijaverin), IQ (isoquercitrin) and KG (kaempferol 3-
O-
β-
d-glucuronopyranoside) enabled unequivocal confirmation of their structures [
35,
37,
40,
41,
42].
2.2. Biological Activity of the Selected Gaultheria Polyphenols
The pre-selected compounds were subjected to biological activity tests in vitro to confirm their usefulness as active markers of
G. procumbens aerial parts. However, among three position isomers of monocaffeoylquinic acid (CHA, NCHA, CCHA), only CHA was tested as a model analyte for the group. The tests were chosen according to the accumulated pharmacological data on
Gaultheria plants to reflect some of the best recognised mechanisms of their anti-inflammatory and antioxidant activities [
10,
11,
12,
13,
18,
19,
20,
21]. They included: reducing capacity (FRAP), direct scavenging of O
2•− as a primary ROS generated by immune cells in inflammatory conditions, direct inhibition of pro-inflammatory enzymes (COX-2, HYAL), and modulation of pro-inflammatory and pro-oxidant functions of human neutrophils ex vivo (influence on the release of ROS, IL-1β, TNF-α, and ELA-2).
As shown in
Table 2 and
Figure 4, the investigated compounds revealed concentration-dependent effects in all models but varied significantly in capacity, depending on the test. The most significant differences were observed in non-cellular models. In comparison to the standards (Trolox, ascorbic acid), all analytes except GT revealed potent antioxidant activity, mostly surpassing that of the standards, with the most substantial effects for all procyanidins (ECA, PB2, CB1) in the O
2•− scavenging assay, and a flavonol aglycone (QU) and oligomeric procyanidins (PB2, CB1) in the FRAP test (
Table 2). The weak capacity observed for GT was not surprising as it lacks free phenolic groups, which are crucial for the direct antioxidant activity of polyphenols [
43]. In the case of other analytes, also further structural elements, especially the glycosylation and polymerisation degree, influenced their activity. As the tests were based on different mechanisms (hydrogen atom transfer, HAT, and single electron transfer, SET, respectively), there is no significant correlation between the activity parameters (
r = 0.5107,
p > 0.05), which might suggest advantageous complementary antioxidant effects of individual polyphenols in complex oxidant systems.
Similar relationships were observed on the direct inhibition of COX-2, except for relatively lower differences between individual compounds and the potent activity of GT (
Table 2). As a derivative of salicylic acid, GT is among the most effective natural COX-2 inhibitors [
44]. Indeed, its IC
50 value fell in between that of two synthetic anti-inflammatory drugs, indomethacin and dexamethasone (
Table 2) that might confirm the high potential of GT to treat inflammation. On the other hand, the activity of other tested polyphenols, except for CHA, was only at most twice as weak. Interestingly, the IC
50 values for COX-2 inhibition were similar for all tested flavonoids and procyanidins. In contrast, the inhibitory activity of the analytes towards HYAL varied in a broader range. Oligomeric procyanidins (PB2, CB1) turned out to be the most potent, and their IC
50 values did not differ from those of dexamethasone. The HYAL-inhibitory activity of GT was also noticeable and intermediate between the oligomeric procyanidins and all other polyphenols, including flavonoids, ECA, and CHA.
On the other hand, these polyphenols were only up to 1.5-fold less active than GT. As COX-2 and HYAL are involved in the progression of inflammation and therapeutic targets in inflammation-related disorders [
45,
46], the obtained results might indicate the substantial contribution of all of the assayed compounds to the anti-inflammatory activity of the
Gaultheria extracts.
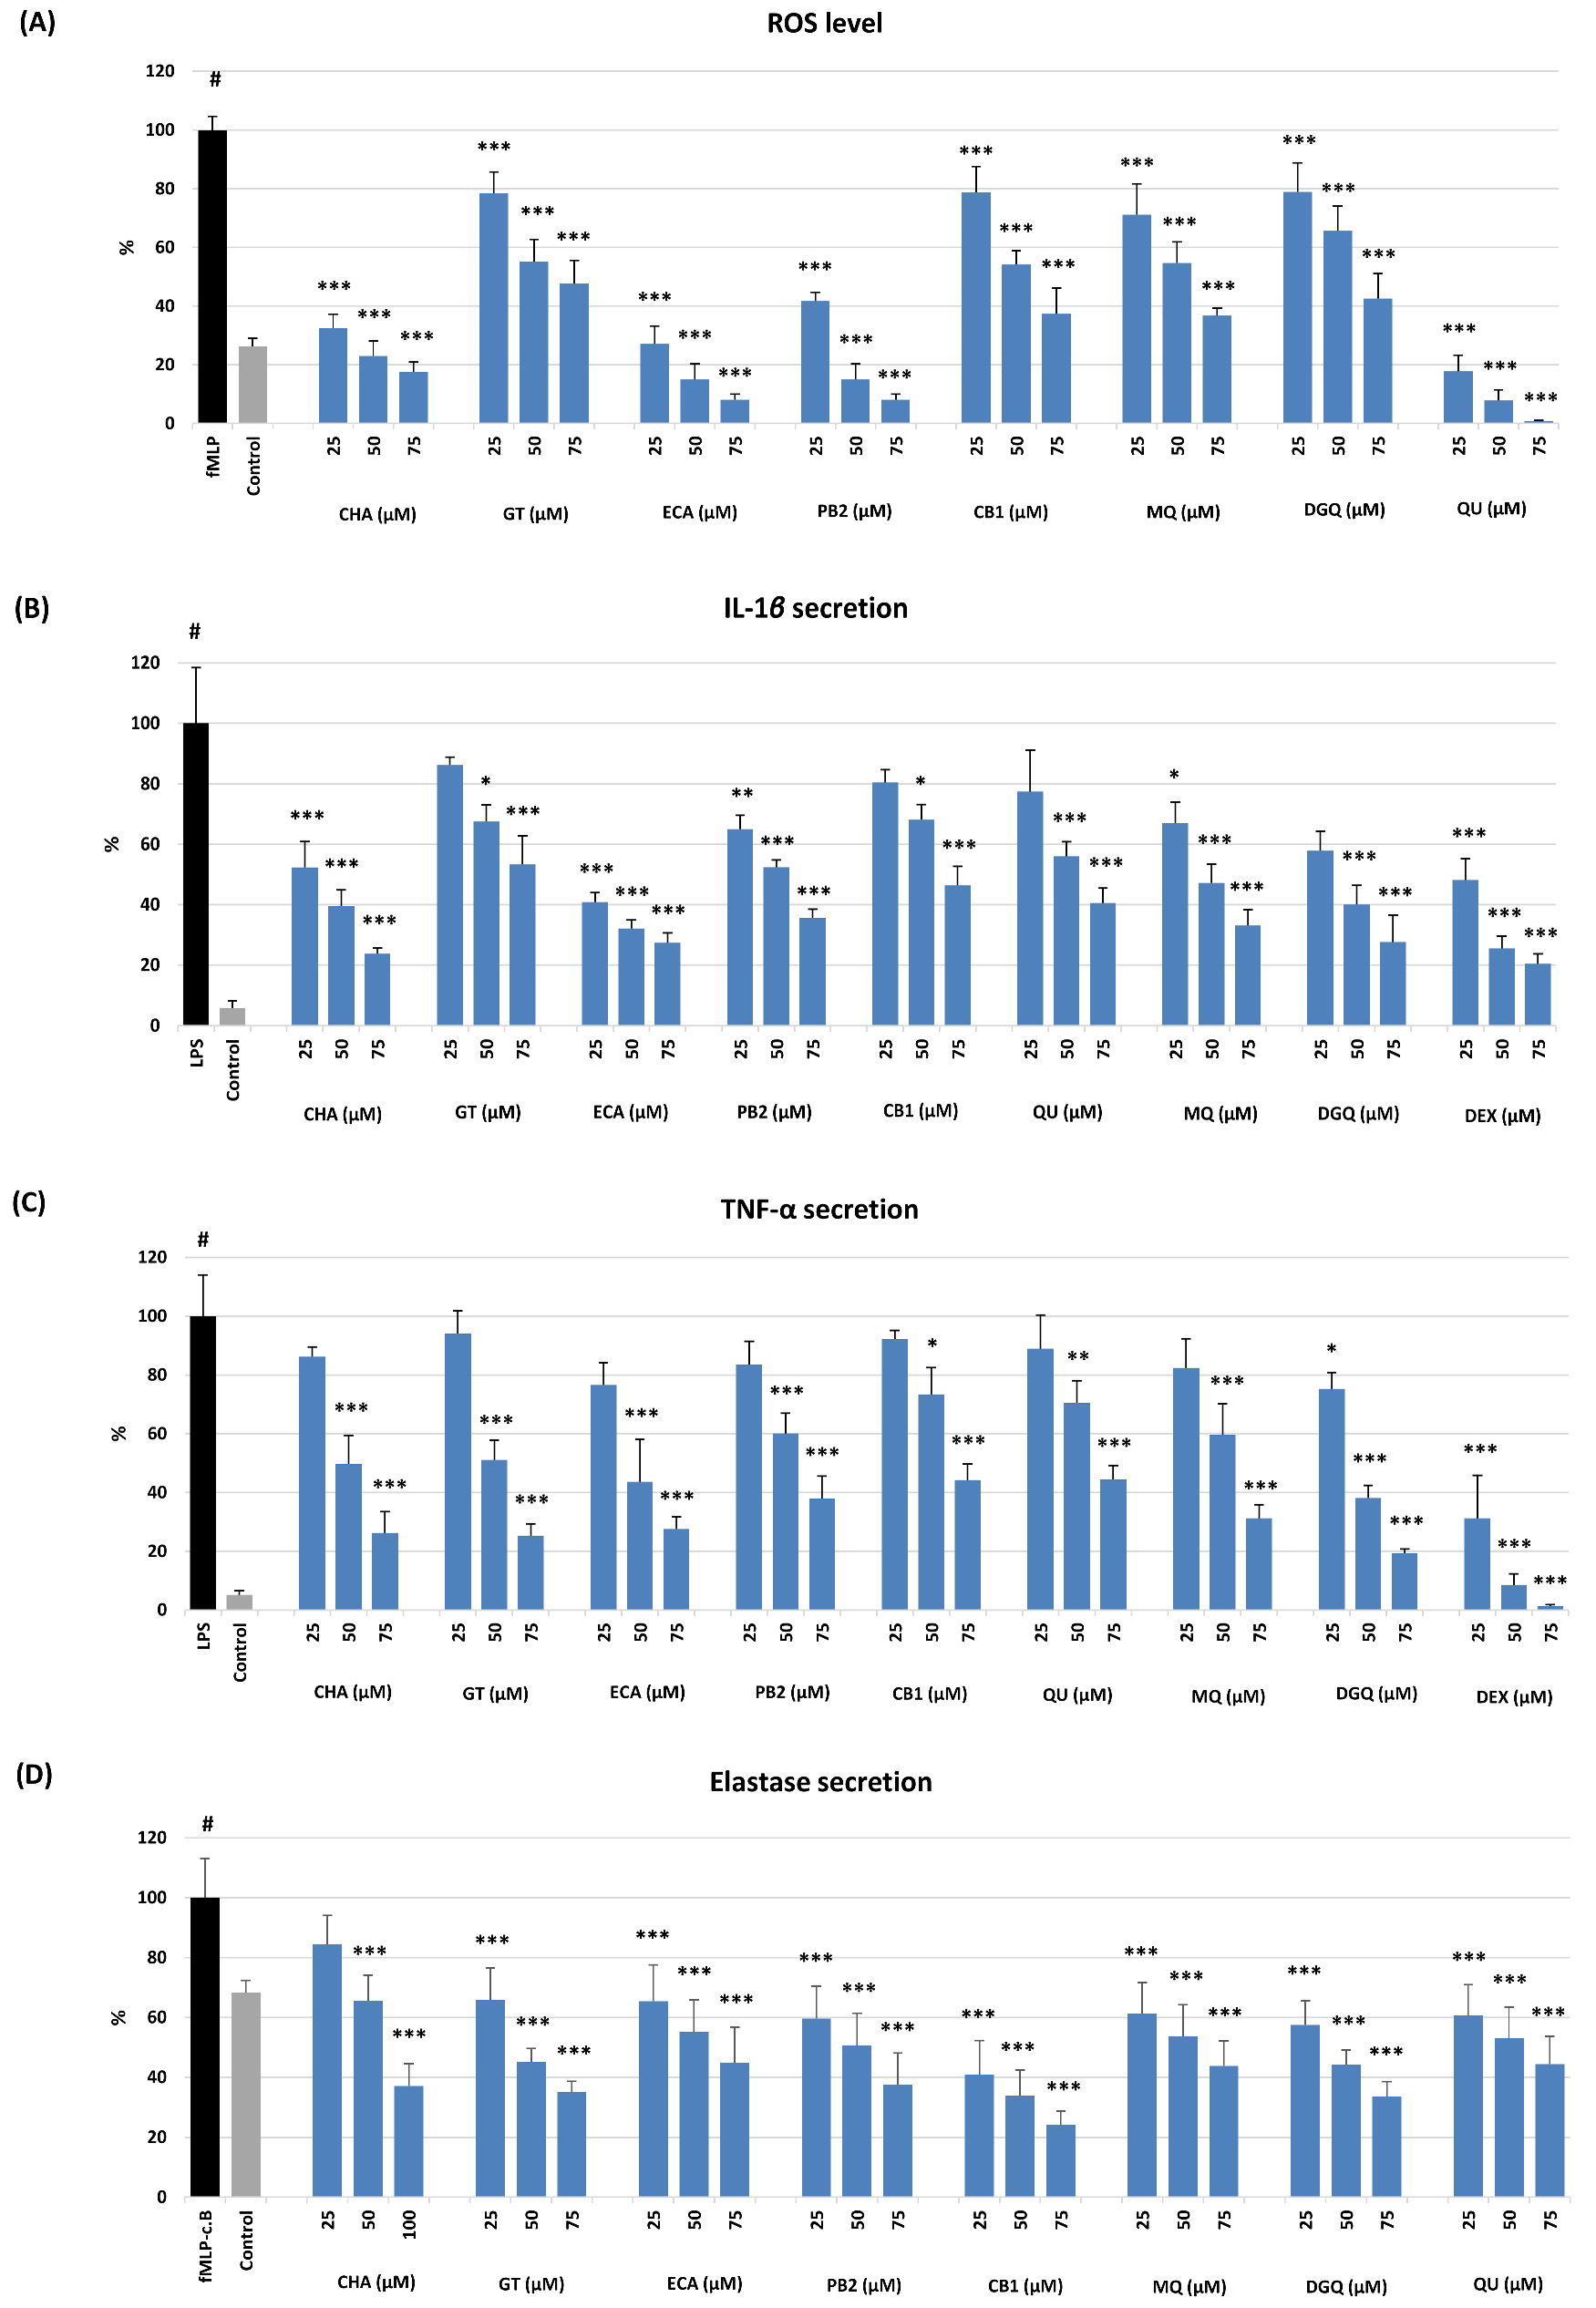
As shown in
Figure 4, all analytes also revealed antioxidant and anti-inflammatory effects at a cellular level and significantly influenced the pro-oxidant and pro-inflammatory functions of human neutrophils ex vivo with no effect on their viability (
Figure S2). Neutrophils are the most abundant immune cells in human blood; in response to infection or tissue injury, they release a large amount of ROS and pro-inflammatory mediators, orchestrating the inflammatory process [
47]. All analytes at 25–75 µM inhibited the oxidative burst of
fMLP-stimulated neutrophils and down-regulated the ROS levels by up to 22–99%, depending on the compound and level (
Figure 4A). The most active were QU (a positive control in this test), ECA, CHA, and PB2. Interestingly, the activity of GT did not differ significantly from that of flavonoid glycosides (MQ, DGQ) and a procyanidin trimer (CB1), which confirmed the previous reports on the potent cellular antioxidant effects of salicylates [
10,
18,
21]. The mechanistic studies revealed that these effects are indirect and connected with inhibiting the MAPK/NF-κB pathway [
19,
21].
Apart from the down-regulation of the oxidative burst, all analytes at the whole concentration range significantly inhibited (
p < 0.05) the release of IL-1β (
Figure 4B) and TNF-α (
Figure 4C), two prime agonists of neutrophils and pleiotropic cytokines modulating the gene expression and secretion of numerous other pro-inflammatory factors [
48,
49], and ELA-2 (
Figure 4D), a tissue remodelling enzyme involved in the progression of inflammation [
50]. The flavonoid diglycoside (DGQ), ECA, and CHA regulated the levels of IL-1β most substantially by up to 73–76% at 75 µM, but other compounds were also influential. For instance, the weakest activity of GT meant 47% inhibition. Similar effects were revealed in the case of TNF-α release, except that GT was this time among the most active analytes (DGQ, ECA, CHA), exhibiting an inhibition rate up to 75–81% at 75 µM. The relatively smallest differences between the analytes were observed for the ELA-2 release; however, CB1 was clearly the most potent. It down-regulated the enzyme secretion by up to 76% at 75 µM. Nevertheless, the cellular tests indicated that all analytes might be considered active markers of
G. procumbens, and their contribution to the biological effects of the extracts might depend mainly on their concentration.
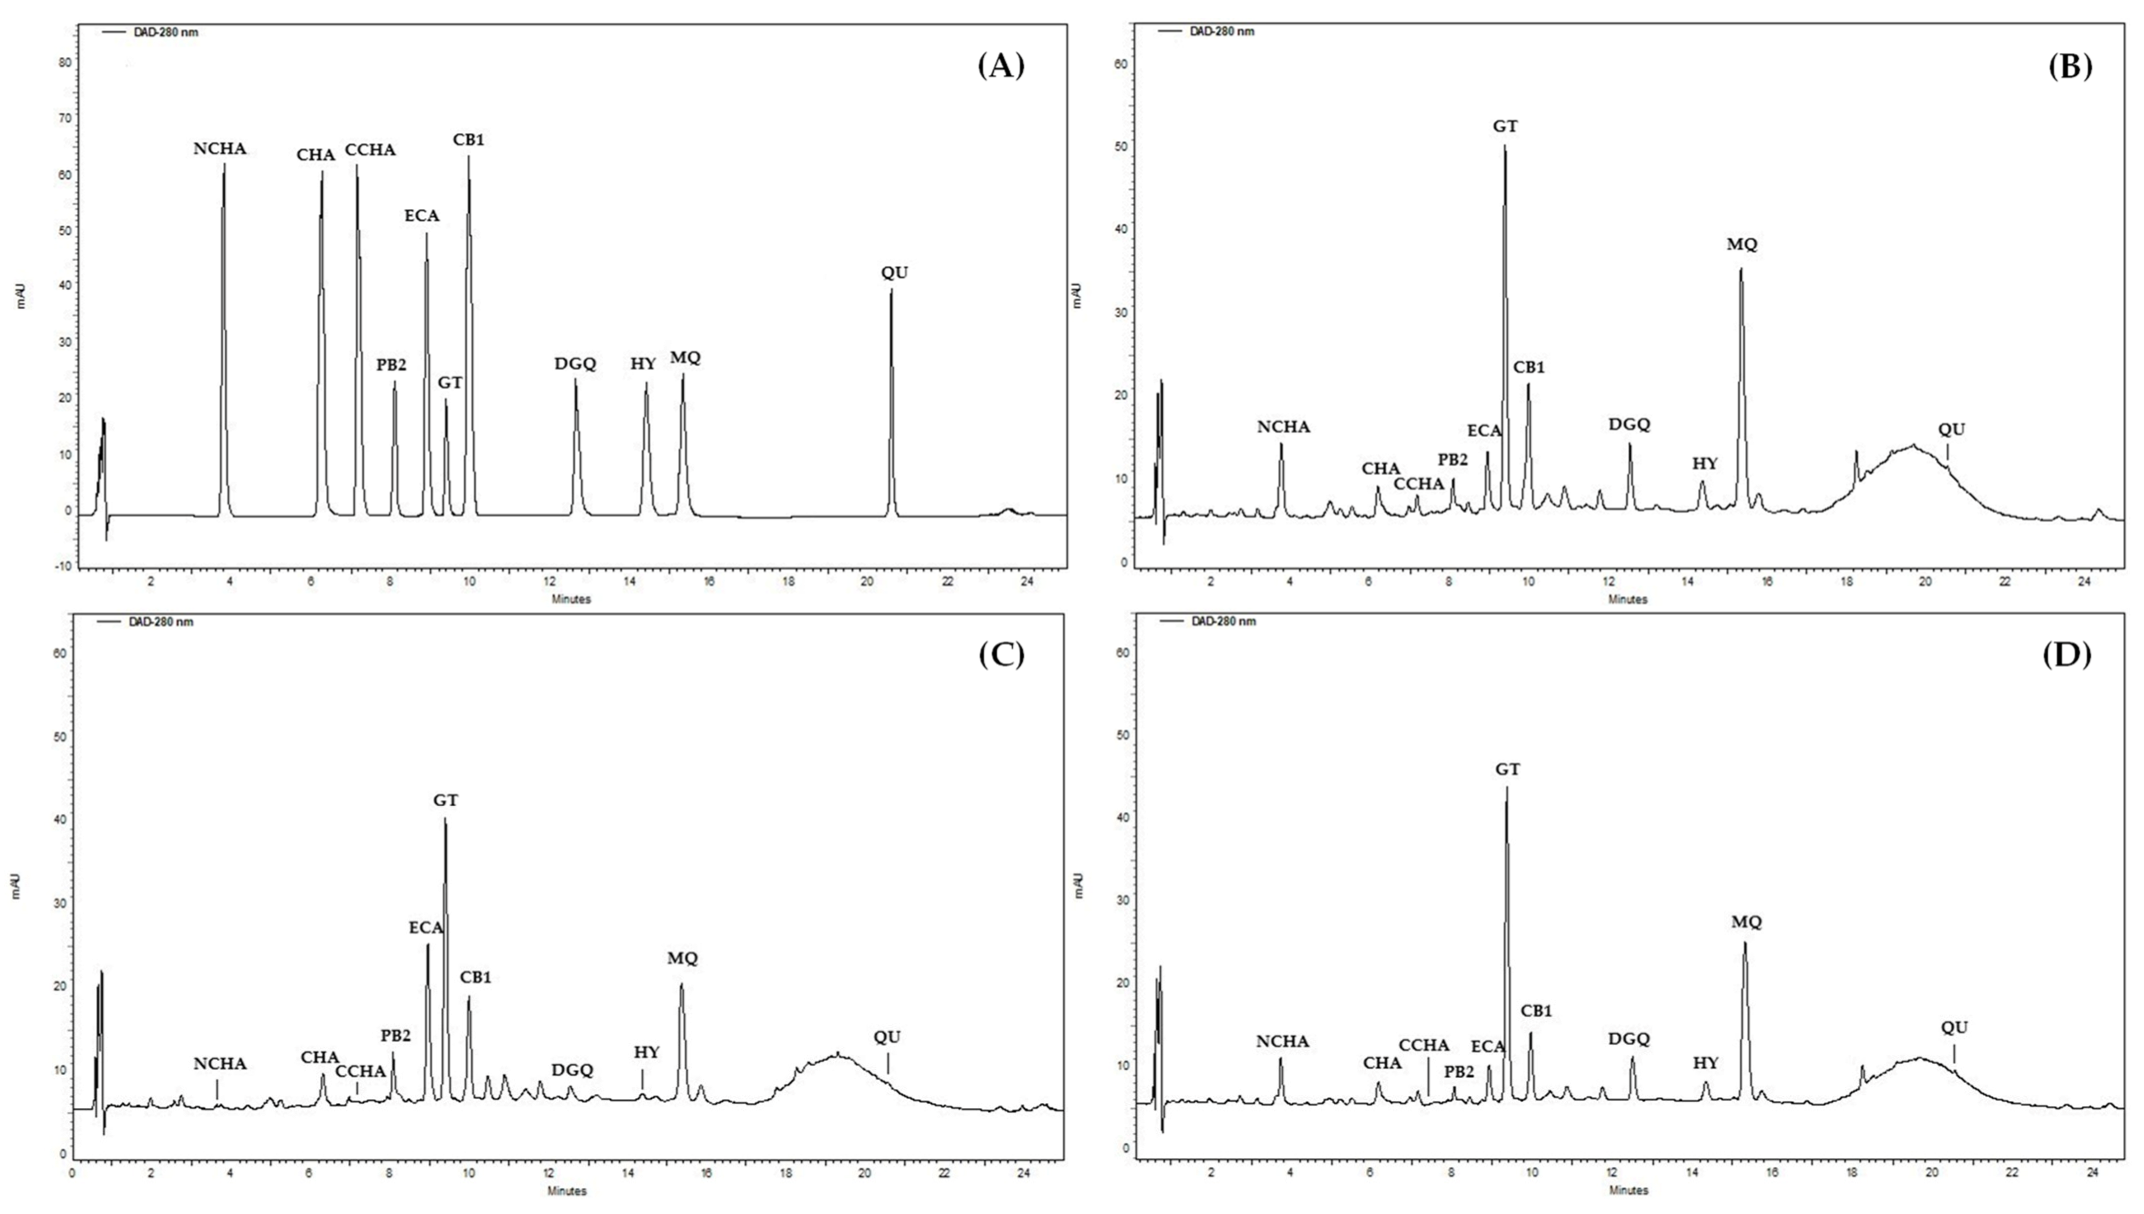
2.3. Development, Validation, and Application of the HPLC-PDA Method for Quantitative Purposes
The chromatographic procedure was developed to separate the selected 11 constituents of the
G. procumbens extracts (
Figure 5A) in a significantly shorter time than used in the qualitative UHPLC profiling (80 min including equilibration). An RP-18 fused-core column was chosen for the task due to its high performance in HPLC systems [
51]. Eventually, a linear gradient of acetonitrile in acidified water (
Table 3), column temperature (18 °C), and flow rate (1.4 mL/min) were optimised to achieve satisfactory separation of the analytes within 35 min (including equilibration).
The proposed method was validated by determining the selectivity, linearity, precision, and accuracy according to the International Council for Harmonization (ICH) Guidance for Industry [
52]. The adequate selectivity was demonstrated in the real samples (
Figure 5B–D): the target peaks eluted as pure bands and were satisfactorily separated from the matrix. The linearity was confirmed in the whole concentration range, including limits of quantitation (LOQs), with
r > 0.9994 (
Table 4). The statistical significance of the regression equations was verified in the
F-test (
p < 0.05). The low limits of detection (LODs, 0.11–0.55 µg/mL, 0.53–2.76 ng) and LOQs (0.36–1.84 µg/mL, 1.79–9.19 ng) demonstrated the high sensitivity of the method (
Table 4). The RSD values measured for peak area for intra-day (0.39–1.93%) and inter-day precision (2.74–4.12%) did not exceed the predicted values (2.19–4.38%), calculated using the Horvitz equation according to the AOAC International [
53], which indicated the adequate precision (
Table 5). In the accuracy studies, the recoveries were within the range of 95.45–101.16% (
Table 5), thus within the acceptance limits (92–105%) [
54]. Finally, the proposed method is superior to the previously published approach [
17] in terms of the range of the tested analytes, chromatographic performance, and validation parameters.
The applicability of the method to the intended use was demonstrated by determining the levels of the target compounds in the aerial part, leaf, and stem extracts of
G. procumbens (
Table S2). The crude extracts and the concentrated fractions obtained for preparative purposes were analysed to cover a wide range of concentrations and relative ratios between the analytes.
Their total content in the crude extracts varied in a narrow range of 181.04–192.78 mg/g, but it rose to 384.48 mg/g in the fractions (EAF-AP), confirming that the selected model compounds form a large part of the extracts.
Moreover, the increase in the QU content from 0.19 mg/g dw in ME-AP to 0.48 mg/g dw in MED-AP and 5.36–8.68 mg/g dw in its organic fractions confirmed that QU might indeed be a suitable marker of the hydrolytic degradation of the extracts during processing or storage. Considering the demonstrated activity of the selected compounds, they might be recommended as standardisation markers for the quality control of the analysed extracts.


 ,
, 


