Article

Prognostic Value of BUB1 for Predicting Non-Muscle-Invasive Bladder Cancer Progression

1
Department of Urology, College of Medicine, Chungbuk National University, Cheongju 28644, Korea
2
Department of Biological Sciences and Biotechnology, Chungbuk National University, Cheongju 28644, Korea
3
Department of Urology, Chungbuk National University Hospital, Cheongju 28644, Korea
*
Authors to whom correspondence should be addressed.
Contributed equally to this work.
Int. J. Mol. Sci. 2021, 22(23), 12756; https://0-doi-org.brum.beds.ac.uk/10.3390/ijms222312756
Submission received: 2 November 2021 / Revised: 22 November 2021 / Accepted: 23 November 2021 / Published: 25 November 2021
(This article belongs to the Collection Feature Papers in Molecular Oncology)

Abstract

:
Non-muscle-invasive bladder cancer (NMIBC) is a common disease with a high recurrence rate requiring lifetime surveillance. Although NMIBC is not life-threatening, it can progress to muscle-invasive bladder cancer (MIBC), a lethal form of the disease. The management of the two diseases differs, and patients with MIBC require aggressive treatments such as chemotherapy and radical cystectomy. NMIBC patients at a high risk of progression benefit from early immediate cystectomy. Thus, identifying concordant markers for accurate risk stratification is critical to predict the prognosis of NMIBC. Candidate genetic biomarkers associated with NMIBC prognosis were screened by RNA-sequencing of 24 tissue samples, including 16 NMIBC and eight normal controls, and by microarray analysis (GSE13507). Lastly, we selected and investigated a mitotic checkpoint serine/threonine kinase, BUB1, that regulates chromosome segregation during the cell cycle. BUB1 gene expression was tested in 86 NMIBC samples and 15 controls by real-time qPCR. The performance of BUB1 as a prognostic biomarker for NMIBC was validated in the internal Chungbuk cohort (GSE13507) and the external UROMOL cohort (E-MTAB-4321). BUB1 expression was higher in NMIBC patients than in normal controls (p < 0.05), and the overexpression of BUB1 was correlated with NMIBC progression (log-rank test, p = 0.007). In in vitro analyses, BUB1 promoted the proliferation of bladder cancer cells by accelerating the G2/M transition of the cell cycle. Conclusively, BUB1 modulates the G2/M transition to promote the proliferation of bladder cancer cells, suggesting that it could serve as a prognostic marker in NMIBC.

1. Introduction

Aneuploidy is the presence of an aberrant number of chromosomes in a cell. It is the result of chromosomal instability, a hallmark of cancer [1]. Defects in the mitotic spindle checkpoint contribute to chromosome instability and aneuploidy in several cancers [2,3,4]. Budding uninhibited by benzimidazole 1 (BUB1) is a well-characterized component of the spindle checkpoint that has versatile and distinct functions during the cell cycle [5]. BUB1 plays a role in oncogenesis, as indicated by the occurrence of BUB1 mutations, as well as differential BUB1 gene and protein expression in cancer tissues and cell lines [5]. BUB1 is downregulated in sarcomas, lymphomas, and lung tumors, whereas BUB1 upregulation is associated with liver cancer [6]. BUB1 expression is correlated with unfavorable prognosis in patients with breast cancer and liver cancer [7,8,9]. In bladder cancer (BCa), weighted gene co-expression network analysis showed that BUB1 is upregulated in high-grade BCa [10]; however, the roles of BUB1 in BCa remain unclear.
BCa has a high morbidity rate, with 1,806,590 cases diagnosed in 2020 in the United States [11]. More than 70% of newly diagnosed BCa cases are non-muscle-invasive bladder cancer (NMIBC). Although these tumors are not aggressive, their high recurrence rates require lifetime monitoring, which is costly [12]. NMIBC can progress to muscle-invasive bladder cancer (MIBC), which is a fatal disease with a 5-year overall survival rate of <50% despite active intervention [13,14]. Thus, predicting the prognosis of NMIBC patients is critical to designing optimal treatment strategies. Clinical staging and grading systems, along with histopathological parameters, such as tumor size and tumor multiplicity, remain the “gold standard” for prognostic prediction of BCa [15]. However, these parameters are not sufficient to describe tumor behavior in clinical practice. The clinical use of prospective prognostic biomarkers may improve our understanding of the pathobiology of the disease to design effective surveillance methods and refine treatment strategies [16].
Advances in high-throughput techniques, such as microarray and RNA-sequencing (RNA-seq), together with well-established databases, such as the Cancer Genome Atlas (TCGA) and the public genomic data repository Gene Expression Omnibus (GEO), have uncovered new transcriptional landscapes, encouraging researchers to identify molecular markers for cancer diagnosis and prognosis [17]. Here, we performed RNA-seq analysis and identified BUB1 as a differentially expressed gene in NMIBC and normal adjacent tissue (NAT). We showed that the overexpression of BUB1 was correlated with poor clinical outcomes in patients of NMIBC. Real-time quantitative reverse transcription PCR (RT-qPCR) confirmed that BUB1 upregulation in NMIBC patients was associated with higher progression rates. The value of BUB1 as a prospective prognostic marker of NMIBC was validated in two published cohorts, which confirmed that NMIBC patients with high BUB1 gene expression had higher progression rates. In addition, we found that BUB1 promotes BCa cell proliferation by accelerating cell cycle G2/M transition. Taken together, the results indicate that BUB1 could be a prospective marker of NMIBC progression and a potential novel therapeutic target.

2. Results

2.1. Screening Test

2.1.1. Transcriptome Profiles in Patients with NMIBC

RNA-seq analysis of 24 bladder tissue samples, including 16 NMIBC and eight normal controls, was performed to identify the gene expression pattern in NMIBC. The heatmap depicted 1178 differentially expressed genes (DEGs) with 270 upregulated and 908 downregulated genes in NMIBC compared with NAT (FDR < 0.01, >2-fold differences in expression; Supplementary Figure S1A). Gene ontology (GO) analysis in biological processes revealed the functional profiles of DEGs, indicating that genes with higher transcription levels in NMIBC than in NAT were enriched in the following GO terms: cell division, DNA conformation change, regulation of cell cycle progression, and DNA repair. Downregulated genes were enriched in the following GO terms: extracellular matrix organization, cell–substrate adhesion, positive regulation of locomotion, and muscle structure development (Supplementary Figure S1B). These processes are well-known alterations in BCa related to tumor development and progression. Gene set enrichment analysis (GSEA) showed that upregulated genes in NMIBC patients were associated with cell cycle-related processes (Supplementary Figure S1C); the core genes enriched in the cell cycle pathway are shown in Supplementary Figure S1D. Overall, the results indicate that genes involved in the regulation of the cell cycle play crucial roles in NMIBC.

2.1.2. Comparison of DEGs in Two Different Cohorts

The intersection of 270 upregulated genes in NMIBC patients versus NATs from RNA-seq analysis, 481 upregulated genes in NMIBC versus normal controls from the GSE13507 dataset, and 527 upregulated genes in MIBC versus NMIBC from GSE13507 was determined to obtain target outlier genes for NMIBC prognosis. Accordingly, 19 upregulated genes overlapped among the three categories, suggesting that these genes are the most promising candidates for BCa. GO analysis revealed that the 19 genes were cell cycle-related genes (Supplementary Figure S2). Among them, BUB1, a spindle checkpoint regulator, was selected for further evaluation of its role in NMIBC pathogenesis and prognosis. The expression of BUB1 in patients with NMIBC and NATs from RNA-seq analysis is shown in Supplementary Figure S3.

2.2. Training Test

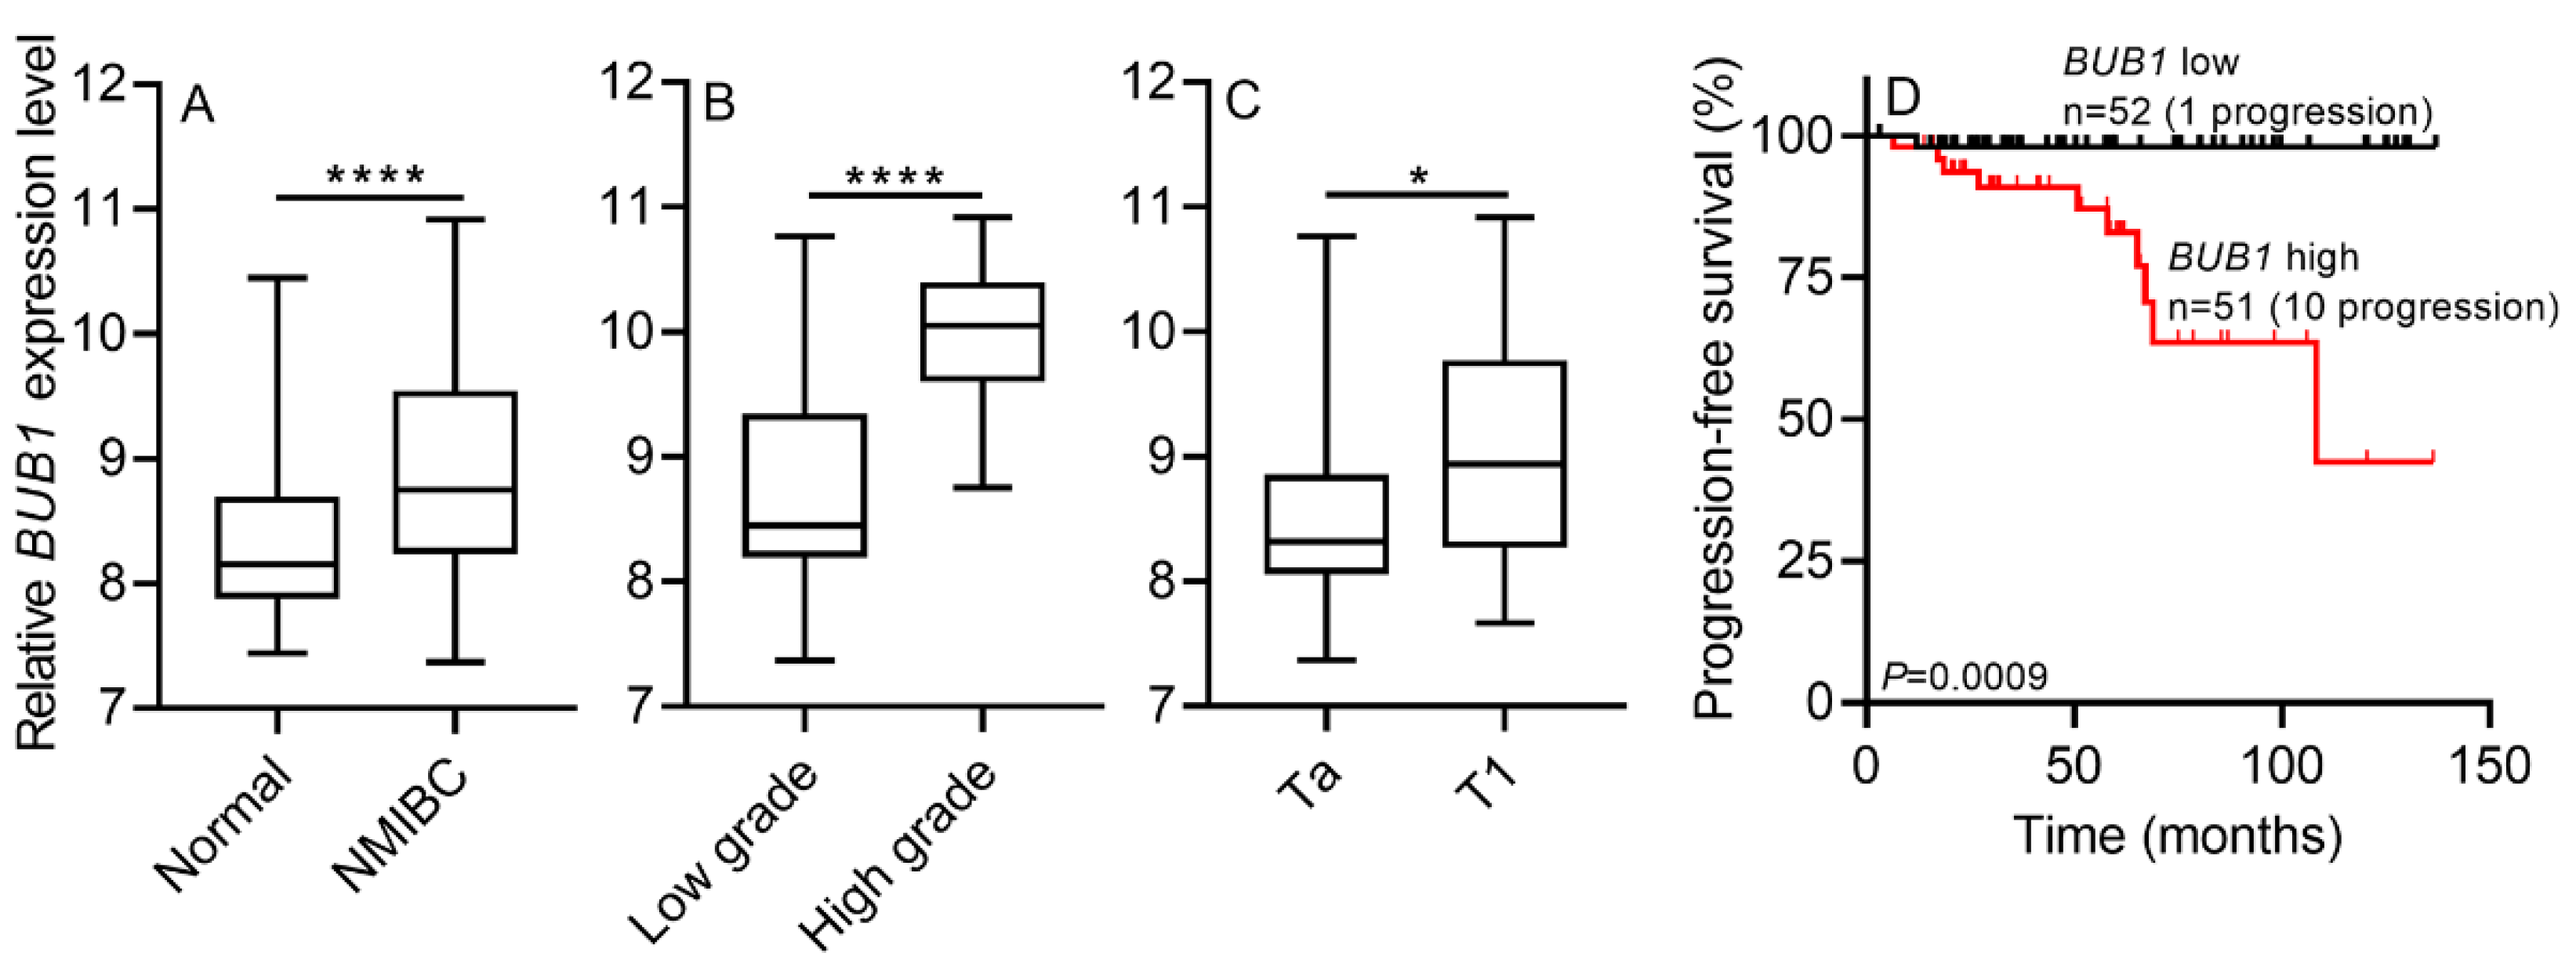
2.2.1. BUB1 mRNA Expression in NMIBC Tissues

The mRNA expression of BUB1 in NMIBC tissues was detected by real-time RT-qPCR, which showed that BUB1 expression was higher in NMIBC tissues than in controls (normal bladder mucosae; p < 0.0001; Figure 1A). BUB1 expression varied between NMIBC patients with different grades and prognoses. BUB1 expression was significantly higher in high-grade NMIBC patients than in those with low-grade tumors (p < 0.01; Figure 1B). Moreover, BUB1 was considerably overexpressed in NMIBC patients with progression when compared to those patients without progression (p < 0.05; Figure 1C). These results suggest that BUB1 is a prognostic indicator of NMIBC.

2.2.2. BUB1 mRNA Expression Correlates with NMIBC Prognosis

Survival analyses were performed to evaluate the prognostic power of BUB1 in NMIBC. NMIBC patients were classified into two groups based on median cut-off values of BUB1 (BUB1 high and BUB1 low). Univariate and multivariate Cox regression analyses of the real-time RT-qPCR cohort indicated that BUB1 expression may be an independent predictor of progression in NMIBC patients [hazard ratio (HR), 4.642; 95% confidence interval (CI), 1.021–21.097; p = 0.047], and the HR was similar to that for tumor grade (HR, 4.629; 95% CI, 1.593–13.450; p = 0.005; Table 1). The Kaplan–Meier survival plot showed NMIBC patients with decreased BUB1 expression had a lower risk of progression than those with increased BUB1 expression (log-rank test, p = 0.007; Figure 1D). Kaplan–Meier analysis combining the 2004 WHO grading system with BUB1 expression demonstrated that low-grade NMIBC patients with low BUB1 expression had the lowest rate of progression, whereas high-grade NMIBC patients with high BUB1 expression had the highest rate of progression (log-rank test, p < 0.0001; Figure 1E).

2.3. Validation Test

The expression levels of BUB1 in NMIBC were validated using public data (GSE13507 and E-MTAT-4321).

2.3.1. BUB1 mRNA Expression in the GSE13507 Dataset: Internal Validation

BUB1 mRNA expression was significantly higher in NMIBC than in normal controls in the GSE13507 cohort (Figure 2A), indicating that the upregulation of BUB1 may be an important event during NMIBC pathogenesis. BUB1 expression was significantly higher in NMIBC patients with T1 stage and a high grade than in those with Ta stage and a low grade (both p < 0.05; Figure 2B,C). Because tumor stage and grade are the most common predictors of tumor prognosis, these results suggest that the upregulation of BUB1 is a prognostic indicator of NMIBC. Moreover, univariate Cox regression analysis demonstrated that the BUB1 gene was an independent prognostic variable in NMIBC progression-free survival (PFS) (HR, 15; 95% CI, 1.9–115; p = 0.011; Table 2). The survival plot depicted that higher BUB1 expression in NMIBC patients correlated with worse PFS (log-rank test, p = 0.0009; Figure 2D).

2.3.2. BUB1 mRNA Expression in the E-MTAT-4321 Dataset: External Validation

Similar results were obtained in the E-MTAT-4321 cohort, which showed that high-grade or T1-stage NMIBC patients had higher BUB1 expression levels than low-grade or Ta-stage patients (both p < 0.0001; Figure 3A,B). However, there were no controls in this cohort, and a comparison between NMIBC and controls could not be performed. Univariate Cox regression analysis identified the prognostic significance of BUB1 in NMIBC, with an HR for PFS of 5.7 (95% CI, 2.2–15; p < 0.001; Table 2). PFS analysis showed that the progression rate was declined when BUB1 expression was reduced (log-rank test, both p < 0.0001; Figure 3C). After incorporating tumor stage and grade with BUB1 expression in the E-MTAT-4321 cohort, NMIBC patients in the BUB1 high-grade and T1 stage group showed the worst PFS, whereas those in the BUB1 low-grade and Ta stage group had the best PFS (log-rank test, p < 0.0001; Figure 3D). Patients in the BUB1 high-expression, high-grade group had the worst PFS, whereas those in the BUB1 low-expression, low-grade group had the best PFS (log-rank test, p < 0.0001; Figure 3E).

2.4. BUB1 Inhibits G2/M Cell Cycle Arrest in Human BCa Cells

Two BCa cell lines, 5637 and T24, were used to evaluate the effects of BUB1 on cell cycle progression. The expression of BUB1 was estimated by RT-qPCR. The expression levels of BUB1 were significantly lower in siBUB1-transfected cells than in the siNC group in both BCa cell lines (p < 0.05 each); the knockdown efficiency was 90–95% (Figure 4A,B). Flow cytometry analysis of BCa cell lines indicated that the number of siBUB1-transfected cells in the G2/M phase was significantly increased (p < 0.05; Figure 4C,D), suggesting that the knockdown of BUB1 inhibited the G2/M phase transition. These results indicate that BUB1 caused abnormal regulation of the cell cycle during the G2/M phase, leading to the over-proliferation of cells and the accumulation of abnormal cancer cell numbers, which may underlie the NMIBC pathogenesis and progression.

3. Discussion

NMIBC is a tumor with an extremely heterogeneous biological behavior. Up to 80% of patients experience recurrence, and up to 50% show stage progression even after complete endoscopic resection [18]. Low-grade Ta tumors have a high recurrence rate, but rarely represent a threat to the patient. By contrast, high-grade T1 tumors show increased rates of progression, which lead to high cancer-specific death rates. Thus, the successful management of NMIBC depends on the accurate prediction of prognosis, as well as the proper selection and administration of treatment. The prediction of prognosis and patient stratification are based on clinicopathological characteristics. However, this approach is subject to inter-observer variation, which may cause misdiagnosis and thus unsuitable treatments. Molecular classification methods hold great promise for understanding the disease and designing personalized therapeutics. The aim of the present study was to identify an accurate molecular biomarker for NMIBC prognosis.
The results of the present study show that the expression of BUB1 was higher in NMIBC than in normal controls (all p < 0.05). These results were verified in three independent cohorts, including RNA-seq-based data from the screening cohort, RT-qPCR-based data from the training cohort, and two public datasets (GSE13507 and E-MTAT-4321) from the validation cohort (Figure 1, Figure 2, Figure 3 and Figure S3). These analyses suggest that there is a causal relationship between the upregulation of BUB1 and NMIBC tumorigenesis. Moreover, a high expression of BUB1 correlated with worse clinicopathological features, including a high grade and T1 stage, and with shorter PFS of patients with NMIBC in the training and validation cohorts (all p < 0.05). The risk of progression was higher in NMIBC patients with higher BUB1 expression than in those with lower BUB1 expression, as determined by univariate Cox regression analysis in the training and validation cohorts (range of HR, 5.7–15; all p < 0.05; Table 1 and Table 2). In particular, the HR for BUB1 expression was higher than that for tumor grade in the training cohort (6.076 vs. 5.508; p < 0.05; Table 1). A survival plot was generated to analyze the correlation between NMIBC progression and the combination index of tumor grade and BUB1 expression. The Kaplan–Meier estimator indicated that NMIBC patients with a low grade and lower BUB1 expression had the longest PFS, whereas patients with a high grade and higher BUB1 expression had the shortest PFS in the training cohort, as determined after a long-term follow-up period in two validation cohorts (log-rank test, p < 0.05; Figure 1, Figure 2 and Figure 3). The UROMOL cohort from the E-MTAB-4321 dataset indicated that NMIBC patients with stage Ta and lower BUB1 expression had a good prognosis, whereas patients with stage T1 and higher BUB1 expression had a poor prognosis (log-rank test, p < 0.0001; Figure 3). However, analysis of the Chungbuk National University Hospital (CBNUH) microarray cohort from the GSE13507 dataset showed no differences in PFS between different combination indexes (tumor stage or grade with BUB1 expression; data not shown). Taken together, these results support the prognostic power of BUB1 expression for predicting NMIBC progression, which could assist clinicians in designing optimal and timely treatments.
Dysregulation of the cell cycle leads to the abnormal proliferation and division of cells, especially tumor cells [19,20]. The chromosomes replicated and were evenly distributed into daughter cells during the M phase of a cell cycle [21]. However, imprecise segregation of chromosomes can lead to the loss or gain of whole chromosomes, a status referred to as aneuploidy [21,22]. Aneuploidy is observed in over 80% of human cancers, and is associated with poor clinical outcomes [23,24]. Aberrant expression or mutation of BUB1, which plays a crucial role in mitosis, is an important cause of aneuploidy [10,25]. BUB1 is a core component of the mitotic checkpoint, which is a surveillance system developed by eukaryotic cells to ensure faithful chromosome segregation, and this checkpoint could delay anaphase onset until all kinetochores are properly attached to the microtubules emanating from opposite spindle poles [5,26]. Abnormal BUB1 levels could affect the mitotic checkpoint, resulting in aberrant cell cycle progression and the conversion of normal cells into malignant cells. In the present study, BUB1 prevented G2/M cell cycle arrest in BCa cells and promoted the proliferation of two BCa cell lines (p < 0.05; Figure 4). This could be attributed to BUB1-induced aneuploidy of BCa cells during the G2/M phase, although the exact morphological alterations of BCa cells were not analyzed. Future studies should address this issue and examine whether high BUB1 levels can drive neoplastic transformation and promote tumor aggressiveness.
The deregulation of BUB1 expression occurs at a higher incidence than mutations in BUB1. BUB1 expression is decreased in lung, colon, and pancreatic tumors [27,28]. However, the upregulation of mitotic factors is a more common episode in human cancers. BUB1 gene levels were found to be overexpressed in the breast and gastric cancers, as well as in lymphomas [29,30,31]. BUB1 was identified as a prospective prognostic marker whose upregulation is associated with poor clinical outcomes in diverse tumor types [8,32,33,34]. These results support the value of the present study for explaining the role of BUB1 as an oncogene in BCa.
In conclusion, the present findings provide additional evidence that BUB1 acts as an oncogene in BCa, and could thus serve as an independent prognostic marker for the stratification of NMIBC patients according to favorable and poor prognoses.

4. Materials and Methods

4.1. Study Design

Figure 5 describes the workflow and overall study design. RNA-seq analysis was performed to screen candidate genes that were differentially expressed in patients with NMIBC (n = 16) and in normal controls (n = 8). The analysis identified 270 upregulated and 908 downregulated genes that met the conditions of fold change >2 and p < 0.01. A comparison with 969 genes identified in a previous profiling study of BCa [35] showed that 19 differentially expressed genes in BCa versus normal tissues overlapped with the present data (UHRF1, AURKB, TPX2, BUB1B, KIF20A, CDC20, TK1, CEP55, TTK, CCNB2, HJURP, NUSAP1, TOP2A, PRC1, TACC3, BUB1, MCM2, RECQL4, and SPAG5). Analysis of the biological features of the 19 genes using GO terms showed that they are involved in important steps of the cell cycle, such as nuclear division, spindle organization, and cytokinesis (Supplementary Figure S1). Among the identified genes, BUB1, a novel gene in BCa, was selected for further validation. In the training cohort, the mRNA expression of BUB1 in NMIBC patients (n = 86) and normal controls (n = 15) was estimated using real-time PCR. The prognostic power of BUB1 in NMIBC was assessed in an internal validation cohort (GSE13507) and an external validation cohort (E-MTAB-4321).

4.2. Statistical Analysis

Continuous variables were expressed as the mean ± standard deviation. The normality of the data was estimated by one-sample Kolmogorov–Smirnov tests. Welch’s t-test was used for the statistical analysis of two non-paired samples, and a paired t-test was used for the statistical analysis of paired samples. Error bars indicate the standard error of the mean. The groups were compared in terms of noncontinuous variables by the Chi-squared test. The values of gene expression were natural log-transformed to make the skewed data more normally distributed and to achieve constant variance. The Mann–Whitney U-test was used to examine the expression of BUB1 in NMIBC tissues versus control tissues by real-time PCR. Univariate and multivariate Cox proportional hazard regression models were used to evaluate the prognostic significance of the clinicopathological variables. Relative risk was determined by HRs and 95% CIs. Kaplan–Meier survival curves were plotted to determine the prognostic value of the genetic biomarker and compared using the log-rank test. Statistical analyses were performed using GraphPad Prism 8 (GraphPad Software, San Diego, CA, USA) and IBM SPSS Statistics ver. 24.0 (IBM Co., Armonk, NY, USA). Specifically, the box plots and plots of the cell experiment were depicted using GraphPad Prism 8, and the survival plots were depicted using GraphPad Prism 8 and IBM SPSS Statistics ver. 24.0. p-values < 0.05 were considered significant.
Other materials and methods can be seen in online-only supplementary files (Supplementary materials and methods, online only).

Supplementary Materials

Author Contributions

Conceptualization, X.-M.P., C.Y., K.K. (Kyuho Kang) and Y.-J.K.; methodology, X.-M.P., C.Y. and Y.J.B.; software, X.-M.P., C.Y., H.Y.L. and K.K. (Kyeong Kim); validation, J.N. and J.L.; formal analysis, X.-M.P. and C.Y.; investigation, S.J.Y., S.-C.L. and Y.-J.K.; resources, K.K. (Kyuho Kang) and Y.-J.K.; data curation, H.W.K. and W.T.K.; writing—original draft preparation, X.-M.P. and C.Y.; writing—review and editing, K.K. (Kyuho Kang) and Y.-J.K.; visualization, X.-M.P. and C.Y.; supervision, S.J.Y., S.-C.L. and Y.-J.K.; project administration, K.K. (Kyuho Kang) and Y.-J.K.; funding acquisition, Y.-J.K. All authors have read and agreed to the published version of the manuscript.

Funding

This research was supported by the Basic Science Research Program through the National Research Foundation of Korea (NRF), funded by the Ministry of Education, grant number 2018R1D1A1B07043906; and grant number 2021R1I1A1A01050891.

Institutional Review Board Statement

The study was conducted according to the guidelines of the Declaration of Helsinki, and approved by the Institutional Review Board of Chungbuk National University Hospital (GR2010-12-010 and GR2020-07-018).

Informed Consent Statement

Informed consent was obtained from all subjects involved in the study.

Data Availability Statement

The data presented in this study are available on request from the corresponding author.

Acknowledgments

Not applicable.

Conflicts of Interest

The authors declare no conflict of interest.

References

  1. Jallepalli, P.V.; Lengauer, C. Chromosome segregation and cancer: Cutting through the mystery. Nat. Rev. Cancer 2001, 1, 109–117. [Google Scholar] [CrossRef]
  2. Lengauer, C.; Kinzler, K.W.; Vogelstein, B. Genetic instabilities in human cancers. Nature 1998, 396, 643–649. [Google Scholar] [CrossRef] [PubMed]
  3. Masuda, A.; Takahashi, T. Chromosome instability in human lung cancers: Possible underlying mechanisms and potential consequences in the pathogenesis. Oncogene 2002, 21, 6884–6897. [Google Scholar] [CrossRef] [PubMed] [Green Version]
  4. Kops, G.J.; Weaver, B.A.; Cleveland, D.W. On the road to cancer: Aneuploidy and the mitotic checkpoint. Nat. Rev. Cancer 2005, 5, 773–785. [Google Scholar] [CrossRef]
  5. Bolanos-Garcia, V.M.; Blundell, T.L. BUB1 and BUBR1: Multifaceted kinases of the cell cycle. Trends Biochem. Sci. 2011, 36, 141–150. [Google Scholar] [CrossRef] [Green Version]
  6. King, R.W. When 2 + 2 = 5: The origins and fates of aneuploid and tetraploid cells. Biochim. Biophys. Acta 2008, 1786, 4–14. [Google Scholar] [CrossRef] [PubMed] [Green Version]
  7. Han, J.Y.; Han, Y.K.; Park, G.-Y.; Kim, S.D.; Lee, C.G. Bub1 is required for maintaining cancer stem cells in breast cancer cell lines. Sci. Rep. 2015, 5, 1–10. [Google Scholar] [CrossRef] [Green Version]
  8. Wang, Z.; Katsaros, D.; Shen, Y.; Fu, Y.; Canuto, E.M.; Benedetto, C.; Lu, L.; Chu, W.-M.; Risch, H.A.; Yu, H. Biological and clinical significance of MAD2L1 and BUB1, genes frequently appearing in expression signatures for breast cancer prognosis. PLoS ONE 2015, 10, e0136246. [Google Scholar] [CrossRef] [PubMed]
  9. Zhu, L.J.; Pan, Y.; Chen, X.Y.; Hou, P.F. BUB1 promotes proliferation of liver cancer cells by activating SMAD2 phosphorylation. Oncol. Lett. 2020, 19, 3506–3512. [Google Scholar] [CrossRef]
  10. Peng, X.; Wang, J.; Li, D.; Chen, X.; Liu, K.; Zhang, C.; Lai, Y. Identification of grade-related genes and construction of a robust genomic-clinicopathologic nomogram for predicting recurrence of bladder cancer. Medicine 2020, 99, e23179. [Google Scholar] [CrossRef]
  11. Cancer Statistics. Available online: https://www.cancer.gov/about-cancer/understanding/statistics (accessed on 25 September 2020).
  12. Bryan, R.T.; Collins, S.I.; Daykin, M.C.; Zeegers, M.P.; Cheng, K.K.; Wallace, D.M.A.; Sole, G.M. Mechanisms of recurrence of Ta/T1 bladder cancer. Ann. R. Coll. Surg. Engl. 2010, 92, 519–524. [Google Scholar] [CrossRef] [Green Version]
  13. Van Lingen, A.V.; Arends, T.J.; Witjes, J.A. Expert review, an update in current and developing intravesical therapies for non-muscle-invasive bladder cancer. Expert Rev. Anticancer Ther. 2013, 13, 1257–1268. [Google Scholar] [CrossRef]
  14. Zagouri, F.; Peroukidis, S.; Tzannis, K.; Kouloulias, V.; Bamias, A. Current clinical practice guidelines on chemotherapy and radiotherapy for the treatment of non-metastatic muscle-invasive urothelial cancer: A systematic review and critical evaluation by the Hellenic Genito-Urinary Cancer Group (HGUCG). Crit. Rev. Oncol. Hematol. 2015, 93, 36–49. [Google Scholar] [CrossRef] [PubMed]
  15. Babjuk, M.; Böhle, A.; Burger, M.; Compérat, E.; Kaasinen, E.; Palou, J. EAU Guidelines on Non-Muscle Invasive (Ta, T1, CIS) Bladder Cancer; EAU Guidel. Edn. presented at the EAU Annual Congress Amsterdam 2020; EAU Guidelines Office: Arnhem, The Netherlands, 2020; ISBN 978-94-92671-07-3. Available online: http://uroweb.org/guidelines/compilations-of-all-guidelines/ (accessed on 23 November 2021).
  16. Van Rhijn, B.W. Combining molecular and pathologic data to prognosticate non-muscle-invasive bladder cancer. Urol. Oncol. 2012, 30, 518–523. [Google Scholar] [CrossRef]
  17. Shi, R.; Bao, X.; Rogowski, P.; Schäfer, C.; Schmidt-Hegemann, N.-S.; Unger, K.; Lu, S.; Sun, J.; Buchner, A.; Stief, C. Establishment and Validation of an Individualized Cell Cycle Process-Related Gene Signature to Predict Cancer-Specific Survival in Patients with Bladder Cancer. Cancers 2020, 12, 1146. [Google Scholar] [CrossRef]
  18. Babjuk, P.M.; Definition of Very High-Risk and Refractory NMIBC. Plenary Session 03—Challenges Across the Spectrum of Bladder Cancer. Available online: https://www.urotoday.com/conference-highlights/eau-2020/bladder-cancer/123158-eau-2020-definition-of-very-high-risk-and-refractory-non-muscle-invasive-bladder-cancer.html (accessed on 18 July 2020).
  19. Otto, T.; Sicinski, P. Cell cycle proteins as promising targets in cancer therapy. Nat. Rev. Cancer 2017, 17, 93. [Google Scholar] [CrossRef] [PubMed] [Green Version]
  20. Jeggo, P.A.; Pearl, L.H.; Carr, A.M. DNA repair, genome stability and cancer: A historical perspective. Nat. Rev. Cancer 2016, 16, 35. [Google Scholar] [CrossRef] [Green Version]
  21. Ricke, R.M.; van Ree, J.H.; van Deursen, J.M. Whole chromosome instability and cancer: A complex relationship. Trends Genet. 2008, 24, 457–466. [Google Scholar] [CrossRef] [PubMed] [Green Version]
  22. Ben-David, U.; Amon, A. Context is everything: Aneuploidy in cancer. Nat. Rev. Genet. 2020, 21, 44–62. [Google Scholar] [CrossRef] [PubMed]
  23. Holland, A.J.; Cleveland, D.W. Boveri revisited: Chromosomal instability, aneuploidy and tumorigenesis. Nat. Rev. Mol. Cell Biol. 2009, 10, 478–487. [Google Scholar] [CrossRef] [PubMed] [Green Version]
  24. Schvartzman, J.-M.; Sotillo, R.; Benezra, R. Mitotic chromosomal instability and cancer: Mouse modelling of the human disease. Nat. Rev. Cancer 2010, 10, 102–115. [Google Scholar] [CrossRef] [Green Version]
  25. Ricke, R.M.; Jeganathan, K.B.; van Deursen, J.M. Bub1 overexpression induces aneuploidy and tumor formation through Aurora B kinase hyperactivation. J. Cell Biol. 2011, 193, 1049–1064. [Google Scholar]
  26. Nezi, L.; Musacchio, A. Sister chromatid tension and the spindle assembly checkpoint. Curr. Opin. Cell Biol. 2009, 21, 785–795. [Google Scholar] [CrossRef] [PubMed]
  27. Shichiri, M.; Yoshinaga, K.; Hisatomi, H.; Sugihara, K.; Hirata, Y. Genetic and epigenetic inactivation of mitotic checkpoint genes hBUB1 and hBUBR1 and their relationship to survival. Cancer Res. 2002, 62, 13–17. [Google Scholar] [PubMed]
  28. Hempen, P.M.; Kurpad, H.; Calhoun, E.S.; Abraham, S.; Kern, S.E. A double missense variation of the BUB1 gene and a defective mitotic spindle checkpoint in the pancreatic cancer cell line Hs766T. Hum. Mutat. 2003, 21, 445. [Google Scholar] [PubMed]
  29. Alizadeh, A.A.; Eisen, M.B.; Davis, R.E.; Ma, C.; Lossos, I.S.; Rosenwald, A.; Boldrick, J.C.; Sabet, H.; Tran, T.; Yu, X. Distinct types of diffuse large B-cell lymphoma identified by gene expression profiling. Nature 2000, 403, 503–511. [Google Scholar]
  30. Shigeishi, H.; Oue, N.; Kuniyasu, H.; Wakikawa, A.; Yokozaki, H.; Ishikawa, T.; Yasui, W. Expression of Bub1 gene correlates with tumor proliferating activity in human gastric carcinomas. Pathobiology 2001, 69, 24–29. [Google Scholar] [CrossRef]
  31. Van De Vijver, M.J.; He, Y.D.; Van’t Veer, L.J.; Dai, H.; Hart, A.A.; Voskuil, D.W.; Schreiber, G.J.; Peterse, J.L.; Roberts, C.; Marton, M.J. A gene-expression signature as a predictor of survival in breast cancer. N. Engl. J. Med. 2002, 347, 1999–2009. [Google Scholar] [PubMed] [Green Version]
  32. Piao, J.; Zhu, L.; Sun, J.; Li, N.; Dong, B.; Yang, Y.; Chen, L. High expression of CDK1 and BUB1 predicts poor prognosis of pancreatic ductal adenocarcinoma. Gene 2019, 701, 15–22. [Google Scholar] [CrossRef]
  33. Li, L.; Xu, D.-B.; Zhao, X.-L.; Hao, T.-Y. Combination analysis of Bub1 and Mad2 expression in endometrial cancer: Act as a prognostic factor in endometrial cancer. Arch. Gynecol. Obstet. 2013, 288, 155–165. [Google Scholar] [CrossRef] [PubMed]
  34. Fujibayashi, Y.; Isa, R.; Nishiyama, D.; Sakamoto-Inada, N.; Kawasumi, N.; Yamaguchi, J.; Kuwahara-Ota, S.; Matsumura-Kimoto, Y.; Tsukamoto, T.; Chinen, Y. Aberrant BUB1 Overexpression Promotes Mitotic Segregation Errors and Chromosomal Instability in Multiple Myeloma. Cancers 2020, 12, 2206. [Google Scholar]
  35. Kim, W.J.; Kim, E.J.; Kim, S.K.; Kim, Y.J.; Ha, Y.S.; Jeong, P.; Kim, M.J.; Yun, S.J.; Lee, K.M.; Moon, S.K.; et al. Predictive value of progression-related gene classifier in primary non-muscle invasive bladder cancer. Mol. Cancer 2010, 9, 3. [Google Scholar] [CrossRef] [PubMed] [Green Version]
Figure 1. Gene expression of BUB1 in the training cohort. (A) BUB1 mRNA expression was significantly higher in NMIBC patients than in normal controls. (B) BUB1 mRNA expression was significantly higher in high-grade NMIBC patients than in low-grade NMIBC patients. (C) BUB1 mRNA expression was lower in NMIBC patients who did not progress to MIBC than in patients with progression. (D) Progression-free survival plot of NMIBC patients. NMIBC patients were divided into two groups according to the expression of BUB1 (upper 50th percentile and lower 50th percentile groups). The progression-free survival of NMIBC patients was significantly higher in the lower BUB1 expression group (log-rank test, p = 0.007). (E) Progression-free survival of NMIBC patients according to combination indexes (tumor grade + BUB1 expression). NMIBC patients were divided into four groups (highest quartile, middle two quartiles, and lowest quartile groups) according to tumor grade and BUB1 expression levels. High-grade NMIBC patients with higher BUB1 expression had a shorter progression-free survival than the middle two quartiles and the lowest quartile groups (log-rank test, p < 0.0001). NMIBC, non-muscle-invasive bladder cancer; MIBC, muscle-invasive bladder cancer. Control samples consisted of normal bladder mucosa samples. p-value determined by the Mann–Whitney test. * p < 0.05, ** p < 0.01, **** p < 0.0001.
Ijms 22 12756 g001
Figure 2. BUB1 gene expression in the internal validation cohort (GSE13507). BUB1 expression was higher in patients with NMIBC than in normal controls (A), in high-grade NMIBC patients than in low-grade NMIBC patients (B), and in stage T1 than in stage Ta patients (C) from the CBNUH microarray (GSE13507 dataset) cohort. (D) A Kaplan–Meier survival plot demonstrated that NMIBC patients with lower BUB1 expression had a lower rate of progression (log-rank test, p = 0.0009). CBNUH, Chungbuk National University Hospital; NAT, normal adjacent tumor; NMIBC, non-muscle-invasive bladder cancer. Results are expressed as the mean with 95% CI. p-values were determined by Welch’s t-test. **** p < 0.0001 and * p < 0.05.
Ijms 22 12756 g002
Figure 3. BUB1 gene expression in the external validation cohort (E-MTAB-4321). BUB1 expression was higher in high-grade NMIBC patients than in low-grade NMIBC patients (A) and in stage T1 than in stage Ta patients (B) from the UROMOL (E-MTAB-4321 dataset) cohort. (C) The Kaplan–Meier survival plot demonstrated that NMIBC patients with lower BUB1 expression had a lower rate of progression (log-rank test, p < 0.0001). (D) The Kaplan–Meier survival plot demonstrated that NMIBC patients with Ta stage and lower BUB1 expression had the lowest progression rates (log-rank test, p < 0.0001). (E) The Kaplan–Meier survival plot demonstrated that NMIBC patients with a low grade and lower BUB1 expression had the lowest progression rates (log-rank test, p < 0.0001). FPKM, fragments per kilobase of transcripts per million mapped reads; NAT, normal adjacent tissue; NMIBC, non-muscle-invasive bladder cancer. Results are expressed as the mean with 95% CI. p-values were determined by Welch’s t-test. **** p < 0.0001.
Ijms 22 12756 g003
Figure 4. BUB1 promotes bladder cancer cell proliferation by accelerating the G2/M transition of the cell cycle. BUB1 expression was inhibited by siRNA transfection in 5637 (A) and T24 cells (B). Cell cycle progression assay of 5637 (C) and T24 (D) cells transfected with NC or BUB1 siRNA. Cell cycle analysis was performed by flow cytometry. Error bar: mean value with SEM. NC, non-targeting control; SEM, standard error of the mean. p-values were determined by Welch’s t-test. * p < 0.05, *** p < 0.001, **** p < 0.0001.
Ijms 22 12756 g004
Figure 5. Overall study design. a RNA-seq analysis. * Cases histologically verified as urothelial carcinoma. To reduce confounding factors affecting the analyses and to delineate a more homogeneous study population, patients diagnosed with other cancers before or after urothelial carcinoma diagnosis were excluded. Tumors were staged as Ta or T1 according to the 2017 TNM Classification. £ Normal adjacent tissue, NAT. # Normal bladder mucosae.
Ijms 22 12756 g005
Table 1. Univariate and multivariate Cox regression analyses of factors predicting NMIBC progression.
VariablesUnivariate Cox AnalysisMultivariate Cox Analysis
HR (95% CI)p-ValueHR (95% CI)p-Value
Age
<65 (Ref.) vs. >65
1.946 (0.661–5.722)0.227
Gender
Male (Ref.) vs. Female
1.872 (0.520–6.737)0.337
Tumor size
≤1 cm (Ref.) vs. 2–3 cm
1.563 (0.476–4.536)0.670
Multiplicity
SingleRef.
2–7
>7
1.664 (0.437–6.326)
5.178 (0.890–30.116)
0.455
0.067
2004 WHO grade
Low (Ref.) vs. High
5.808 (2.045–16.493)0.001 *4.629 (1.593–13.450)0.005 *
Stage
Ta (Ref.) vs. T1
0.765 (0.261–2.243)0.626
BCG
No (Ref.) vs. Yes
1.415 (0.474–4.225)0.534
BUB1 expression
Low expression (Ref.) vs. High expression
6.076 (1.367–27.007)0.018 *4.642 (1.021–21.097)0.047 *
BCG, Bacillus Calmette–Guerin; CI, confidence interval; HR, hazard ratio; Ref., reference. * p < 0.05.
Table 2. Univariate Cox regression analyses to predict NMIBC progression in the validation cohorts.
BUB1 Expression
Low Expression (Ref.) vs. High Expression
Univariate Cox Analysis
HR (95% CI)p-Value
Internal validation cohort a
(n = 103)
15 (1.9–115)0.011 *
External validation cohort b
(n = 450)
5.7 (2.2–15)<0.001 *
a, GSE13507 dataset; b, E-MTAB-4321. CI, confidence interval; HR, hazard ratio; Ref., reference. * p < 0.05 was considered significant.
Publisher’s Note: MDPI stays neutral with regard to jurisdictional claims in published maps and institutional affiliations.

