
An ABA Functional Analogue B2 Enhanced Salt Tolerance by Inducing the Root Elongation and Reducing Peroxidation Damage in Maize Seedlings

 and
and 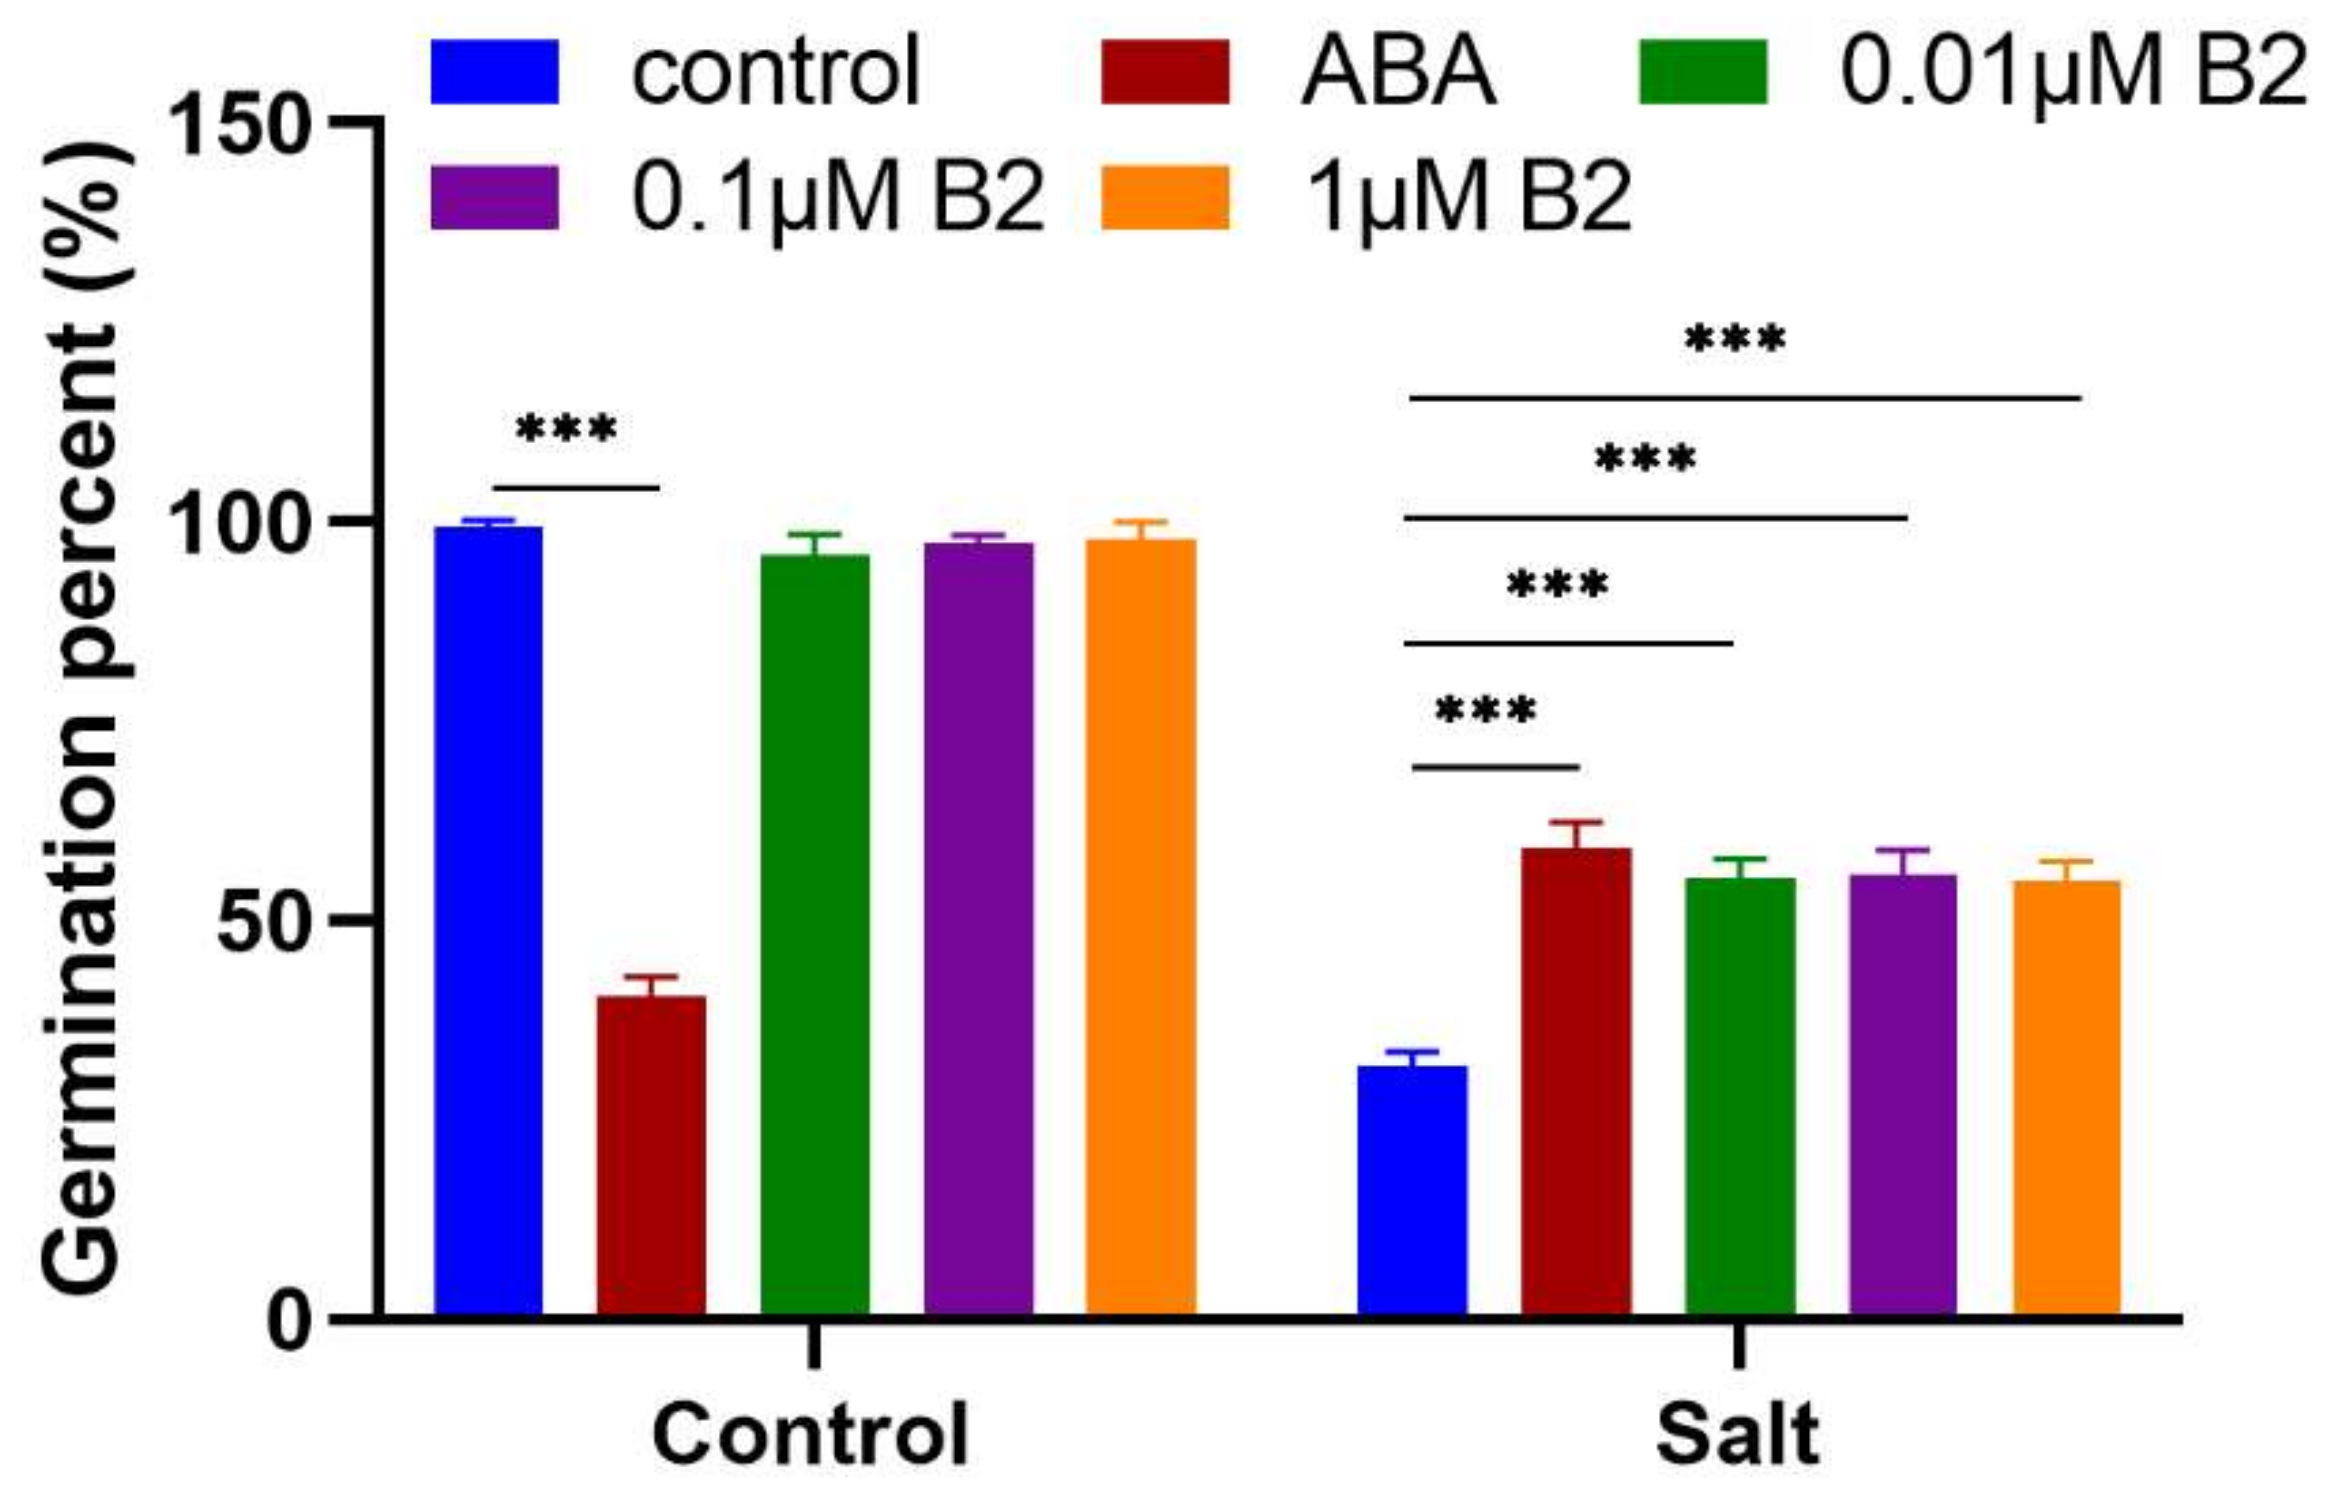
Abstract
:1. Introduction
2. Results
2.1. B2 Improved Seed Germination under Salt Stress Conditions
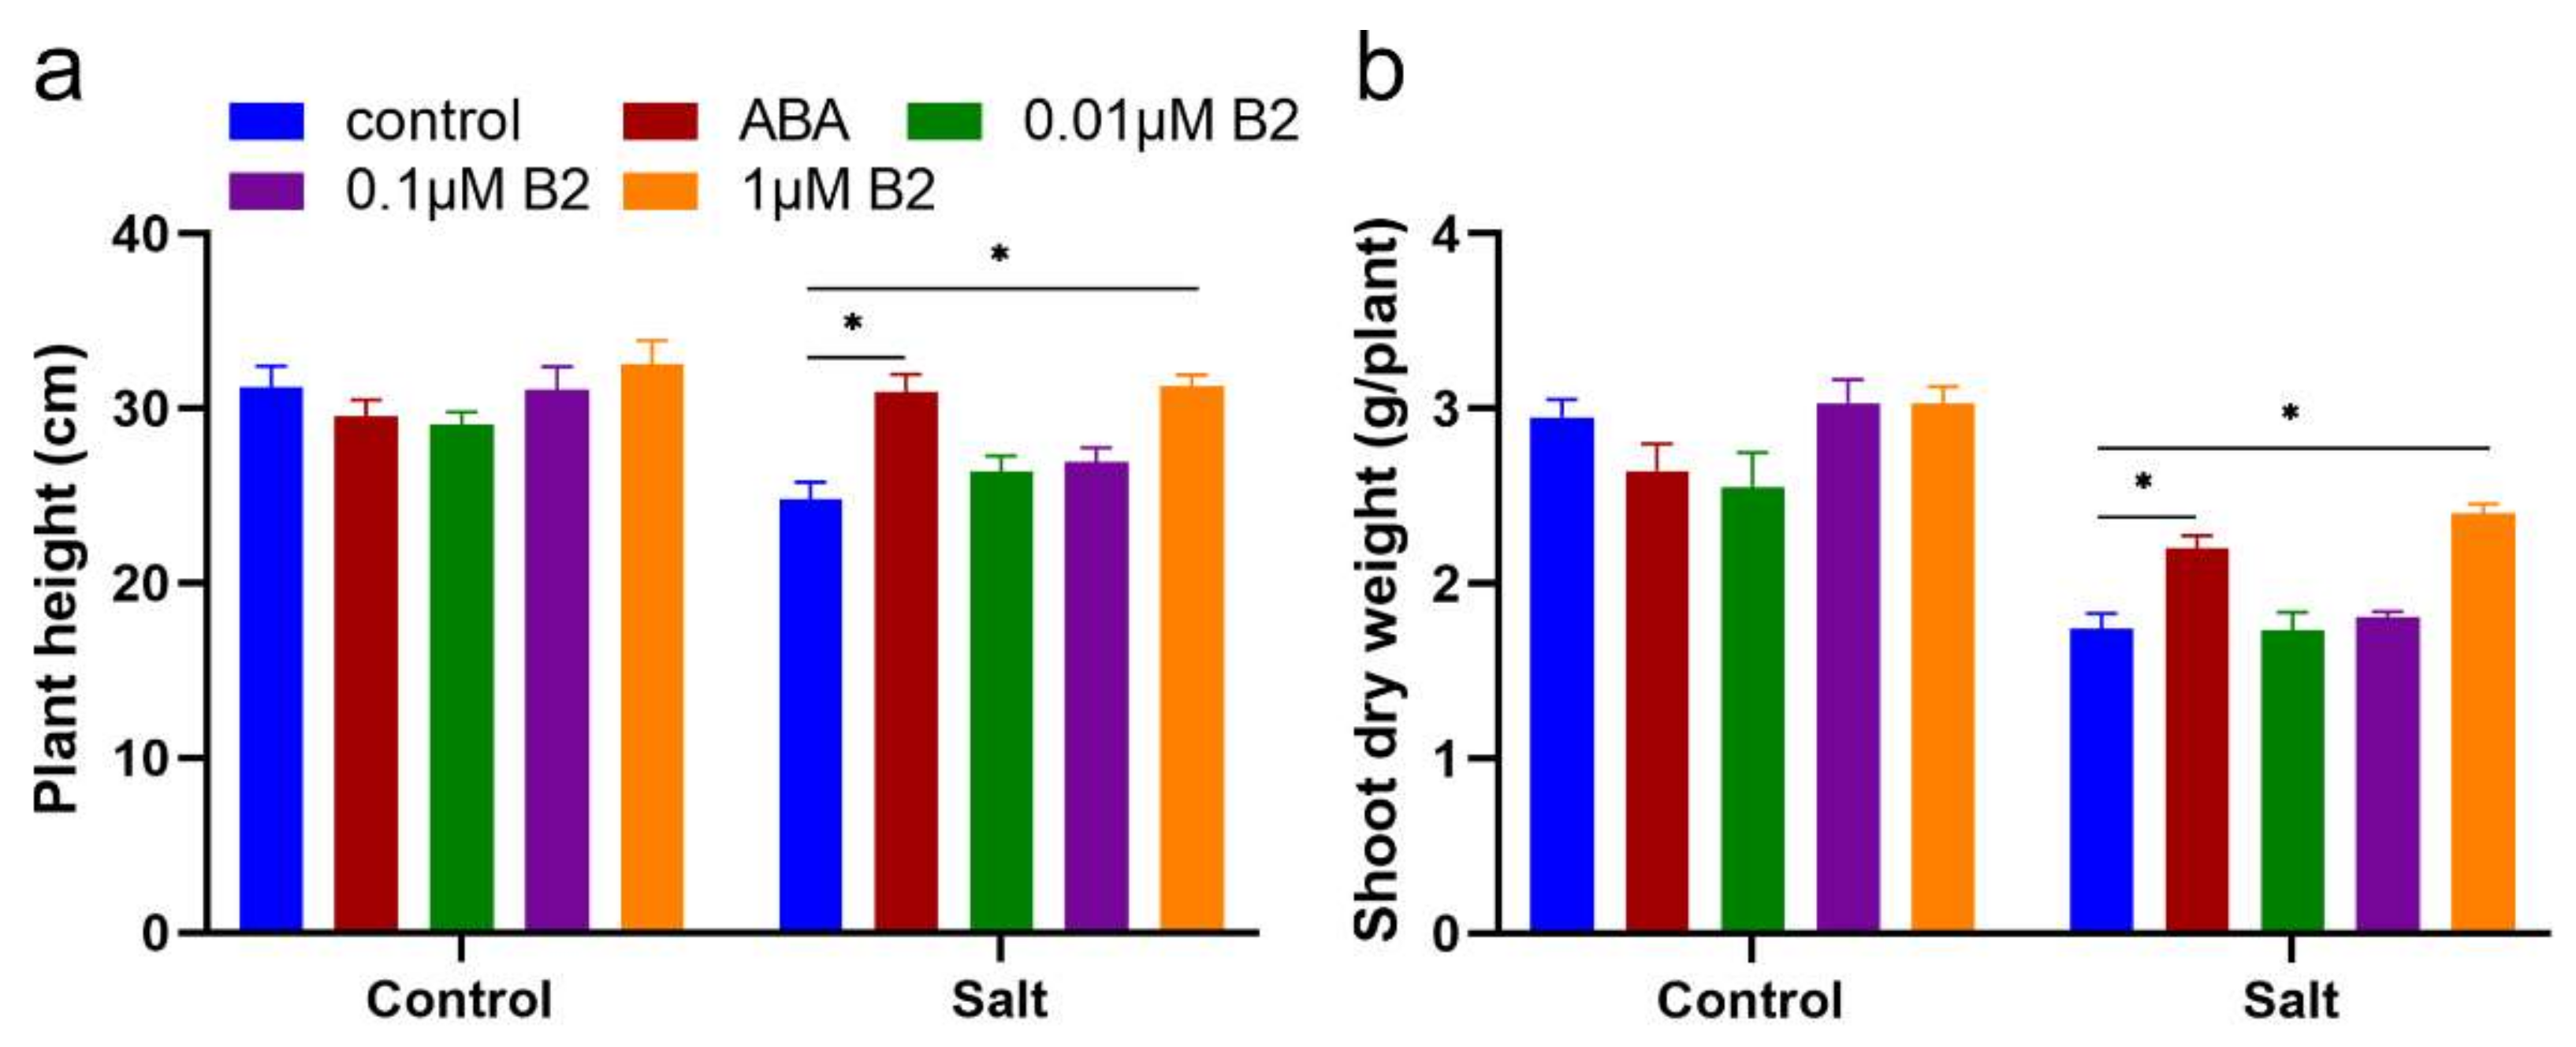
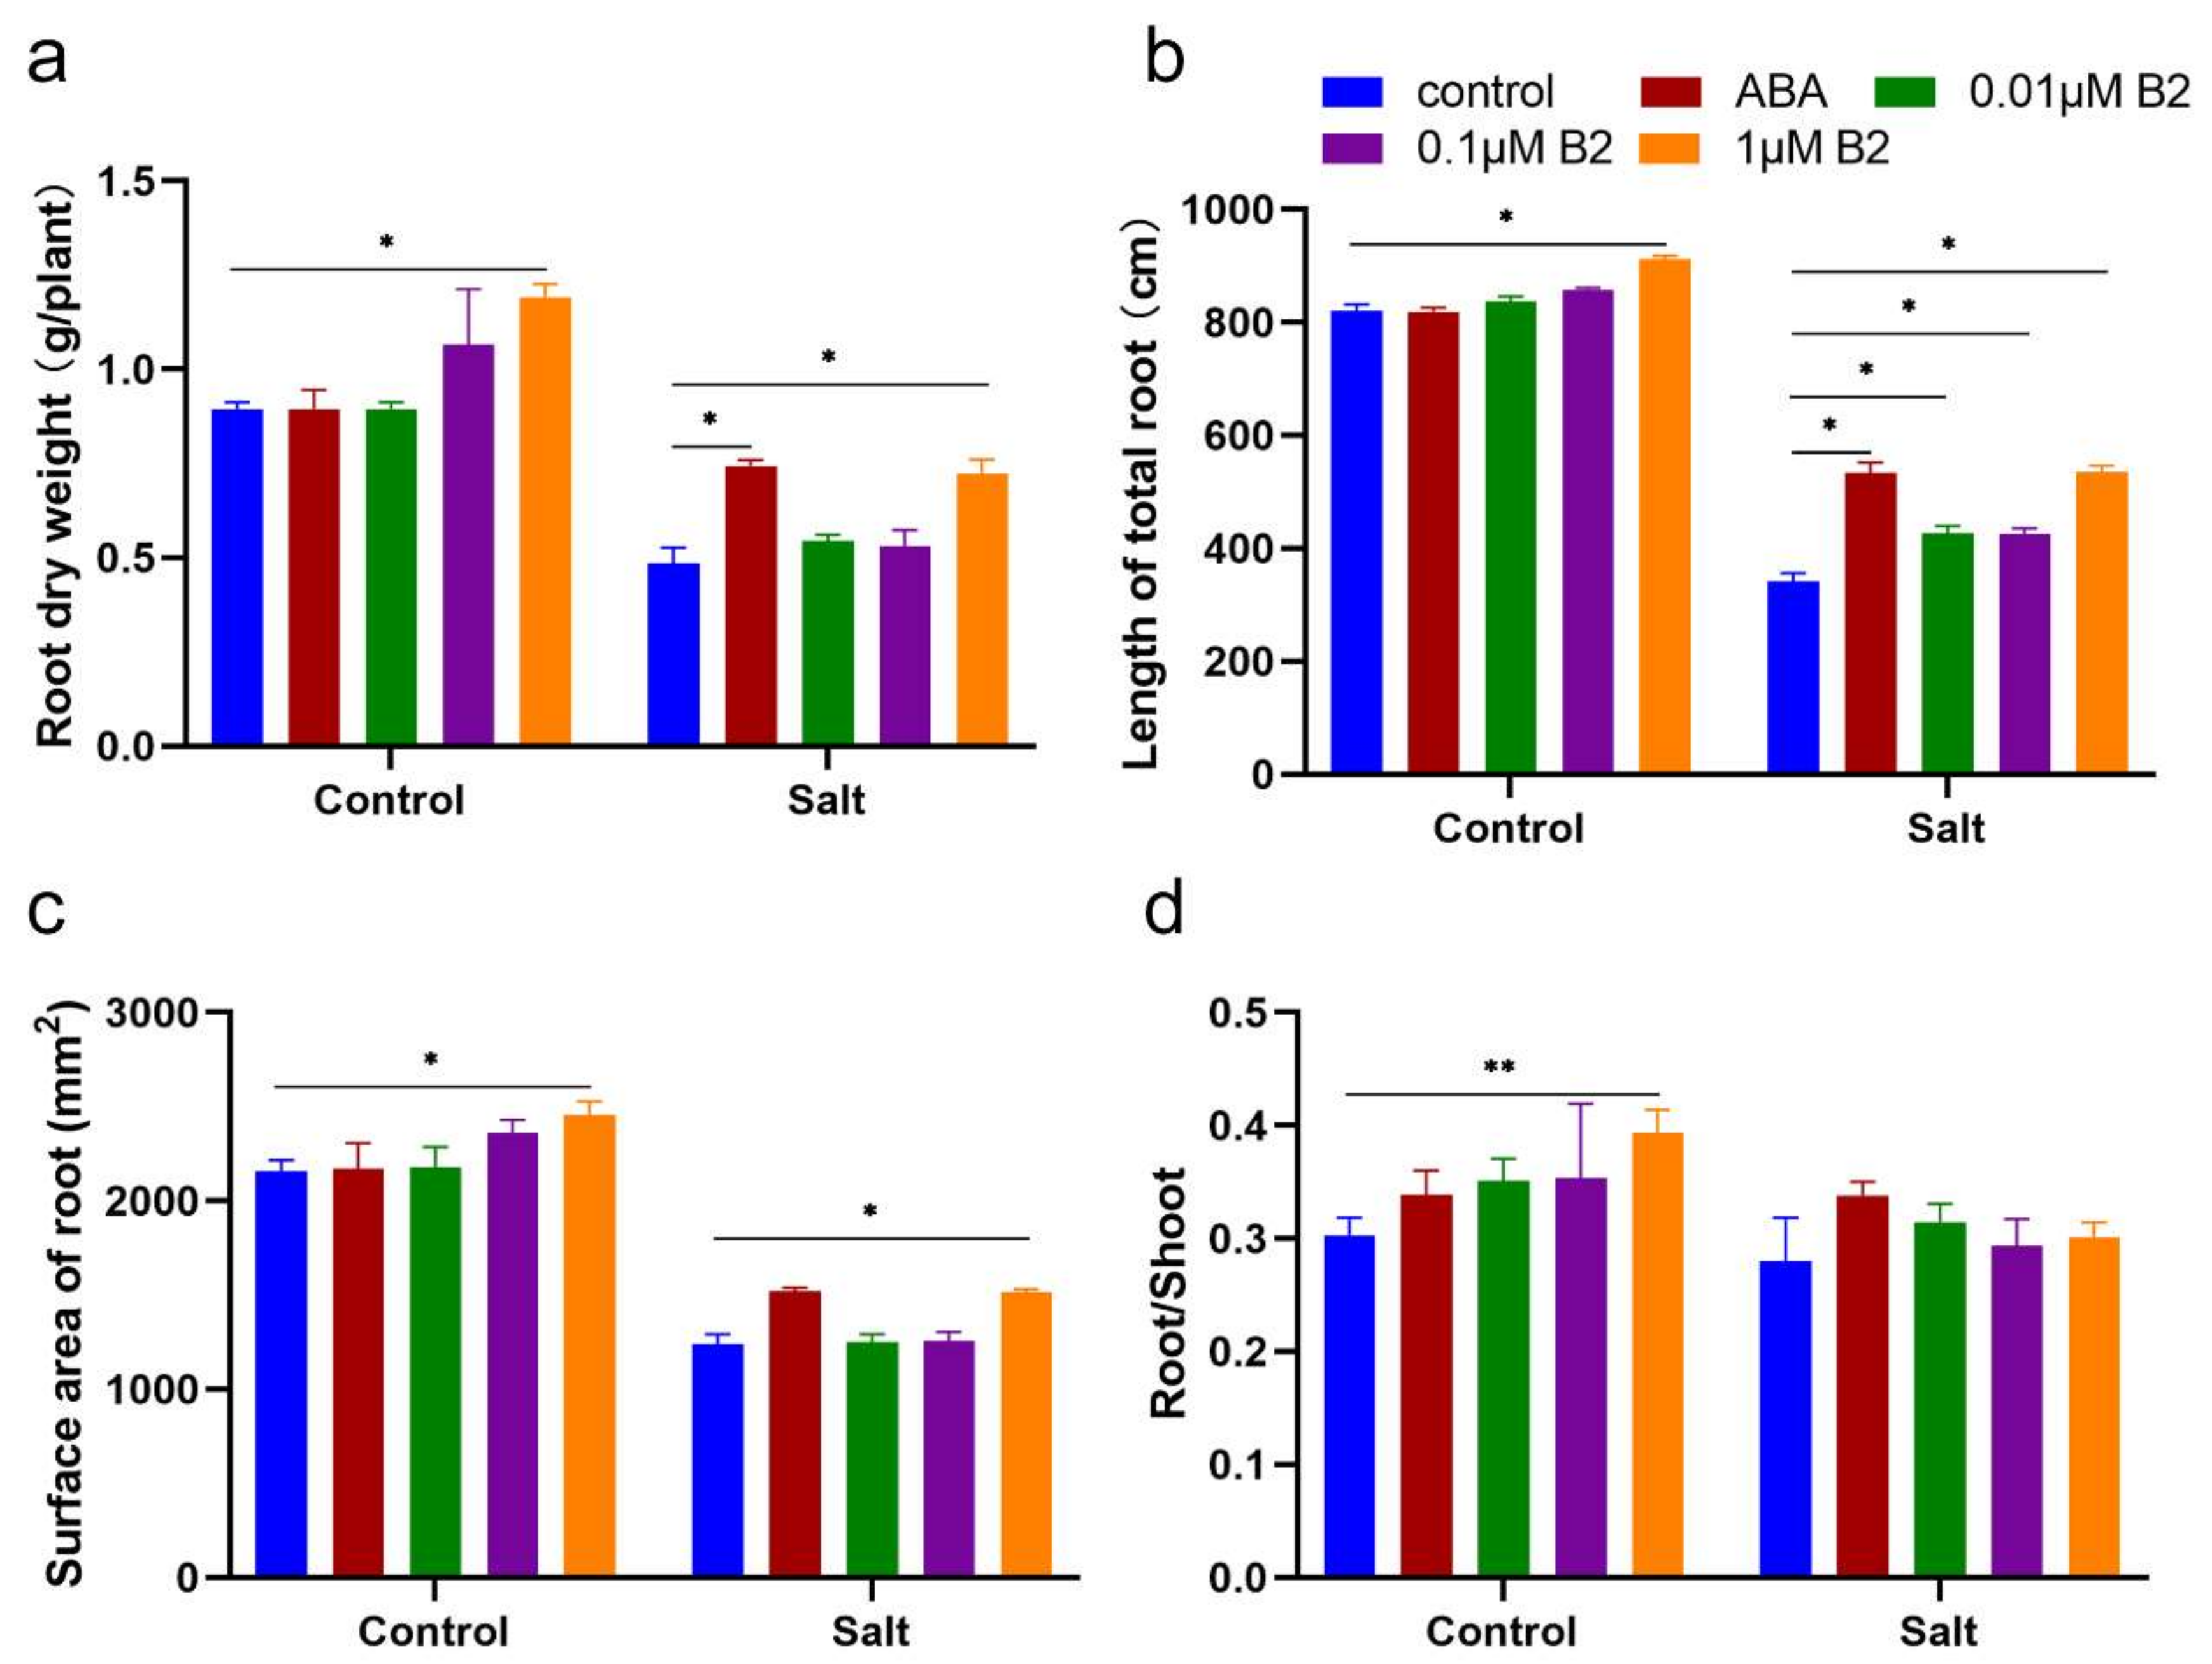
2.2. B2 Improved the Biomass of Maize Seedlings under Salt Stress
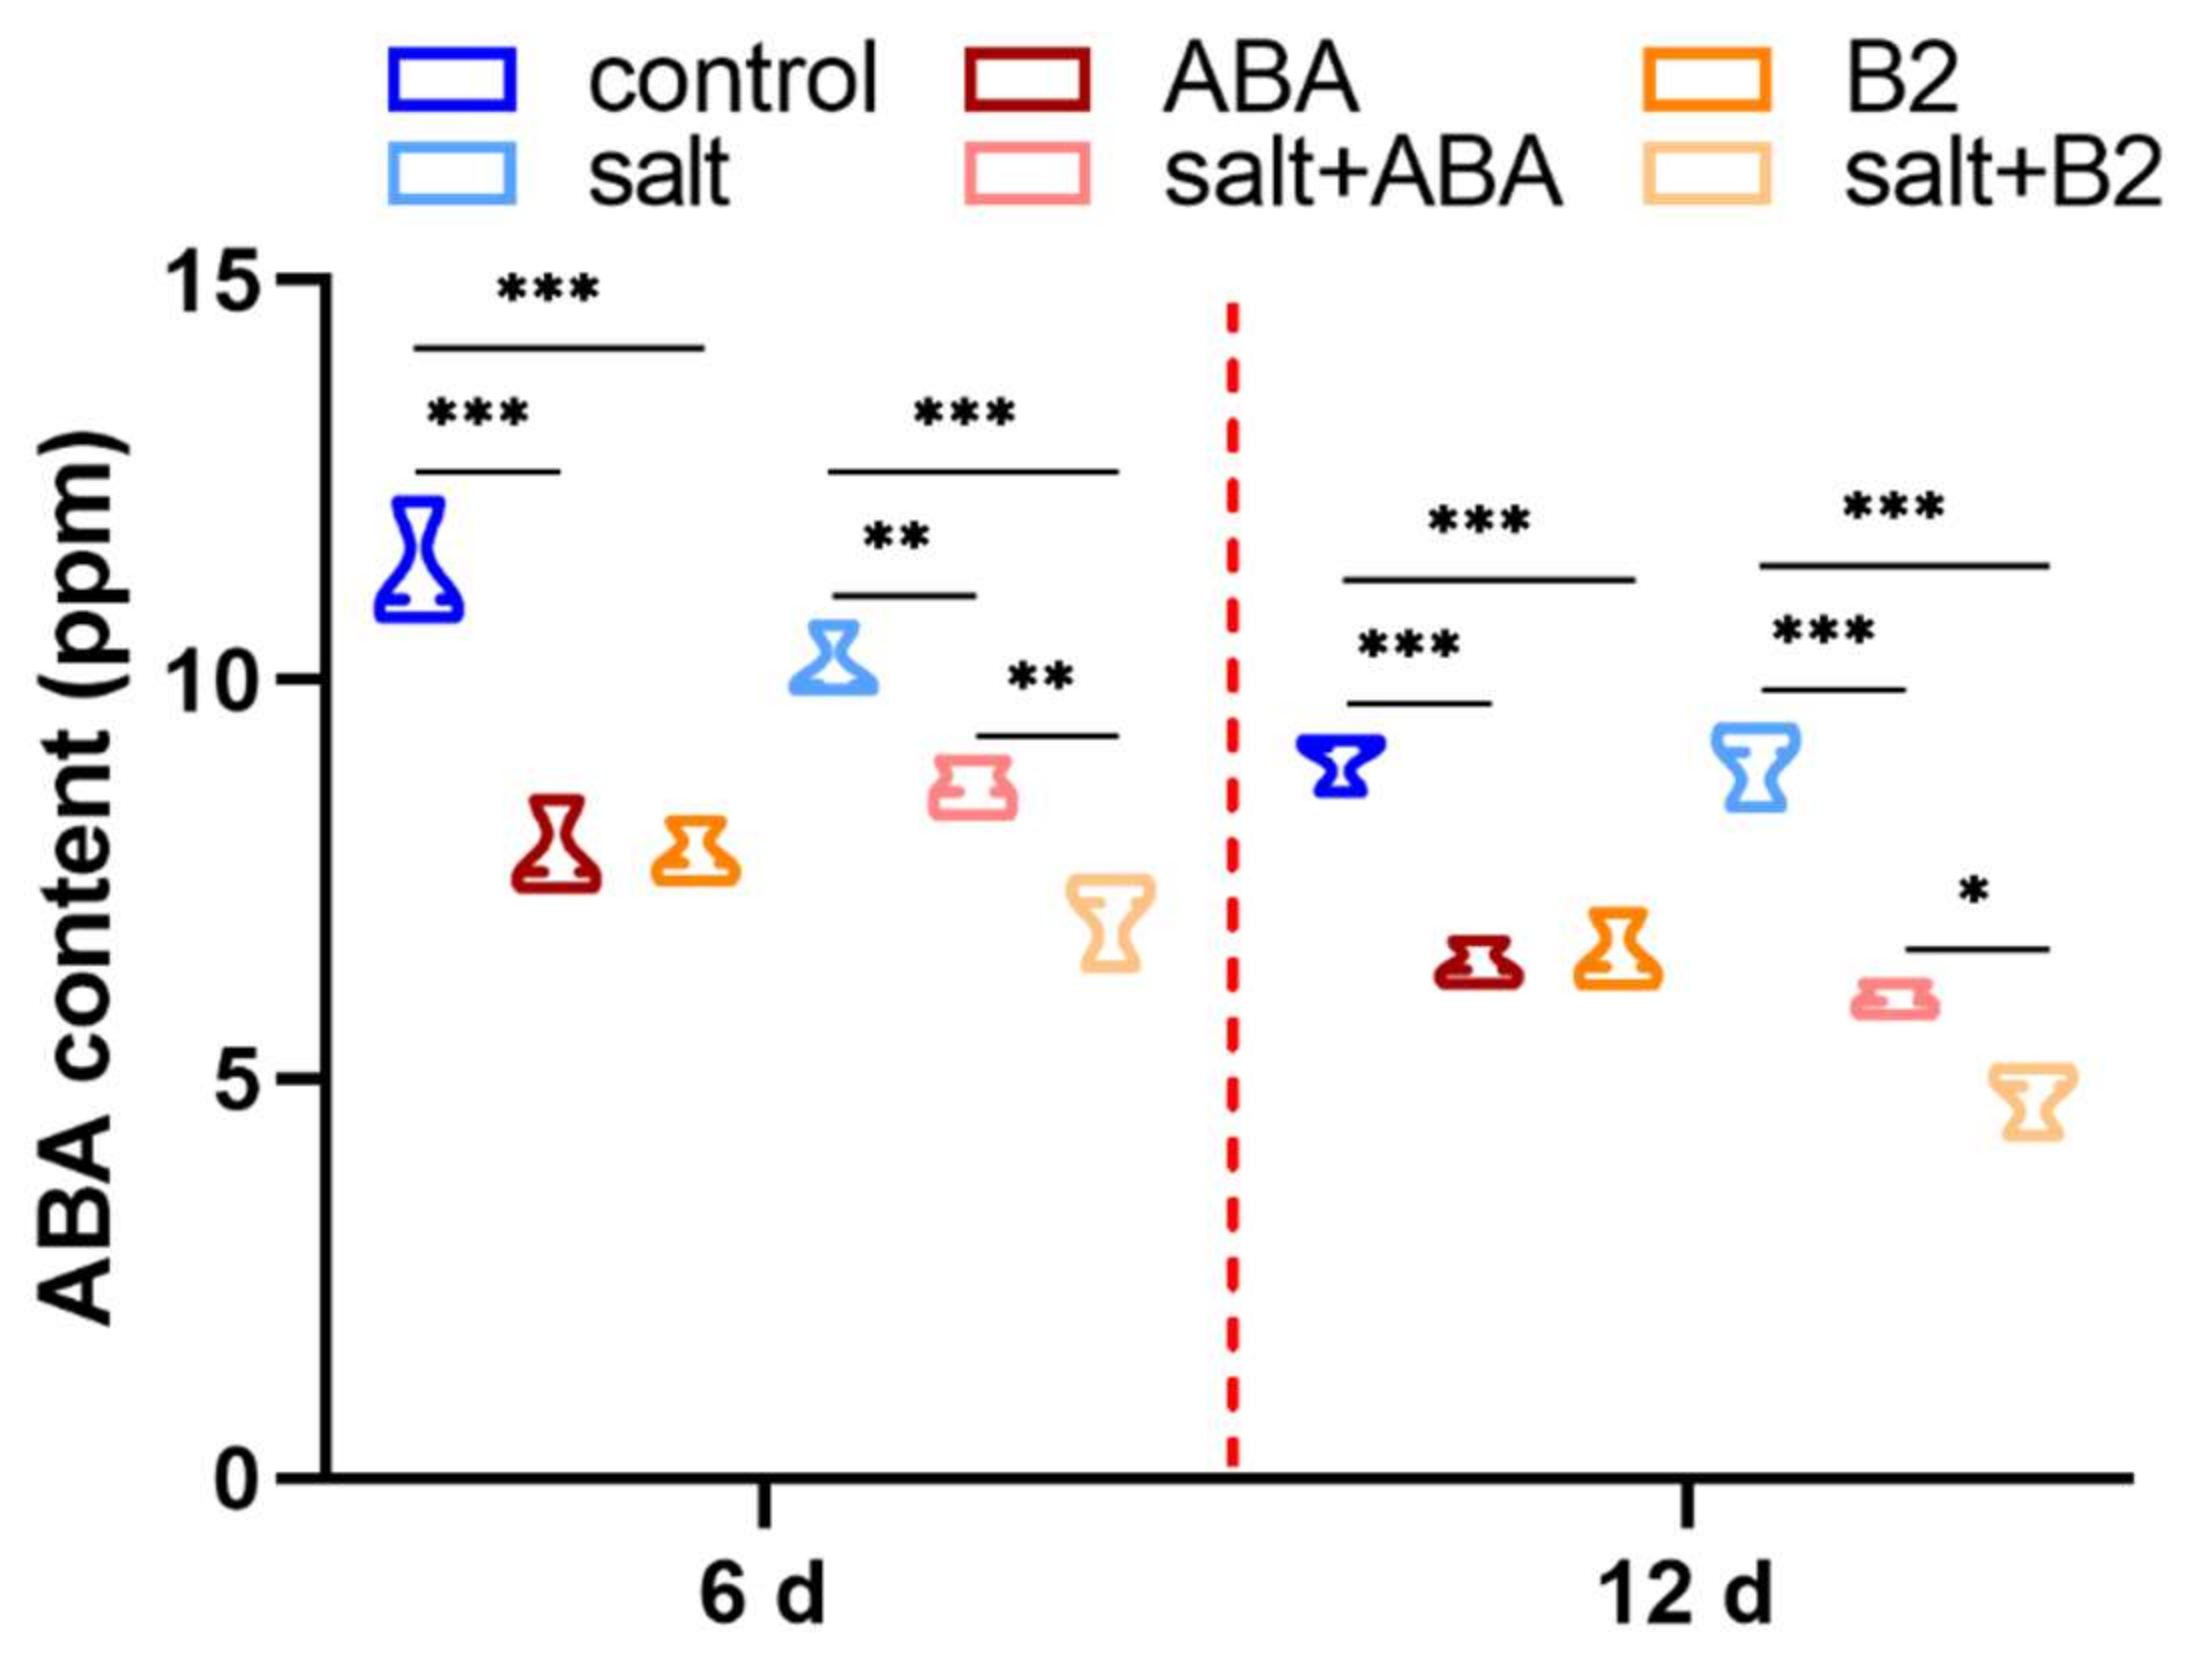
2.3. The Endogenous Hormone ABA Level Changed with B2 Treatment
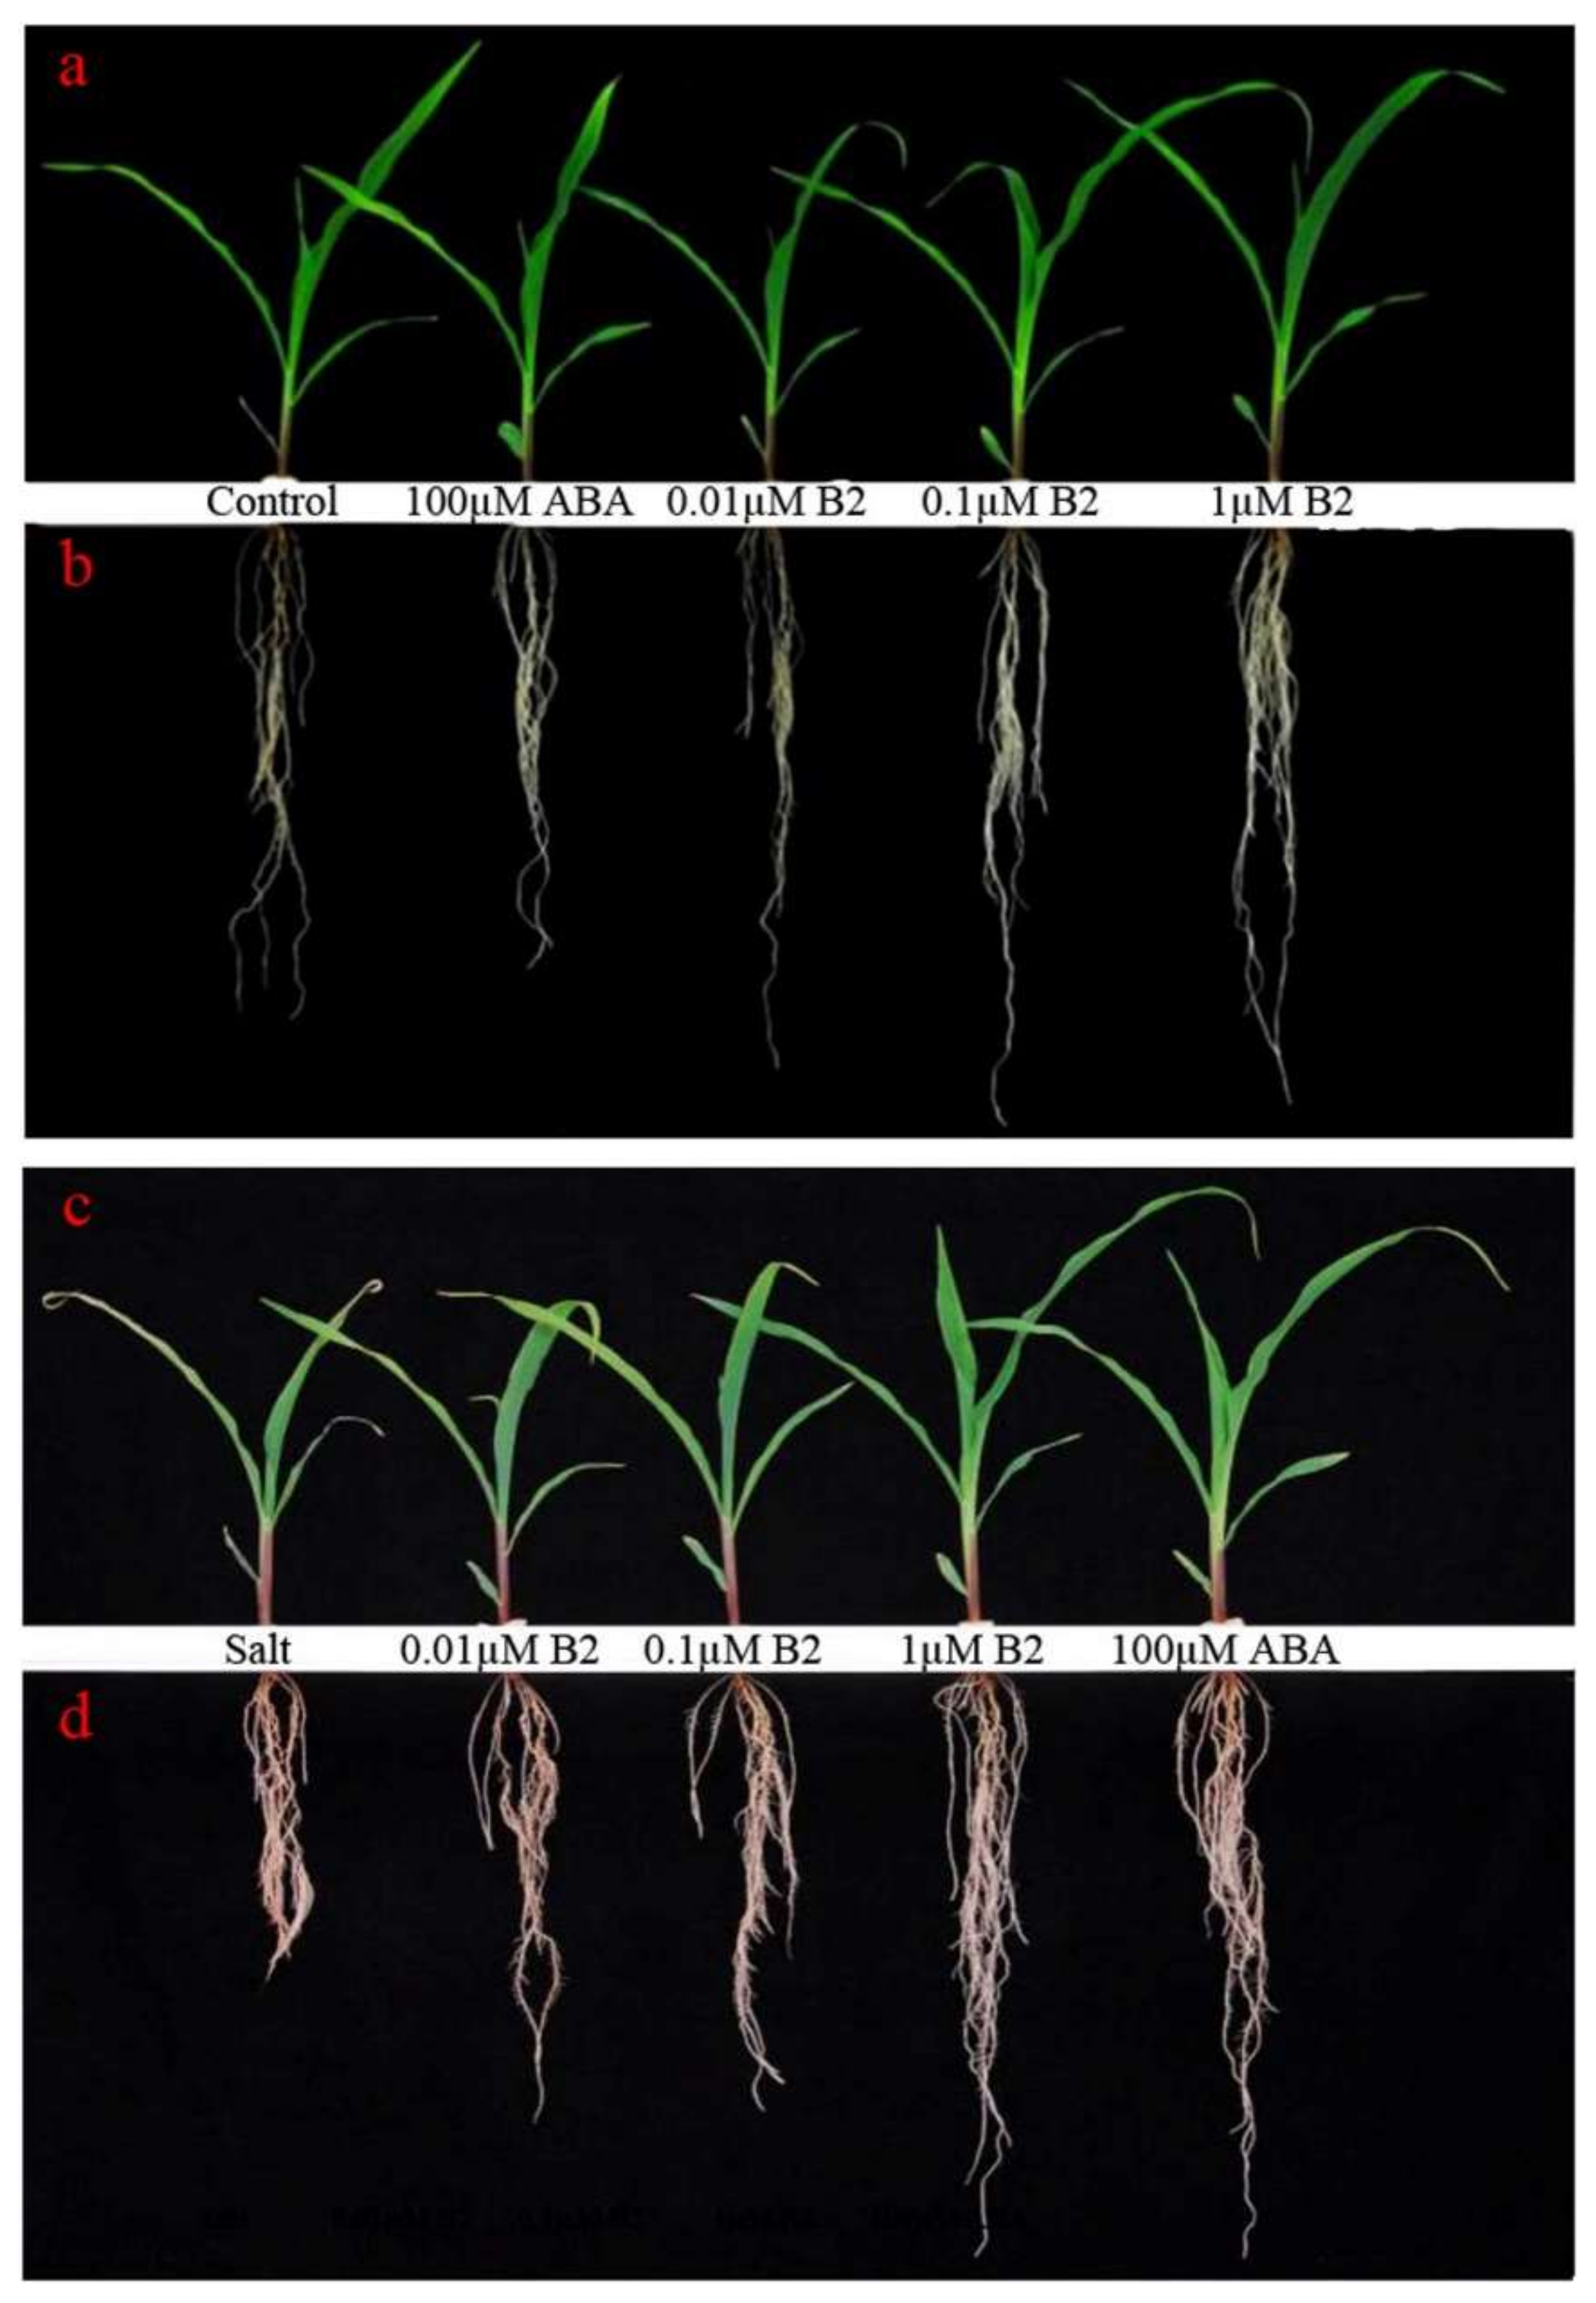
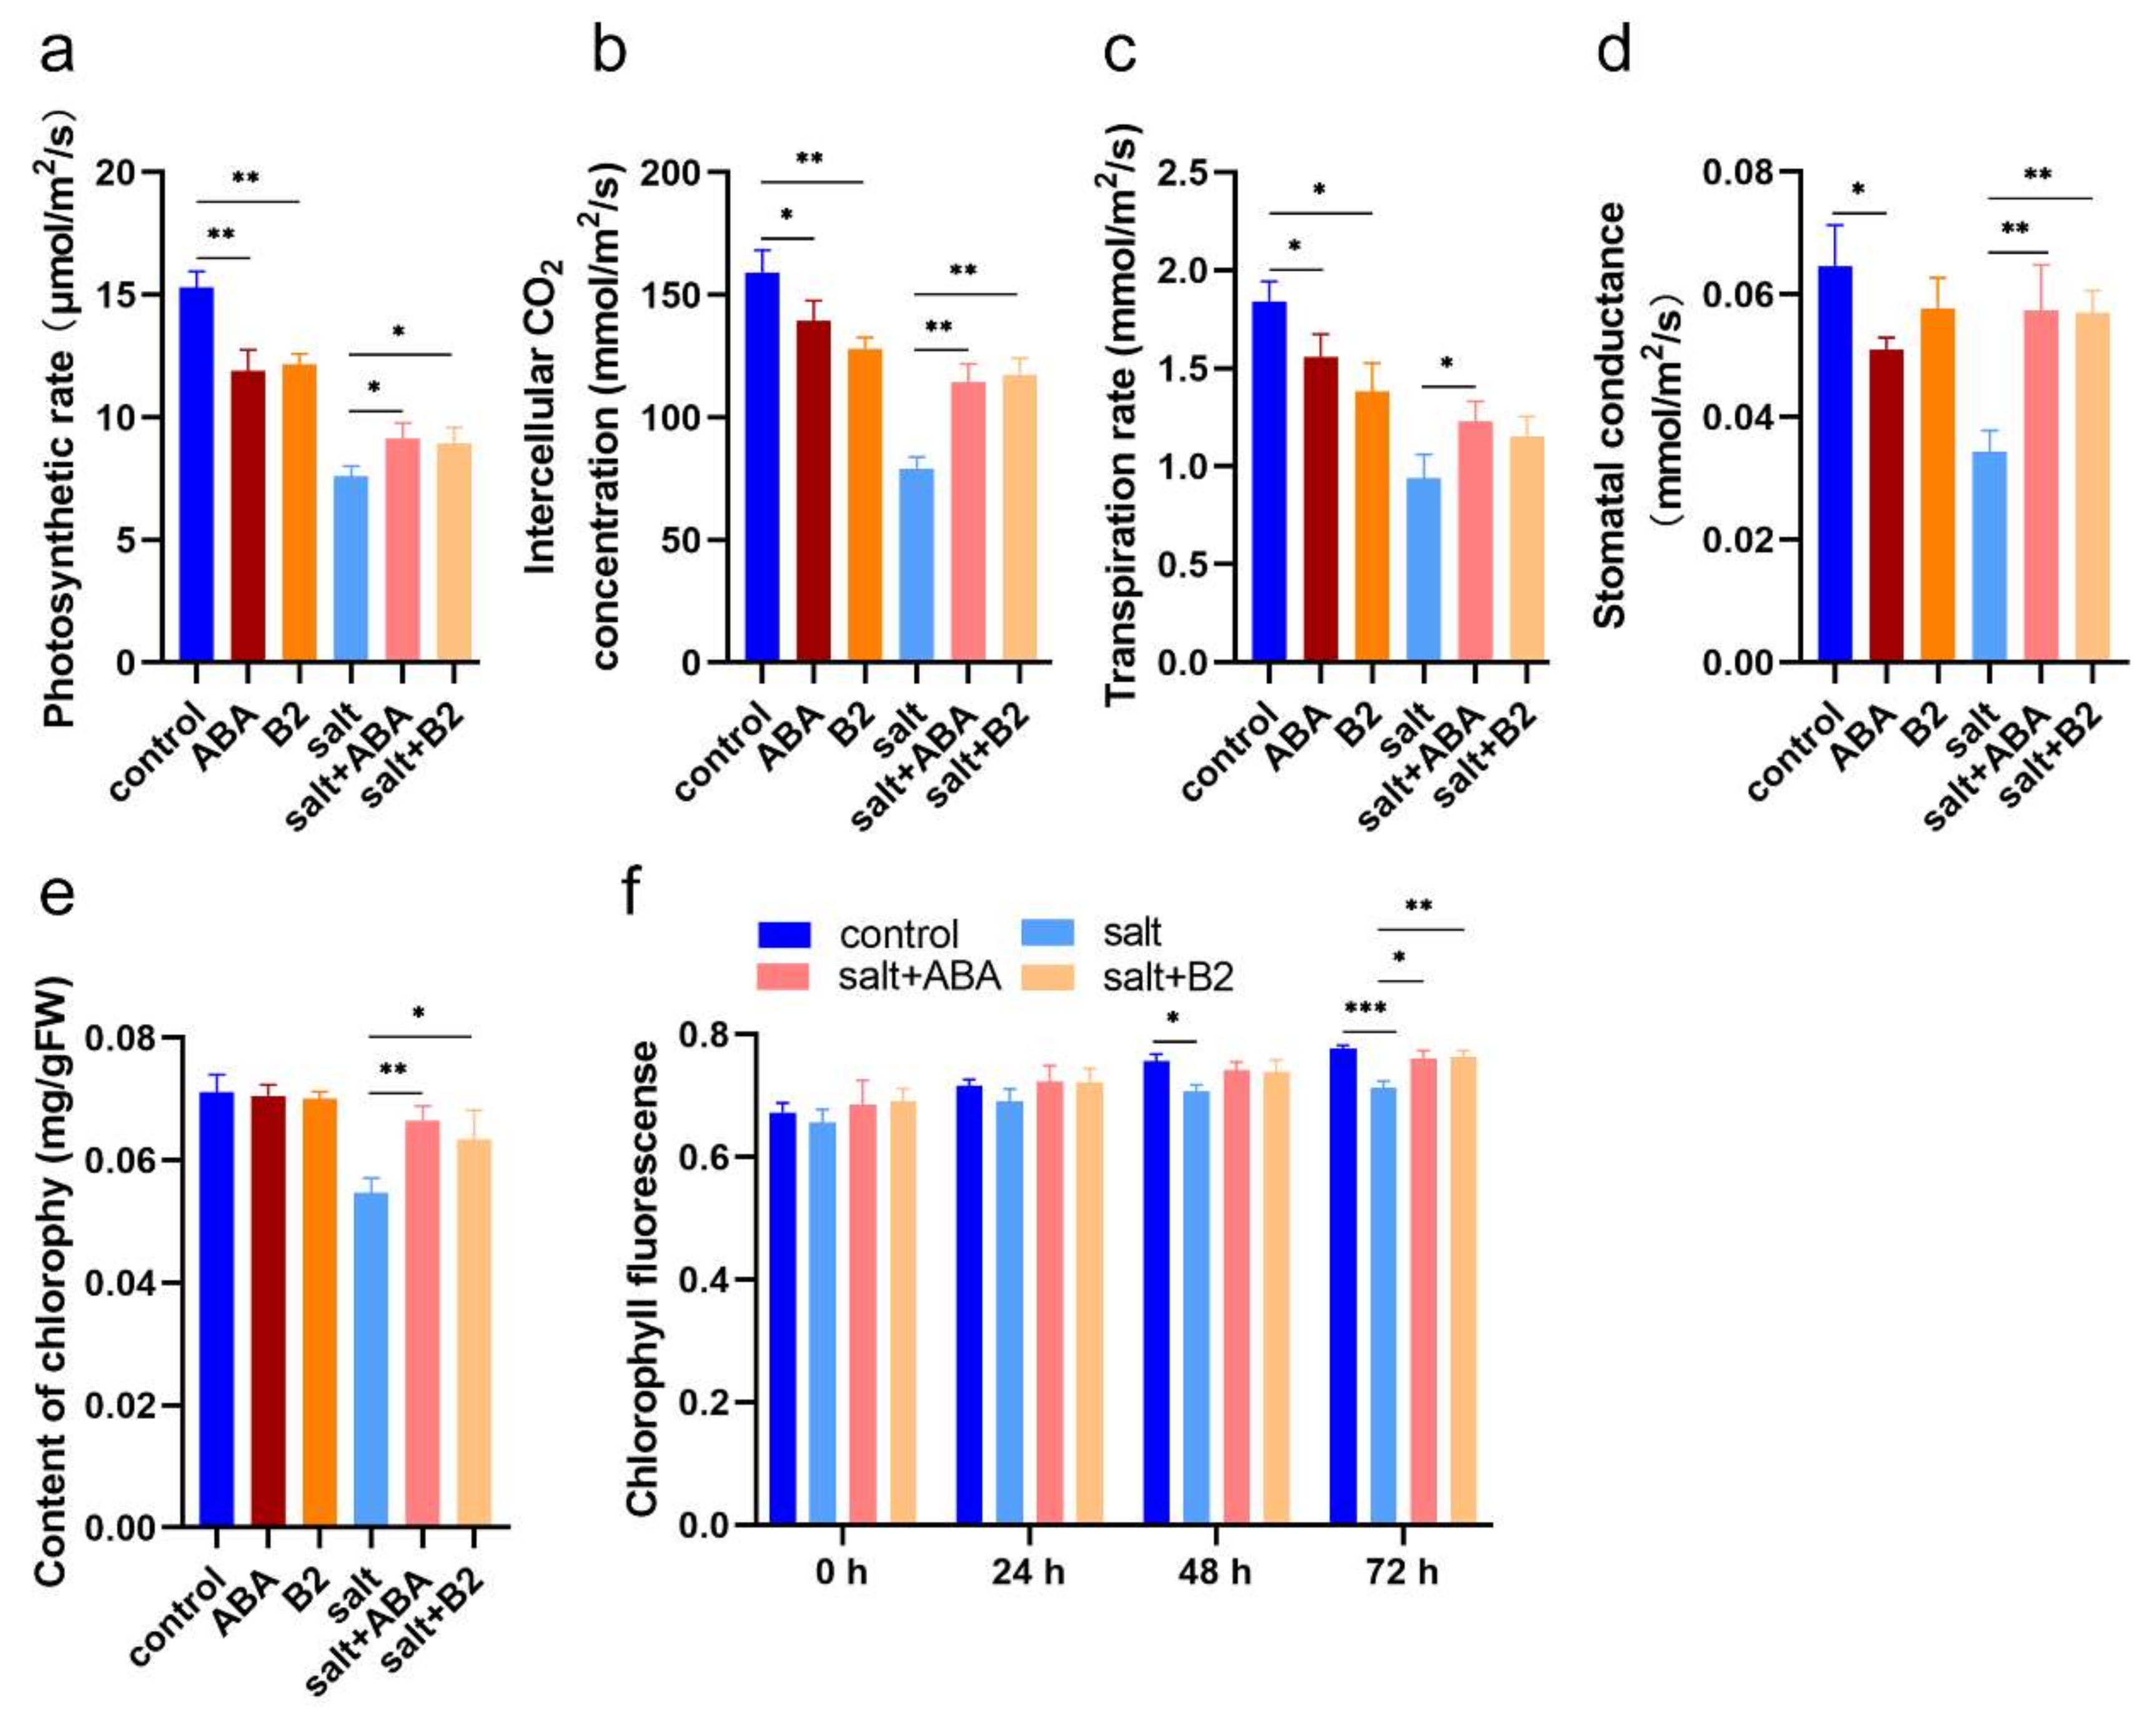
2.4. B2 Improved Maize Morphology by Enhancing Photosynthetic under Salt Stress
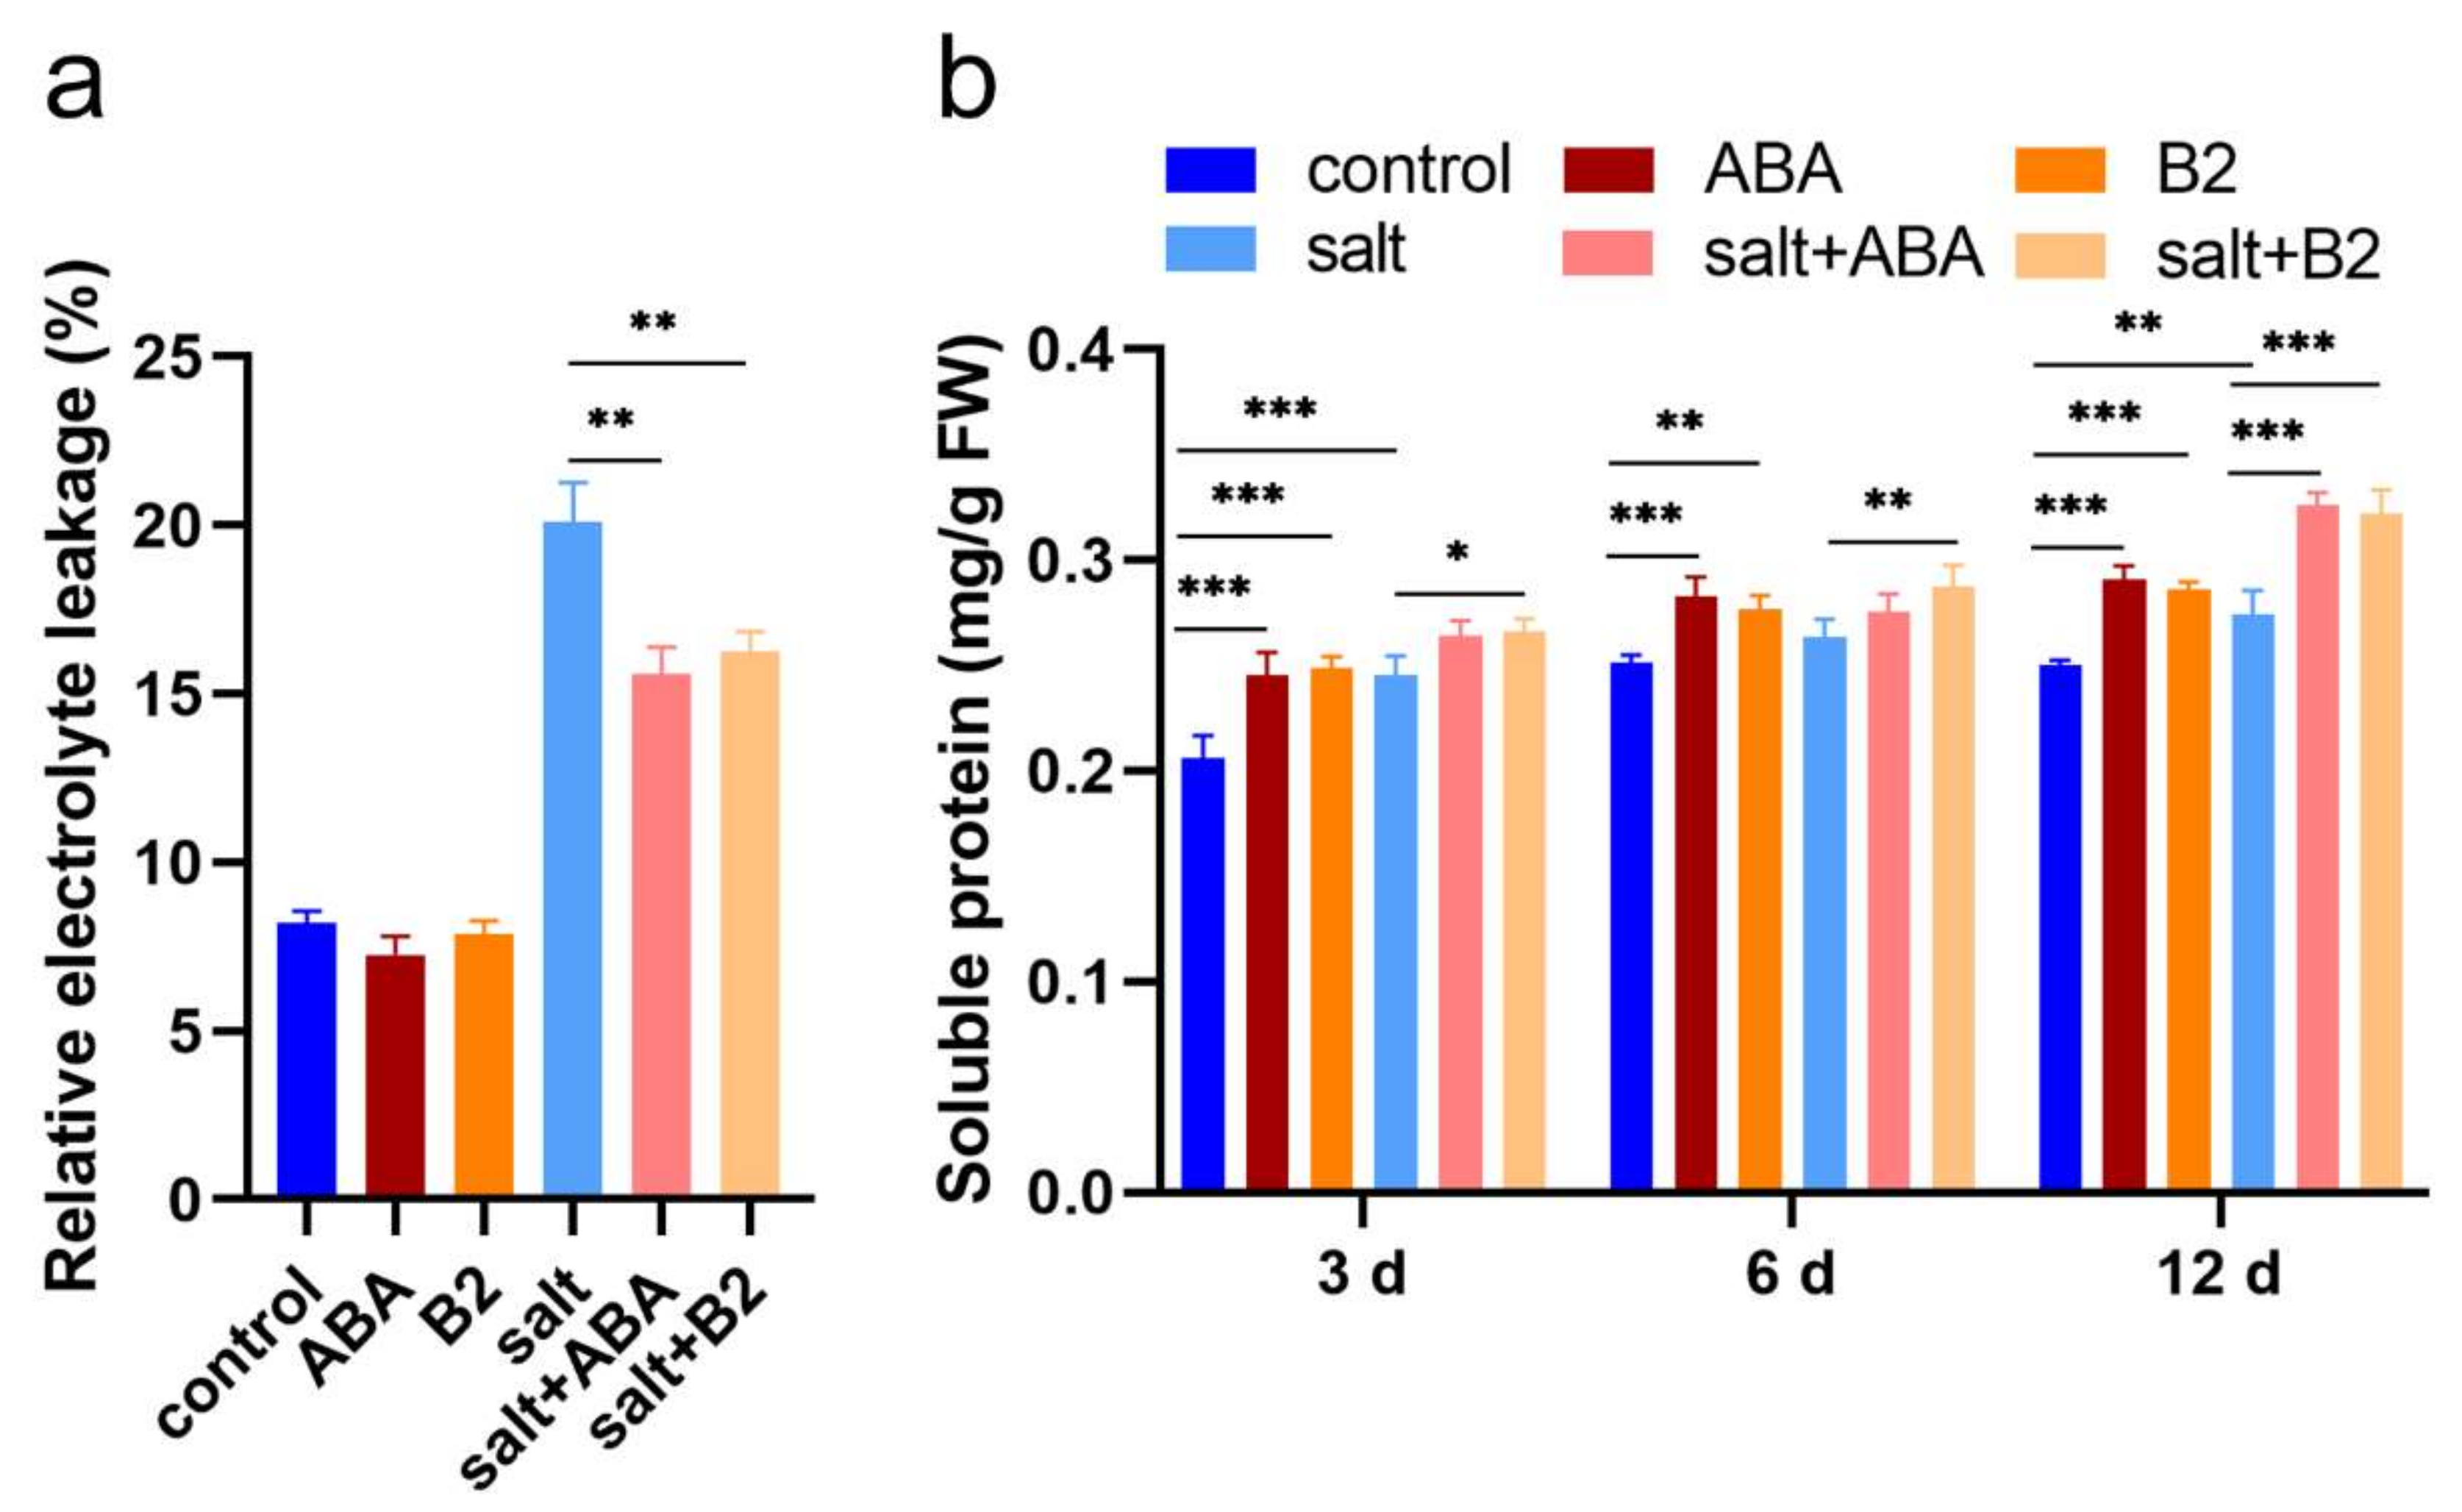
2.5. B2 Reduced the Damage of Maize Leaves under Salt Stress
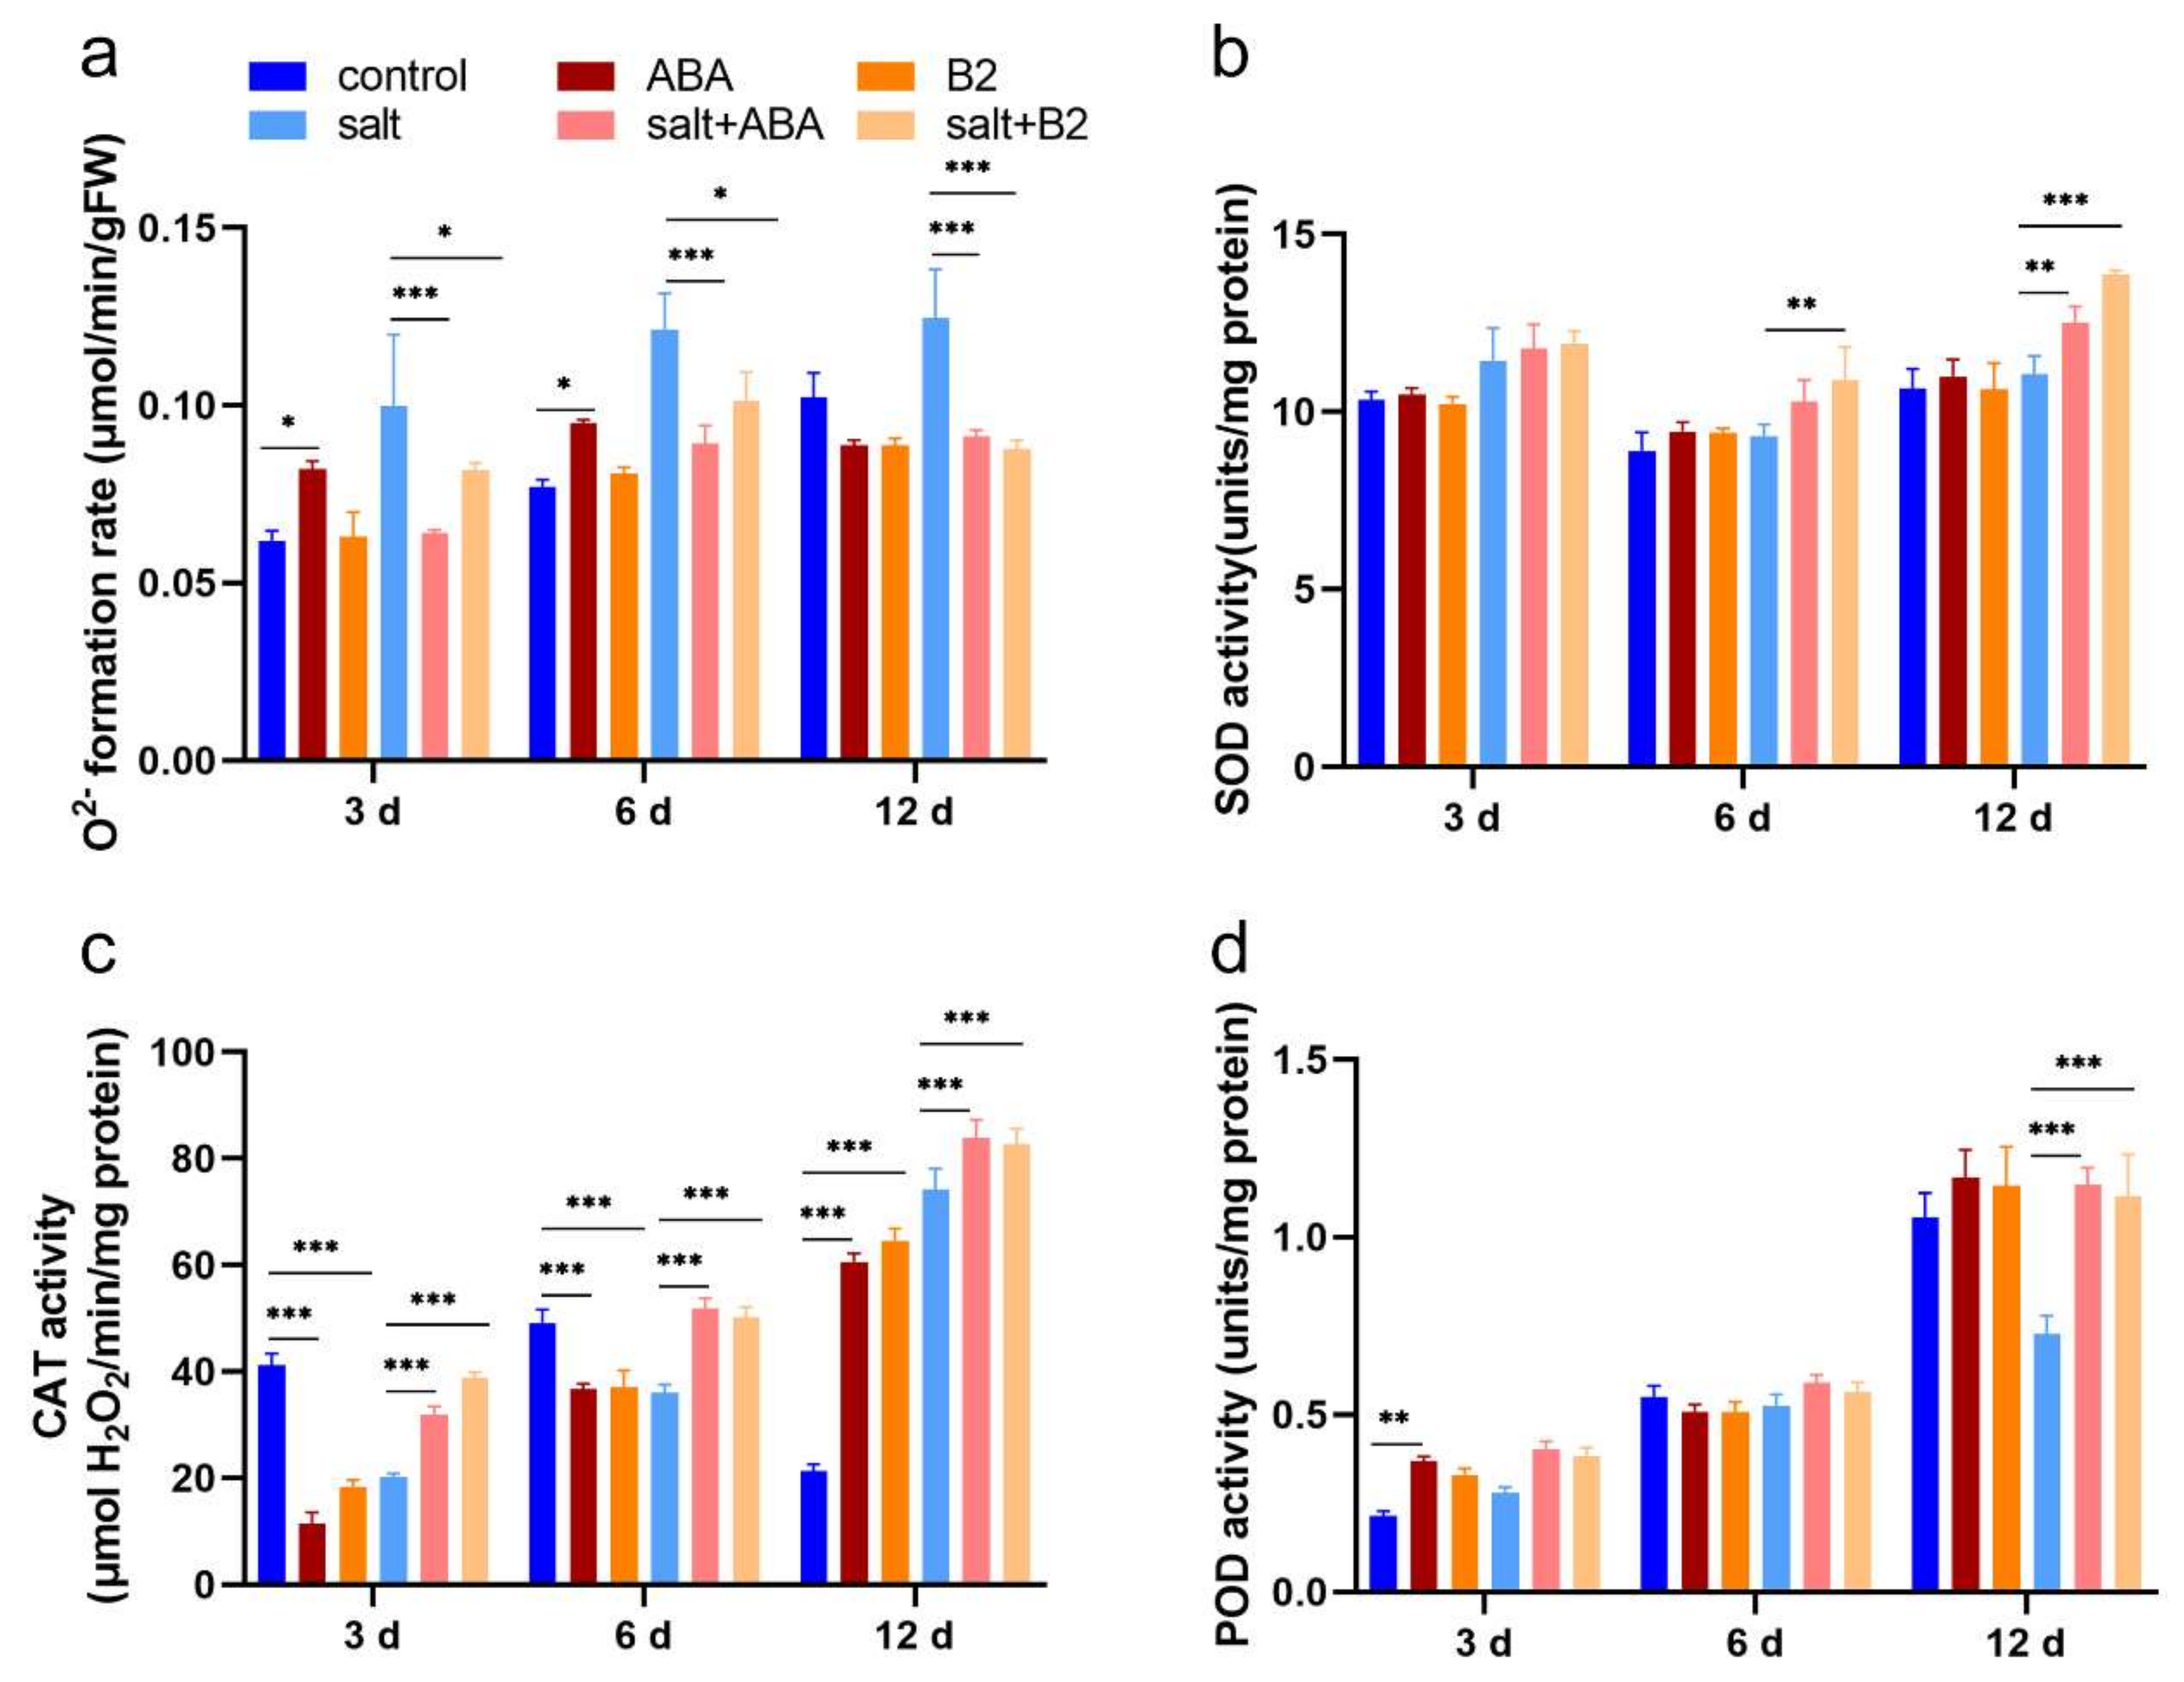
2.6. B2 Reduced the Degree of Peroxide in Maize Leaves under Salt Stress
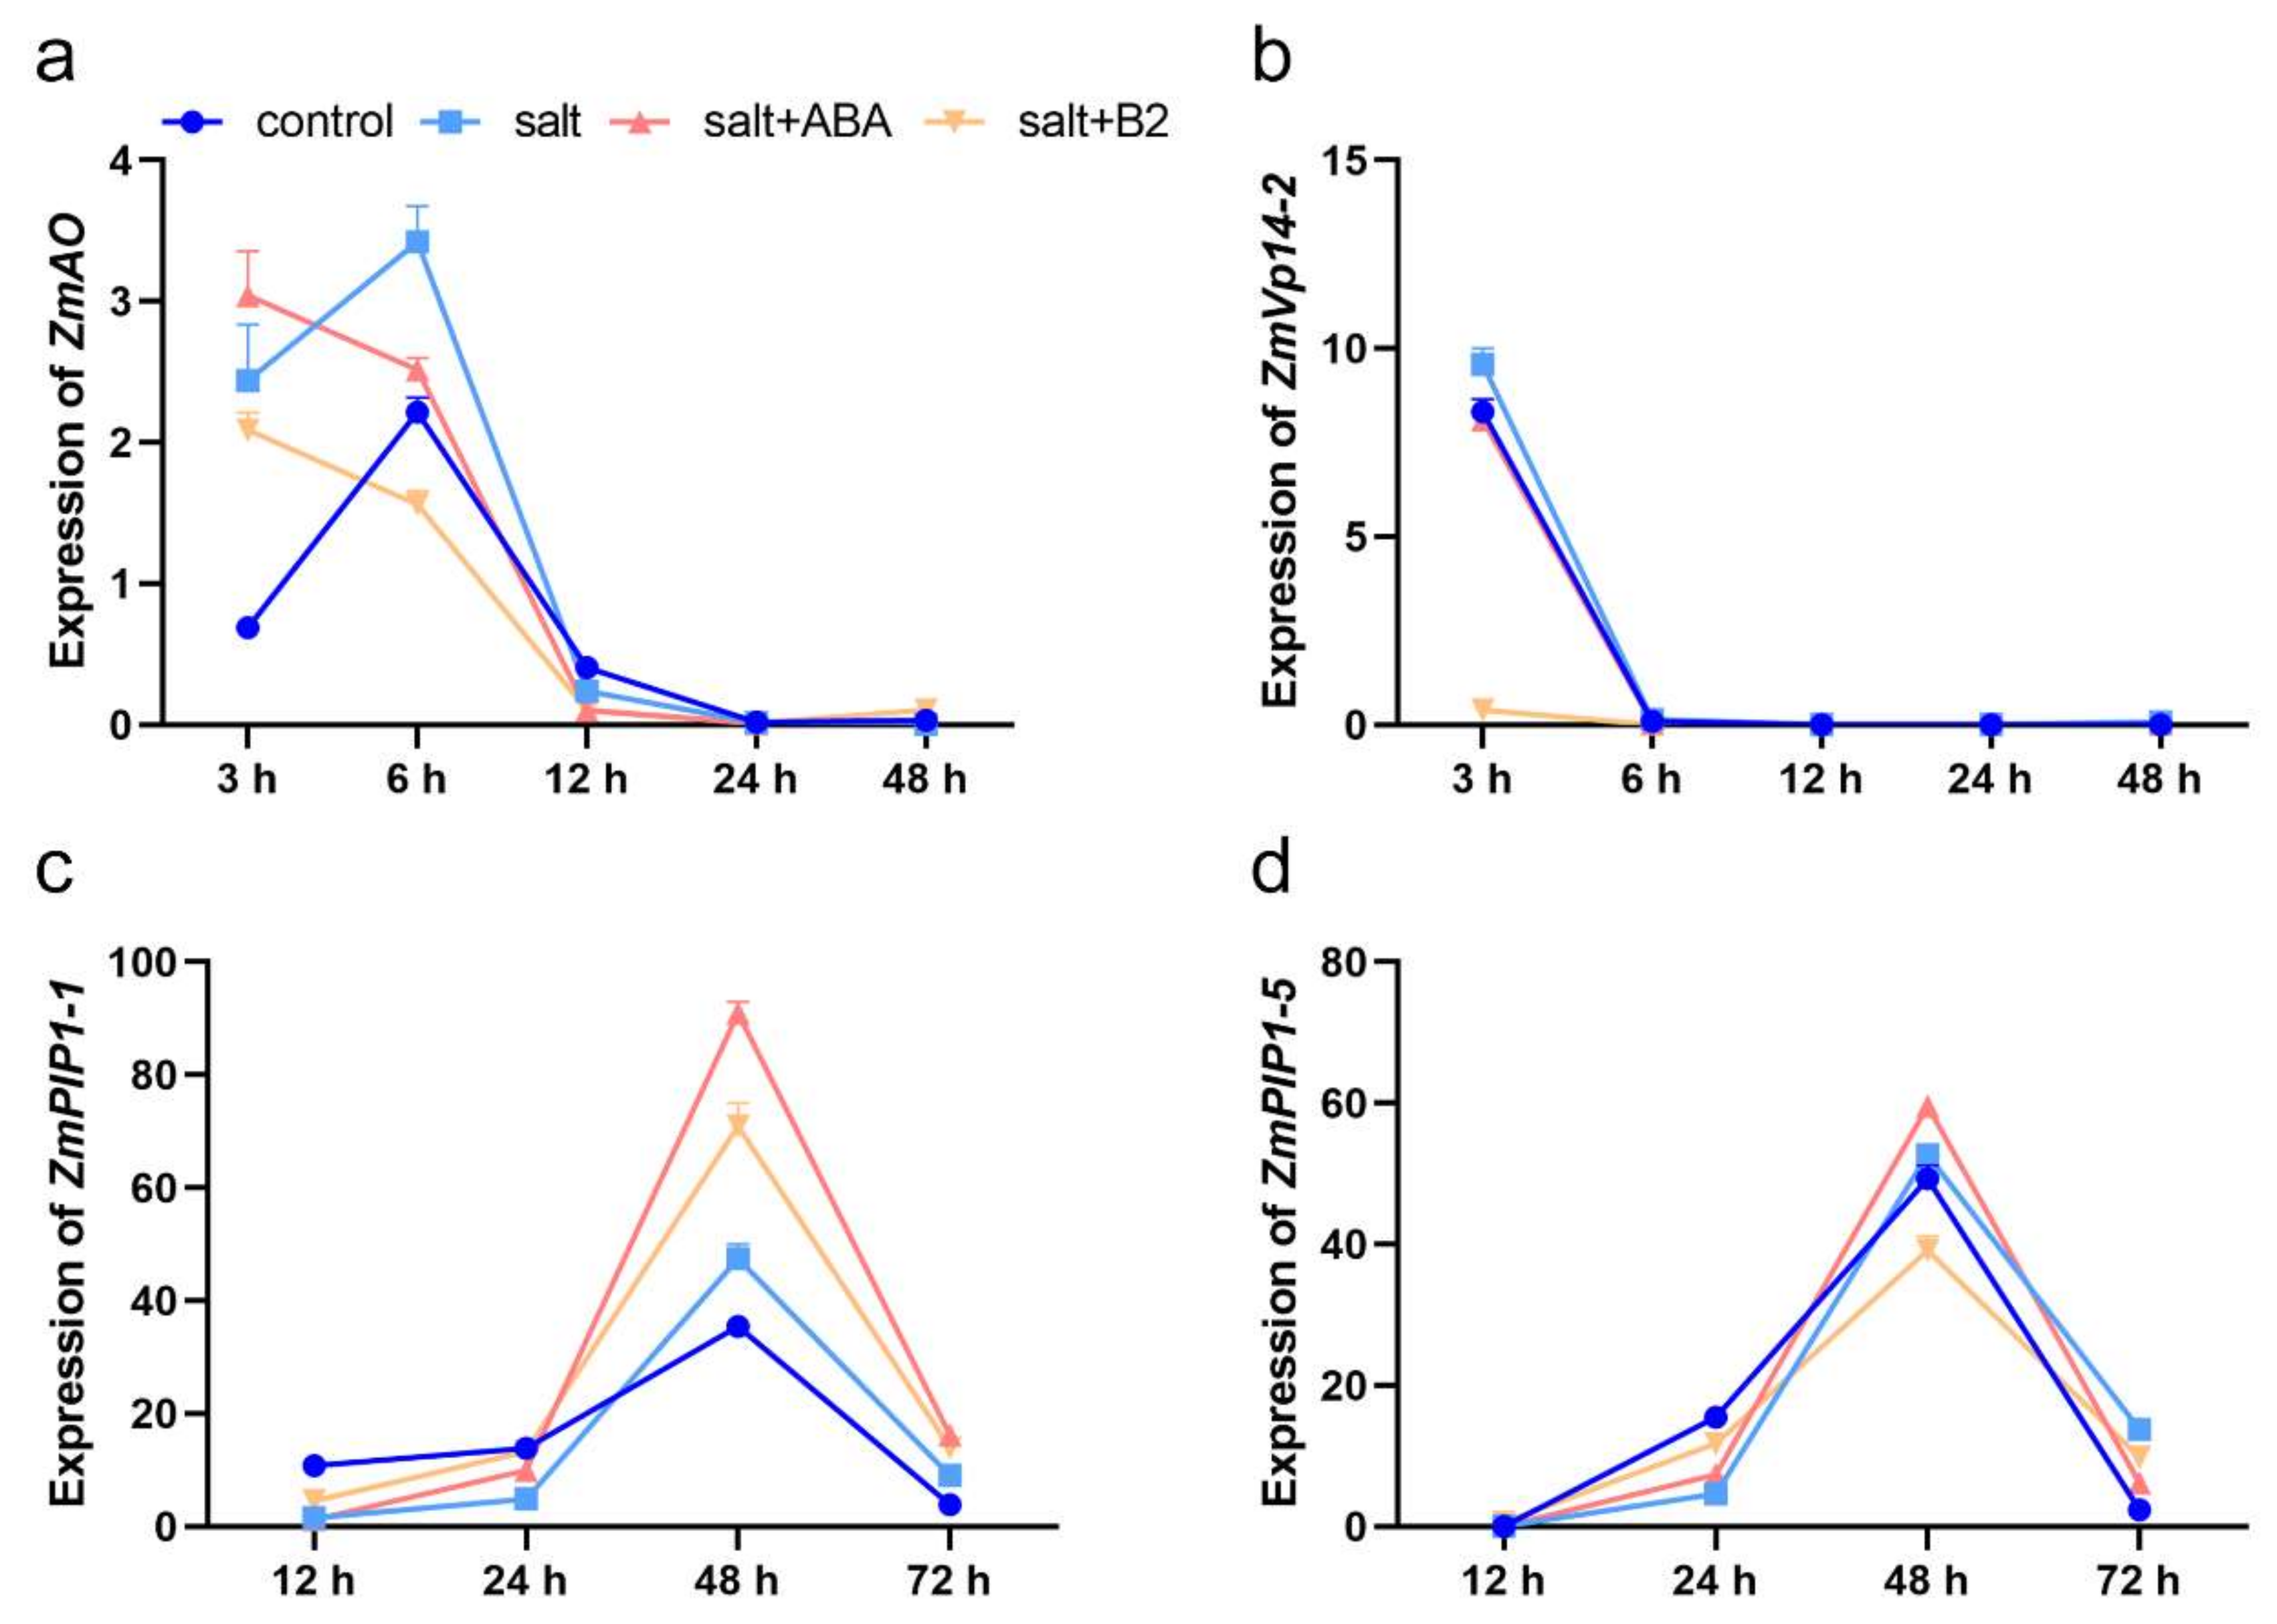
2.7. B2 Can Enhance the Bibulous Capacity by Increasing the Expression of Aquaporins
3. Discussion
4. Materials and Methods
4.1. The Synthesis of B2
4.2. Plant Material and Treatment
4.3. Electrolyte Leakage Measurement
4.4. Soluble Protein
4.5. Photosynthesis and Chlorophyll Fluorescence
4.6. Superoxide Radical Estimation
4.7. Enzyme Extraction
4.8. Determination of Endogenous Hormone Content
4.9. Gene Expression
4.10. Statistical Analysis
Supplementary Materials
Author Contributions
Funding
Institutional Review Board Statement
Conflicts of Interest
Abbreviations
References
- Munns, R.; Tester, M. Mechanisms of salinity tolerance. Annu. Rev. Plant Biol. 2008, 59, 651–681. [Google Scholar] [CrossRef] [PubMed] [Green Version]
- Kaleem, F.; Shabir, G.; Aslam, K.; Rasul, S.; Manzoor, H.; Shah, S.M.; Khan, A.R. An Overview of the Genetics of Plant Response to Salt Stress: Present Status and the Way Forward. Appl Biochem. Biotech. 2018, 186, 306–334. [Google Scholar] [CrossRef] [PubMed]
- Hasegawa, P.M.; Bressan, R.A.; Zhu, J.-K.; Bohnert, H.J. Plant Cellular and Molecular Responses to High Salinity. Annu. Rev. Plant Biol. 2000, 51, 463–499. [Google Scholar] [CrossRef] [PubMed] [Green Version]
- Ashraf, M. Some important physiological selection criteria for salt tolerance in plants. Flora Morphol. Distrib. Funct. Ecol. Plants 2004, 199, 361–376. [Google Scholar] [CrossRef]
- Chinnusamy, V.; Jagendorf, A.; Zhu, J. Understanding and Improving Salt Tolerance in Plants. Crop Sci. 2005, 45, 437–448. [Google Scholar] [CrossRef] [Green Version]
- Krishnamurthy, L.; Serraj, R.; Hash, C.T.; Dakheel, A.J.; Reddy, B.V.S. Screening sorghum genotypes for salinity tolerant biomass production. Euphytica 2007, 156, 15–24. [Google Scholar] [CrossRef] [Green Version]
- Zhu, J.-K. Salt and Drought Stress Signal Transduction in Plants. Annu. Rev. Plant Biol. 2002, 53, 247–273. [Google Scholar] [CrossRef] [PubMed] [Green Version]
- Martinez-Atienza, J.; Jiang, X.; Garciadeblas, B.; Mendoza, I.; Quintero, F.J. Conservation of the Salt Overly Sensitive Pathway in Rice1(C)(W)(OA). Plant Physiol. 2007, 143, 1001–1012. [Google Scholar] [CrossRef] [Green Version]
- Wang, Q.; Wang, L.; Chandrasekaran, U.; Luo, X.; Zheng, C.; Shu, K. ABA Biosynthesis and Signaling Cascades under Hypoxia Stress. Front. Plant Sci. 2021, 12, 1230. [Google Scholar] [CrossRef] [PubMed]
- Salazar, C.; Hernandez, C.; Pino, M.T. Plant water stress: Associations between ethylene and abscisic acid response. Chil. J. Agric. Res. 2015, 75, 71–79. [Google Scholar] [CrossRef] [Green Version]
- Chen, M.; Ni, L.; Chen, J.; Sun, M.; Qin, C.; Zhang, G.; Zhang, A.; Jiang, M. Rice calcium/calmodulin-dependent protein kinase directly phosphorylates a mitogen-activated protein kinase kinase to regulate abscisic acid responses. Plant Cell 2021. [Google Scholar] [CrossRef] [PubMed]
- Zhu, J.K. Regulation of ion homeostasis under salt stress. Curr. Opin. Plant Biol. 2003, 6, 441–445. [Google Scholar] [CrossRef]
- Davies, W.J.; Kudoyarova, G.; Hartung, W. Long-distance ABA Signaling and Its Relation to Other Signaling Pathways in the Detection of Soil Drying and the Mediation of the Plant’s Response to Drought. J. Plant Growth Regul. 2005, 24, 285–295. [Google Scholar] [CrossRef] [Green Version]
- Vysotskaya, L.; Akhiyarova, G.; Feoktistova, A.; Akhtyamova, Z.; Korobova, A.; Ivanov, I.; Dodd, I.; Kuluev, B.; Kudoyarova, G. Effects of Phosphate Shortage on Root Growth and Hormone Content of Barley Depend on Capacity of the Roots to Accumulate ABA. Plants 2020, 9, 1722. [Google Scholar] [CrossRef] [PubMed]
- Boussora, F.; Allam, M.; Guasmi, F.; Ferchichi, A.; Brner, A. Spike developmental stages and ABA role in spikelet primordia abortion contribute to the final yield in barley (Hordeum vulgare L.). Bot. Stud. 2019, 60, 1001–1012. [Google Scholar] [CrossRef] [PubMed] [Green Version]
- Yan, J.; Tsuichihara, N.; Etoh, T.; Iwai, S. Reactive oxygen species and nitric oxide are involved in ABA inhibition of stomatal opening. Plant Cell Environ. 2007, 30, 1320–1325. [Google Scholar] [CrossRef]
- Fujita, Y.; Fujita, M.; Shinozaki, K.; Yamaguchi-Shinozaki, K. ABA-mediated transcriptional regulation in response to osmotic stress in plants. J. Plant Res. 2011, 124, 509–525. [Google Scholar] [CrossRef]
- Bhargava, S.; Sawant, K. Drought stress adaptation: Metabolic adjustment and regulation of gene expression. Plant Breed. 2013, 132, 21–32. [Google Scholar] [CrossRef]
- Lindemose, S.R.; O’Shea, C.; Jensen, M.; Skriver, K. Structure, Function and Networks of Transcription Factors Involved in Abiotic Stress Responses. Int. J. Mol. Sci. 2013, 14, 5842–5878. [Google Scholar] [CrossRef] [PubMed] [Green Version]
- Yang, M.; Zhao, Y.; Shi, S.; Du, X.; Gu, J.; Xiao, K. Wheat nuclear factor Y (NF-Y) B subfamily gene TaNF-YB3;l confers critical drought tolerance through modulation of the ABA-associated signaling pathway. Plant Cell Tissue Organ Cult. (PCTOC) 2017, 128, 97–111. [Google Scholar] [CrossRef]
- Balsevich, J.J.; Cutler, A.J.; Lamb, N.; Friesen, L.J.; Kurz, E.U.; Perras, M.R.; Abrams, S.R. Response of Cultured Maize Cells to (+)-Abscisic Acid, (-)-Abscisic Acid, and Their Metabolites. Plant Physiol. 1994, 106, 135–142. [Google Scholar] [CrossRef] [Green Version]
- Park, S.-Y.; Fung, P.; Nishimura, N.; Jensen, D.R.; Fujii, H.; Zhao, Y.; Lumba, S.; Santiago, J.; Rodrigues, A.; Chow, T.-F.F.; et al. Abscisic Acid Inhibits Type 2C Protein Phosphatases via the PYR/PYL Family of START Proteins. Science 2009, 324, 1068–1071. [Google Scholar] [CrossRef] [Green Version]
- Cao, M.; Liu, X.; Zhang, Y.; Xue, X.; Zhou, X.E.; Melcher, K.; Gao, P.; Wang, F.; Zeng, L.; Zhao, Y.; et al. An ABA-mimicking ligand that reduces water loss and promotes drought resistance in plants. Cell Res. 2013, 23, 1043–1054. [Google Scholar] [CrossRef] [Green Version]
- Okamoto, M.; Peterson, F.C.; Defries, A.; Park, S.-Y.; Endo, A.; Nambara, E.; Volkman, B.F.; Cutler, S.R. Activation of dimeric ABA receptors elicits guard cell closure, ABA-regulated gene expression, and drought tolerance. Proc. Natl. Acad. Sci. USA 2013, 110, 12132–12137. [Google Scholar] [CrossRef] [PubMed] [Green Version]
- Zhou, Y.; He, R.; Guo, Y.; Liu, K.; Huang, G.; Peng, C.; Liu, Y.; Zhang, M.; Li, Z.; Duan, L. A novel ABA functional analogue B2 enhances drought tolerance in wheat. Sci. Rep. 2019, 9, 2887. [Google Scholar] [CrossRef]
- Zhou, F.; Ran, Z.; Tan, W.; Zhaohu, L.I.; Duan, L. Synthesis and biological activity of arylamido-cyclopropanecarboxylic acid. Chin. J. Pestic. Sci. 2013, 15, 490–495. [Google Scholar]
- Gaber, A.; Feng, T.; Wang, X.; Huang, G.; Guo, Y.; Zhang, M.; Li, Z.; Zhou, Y.; Duan, L. A Novel Aba Functional Analogue B2 Enhances Salinity Tolerance in wheat. Appl. Ecol. Environ. Res. 2020, 18, 7139–7157. [Google Scholar] [CrossRef]
- Abogadallah, G.M. Insights into the significance of antioxidative defense under salt stress. Plant Signal. Behav. 2010, 5, 369–374. [Google Scholar] [CrossRef] [PubMed]
- Tang, X.; Mu, X.; Shao, H.; Wang, H.; Brestic, M. Global plant-responding mechanisms to salt stress: Physiological and molecular levels and implications in biotechnology. Crit. Rev. Biotechnol. 2015, 35, 425–434. [Google Scholar] [CrossRef] [PubMed]
- Bharti, N.; Pandey, S.S.; Barnawal, D.; Patel, V.K.; Kalra, A. Plant growth promoting rhizobacteria Dietzia natronolimnaea modulates the expression of stress responsive genes providing protection of wheat from salinity stress. Sci. Rep. 2016, 6, 34768. [Google Scholar] [CrossRef] [PubMed] [Green Version]
- Jha, Y.; Subramanian, R.B. Regulation of Plant Physiology and Antioxidant Enzymes for Alleviating Salinity Stress by Potassium-Mobilizing Bacteria. In Potassium Solubilizing Microorganisms for Sustainable Agriculture; Springer: New Delhi, India, 2016. [Google Scholar]
- Ali-Dinar, H.M.; Ebert, G.; Lüdders, R. Growth, chlorophyll content, photosynthesis and water relations in guava (Psidium guajava L.) under salinity and different nitrogen supply. Gartenbauwissenschaft 1999, 64, 84. [Google Scholar]
- Chartzoulakis, K.; Klapaki, G. Response of two greenhouse pepper hybrids to NaCl salinity during different growth stages. Sci. Hortic. 2000, 86, 247–260. [Google Scholar] [CrossRef]
- Shalata, A.; Tal, M. Up-regulation of the leaf mitochondrial and peroxisomal antioxidative systems in response to salt-induced oxidative stress in the wild salt-tolerant tomato species Lycopersicon pennellii. Plant Cell Environ. 2010, 26, 845–856. [Google Scholar]
- Sekmen, A.H.; Türkan, I.; Takio, S. Differential responses of antioxidative enzymes and lipid peroxidation to salt stress in salt-tolerant Plantago maritima and salt-sensitive Plantago media. Physiol. Plant. 2007, 131, 399–411. [Google Scholar] [CrossRef] [PubMed]
- Prashanth, S.R.; Sadhasivam, V.; Parida, A. Over expression of cytosolic copper/zinc superoxide dismutase from a mangrove plant Avicennia marina in Indica Rice var Pusa Basmati-1 confers abiotic stress tolerance. Transgenic Res. 2008, 17, 281–291. [Google Scholar] [CrossRef]
- Karpinski, S.; Mühlenbock, P. Genetic, molecular and physiological mechanisms controlling cell death, defenses, and antioxidant network in response to abiotic and biotic stresses in plants. Comp. Biochem. Physiol. Part A Mol. Integr. Physiol. 2007, 146, S60. [Google Scholar] [CrossRef]
- Asada, K. Ascorbate peroxidase—A hydrogen peroxide-scavenging enzyme in plants. Physiol. Plant. 2010, 85, 235–241. [Google Scholar] [CrossRef]
- Willekens, H.; Chamnongpol, S.; Davey, M.; Schraudner, M.; Langebartels, C.; van Montagu, M.; Inzé, D.; van Camp, W. Catalase is a sink for H2O2 and is indispensable for stress defence in C3 plants. EMBO J. 1997, 16, 4806–4816. [Google Scholar] [CrossRef] [Green Version]
- Hancock, J.; Desikan, R.; Harrison, J.; Bright, J.; Hooley, R.; Neill, S. Doing the unexpected: Proteins involved in hydrogen peroxide perception. J. Exp. Bot. 2006, 57, 1711–1718. [Google Scholar] [CrossRef]
- Gond, S.K.; Torres, M.S.; Bergen, M.S.; Helsel, Z.; White, J.F. Induction of salt tolerance and up-regulation of aquaporin genes in tropical corn by rhizobacterium Pantoea agglomerans. Lett. Appl. Microbiol. 2015, 60, 392–399. [Google Scholar] [CrossRef] [PubMed]
- Zhang, J.; Yu, H.; Zhang, Y.; Wang, Y.; Li, M.; Zhang, J.; Duan, L.; Zhang, M.; Li, Z. Increased abscisic acid levels in transgenic maize overexpressing AtLOS5 mediated root ion fluxes and leaf water status under salt stress. J. Exp. Bot. 2016, 67, 1339–1355. [Google Scholar] [CrossRef] [PubMed] [Green Version]
- Xie, Z.; Duan, L.; Tian, X.; Wang, B.; Eneji, A.E.; Li, Z. Coronatine alleviates salinity stress in cotton by improving the antioxidative defense system and radical-scavenging activity. J. Plant Physiol. 2008, 165, 375–384. [Google Scholar] [CrossRef] [PubMed]
- Verma, S.; Mishra, S.N. Putrescine alleviation of growth in salt stressed Brassica juncea by inducing antioxidative defense system. J. Plant Physiol. 2005, 162, 669–677. [Google Scholar] [CrossRef] [PubMed]


Publisher’s Note: MDPI stays neutral with regard to jurisdictional claims in published maps and institutional affiliations. |
© 2021 by the authors. Licensee MDPI, Basel, Switzerland. This article is an open access article distributed under the terms and conditions of the Creative Commons Attribution (CC BY) license (https://creativecommons.org/licenses/by/4.0/).
Share and Cite
Geng, S.; Ren, Z.; Liang, L.; Zhang, Y.; Li, Z.; Zhou, Y.; Duan, L. An ABA Functional Analogue B2 Enhanced Salt Tolerance by Inducing the Root Elongation and Reducing Peroxidation Damage in Maize Seedlings. Int. J. Mol. Sci. 2021, 22, 12986. https://0-doi-org.brum.beds.ac.uk/10.3390/ijms222312986
Geng S, Ren Z, Liang L, Zhang Y, Li Z, Zhou Y, Duan L. An ABA Functional Analogue B2 Enhanced Salt Tolerance by Inducing the Root Elongation and Reducing Peroxidation Damage in Maize Seedlings. International Journal of Molecular Sciences. 2021; 22(23):12986. https://0-doi-org.brum.beds.ac.uk/10.3390/ijms222312986
Chicago/Turabian StyleGeng, Shiying, Zhaobin Ren, Lijun Liang, Yumei Zhang, Zhaohu Li, Yuyi Zhou, and Liusheng Duan. 2021. "An ABA Functional Analogue B2 Enhanced Salt Tolerance by Inducing the Root Elongation and Reducing Peroxidation Damage in Maize Seedlings" International Journal of Molecular Sciences 22, no. 23: 12986. https://0-doi-org.brum.beds.ac.uk/10.3390/ijms222312986