
Live-Cell Imaging of Single Neurotrophin Receptor Molecules on Human Neurons in Alzheimer’s Disease

 , and
, and 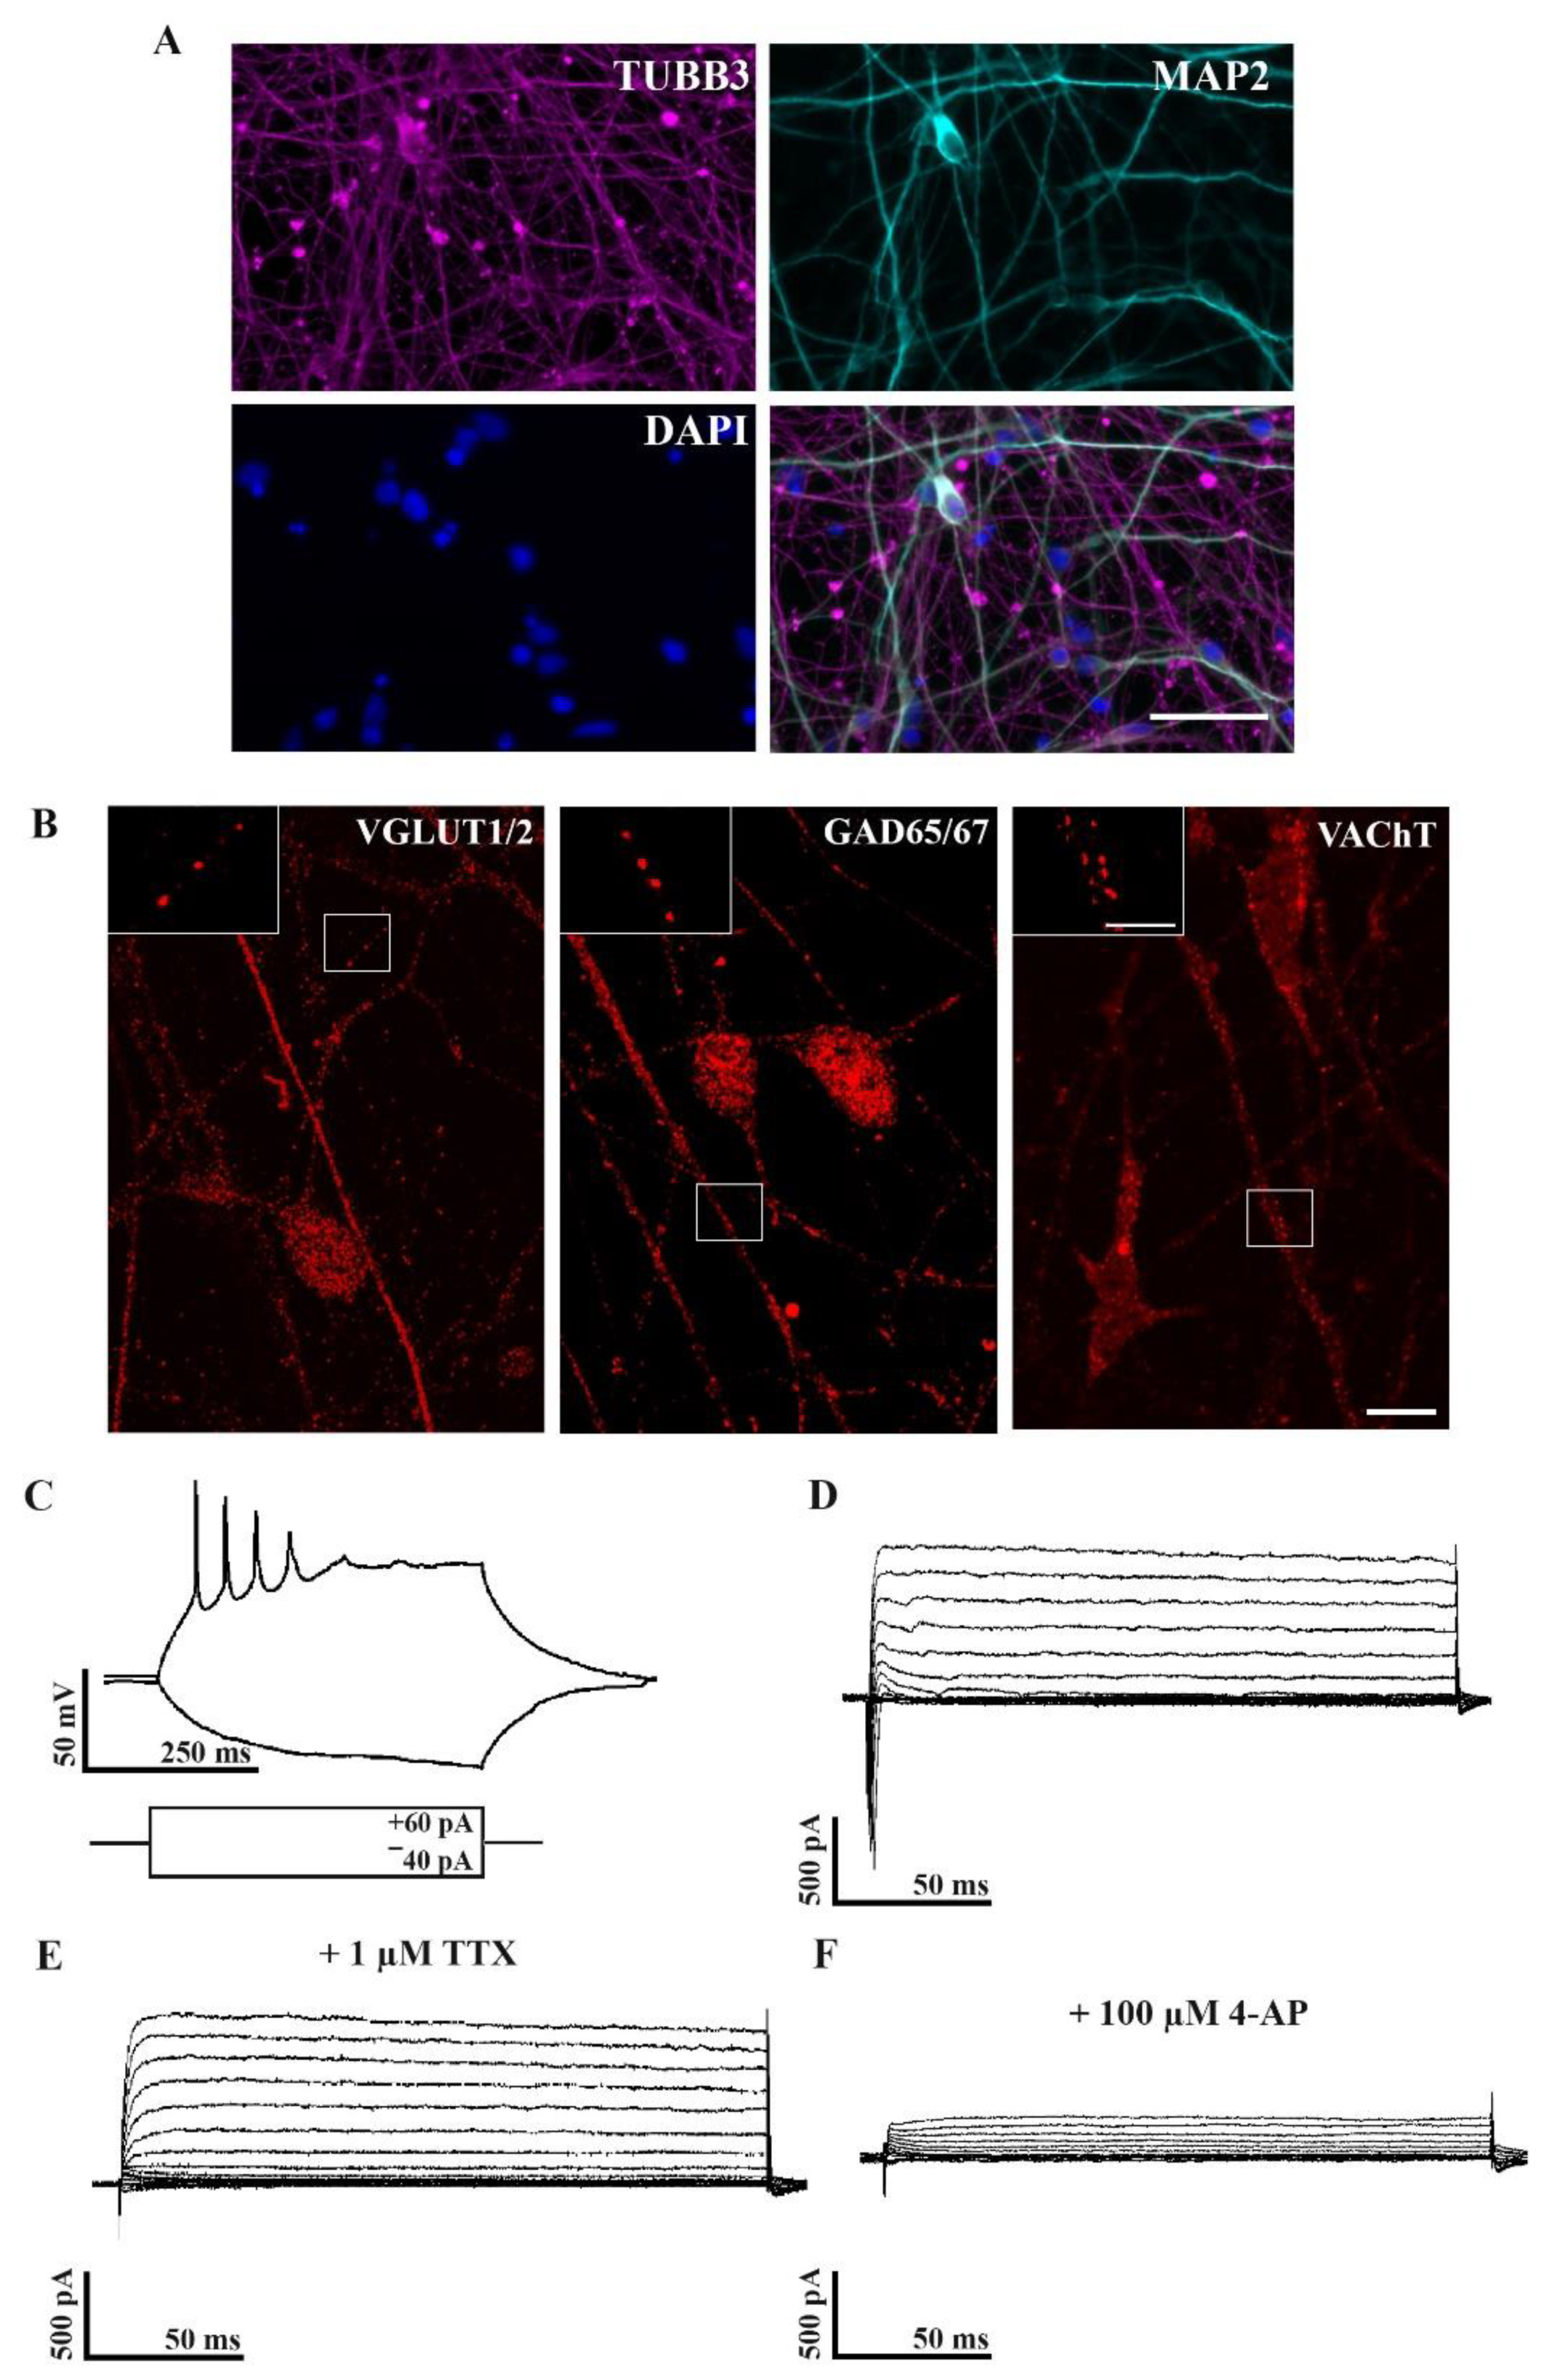
Abstract
:1. Introduction
2. Results
2.1. Characterization of Neuronal Properties of hiPSC-Derived Cultures
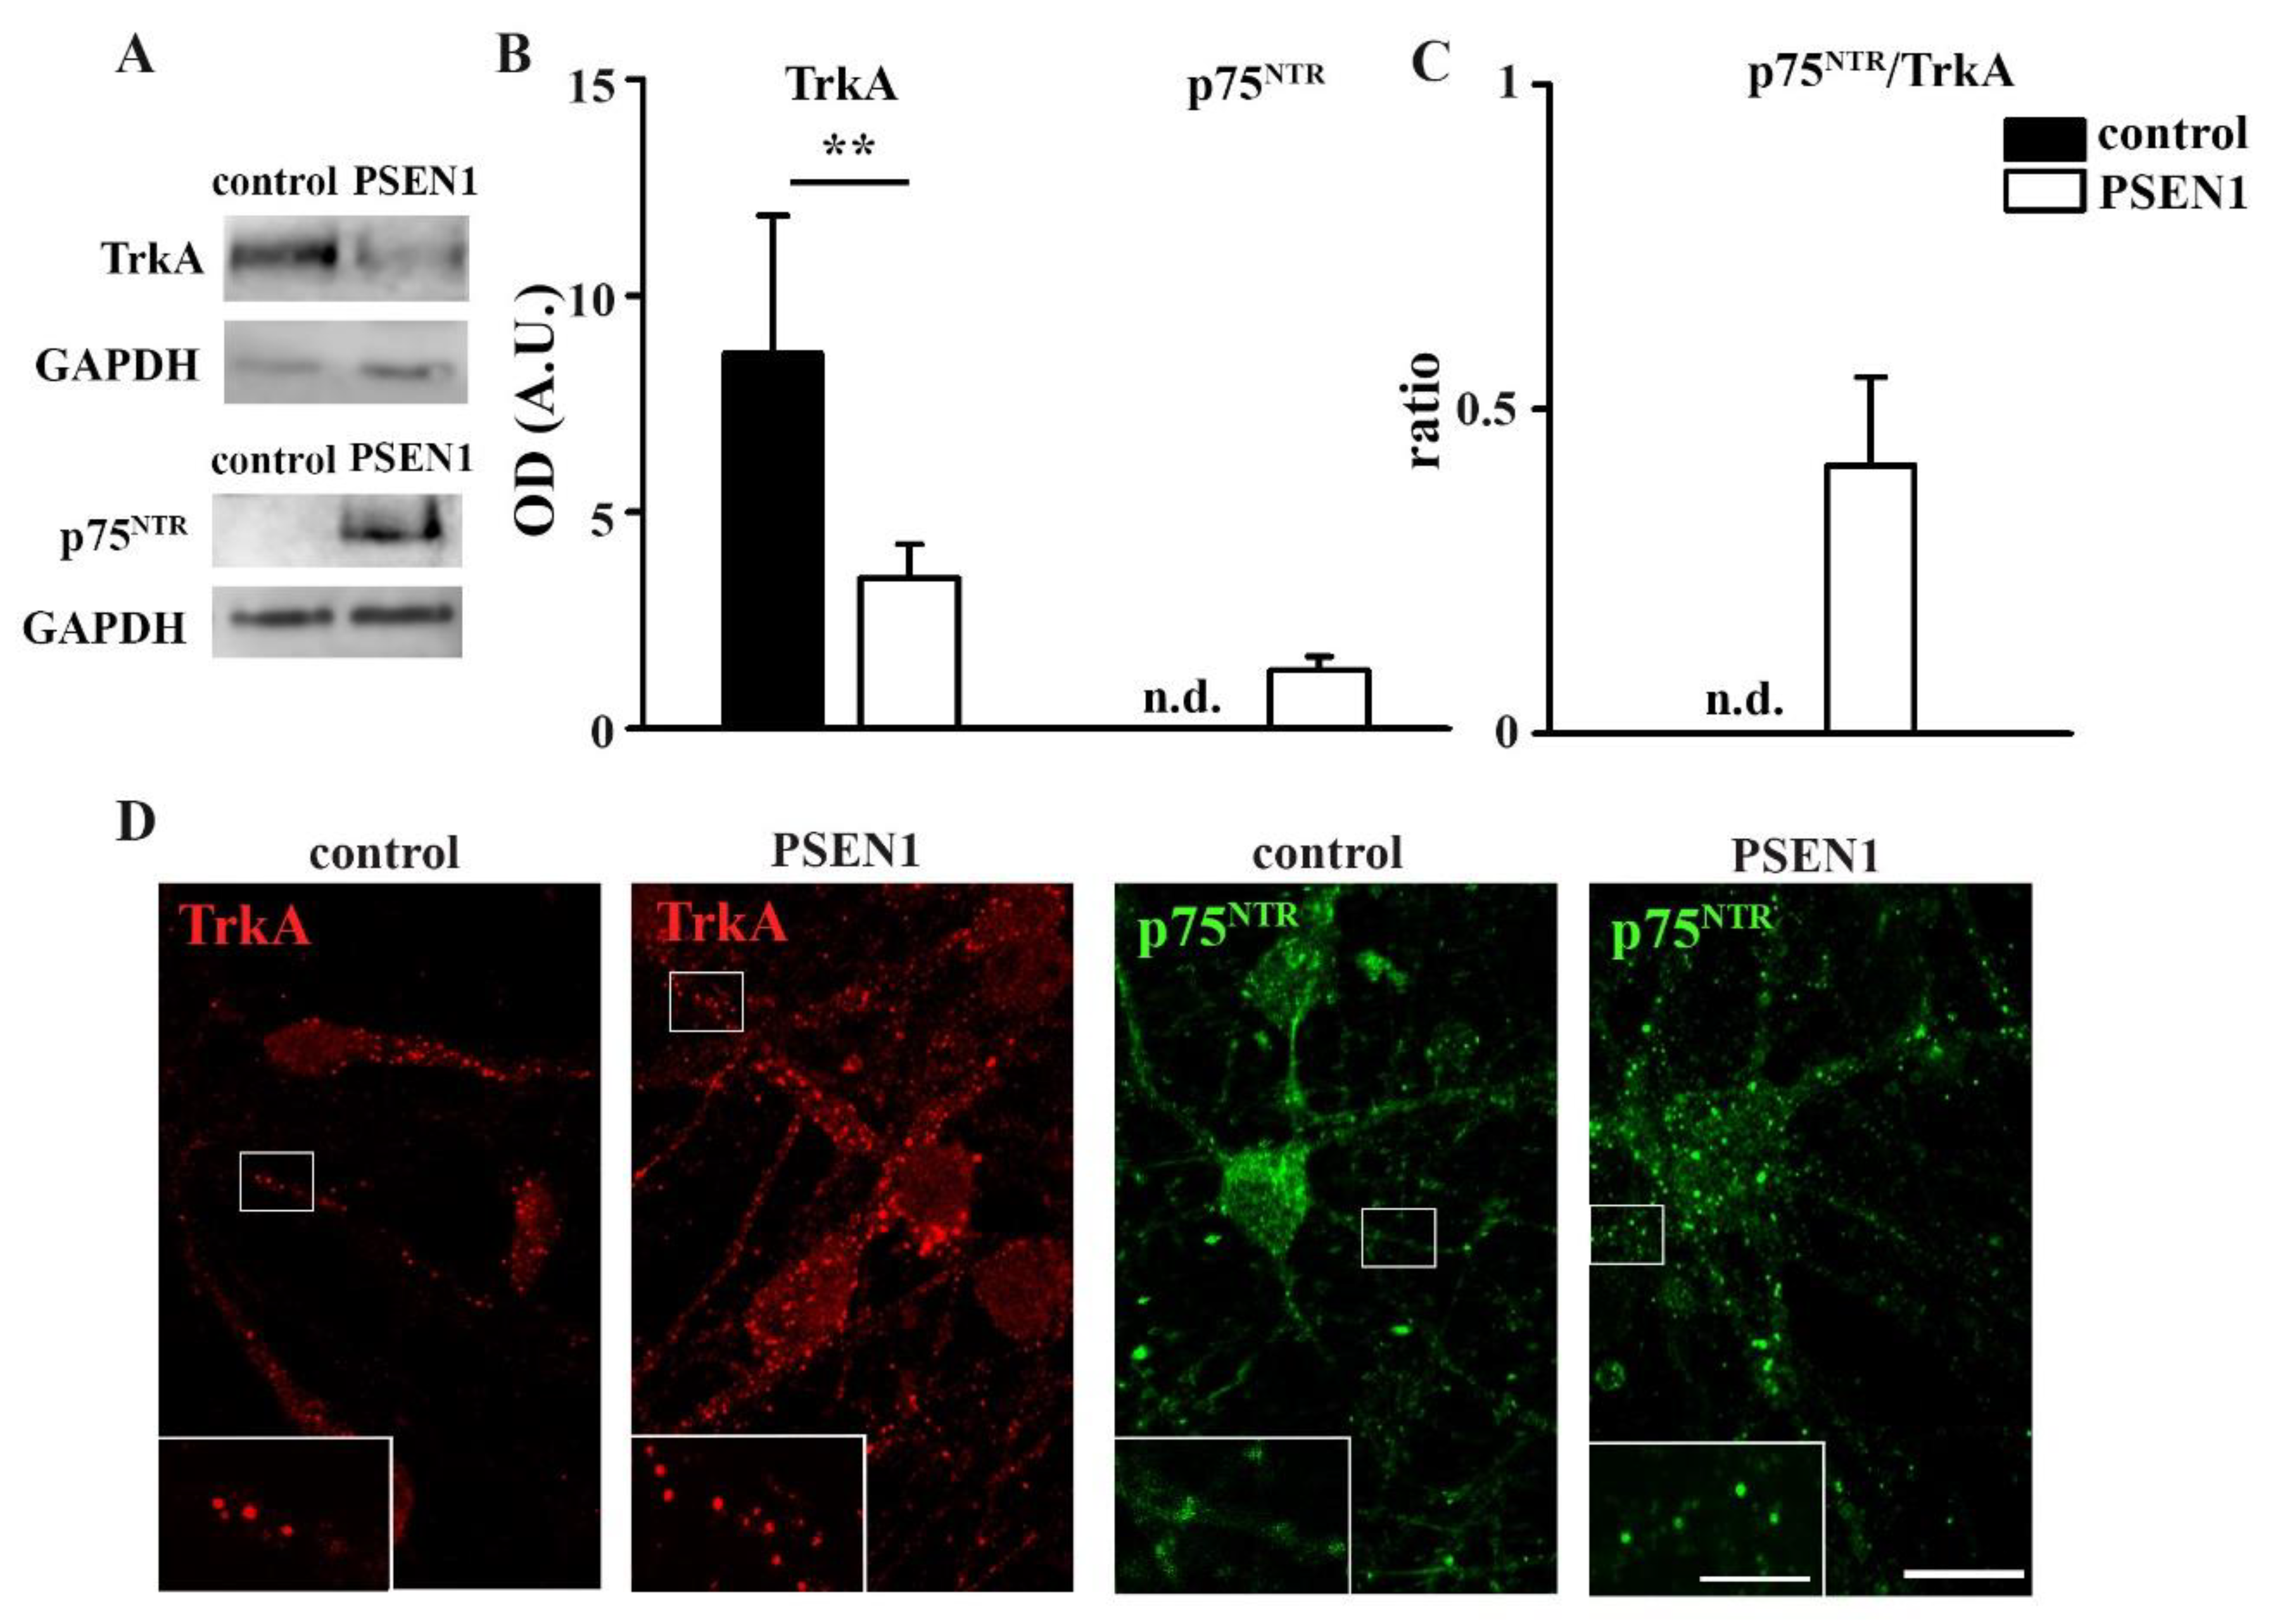
2.2. Expression and Single-Molecule Detection of TrkA and p75NTR in Control and fAD hiPSC-Derived Neurons
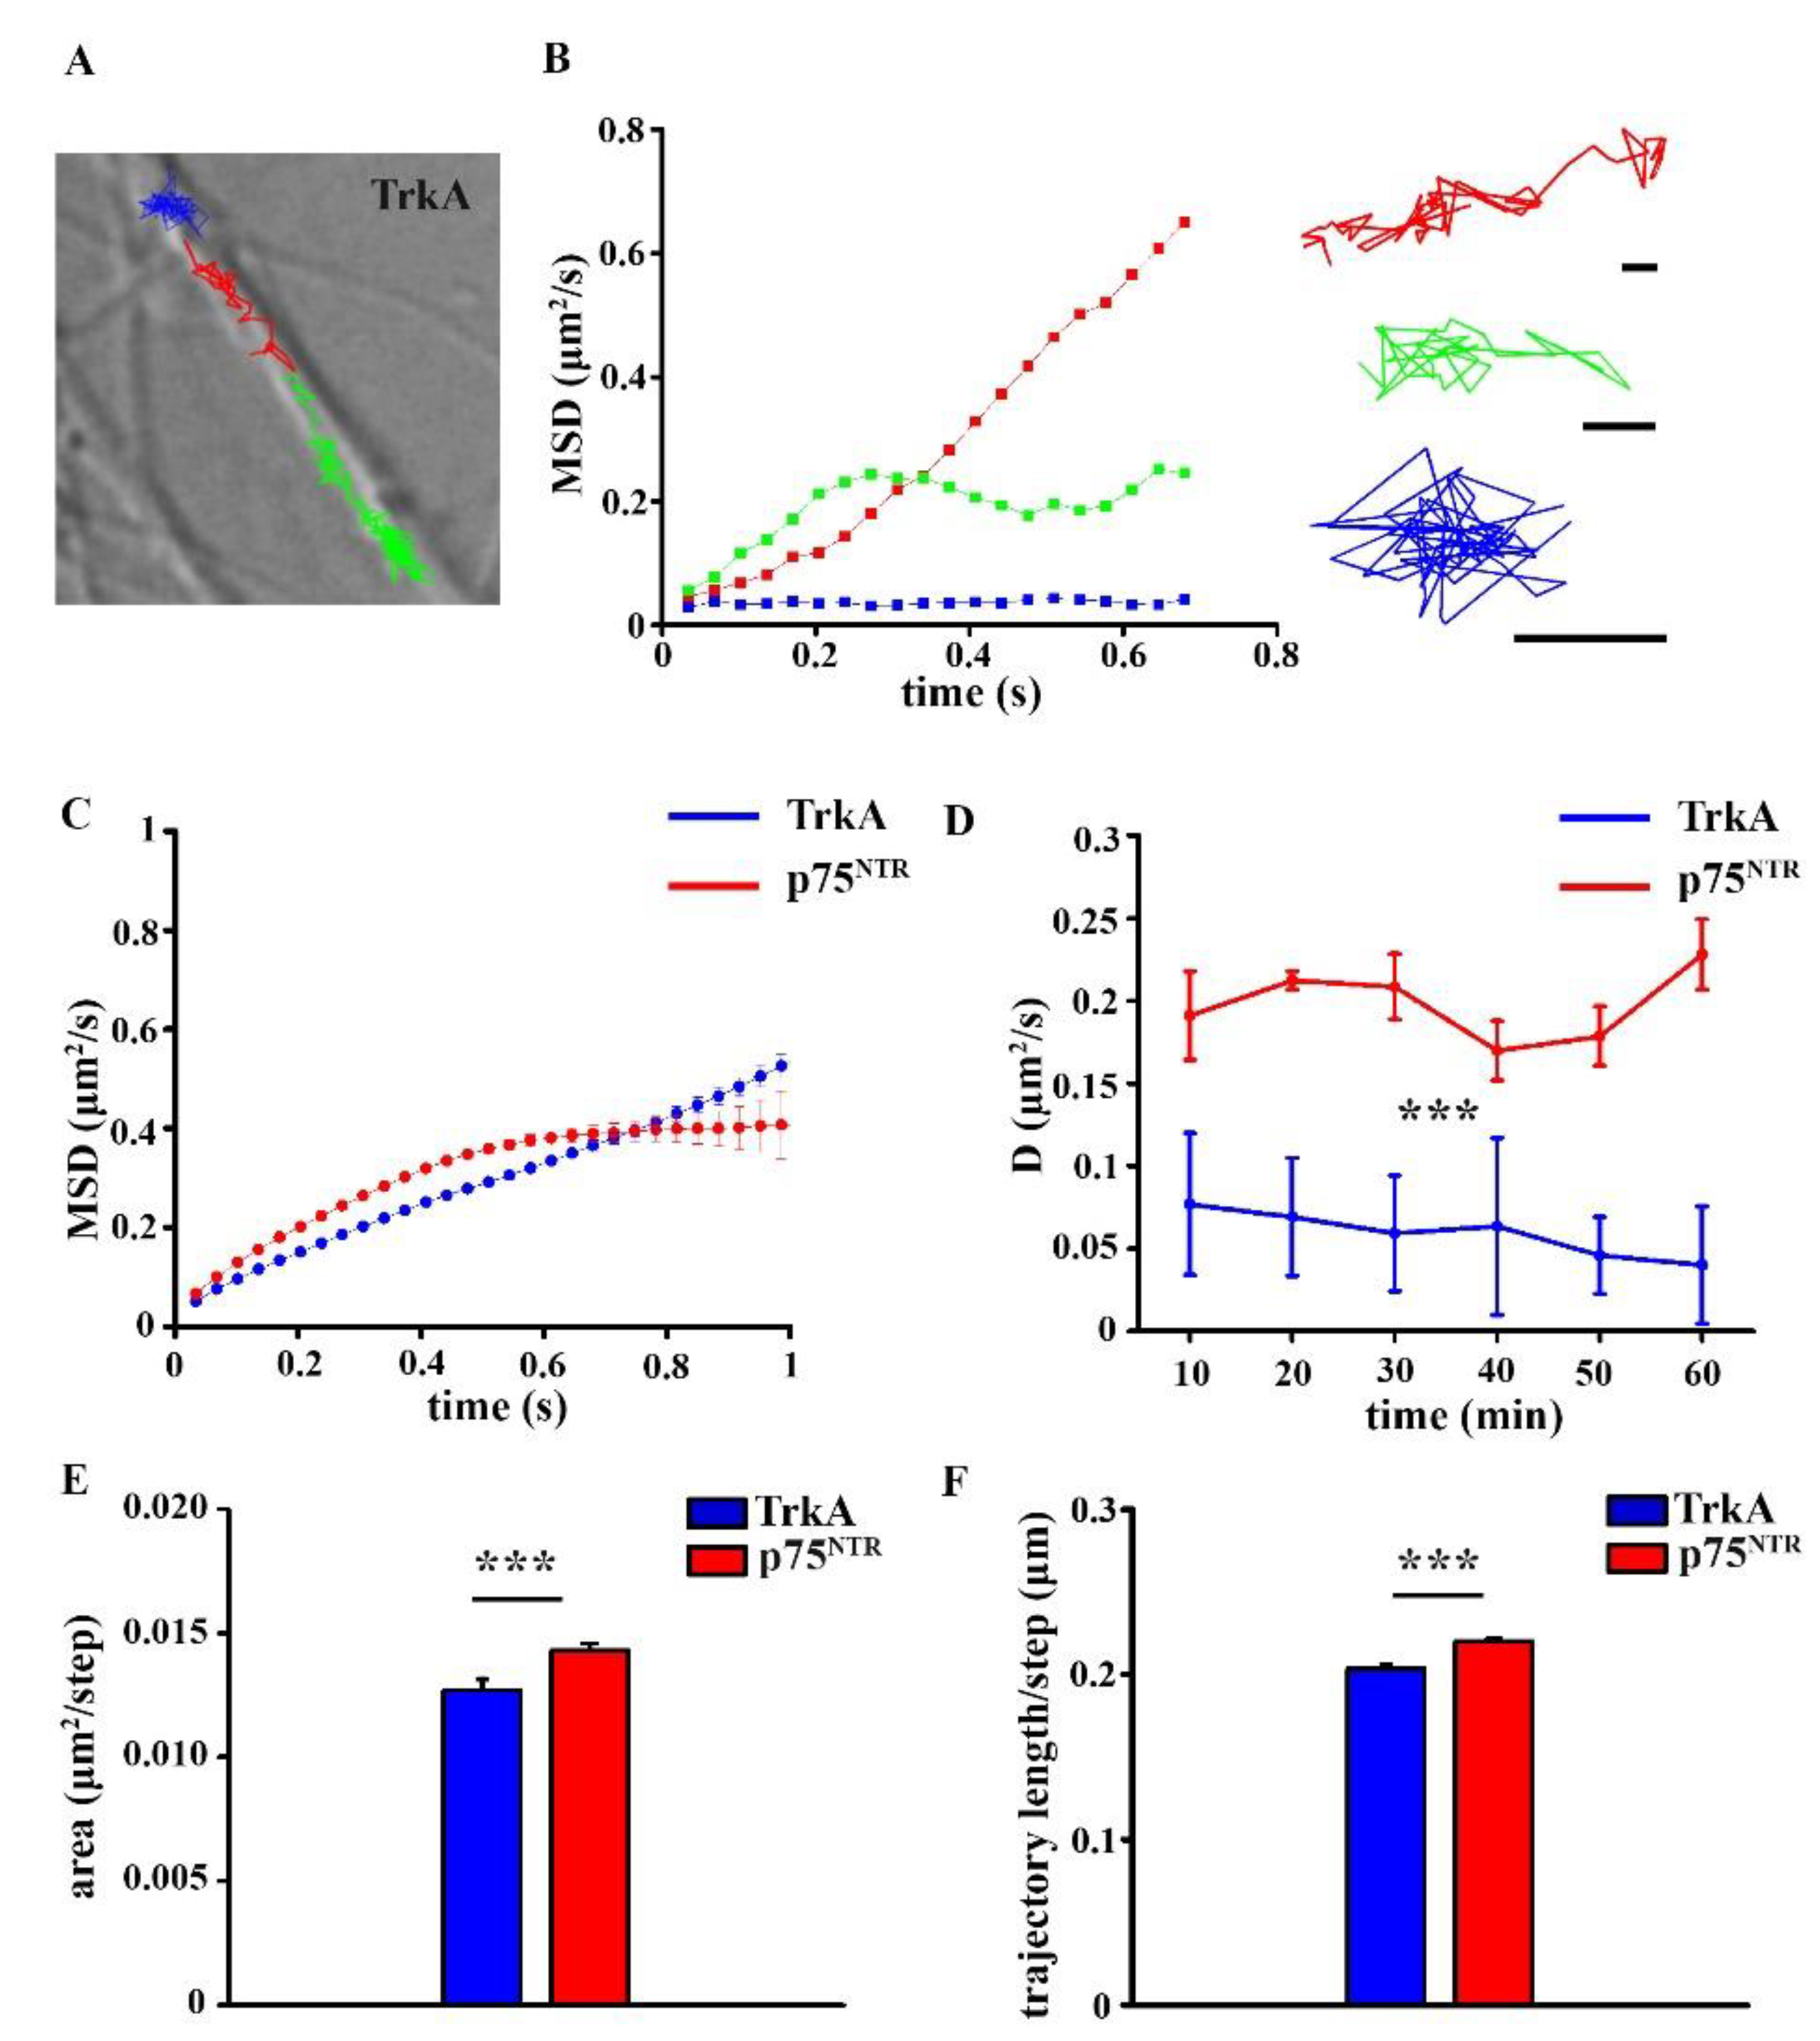
2.3. Surface Movement Characteristics of TrkA and p75NTR in Control hiPSC Neurons
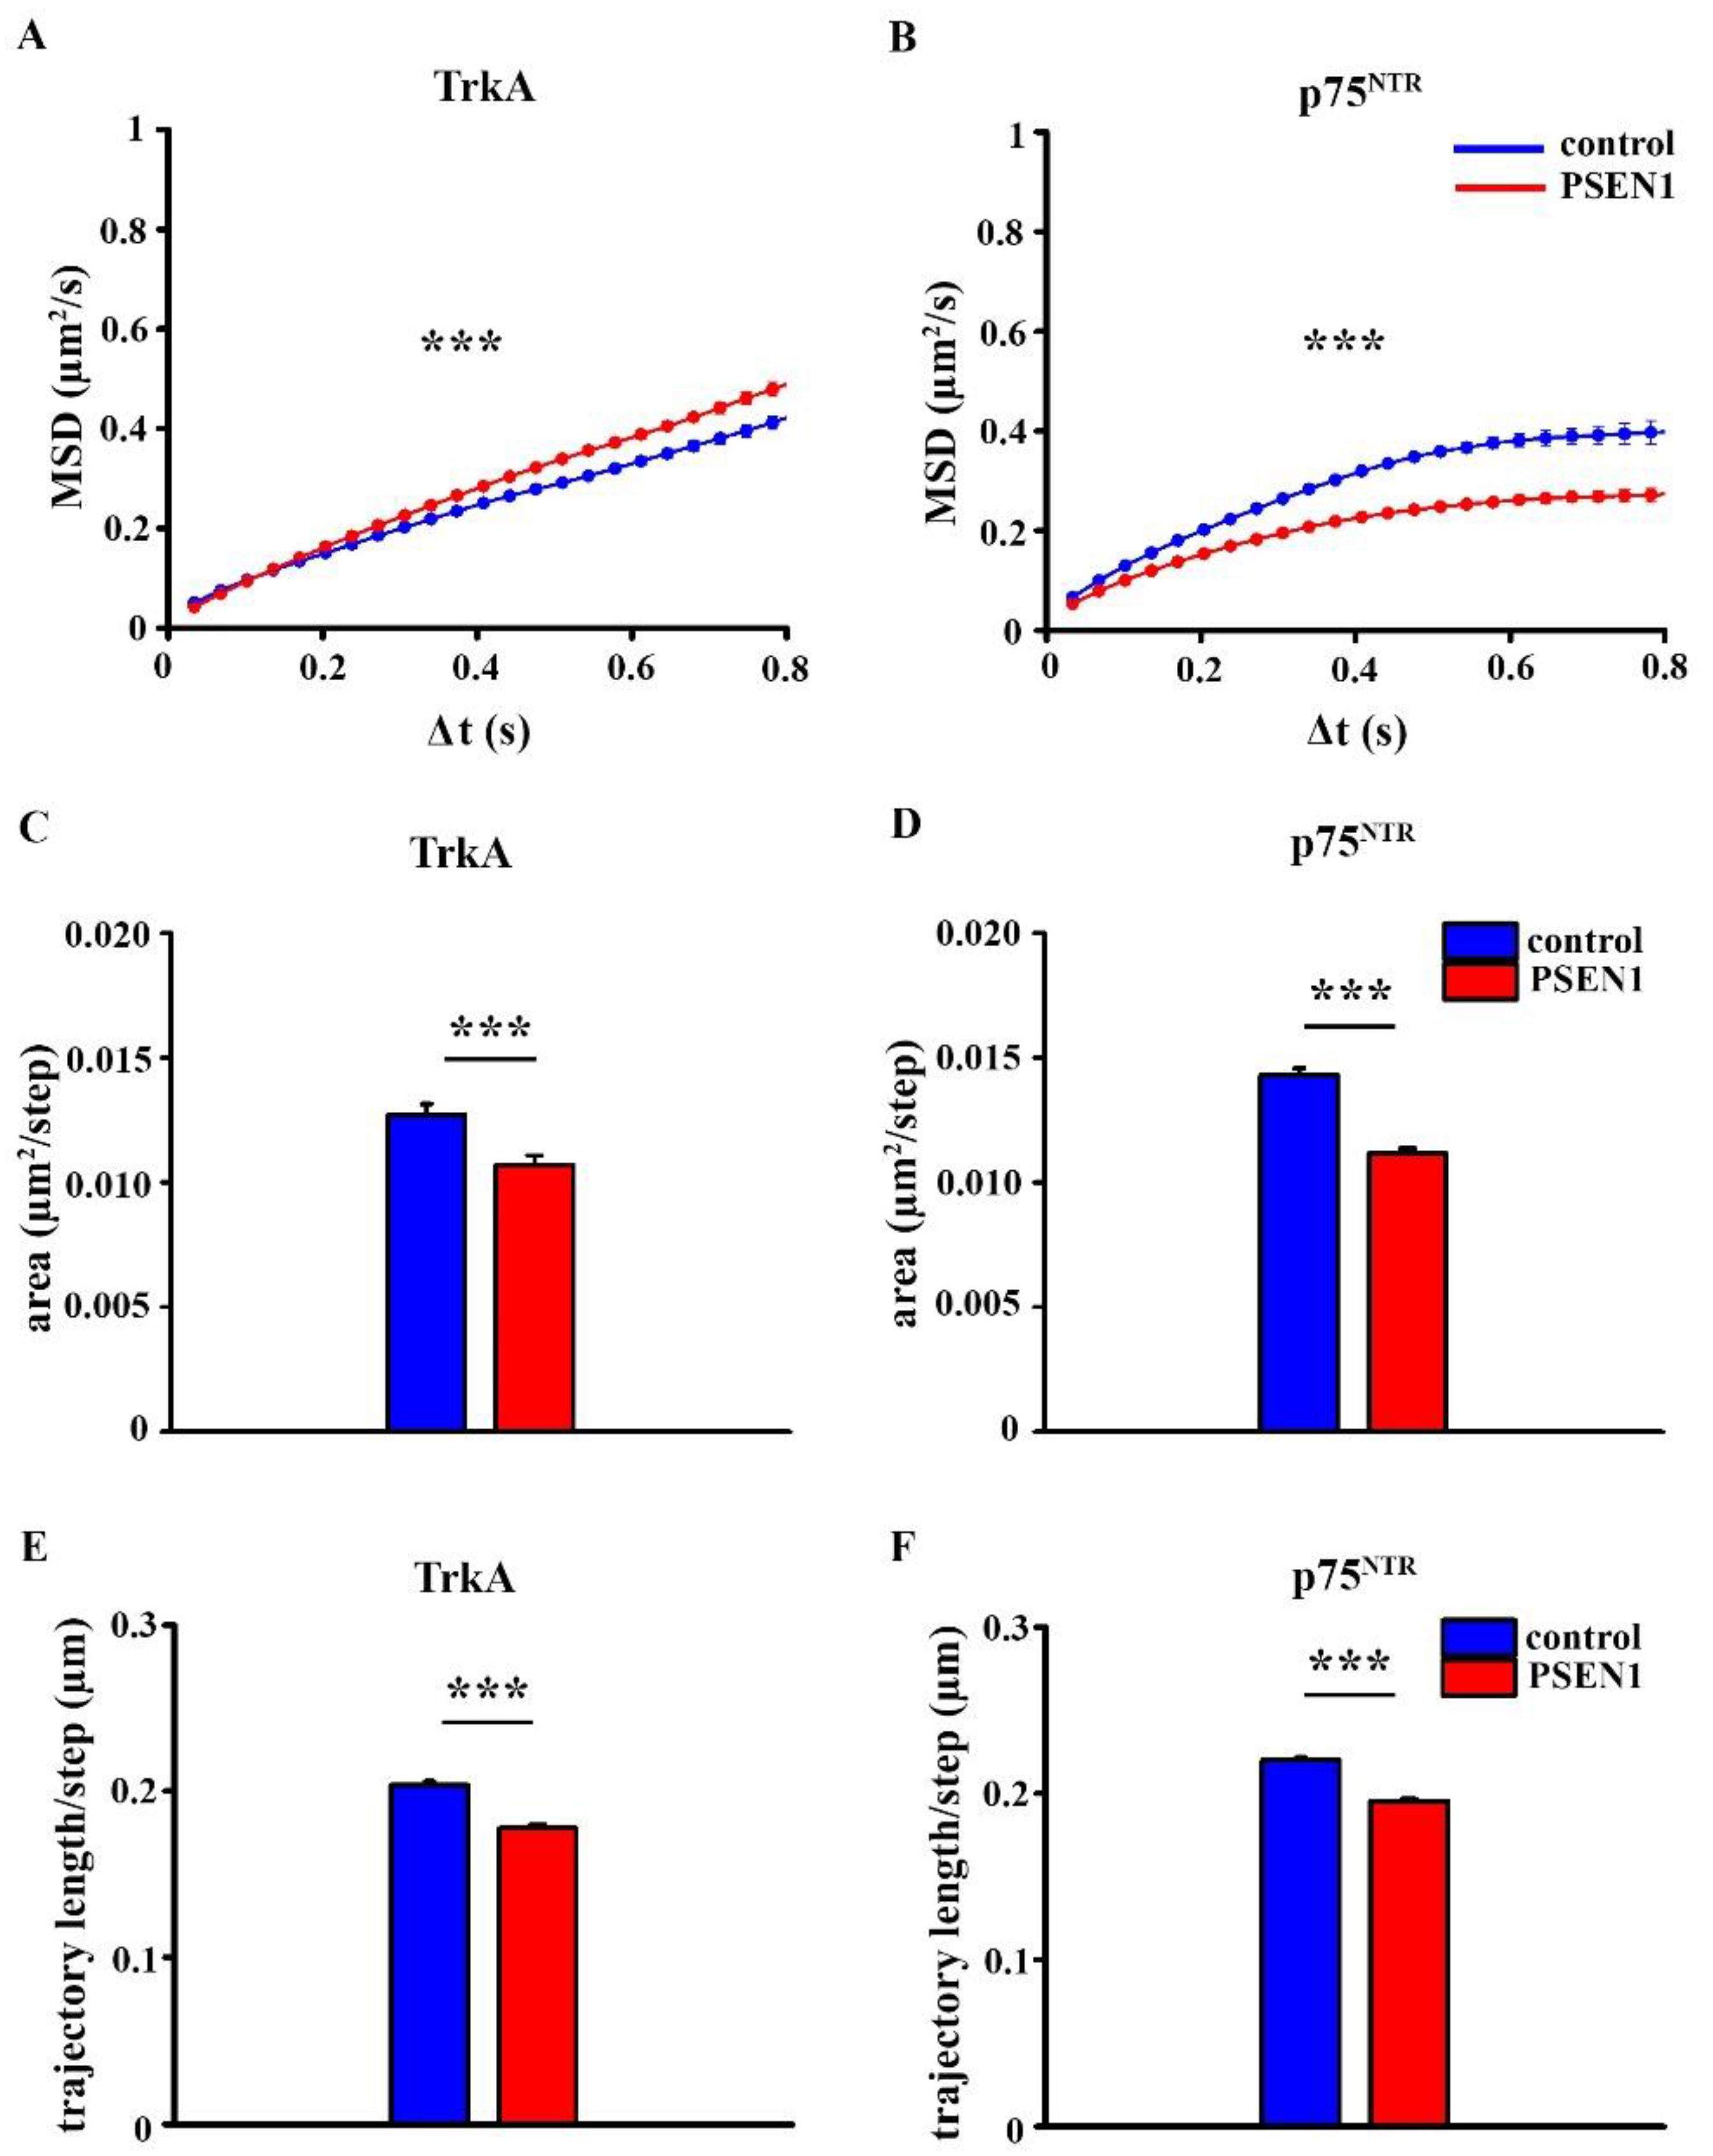
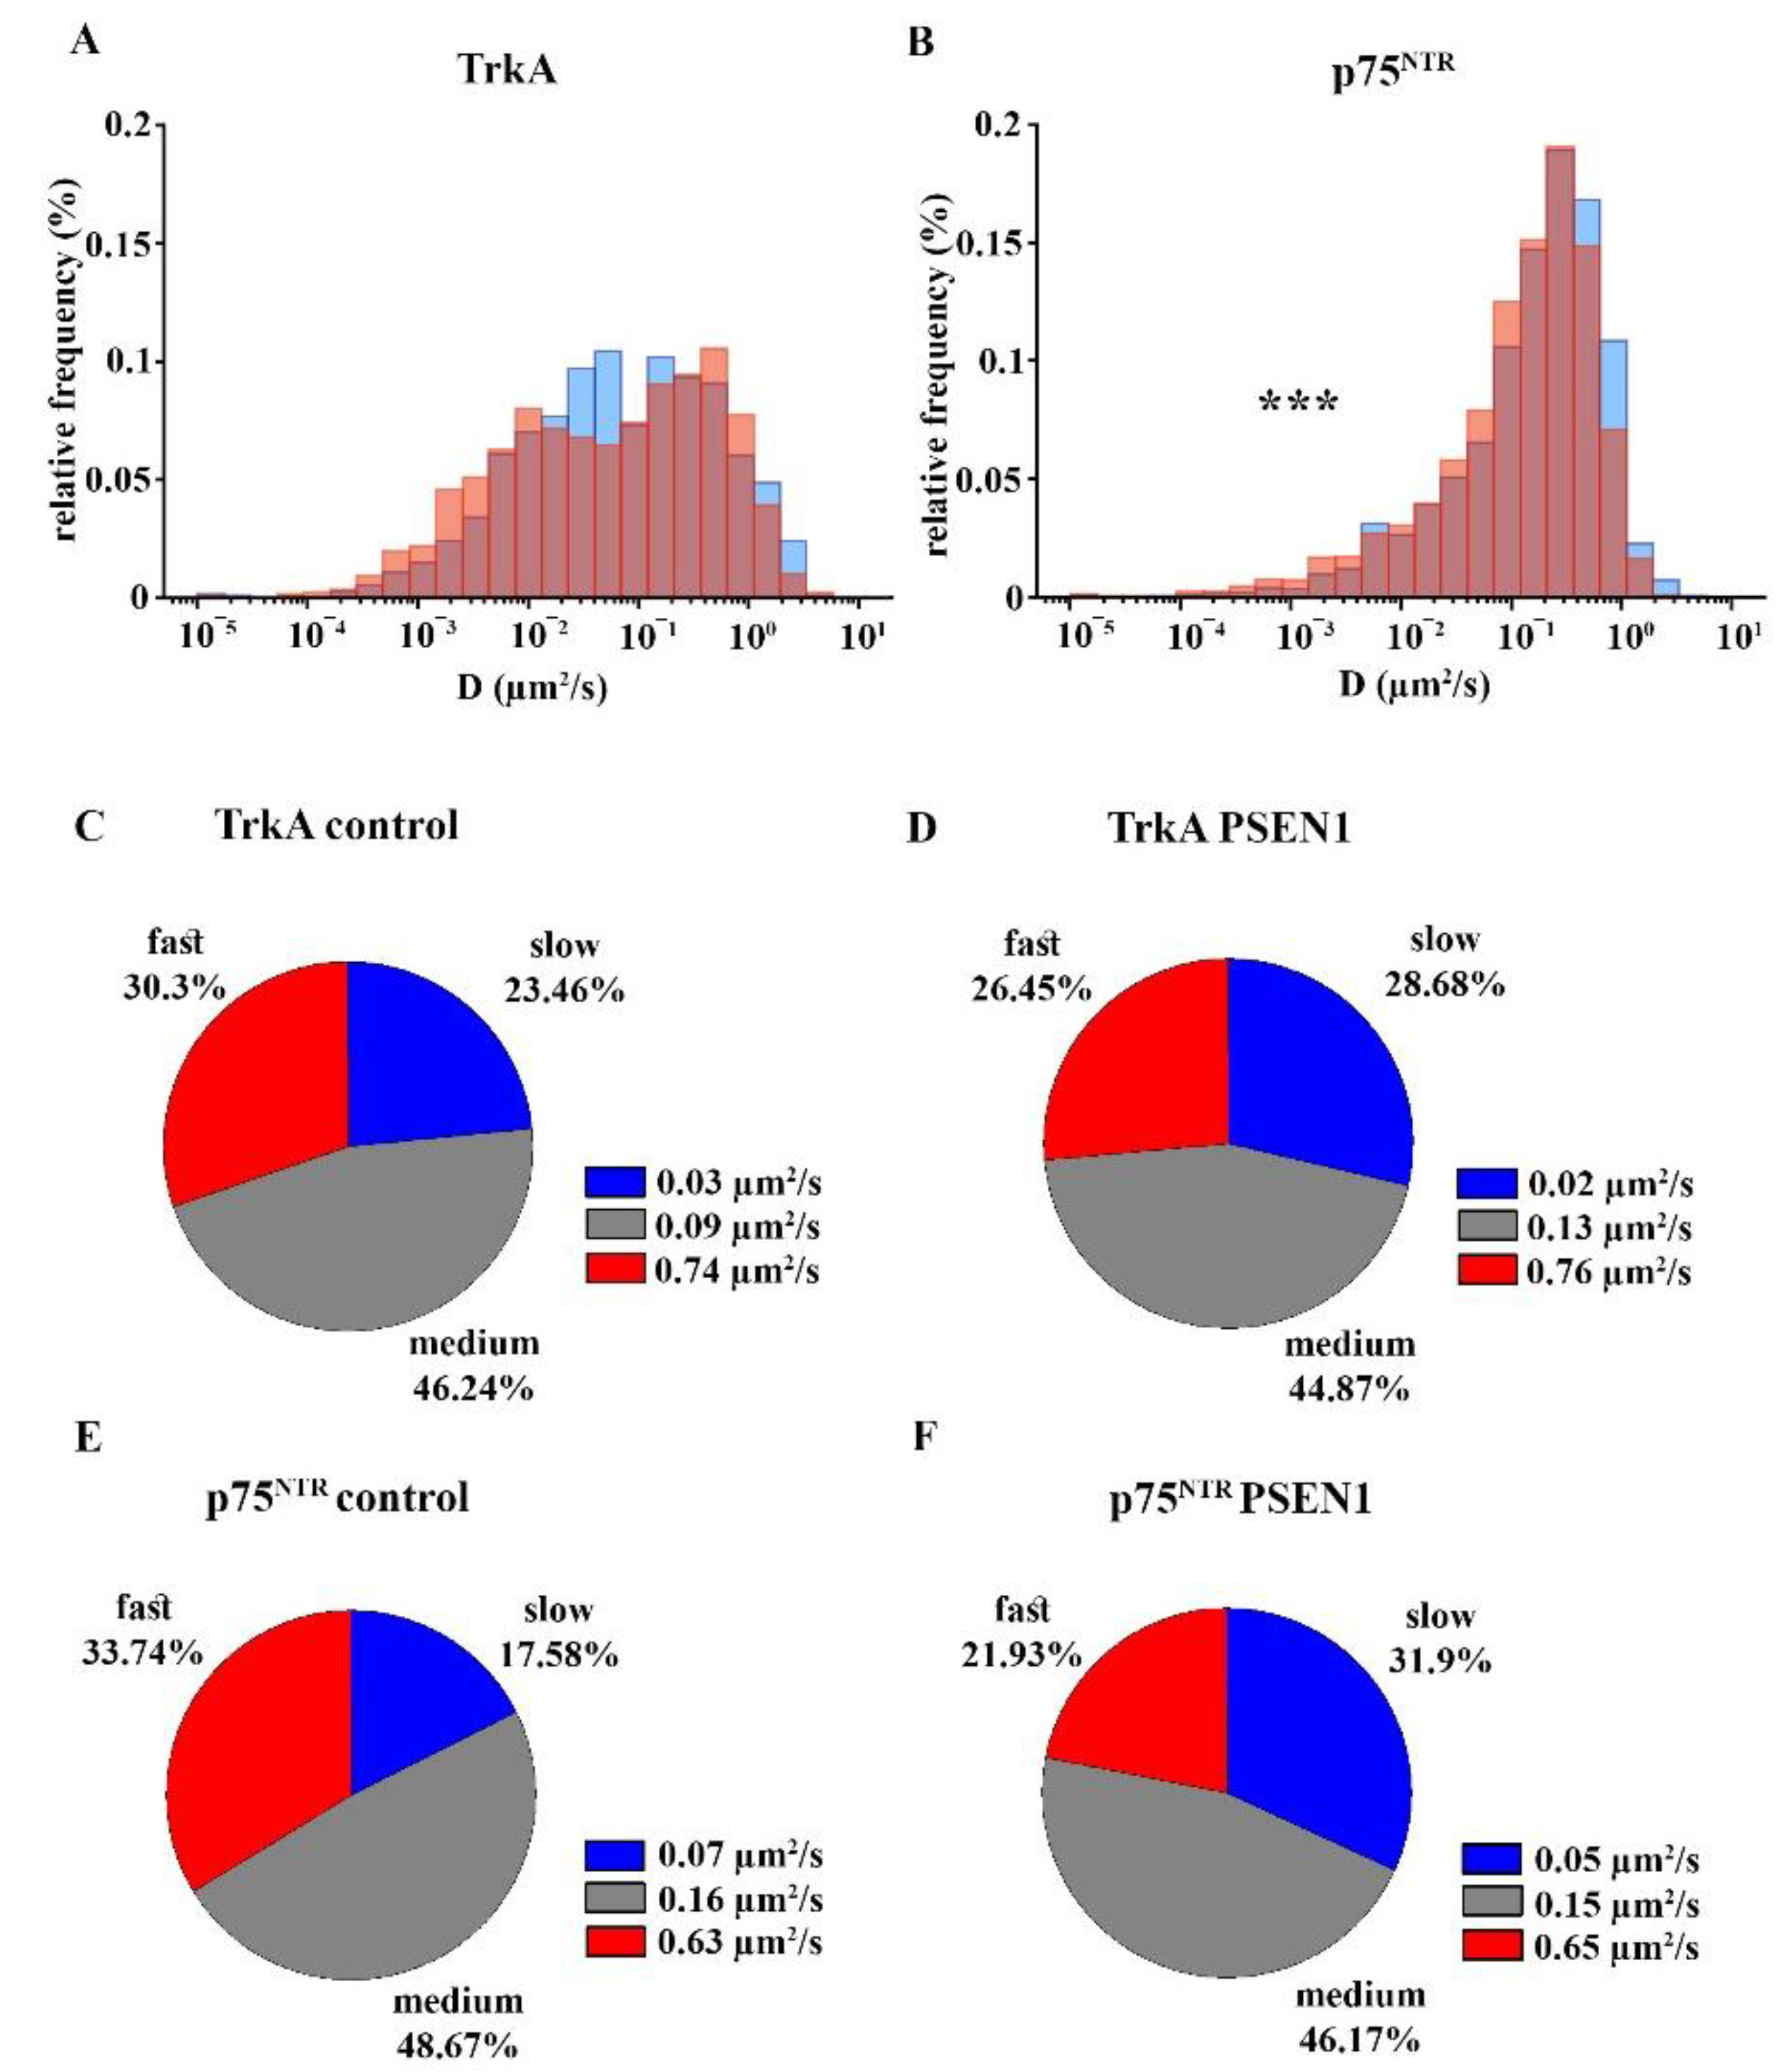
2.4. Comparison of the Surface Movement of TrkA and p75NTR in Control and PSEN1 fAD hiPSC-Derived Neurons
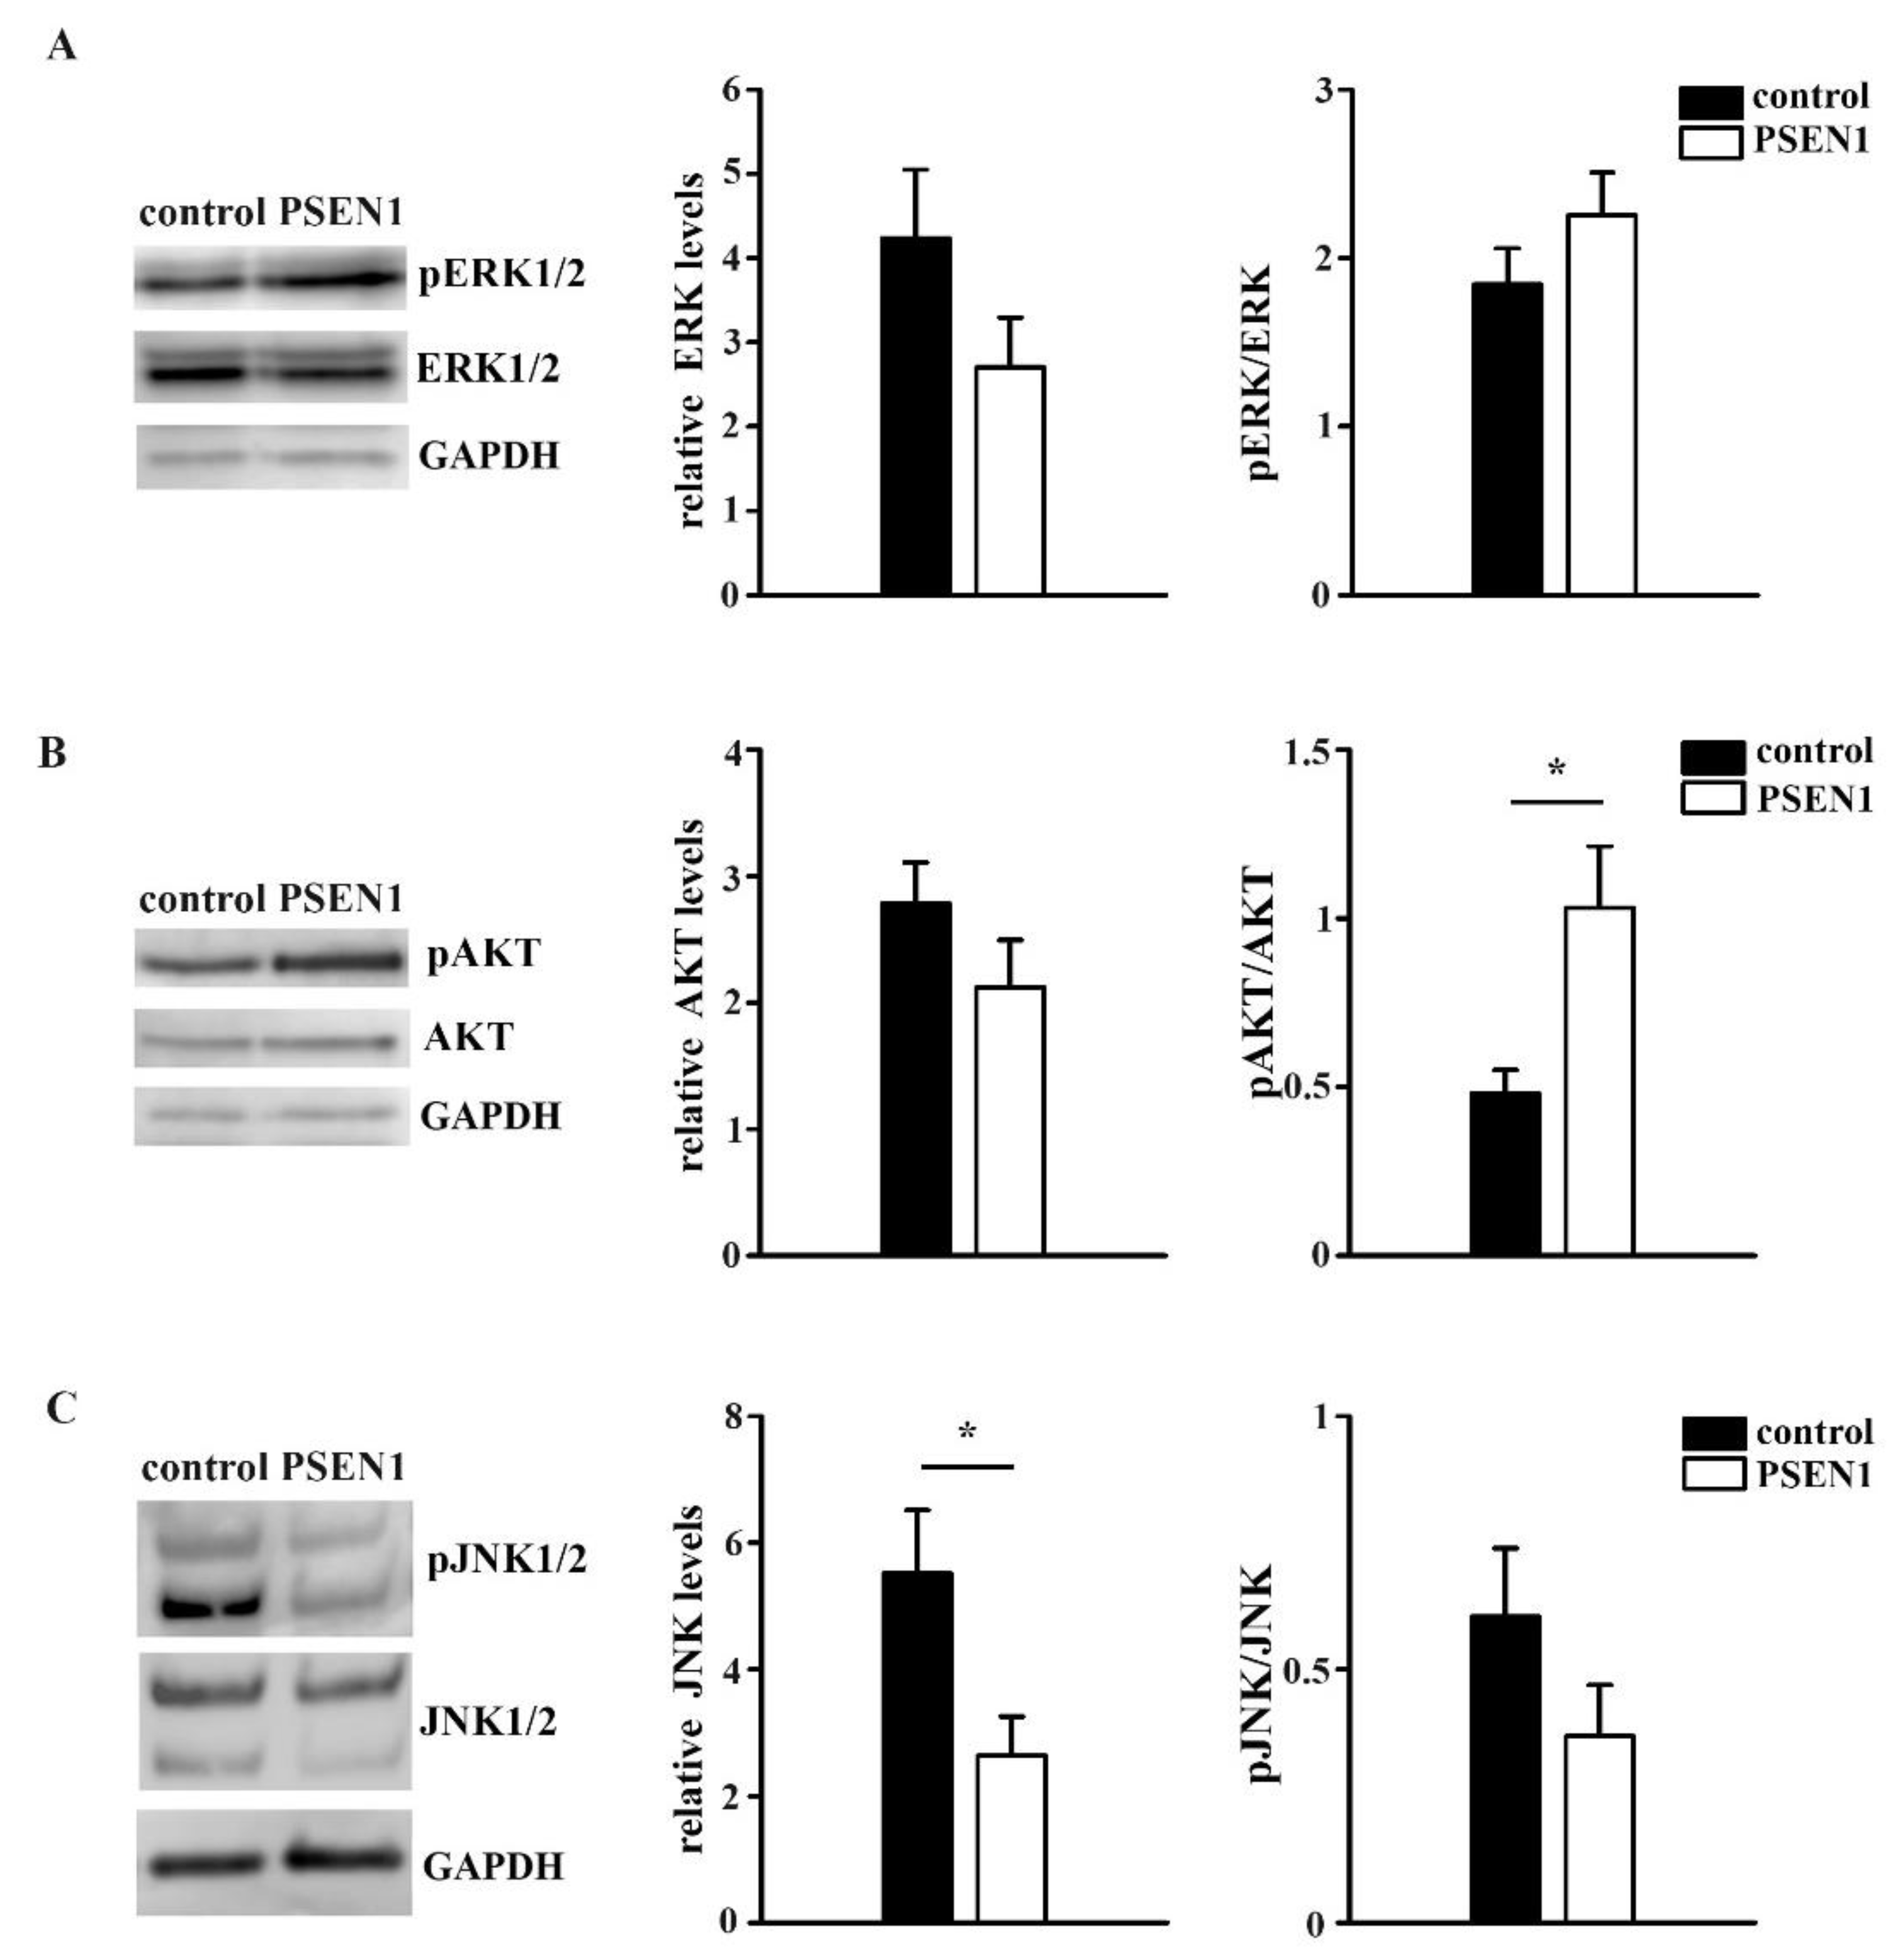
2.5. Expression of the ERK1/2, AKT and JNK1/2 Signaling Pathways in Non-Demented Control and PSEN1 fAD hiPSC-Derived Neurons
3. Discussion
4. Materials and Methods
4.1. Generation of hiPSC-Derived Neurons
4.2. Single-Molecule Imaging and Analysis of TrkA and p75NTR Molecule Surface Movements in Live Neurons Using Total Internal Reflection Fluorescence (TIRF) Microscopy
4.3. Investigation of the Activation of Signaling Pathways in hiPSC-Derived Neuronal Cultures
4.4. Statistical Analysis
Supplementary Materials
Author Contributions
Funding
Institutional Review Board Statement
Informed Consent Statement
Data Availability Statement
Acknowledgments
Conflicts of Interest
References
- Shibata, S.C.; Hibino, K.; Mashimo, T.; Yanagida, T.; Sako, Y. Formation of signal transduction complexes during immobile phase of NGFR movements. Biochem. Biophys. Res. Commun. 2006, 342, 316–322. [Google Scholar] [CrossRef] [PubMed]
- Yanagawa, M.; Hiroshima, M.; Togashi, Y.; Abe, M.; Yamashita, T.; Shichida, Y.; Murata, M.; Ueda, M.; Sako, Y. Single-molecule diffusion-based estimation of ligand effects on G protein–coupled receptors. Sci. Signal. 2018, 11, eaao1917. [Google Scholar] [CrossRef] [PubMed] [Green Version]
- Bohush, A.; Niewiadomska, G.; Filipek, A. Role of Mitogen Activated Protein Kinase Signaling in Parkinson’s Disease. Int. J. Mol. Sci. 2018, 19, 2973. [Google Scholar] [CrossRef] [PubMed] [Green Version]
- Albert-Gascó, H.; Ros-Bernal, F.; Castillo-Gómez, E.; Olucha-Bordonau, F.E. MAP/ERK Signaling in Developing Cognitive and Emotional Function and Its Effect on Pathological and Neurodegenerative Processes. Int. J. Mol. Sci. 2020, 21, 4471. [Google Scholar] [CrossRef] [PubMed]
- Hers, I.; Vincent, E.E.; Tavaré, J.M. Akt signalling in health and disease. Cell. Signal. 2011, 23, 1515–1527. [Google Scholar] [CrossRef]
- Fahnestock, M.; Shekari, A. ProNGF and Neurodegeneration in Alzheimer’s Disease. Front. Neurosci. 2019, 13, 129. [Google Scholar] [CrossRef] [Green Version]
- Rangel-Barajas, C.; Coronel, I.; Florán, B. Dopamine receptors and neurodegeneration. Aging Dis. 2015, 6, 349–368. [Google Scholar] [PubMed] [Green Version]
- Zhang, H.; Zhang, C.; Vincent, J.; Zala, D.; Benstaali, C.; Sainlos, M.; Grillo-Bosch, D.; Daburon, S.; Coussen, F.; Cho, Y.; et al. Modulation of AMPA receptor surface diffusion restores hippocampal plasticity and memory in Huntington’s disease models. Nat. Commun. 2018, 9, 4272. [Google Scholar] [CrossRef]
- O’Brien, R.J.; Wong, P.C. Amyloid precursor protein processing and Alzheimer’s disease. Annu. Rev. Neurosci. 2011, 34, 185–204. [Google Scholar] [CrossRef] [PubMed] [Green Version]
- Piaceri, I.; Nacmias, B.; Sorbi, S. Genetics of familial and sporadic Alzheimer’s disease. Front. Biosci. 2013, 5, 167–177. [Google Scholar] [CrossRef] [Green Version]
- Capsoni, S.; Tiveron, C.; Vignone, D.; Amato, G.; Cattaneo, A. Dissecting the involvement of tropomyosin-related kinase A and p75 neurotrophin receptor signaling in NGF deficit-induced neurodegeneration. Proc. Natl. Acad. Sci. USA 2010, 107, 12299–12304. [Google Scholar] [CrossRef] [Green Version]
- Huang, E.J.; Reichardt, L.F. Trk Receptors: Roles in Neuronal Signal Transduction. Annu. Rev. Biochem. 2003, 72, 609–642. [Google Scholar] [CrossRef] [Green Version]
- Mamidipudi, V.; Wooten, M.W. Review Dual Role for p75 NTR Signaling in Survival and Cell Death: Can Intracellular Mediators Provide an Explanation? J. Neurosci. Res. 2002, 68, 373–384. [Google Scholar] [CrossRef] [PubMed]
- Segal, R.A. SELECTIVITY IN NEUROTROPHIN SIGNALING: Theme and Variations. Annu. Rev. Neurosci. 2003, 26, 299–330. [Google Scholar] [CrossRef]
- Mok, S.-A.; Lund, K.; Campenot, R.B. Neurotrophin-regulated retrograde apoptotic signal 546 A retrograde apoptotic signal originating in NGF-deprived distal axons of rat sympathetic neurons in compartmented cultures. Cell Res. 2009, 19, 546–560. [Google Scholar] [CrossRef] [PubMed] [Green Version]
- Bhakar, A.L.; Howell, J.L.; Paul, C.E.; Salehi, A.H.; Becker, E.B.E.; Said, F.; Bonni, A.; Barker, P.A. Apoptosis induced by p75NTR overexpression requires Jun kinase-dependent phosphorylation of Bad. J. Neurosci. 2003, 23, 11373–11381. [Google Scholar] [CrossRef]
- Foehr, E.D.; Lin, X.; O’Mahony, A.; Geleziunas, R.; Bradshaw, R.A.; Greene, W.C. NF-kappa B signaling promotes both cell survival and neurite process formation in nerve growth factor-stimulated PC12 cells. J. Neurosci. 2000, 20, 7556–7563. [Google Scholar] [CrossRef] [Green Version]
- Roux, P.P.; Bhakar, A.L.; Kennedy, T.E.; Barker, P.A. The p75 Neurotrophin Receptor Activates Akt (Protein Kinase B) through a Phosphatidylinositol 3-Kinase-dependent Pathway. J. Biol. Chem. 2001, 276, 23097–23104. [Google Scholar] [CrossRef] [Green Version]
- Yuan, T.; Liao, W.; Feng, N.-H.; Lou, Y.-L.; Niu, X.; Zhang, A.-J.; Wang, Y.; Deng, Z.-F. Human induced pluripotent stem cell-derived neural stem cells survive, migrate, differentiate, and improve neurological function in a rat model of middle cerebral artery occlusion. Stem Cell Res. Ther. 2013, 4, 73. [Google Scholar] [CrossRef] [Green Version]
- Hossini, A.M.; Megges, M.; Prigione, A.; Lichtner, B.; Toliat, M.R.; Wruck, W.; Schröter, F.; Nuernberg, P.; Kroll, H.; Makrantonaki, E.; et al. Induced pluripotent stem cell-derived neuronal cells from a sporadic Alzheimer’s disease donor as a model for investigating AD-associated gene regulatory networks. BMC Genom. 2015, 16, 84. [Google Scholar]
- Takahashi, K.; Yamanaka, S. Induction of pluripotent stem cells from mouse embryonic and adult fibroblast cultures by defined factors. Cell 2006, 126, 663–676. [Google Scholar] [CrossRef] [PubMed] [Green Version]
- Chambers, S.M.; Fasano, C.A.; Papapetrou, E.P.; Tomishima, M.; Sadelain, M.; Studer, L. Highly efficient neural conversion of human ES and iPS cells by dual inhibition of SMAD signaling. Nat. Biotechnol. 2009, 27, 275–280. [Google Scholar] [CrossRef] [Green Version]
- Lo Giudice, M.; Mihalik, B.; Turi, Z.; Dinnyés, A.; Kobolák, J. Calcilytic NPS 2143 Reduces Amyloid Secretion and Increases sAβPPα Release from PSEN1 Mutant iPSC-Derived Neurons. J. Alzheimer’s Dis. 2019, 72, 885–899. [Google Scholar] [CrossRef] [Green Version]
- Ochalek, A.; Mihalik, B.; Avci, H.X.; Chandrasekaran, A.; Téglási, A.; Bock, I.; Giudice, M.L.; Táncos, Z.; Molnar, K.; Laszlo, L.; et al. Neurons derived from sporadic Alzheimer’s disease iPSCs reveal elevated TAU hyperphosphorylation, increased amyloid levels, and GSK3B activation. Alzheimer’s Res. Ther. 2017, 9, 90. [Google Scholar] [CrossRef] [Green Version]
- Hiroshima, M.; Pack, C.-G.; Kaizu, K.; Takahashi, K.; Ueda, M.; Sako, Y. Transient Acceleration of Epidermal Growth Factor Receptor Dynamics Produces Higher-Order Signaling Clusters. J. Mol. Biol. 2018, 430, 1386–1401. [Google Scholar] [CrossRef]
- Murakoshi, H.; Iino, R.; Kobayashi, T.; Fujiwara, T.; Ohshima, C.; Yoshimura, A.; Kusumi, A. Single-molecule imaging analysis of Ras activation in living cells. Proc. Natl. Acad. Sci. USA 2004, 101, 7317–7322. [Google Scholar] [CrossRef] [PubMed] [Green Version]
- Makino, H.; Malinow, R. AMPA receptor incorporation into synapses during LTP: The role of lateral movement and exocytosis. Neuron 2009, 64, 381–390. [Google Scholar] [CrossRef] [Green Version]
- Counts, S.E.; Nadeem, M.; Wuu, J.; Ginsberg, S.D.; Saragovi, H.U.; Mufson, E.J. Reduction of cortical TrkA but not p75NTR protein in early-stage Alzheimer’s disease. Ann. Neurol. 2004, 56, 520–531. [Google Scholar] [CrossRef]
- Costantini, C.; Weindruch, R.; Della Valle, G.; Puglielli, L. A TrkA-to-p75NTR molecular switch activates amyloid beta-peptide generation during aging. Biochem. J. 2005, 391, 59–67. [Google Scholar] [CrossRef] [Green Version]
- Sycheva, M.; Sustarich, J.; Zhang, Y.; Selvaraju, V.; Geetha, T.; Gearing, M.; Babu, J.R. Pro-Nerve Growth Factor Induces Activation of RhoA Kinase and Neuronal Cell Death. Brain Sci. 2019, 9, 204. [Google Scholar] [CrossRef] [Green Version]
- Sako, Y.; Nagafuchi, A.; Tsukita, S.; Takeichi, M.; Kusumi, A. Cytoplasmic regulation of the movement of E-cadherin on the free cell surface as studied by optical tweezers and single particle tracking: Corralling and tethering by the membrane skeleton. J. Cell Biol. 1998, 140, 1227–1240. [Google Scholar] [CrossRef]
- Duncan, A.; Reddy, T.; Koldsø, H.; Hélie, J.; Fowler, P.W.; Chavent, M.; Sansom, M.S.P. Protein crowding and lipid complexity influence the nanoscale dynamic organization of ion channels in cell membranes. Sci. Rep. 2017, 7, 16647. [Google Scholar] [CrossRef] [Green Version]
- Corradi, V.; Sejdiu, B.I.; Mesa-Galloso, H.; Abdizadeh, H.; Noskov, S.Y.; Marrink, S.J.; Tieleman, D.P. Emerging Diversity in Lipid-Protein Interactions. Chem. Rev. 2019, 119, 5775–5848. [Google Scholar] [CrossRef] [PubMed] [Green Version]
- Löwe, M.; Kalacheva, M.; Boersma, A.J.; Kedrov, A. The more the merrier: Effects of macromolecular crowding on the structure and dynamics of biological membranes. FEBS J. 2020, 287, 5039–5067. [Google Scholar] [CrossRef]
- Guigas, G.; Weiss, M. Effects of protein crowding on membrane systems. Biochim Biophys. Acta-Biomembr. 2016, 1858, 2441–2450. [Google Scholar] [CrossRef]
- Kusumi, A.; Sako, Y. Cell surface organization by the membrane skeleton. Curr. Opin. Cell Biol. 1996, 8, 566–574. [Google Scholar] [CrossRef]
- Kusumi, A.; Nakada, C.; Ritchie, K.; Murase, K.; Suzuki, K.; Murakoshi, H.; Kasai, R.S.; Kondo, J.; Fujiwara, T. Paradigm Shift of the Plasma Membrane Concept from the Two-Dimensional Continuum Fluid to the Partitioned Fluid: High-Speed Single-Molecule Tracking of Membrane Molecules. Annu. Rev. Biophys. Biomol. Struct. 2005, 34, 351–378. [Google Scholar] [CrossRef] [Green Version]
- Xu, K.; Zhong, G.; Zhuang, X. Actin, spectrin, and associated proteins form a periodic cytoskeletal structure in axons. Science 2013, 339, 452–456. [Google Scholar] [CrossRef] [Green Version]
- Zhong, G.; He, J.; Zhou, R.; Lorenzo, D.; Babcock, H.P.; Bennett, V.; Zhuang, X. Developmental mechanism of the periodic membrane skeleton in axons. eLife 2014, 3, e04581. [Google Scholar] [CrossRef]
- He, J.; Zhou, R.; Wu, Z.; Carrasco, M.A.; Kurshan, P.T.; Farley, J.E.; Simon, D.J.; Wang, G.; Han, B.; Hao, J.; et al. Prevalent presence of periodic actin-spectrin-based membrane skeleton in a broad range of neuronal cell types and animal species. Proc. Natl. Acad. Sci. USA 2016, 113, 6029–6034. [Google Scholar] [CrossRef] [PubMed] [Green Version]
- Leterrier, C.; Potier, J.; Caillol, G.; Debarnot, C.; Rueda Boroni, F.; Dargent, B. Nanoscale Architecture of the Axon Initial Segment Reveals an Organized and Robust Scaffold. Cell Rep. 2015, 13, 2781–2793. [Google Scholar] [CrossRef] [Green Version]
- D’Este, E.; Kamin, D.; Göttfert, F.; El-Hady, A.; Hell, S.W. STED Nanoscopy Reveals the Ubiquity of Subcortical Cytoskeleton Periodicity in Living Neurons. Cell Rep. 2015, 10, 1246–1251. [Google Scholar] [CrossRef] [Green Version]
- Unsain, N.; Stefani, F.D.; Cáceres, A. The Actin/Spectrin Membrane-Associated Periodic Skeleton in Neurons. Front. Synaptic Neurosci. 2018, 10, 10. [Google Scholar] [CrossRef] [Green Version]
- Walter, J.; van Echten-Deckert, G. Cross-talk of membrane lipids and Alzheimer-related proteins. Mol. Neurodegener. 2013, 8, 56. [Google Scholar] [CrossRef] [Green Version]
- Yan, X.-X.; Jeromin, A.; Jeromin, A. Spectrin Breakdown Products (SBDPs) as Potential Biomarkers for Neurodegenerative Diseases. Curr. Transl. Geriatr. Exp. Gerontol. Rep. 2012, 1, 85–93. [Google Scholar] [CrossRef] [Green Version]
- Marchetti, L.; Bonsignore, F.; Gobbo, F.; Amodeo, R.; Calvello, M.; Jacob, A.; Signore, G.; Spagnolo, C.S.; Porciani, D.; Mainardi, M.; et al. Fast-diffusing p75(NTR) monomers support apoptosis and growth cone collapse by neurotrophin ligands. Proc. Natl. Acad. Sci. USA 2019, 116, 21563–21572. [Google Scholar] [CrossRef] [Green Version]
- Costantini, C.; Scrable, H.; Puglielli, L. An aging pathway controls the TrkA to p75NTR receptor switch and amyloid β-peptide generation. EMBO J. 2006, 25, 1997–2006. [Google Scholar] [CrossRef] [PubMed] [Green Version]
- Kwart, D.; Gregg, A.; Scheckel, C.; Murphy, E.; Paquet, D.; Duffield, M.; Fak, J.; Olsen, O.; Darnell, R.B.; Tessier-Lavigne, M. A Large Panel of Isogenic APP and PSEN1 Mutant Human iPSC Neurons Reveals Shared Endosomal Abnormalities Mediated by APP β-CTFs, Not Aβ. Neuron 2019, 104, 256–270.e5. [Google Scholar] [CrossRef] [PubMed]
- Nemes, C.; Varga, E.; Táncos, Z.; Bock, I.; Francz, B.; Kobolák, J.; Dinnyés, A. Establishment of PSEN1 mutant induced pluripotent stem cell (iPSC) line from an Alzheimer’s disease (AD) female patient. Stem Cell Res. 2016, 17, 69–71. [Google Scholar] [CrossRef] [PubMed] [Green Version]
- Tubsuwan, A.; Pires, C.; Rasmussen, M.A.; Schmid, B.; Nielsen, J.E.; Hjermind, L.E.; Hall, V.J.; Nielsen, T.T.; Waldemar, G.; Hyttel, P.; et al. Generation of induced pluripotent stem cells (iPSCs) from an Alzheimer’s disease patient carrying a L150P mutation in PSEN-1. Stem Cell Res. 2016, 16, 110–112. [Google Scholar] [CrossRef] [PubMed] [Green Version]
- Zwiernik, P.; Uhler, C.; Richards, D. Maximum likelihood estimation for linear Gaussian covariance models. J. R. Stat. Soc. Ser. B Stat. Methodol. 2017, 79, 1269–1292. [Google Scholar] [CrossRef] [Green Version]


Publisher’s Note: MDPI stays neutral with regard to jurisdictional claims in published maps and institutional affiliations. |
© 2021 by the authors. Licensee MDPI, Basel, Switzerland. This article is an open access article distributed under the terms and conditions of the Creative Commons Attribution (CC BY) license (https://creativecommons.org/licenses/by/4.0/).
Share and Cite
Barabás, K.; Kobolák, J.; Godó, S.; Kovács, T.; Ernszt, D.; Kecskés, M.; Varga, C.; Jánosi, T.Z.; Fujiwara, T.; Kusumi, A.; et al. Live-Cell Imaging of Single Neurotrophin Receptor Molecules on Human Neurons in Alzheimer’s Disease. Int. J. Mol. Sci. 2021, 22, 13260. https://0-doi-org.brum.beds.ac.uk/10.3390/ijms222413260
Barabás K, Kobolák J, Godó S, Kovács T, Ernszt D, Kecskés M, Varga C, Jánosi TZ, Fujiwara T, Kusumi A, et al. Live-Cell Imaging of Single Neurotrophin Receptor Molecules on Human Neurons in Alzheimer’s Disease. International Journal of Molecular Sciences. 2021; 22(24):13260. https://0-doi-org.brum.beds.ac.uk/10.3390/ijms222413260
Chicago/Turabian StyleBarabás, Klaudia, Julianna Kobolák, Soma Godó, Tamás Kovács, Dávid Ernszt, Miklós Kecskés, Csaba Varga, Tibor Z. Jánosi, Takahiro Fujiwara, Akihiro Kusumi, and et al. 2021. "Live-Cell Imaging of Single Neurotrophin Receptor Molecules on Human Neurons in Alzheimer’s Disease" International Journal of Molecular Sciences 22, no. 24: 13260. https://0-doi-org.brum.beds.ac.uk/10.3390/ijms222413260