
Target Score—A Proteomics Data Selection Tool Applied to Esophageal Cancer Identifies GLUT1-Sialyl Tn Glycoforms as Biomarkers of Cancer Aggressiveness

 , , , , ,
  ,
,
Abstract
: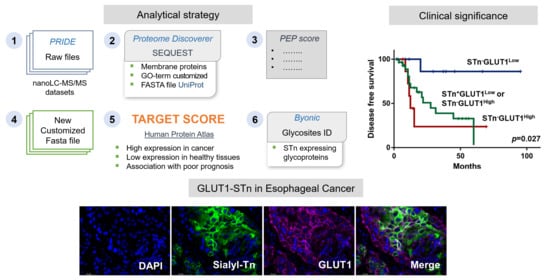
1. Introduction
2. Results and Discussion
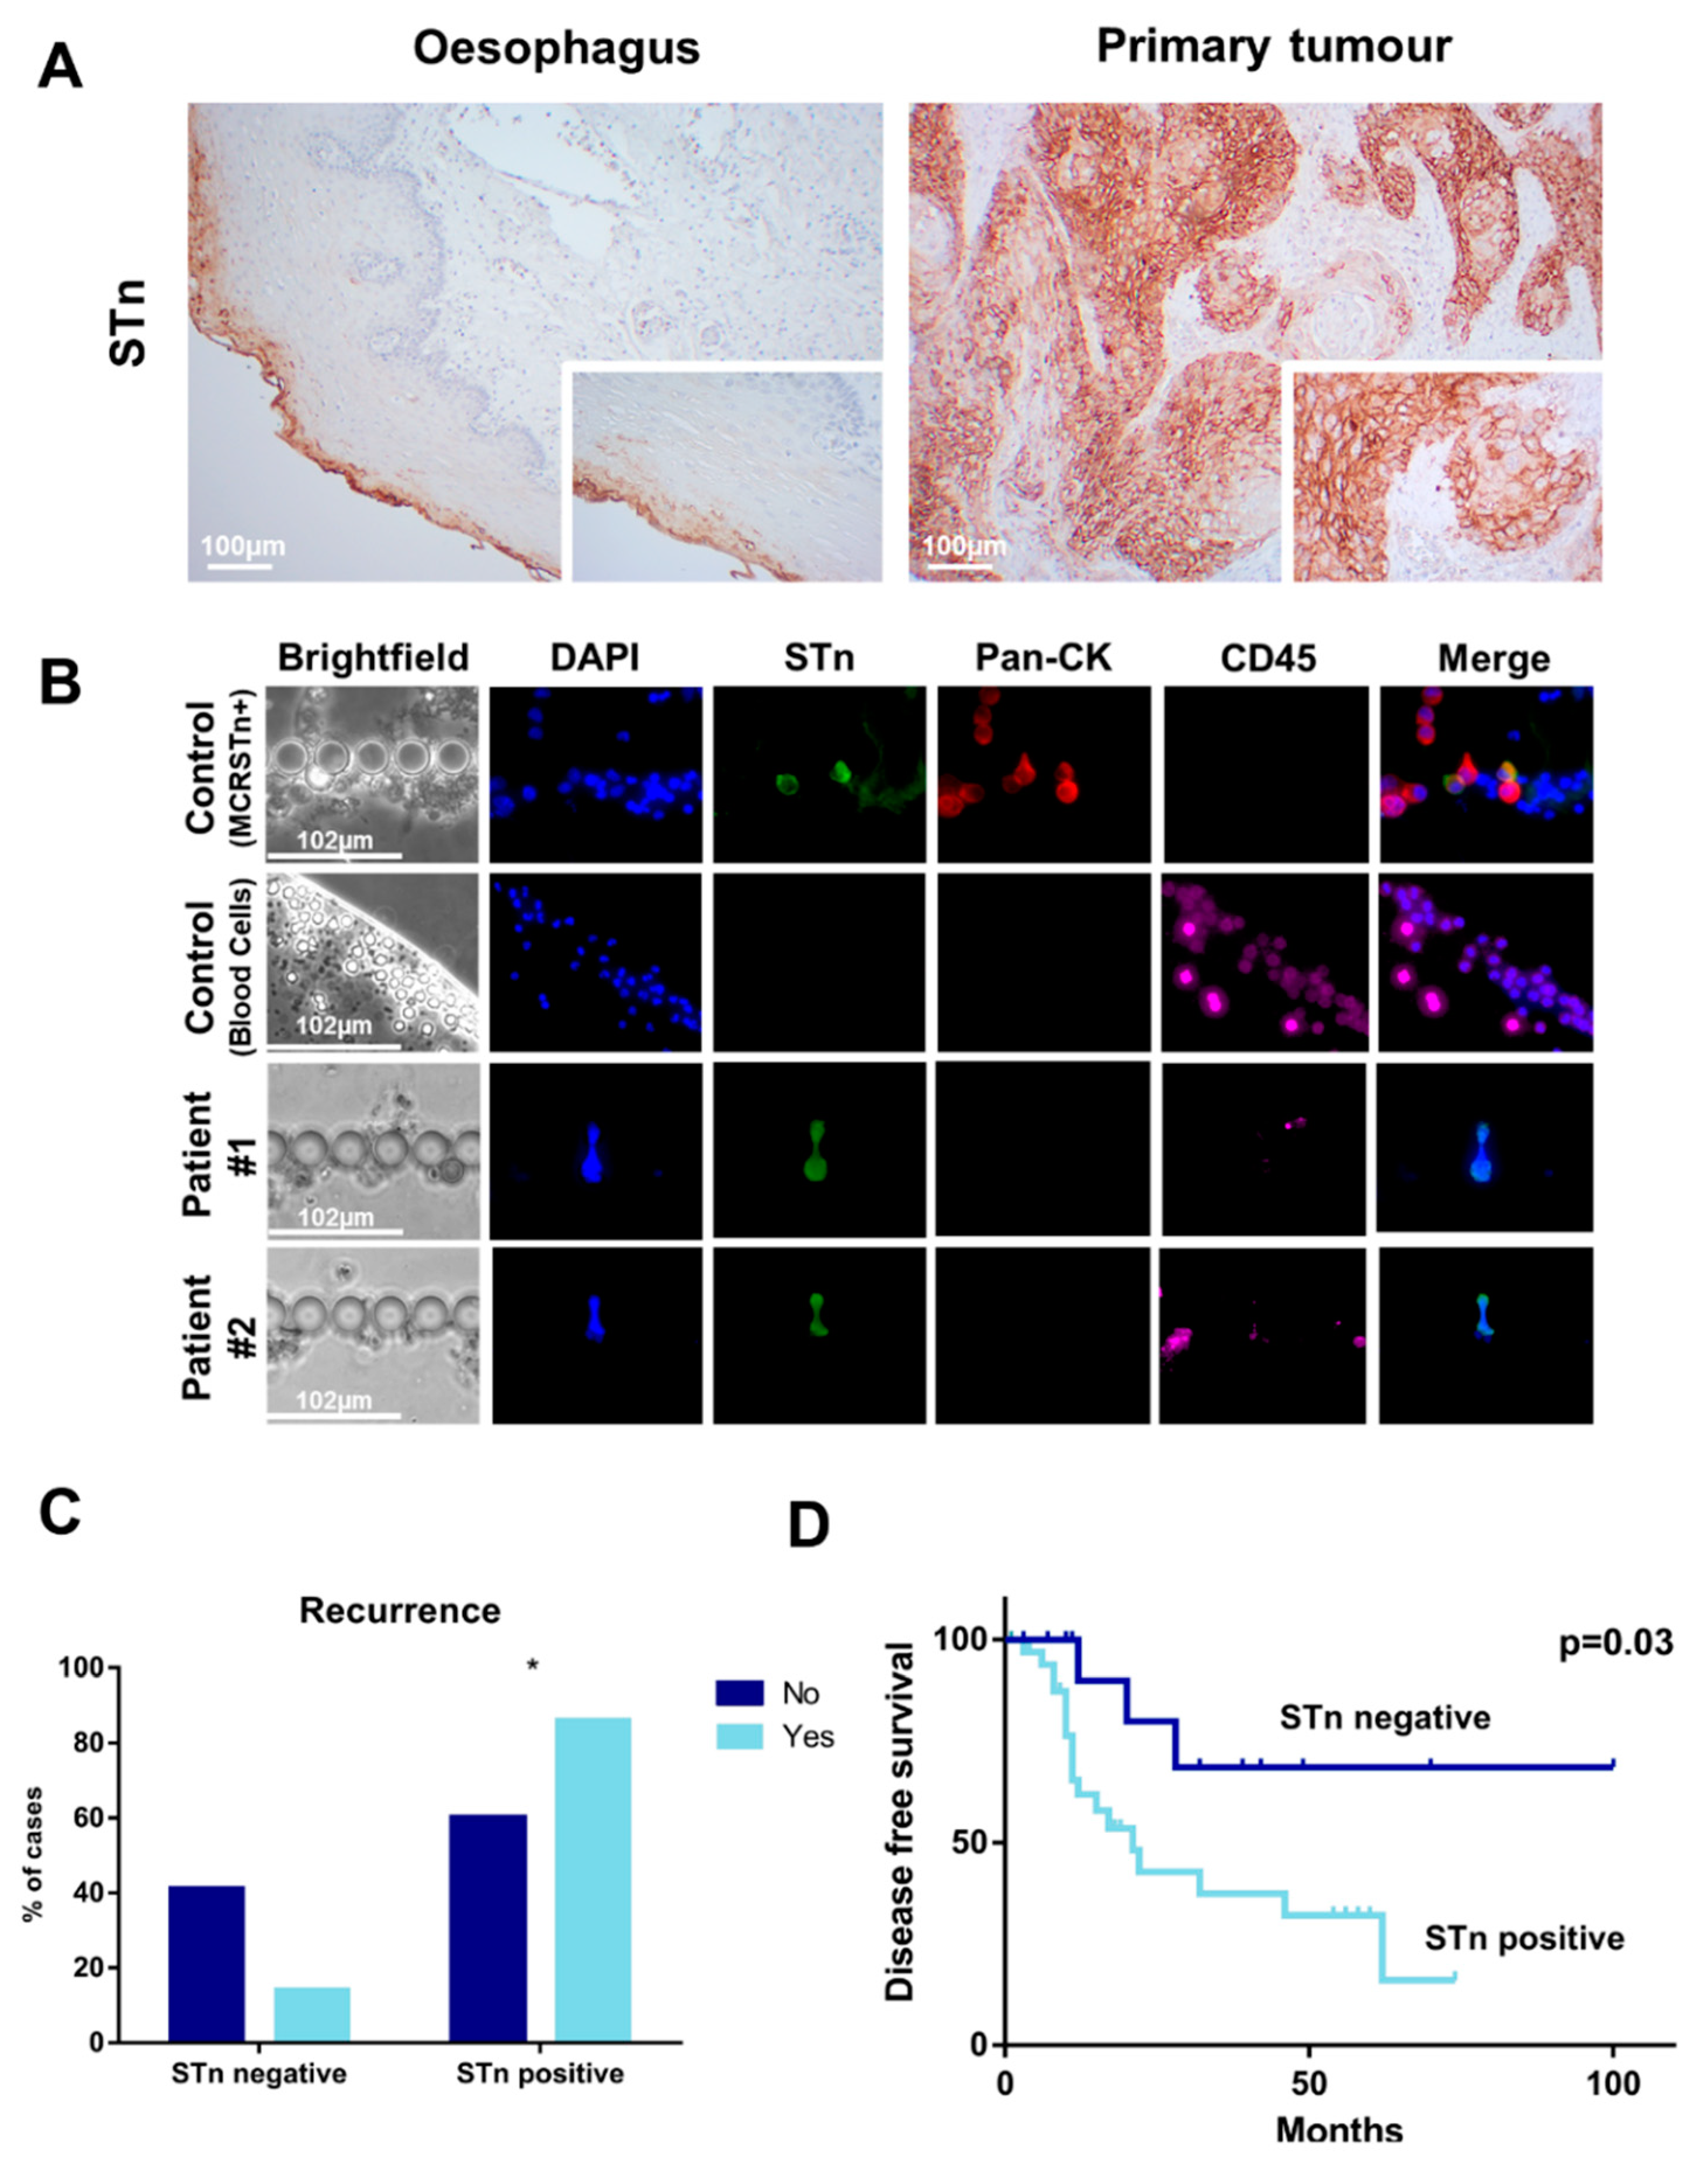
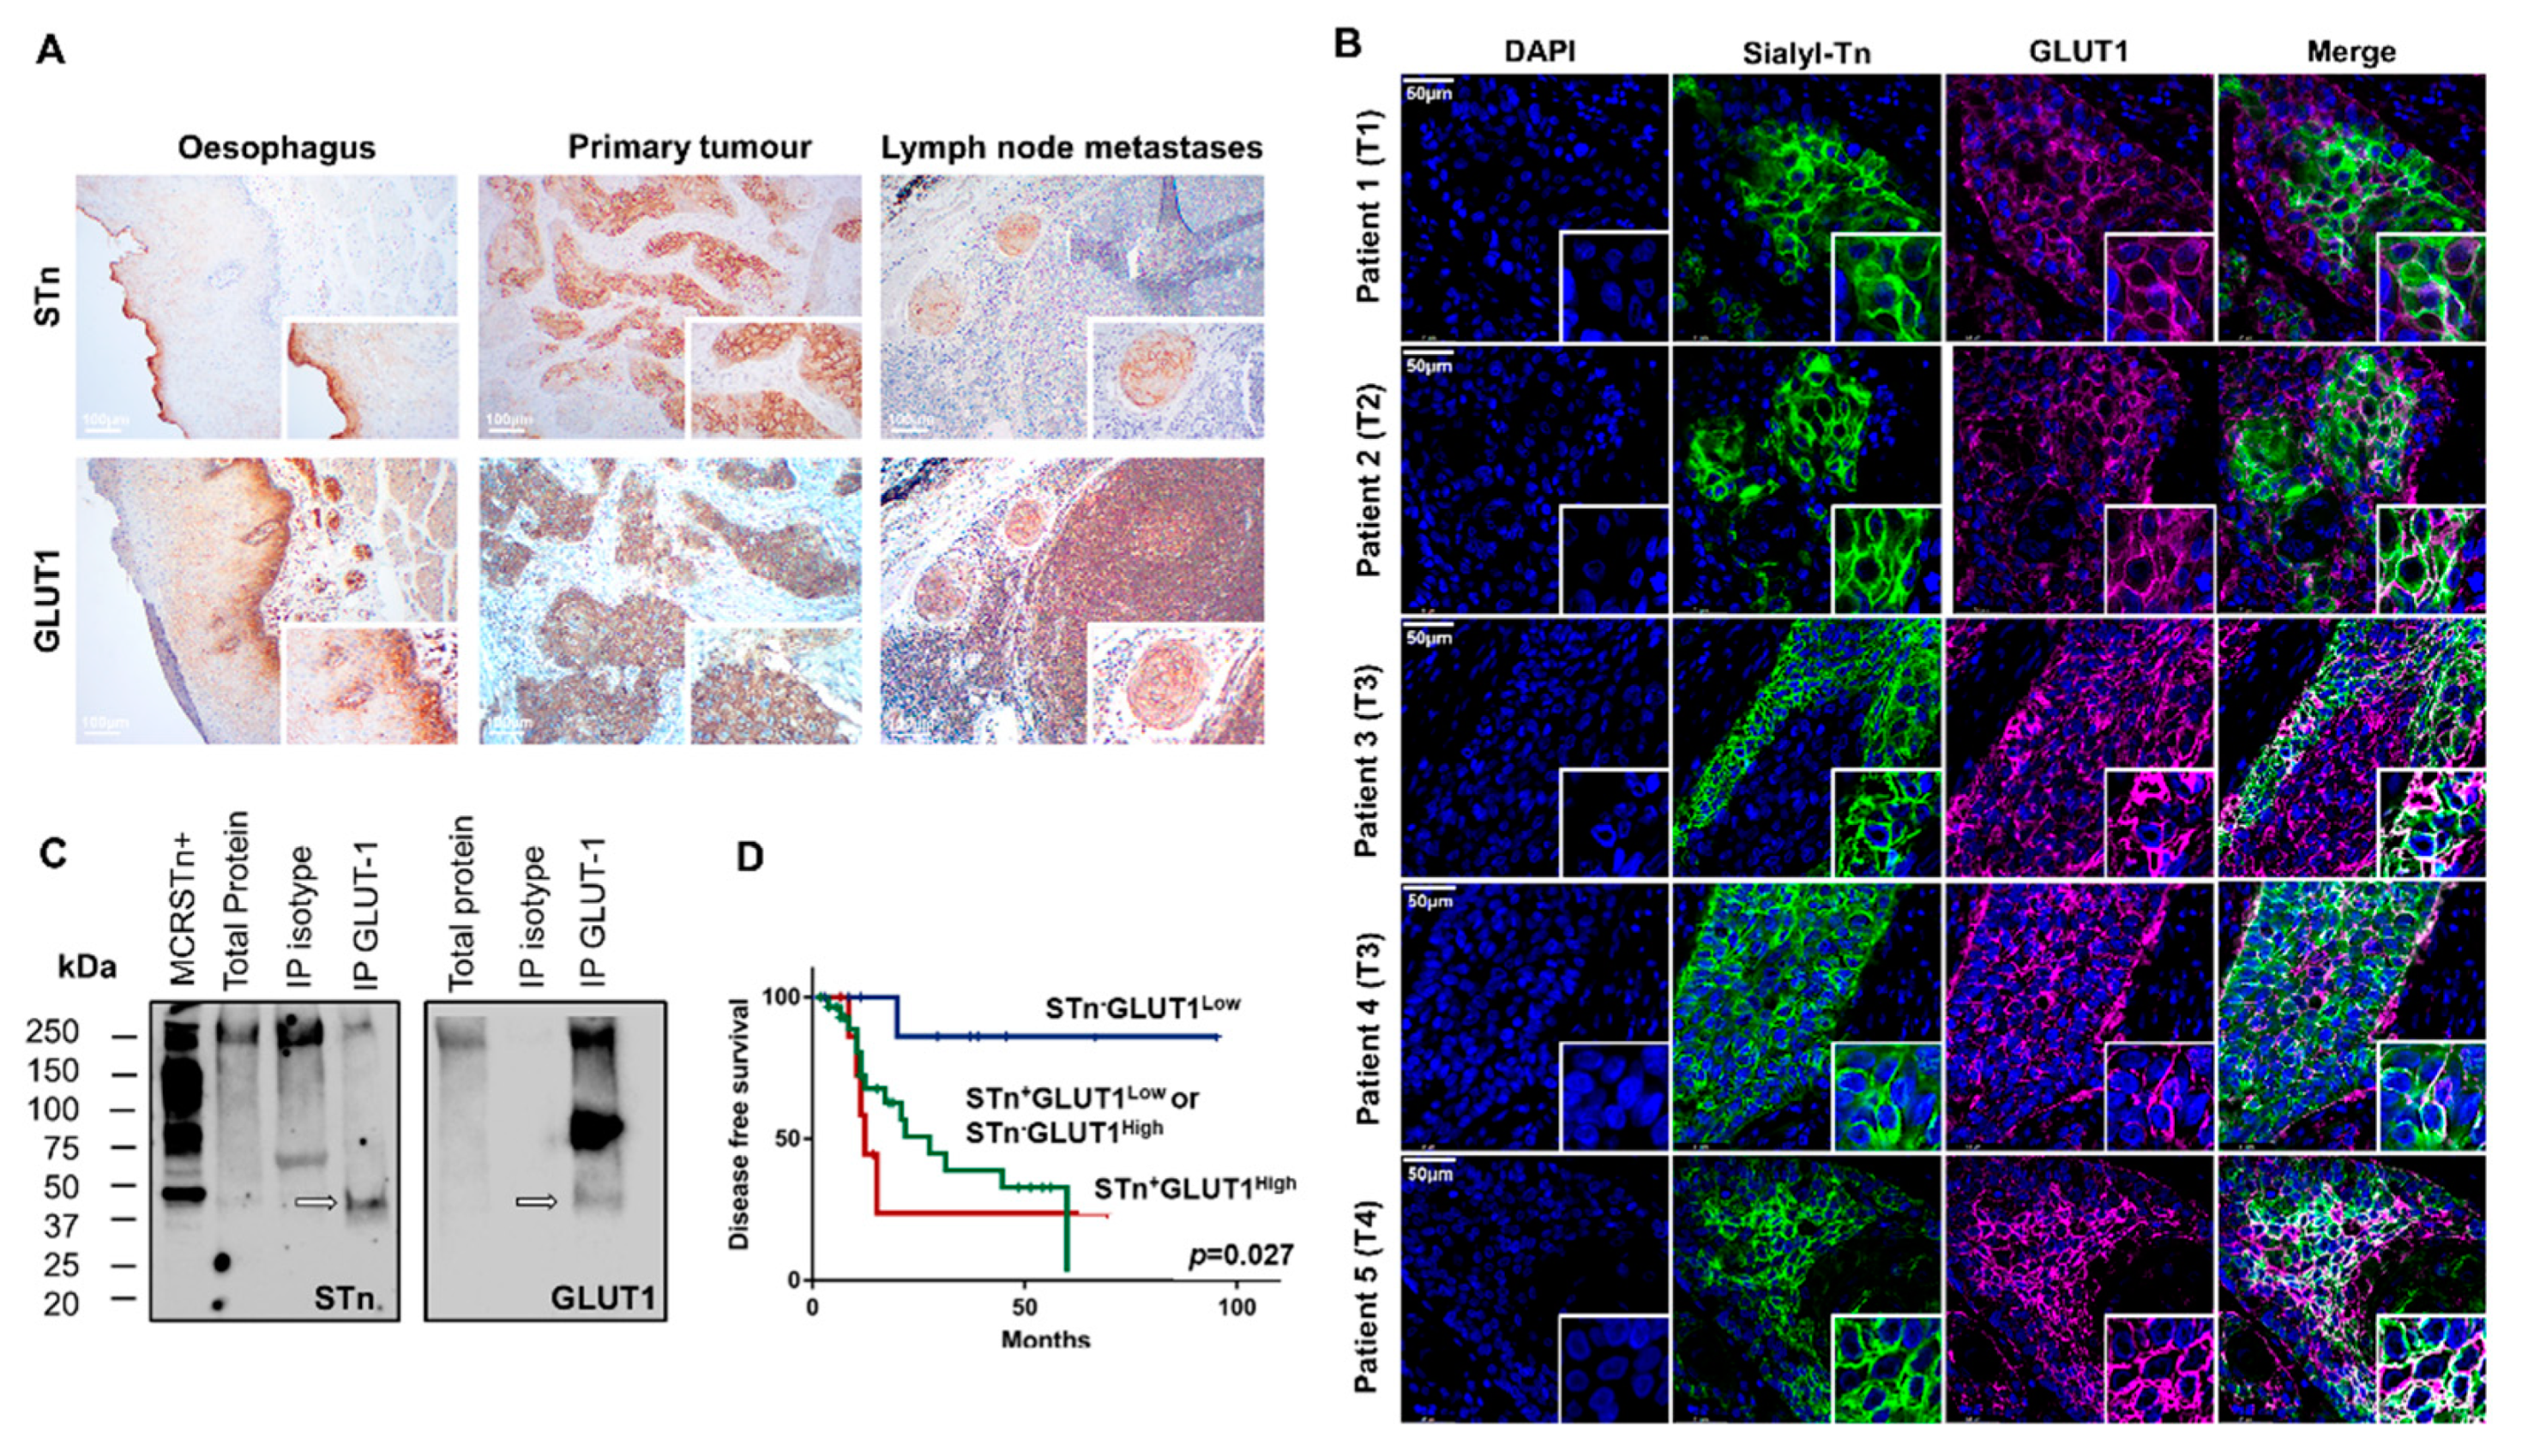
2.1. STn Antigen in ESCC Primary Tumours, Metastases and CTCs
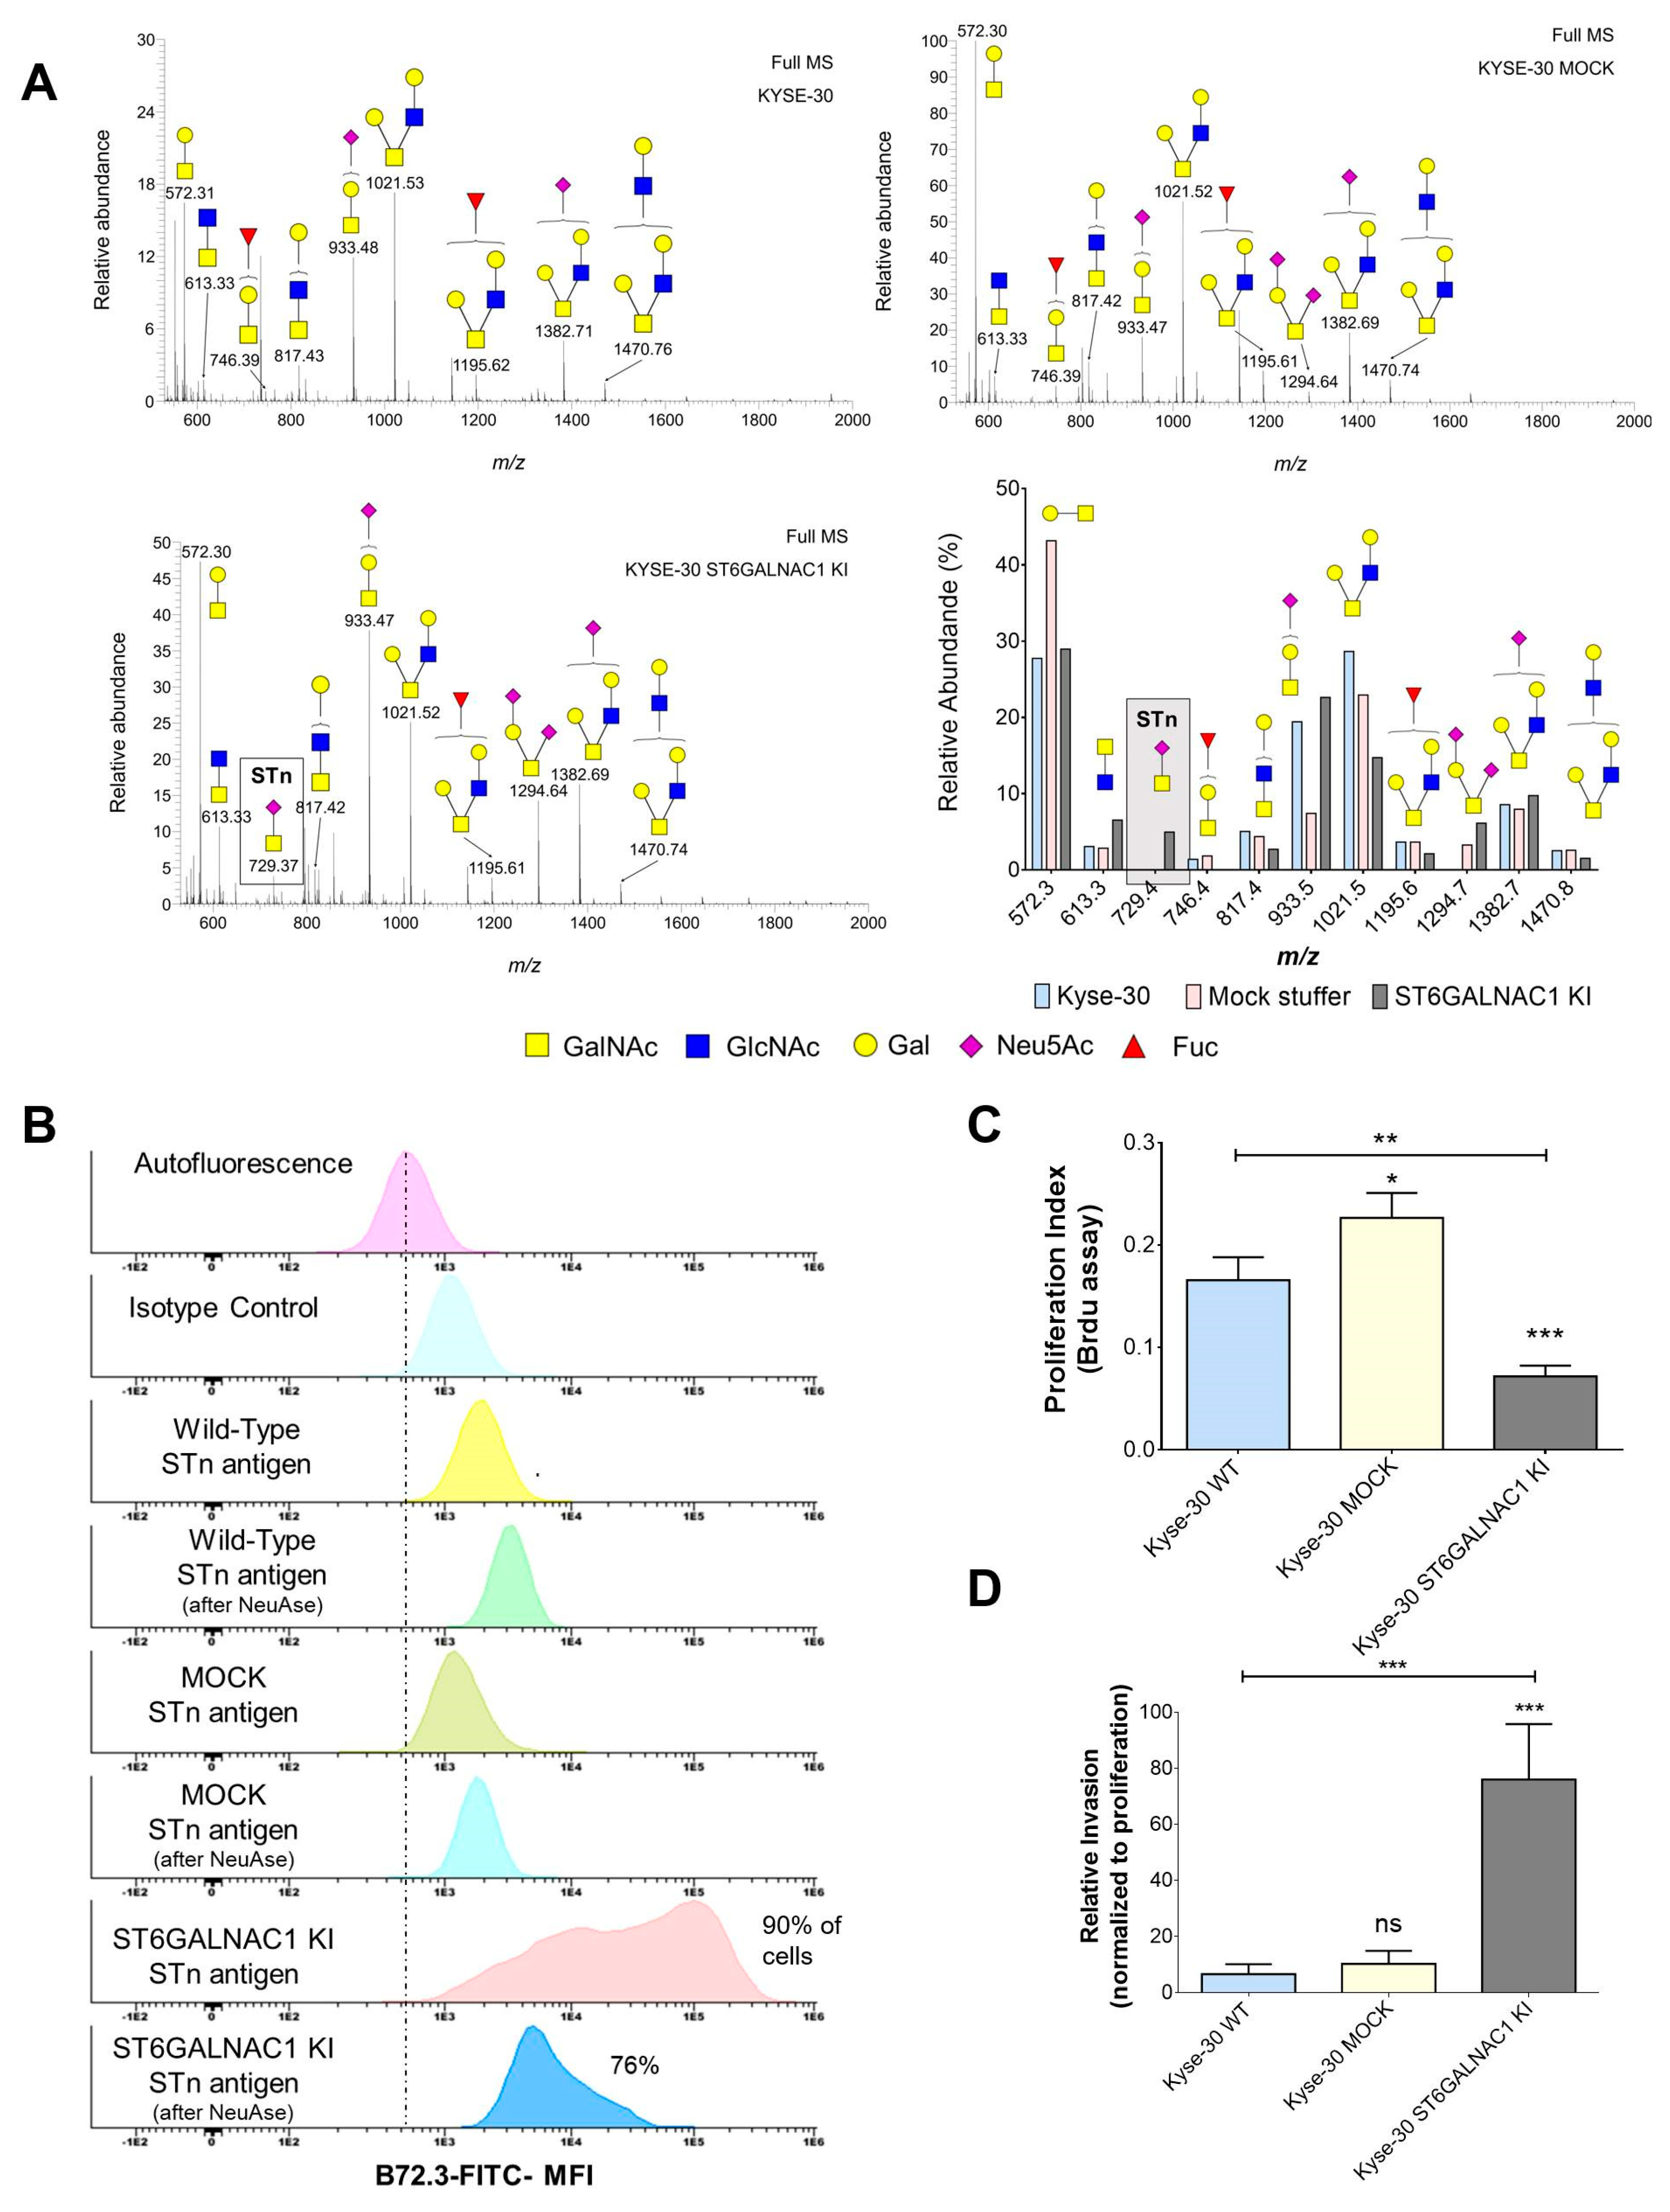
2.2. Generation of a STn ECSS Cell Line and Functional Implications
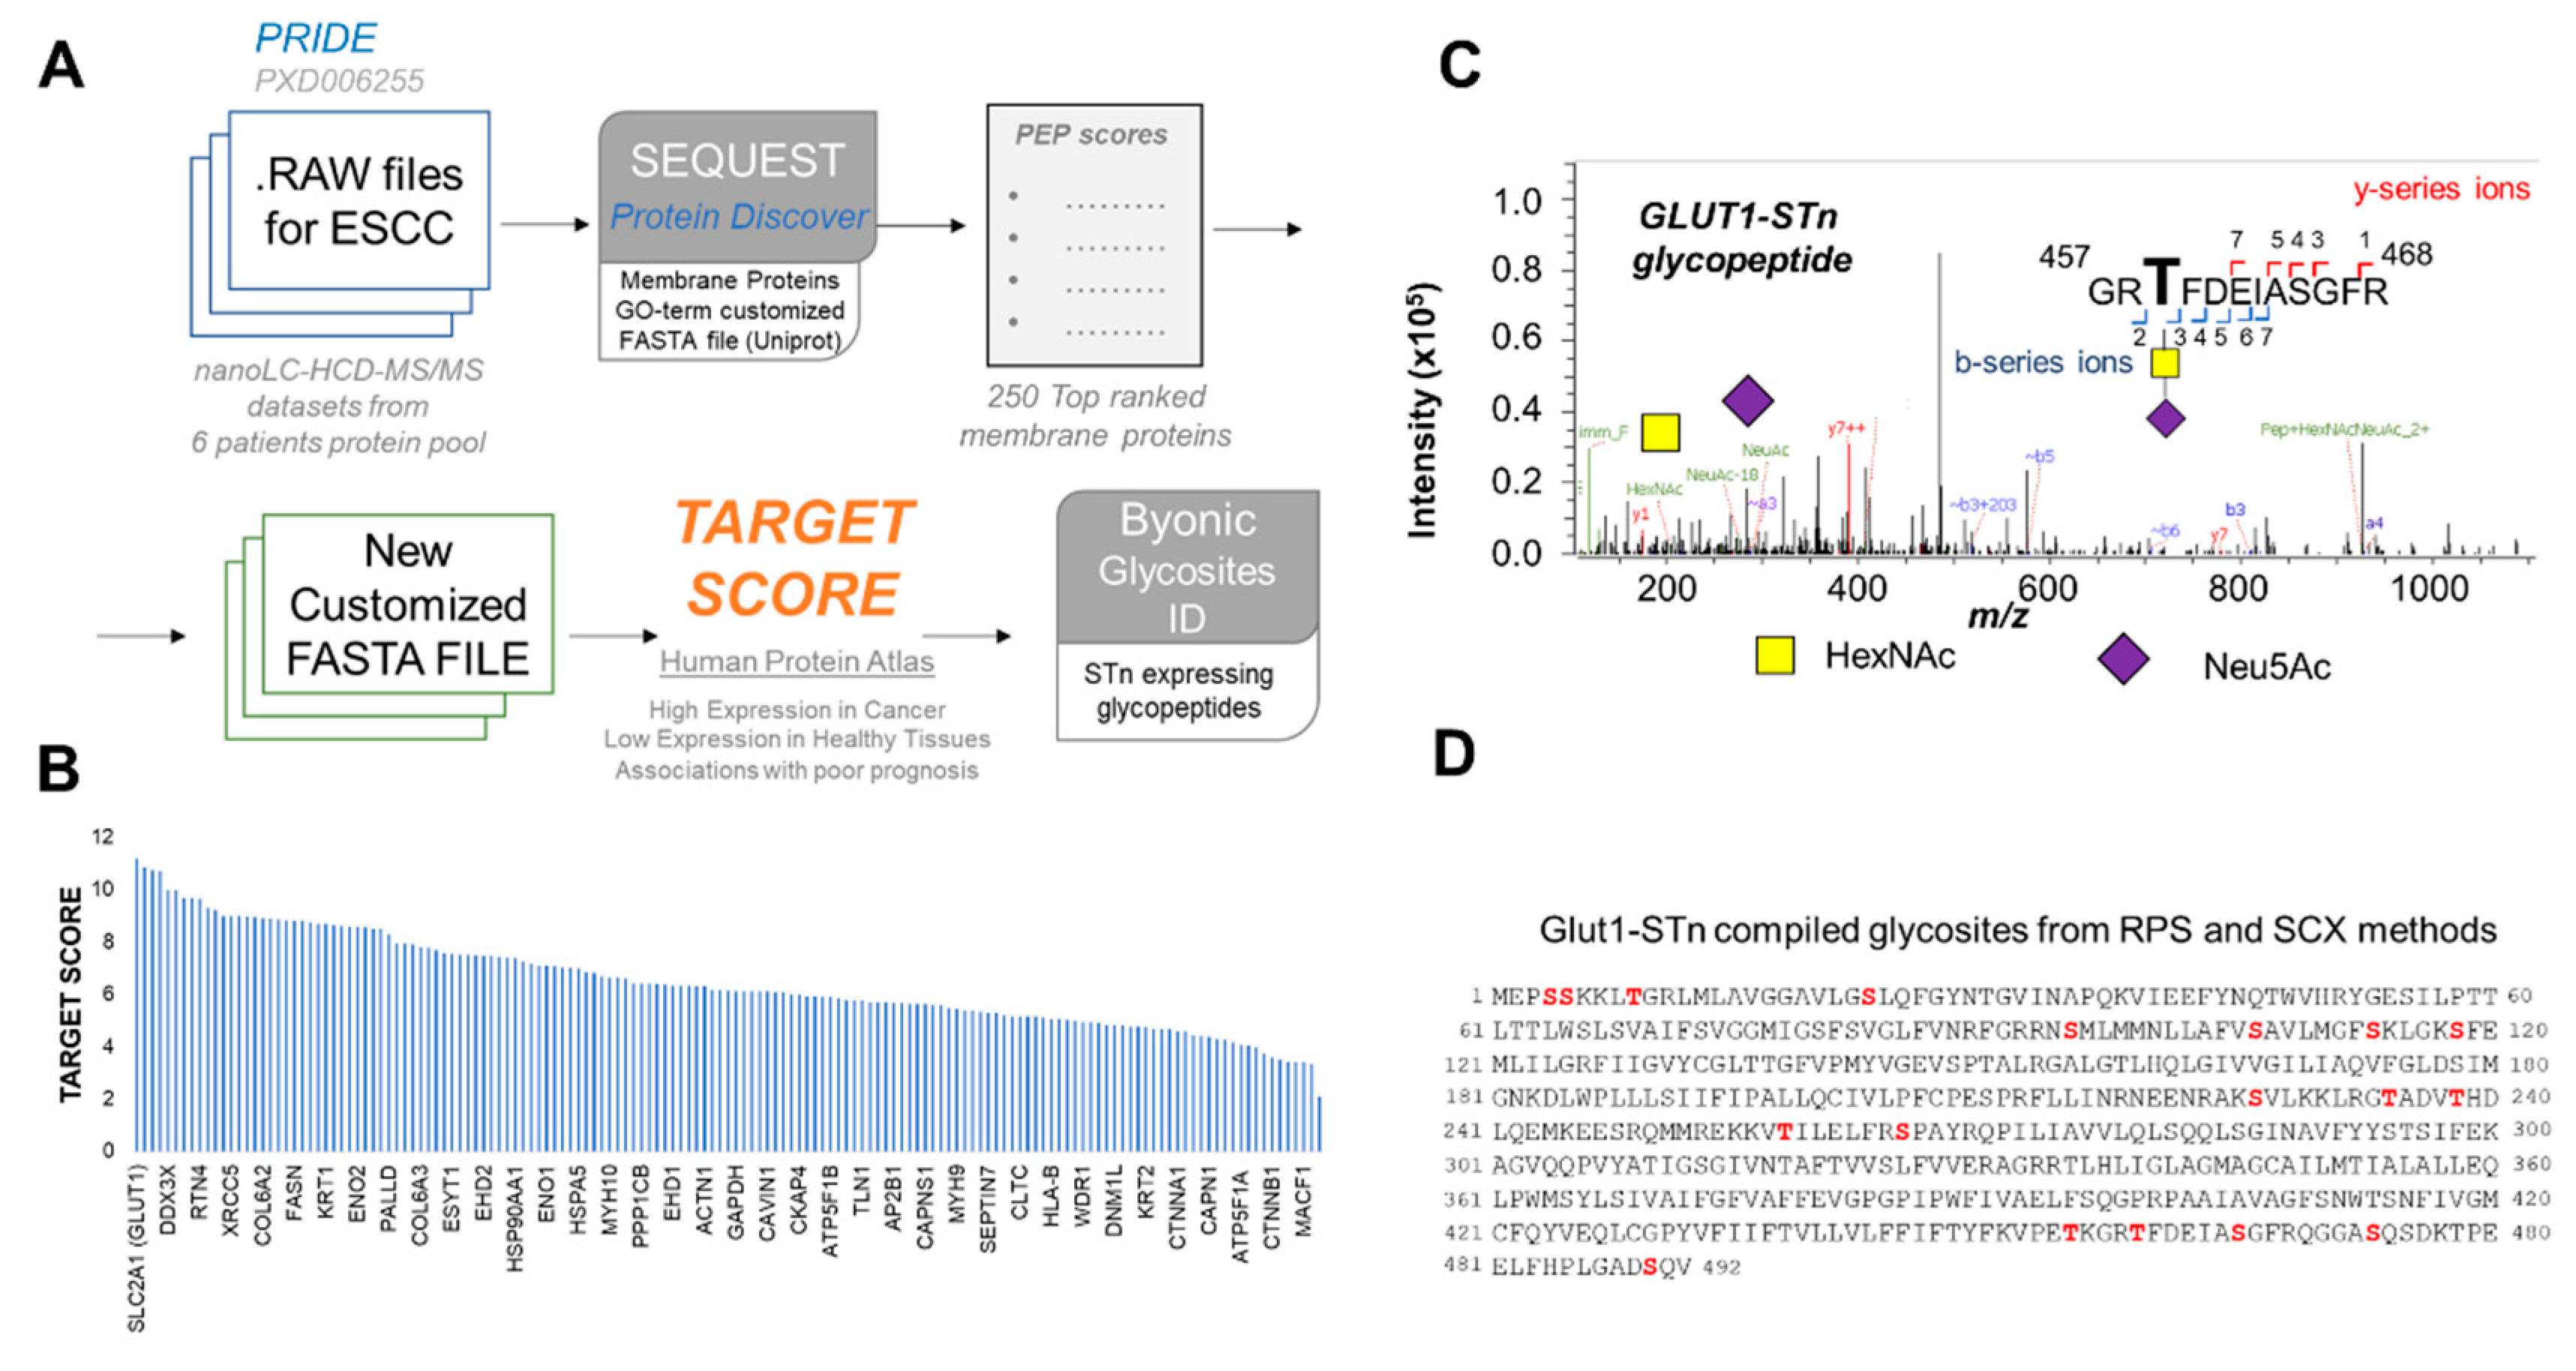
2.3. Identification of STn Modified Proteins
2.4. GLUT1 in ESCC
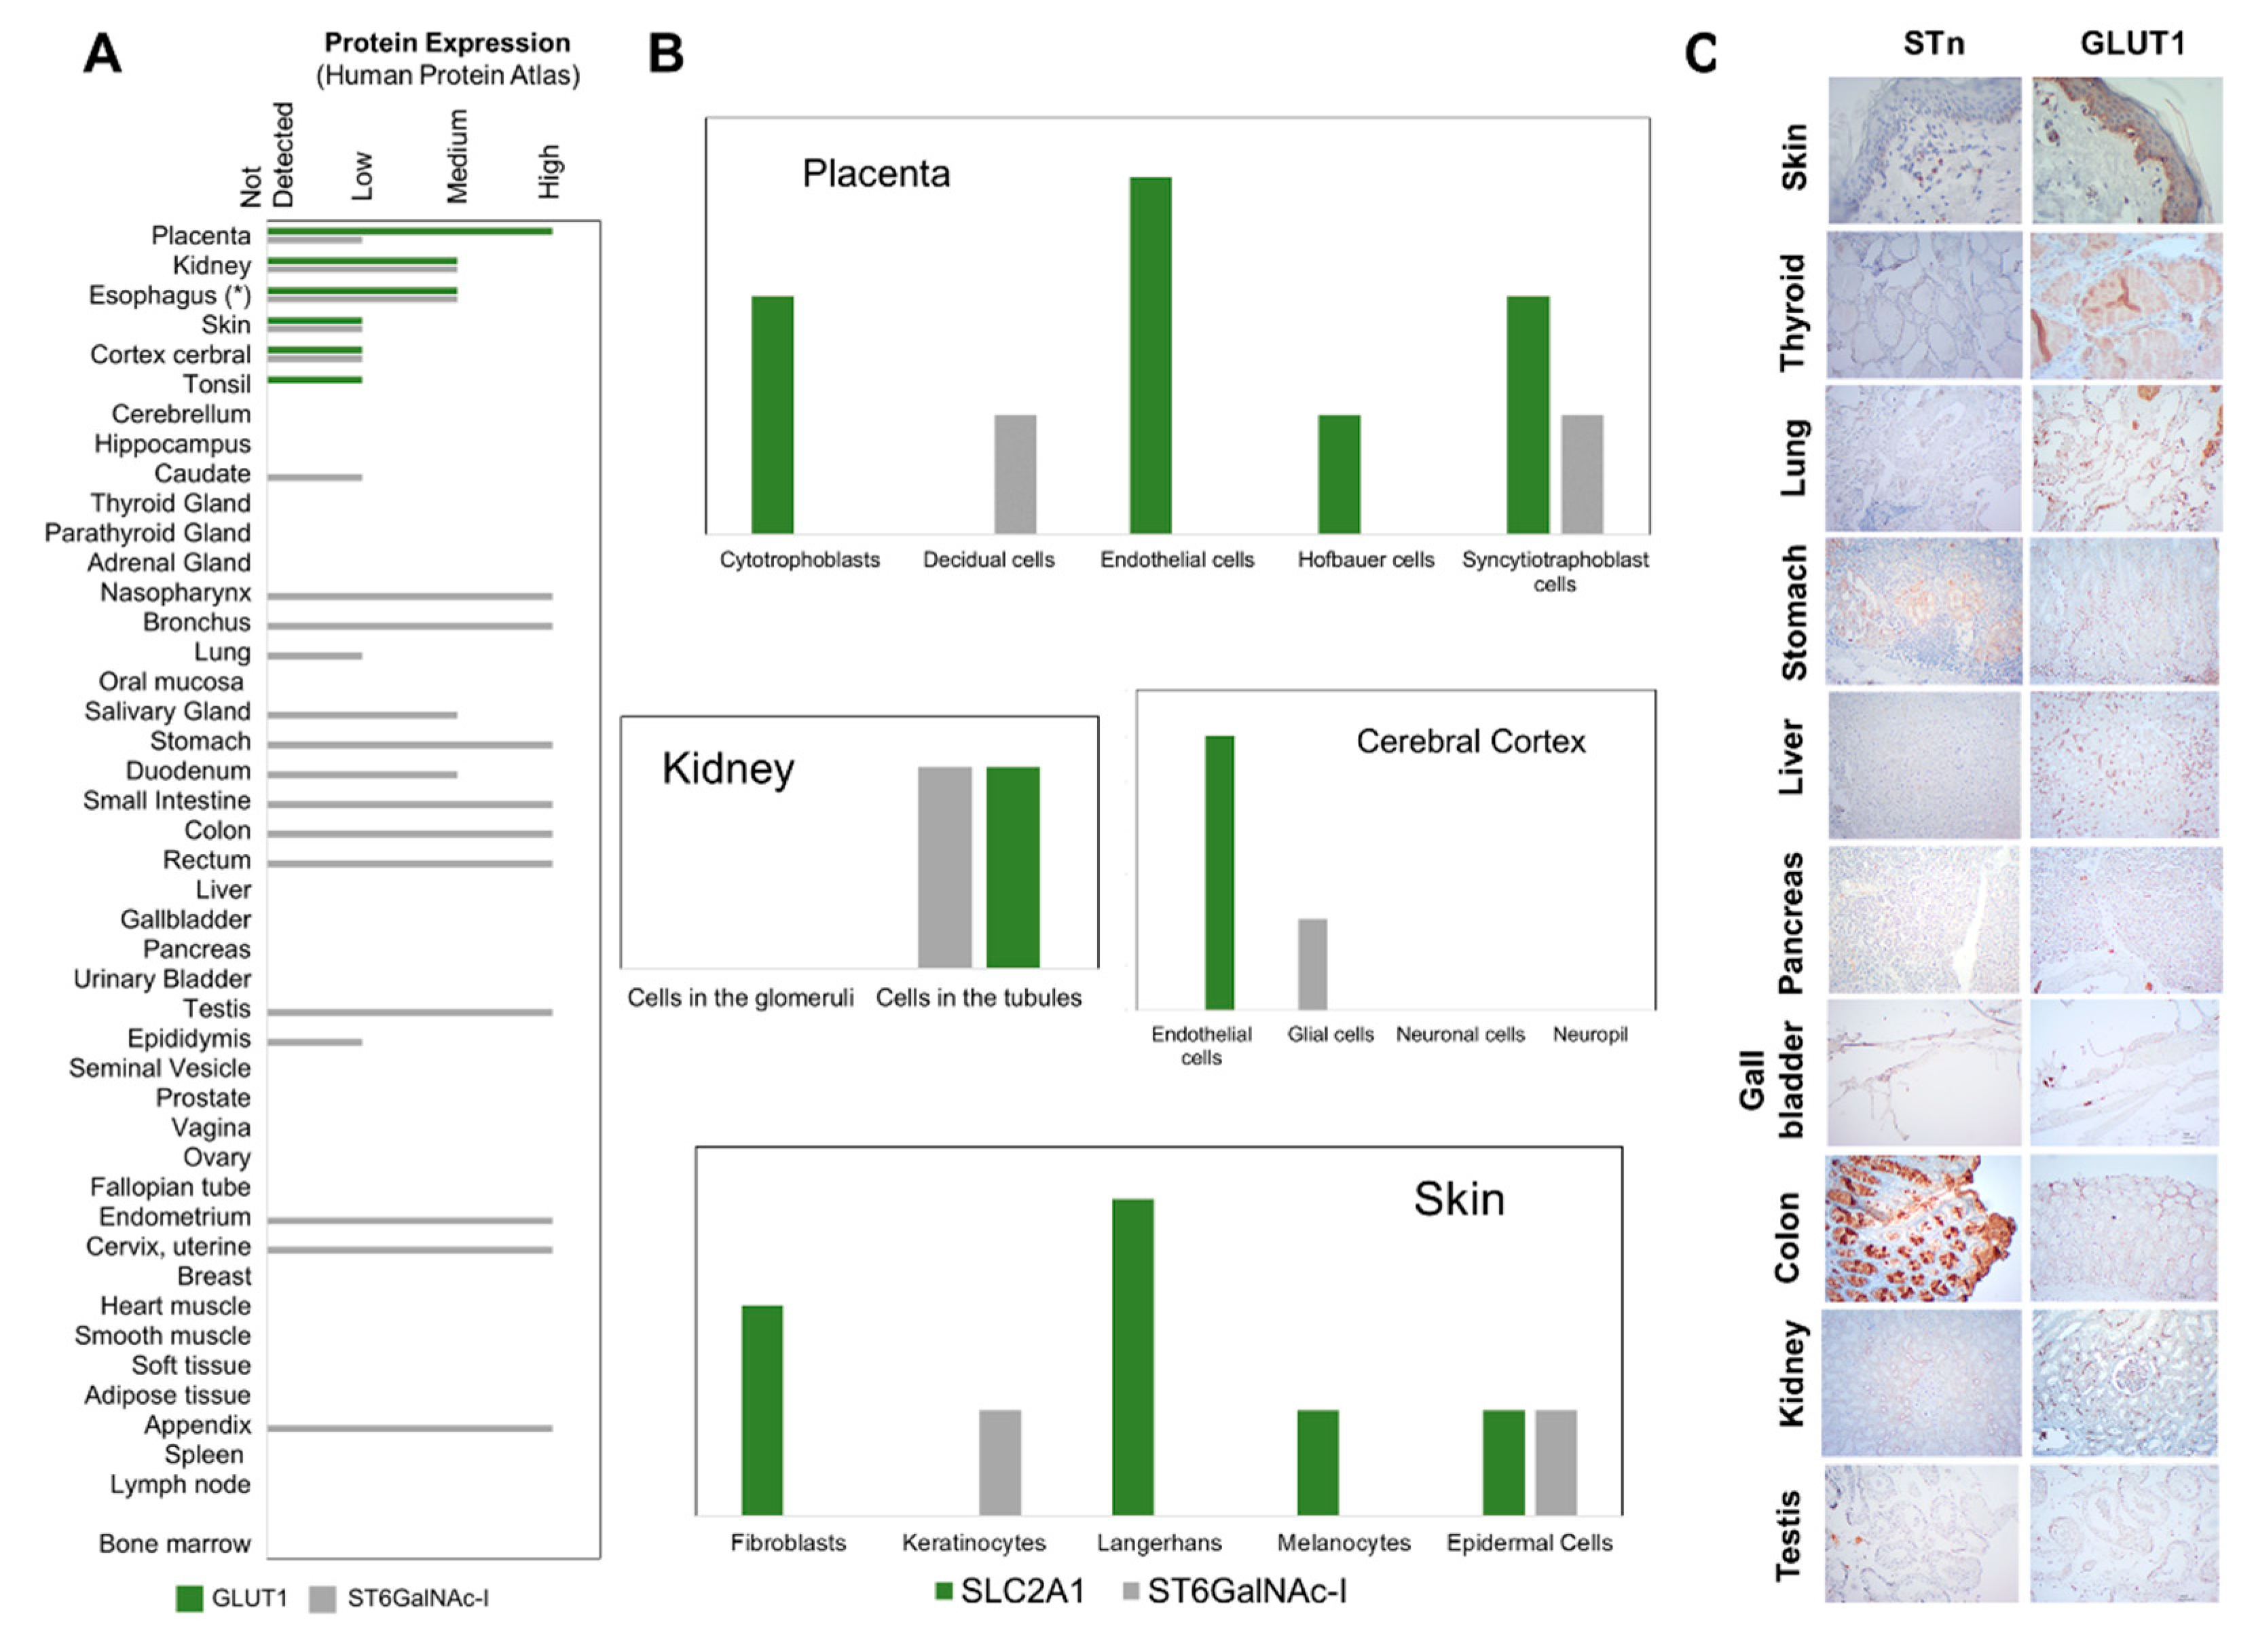
2.5. STn and GLUT1 in Health Tissues
3. Material and Methods
3.1. Patient Samples and Ethics Statement
3.2. Isolation and Characterization of Circulating Tumor Cells
3.3. Cell Lines and Culture Conditions
3.4. Generation of an STn ESCC Cell Line
3.5. Proliferation Assays
3.6. Invasion Assays
3.7. Flow Cytometry
3.8. Glycomics
3.9. Immunohistochemistry
3.10. Double Staining Immunofluorescence Microscopy
3.11. Immunoprecipitation and Western Blot
3.12. Bioinformatics for Biomarker Discovery
3.13. Statistical Analysis
4. Conclusions
Supplementary Materials
Author Contributions
Funding
Institutional Review Board Statement
Informed Consent Statement
Data Availability Statement
Acknowledgments
Conflicts of Interest
References
- Smyth, E.C.; Lagergren, J.; Fitzgerald, R.C.; Lordick, F.; Shah, M.A.; Lagergren, P.; Cunningham, D. Oesophageal cancer. Nat. Rev. Dis. Primers 2017, 3, 17048. [Google Scholar] [CrossRef]
- Then, E.O.; Lopez, M.; Saleem, S.; Gayam, V.; Sunkara, T.; Culliford, A.; Gaduputi, V. Esophageal Cancer: An Updated Surveillance Epidemiology and End Results Database Analysis. World J. Oncol. 2020, 11, 55–64. [Google Scholar] [CrossRef] [PubMed]
- Jain, S.; Dhingra, S. Pathology of esophageal cancer and Barrett’s esophagus. Ann. Cardiothorac. Surg. 2017, 6, 99–109. [Google Scholar] [CrossRef] [Green Version]
- Liao, Z.; Cox, J.D.; Komaki, R. Radiochemotherapy of esophageal cancer. J. Thorac. Oncol. 2007, 2, 553–568. [Google Scholar] [CrossRef] [Green Version]
- Uemura, N.; Kondo, T. Current advances in esophageal cancer proteomics. Biochim. Biophys. Acta 2015, 1854, 687–695. [Google Scholar] [CrossRef]
- Cai, X.-W.; Yu, W.-W.; Yu, W.; Zhang, Q.; Feng, W.; Liu, M.-N.; Sun, M.-H.; Xiang, J.-Q.; Zhang, Y.-W.; Fu, X.-L. Tissue-based quantitative proteomics to screen and identify the potential biomarkers for early recurrence/metastasis of esophageal squamous cell carcinoma. Cancer Med. 2018, 7, 2504–2517. [Google Scholar] [CrossRef]
- Uemura, N.; Kondo, T. Current status of proteomics of esophageal carcinoma. Expert Rev. Proteom. 2016, 13, 1029–1040. [Google Scholar] [CrossRef] [PubMed]
- Fernandes, E.; Sores, J.; Cotton, S.; Peixoto, A.; Ferreira, D.; Freitas, R.; Reis, C.A.; Santos, L.L.; Ferreira, J.A. Esophageal, gastric and colorectal cancers: Looking beyond classical serological biomarkers towards glycoproteomics-assisted precision oncology. Theranostics 2020, 10, 4903–4928. [Google Scholar] [CrossRef]
- Fernandes, E.; Freitas, R.; Ferreira, D.; Soares, J.; Azevedo, R.; Gaiteiro, C.; Peixoto, A.; Oliveira, S.; Cotton, S.; Relvas-Santos, M.; et al. Nucleolin-Sle A Glycoforms as E-Selectin Ligands and Potentially Targetable Biomarkers at the Cell Surface of Gastric Cancer Cells. Cancers 2020, 12, 861. [Google Scholar] [CrossRef] [PubMed] [Green Version]
- Cotton, S.; Azevedo, R.; Gaiteiro, C.; Ferreira, D.; Lima, L.; Peixoto, A.; Fernandes, E.; Neves, M.; Neves, D.; Amaro, T.; et al. Targeted O-glycoproteomics explored increased sialylation and identified MUC16 as a poor prognosis biomarker in advanced-stage bladder tumours. Mol. Oncol. 2017, 11, 895–912. [Google Scholar] [CrossRef] [Green Version]
- Campos, D.; Freitas, D.; Gomes, J.; Magalhães, A.; Steentoft, C.; Gomes, C.; Vester-Christensen, M.B.; Ferreira, J.A.; Afonso, L.P.; Santos, L.L.; et al. Probing the O-glycoproteome of gastric cancer cell lines for biomarker discovery. Mol. Cell Proteom. 2015, 14, 1616–1629. [Google Scholar] [CrossRef] [Green Version]
- Fernandes, E.; Peixoto, A.; Neves, M.; Afonso, L.P.; Santos, L.L.; Ferreira, J.A. Humoral response against sialyl-Le(a) glycosylated protein species in esophageal cancer: Insights for immunoproteomic studies. Electrophoresis 2015, 36, 2902–2907. [Google Scholar] [CrossRef]
- Carrascal, M.A.; Silva, M.; Ferreira, J.A.; Azevedo, R.; Ferreira, D.; Silva, A.M.N.; Ligeiro, D.; Santos, L.L.; Sackstein, R.; Videira, P.A. A functional glycoproteomics approach identifies CD13 as a novel E-selectin ligand in breast cancer. Biochim. Biophys. Acta Gen. Subj. 2018, 1862, 2069–2080. [Google Scholar] [CrossRef]
- Ferreira, J.A.; Magalhães, A.; Gomes, J.; Peixoto, A.; Gaiteiro, C.; Fernandes, E.; Santos, L.L.; Reis, C.A. Protein glycosylation in gastric and colorectal cancers: Toward cancer detection and targeted therapeutics. Cancer Lett. 2017, 387, 32–45. [Google Scholar] [CrossRef]
- Santos, S.N.; Junqueira, M.S.; Francisco, G.; Vilanova, M.; Magalhaes, A.; Dias Baruffi, M.; Chammas, R.; Harris, A.L.; Reis, C.A.; Bernardes, E.S. O-glycan sialylation alters galectin-3 subcellular localization and decreases chemotherapy sensitivity in gastric cancer. Oncotarget 2016, 7, 83570–83587. [Google Scholar] [CrossRef] [Green Version]
- Peixoto, A.; Fernandes, E.; Gaiteiro, C.; Lima, L.; Azevedo, R.; Soares, J.; Cotton, S.; Parreira, B.; Neves, M.; Amaro, T.; et al. Hypoxia enhances the malignant nature of bladder cancer cells and concomitantly antagonizes protein O-glycosylation extension. Oncotarget 2016, 7, 63138–63157. [Google Scholar] [CrossRef] [Green Version]
- Freitas, D.; Campos, D.; Gomes, J.; Pinto, F.; Macedo, J.A.; Matos, R.; Mereiter, S.; Pinto, M.T.; Polónia, A.; Gartner, F.; et al. O-glycans truncation modulates gastric cancer cell signaling and transcription leading to a more aggressive phenotype. EBioMedicine 2019, 40, 349–362. [Google Scholar] [CrossRef] [PubMed] [Green Version]
- Carrascal, M.A.; Severino, P.F.; Guadalupe Cabral, M.; Silva, M.; Ferreira, J.A.; Calais, F.; Quinto, H.; Pen, C.; Ligeiro, D.; Santos, L.L.; et al. Sialyl Tn-expressing bladder cancer cells induce a tolerogenic phenotype in innate and adaptive immune cells. Mol. Oncol. 2014, 8, 753–765. [Google Scholar] [CrossRef] [PubMed]
- Van de Wall, S.; Santegoets, K.C.M.; van Houtum, E.J.H.; Bull, C.; Adema, G.J. Sialoglycans and Siglecs Can Shape the Tumor Immune Microenvironment. Trends Immunol. 2020, 41, 274–285. [Google Scholar] [CrossRef]
- Julien, S.; Videira, P.A.; Delannoy, P. Sialyl-tn in cancer: (how) did we miss the target? Biomolecules 2012, 2, 435–466. [Google Scholar] [CrossRef] [Green Version]
- Lima, L.; Neves, M.; Oliveira, M.I.; Dieguez, L.; Freitas, R.; Azevedo, R.; Gaiteiro, C.; Soares, J.; Ferreira, D.; Peixoto, A.; et al. Sialyl-Tn identifies muscle-invasive bladder cancer basal and luminal subtypes facing decreased survival, being expressed by circulating tumor cells and metastases. Urol. Oncol. 2017, 35, 675.e1–675.e8. [Google Scholar] [CrossRef] [PubMed]
- Neves, M.; Azevedo, R.; Lima, L.; Oliveira, M.I.; Peixoto, A.; Ferreira, D.; Soares, J.; Fernandes, E.; Gaiteiro, C.; Palmeira, C.; et al. Exploring sialyl-Tn expression in microfluidic-isolated circulating tumour cells: A novel biomarker and an analytical tool for precision oncology applications. New Biotechnol. 2019, 49, 77–87. [Google Scholar] [CrossRef] [PubMed]
- Li, Y.; Wu, G.; Yang, W.; Wang, X.; Duan, L.; Niu, L.; Zhang, Y.; Liu, J.; Hong, L.; Fan, D. Prognostic value of circulating tumor cells detected with the CellSearch system in esophageal cancer patients: A systematic review and meta-analysis. BMC Cancer 2020, 20, 581. [Google Scholar] [CrossRef] [PubMed]
- Ferreira, J.A.; Videira, P.A.; Lima, L.; Pereira, S.; Silva, M.; Carrascal, M.; Severino, P.F.; Fernandes, E.; Almeida, A.; Costa, C.; et al. Overexpression of tumour-asociated carbohydrate antigen sialyl-Tn in advanced bladder tumours. Mol. Oncol. 2013, 7, 719–731. [Google Scholar] [CrossRef] [PubMed] [Green Version]
- Kudelka, M.R.; Antonopoulos, A.; Wang, Y.; Duong, D.M.; Song, X.; Seyfried, N.T.; Dell, A.; Haslam, S.M.; Cummings, R.D.; Ju, T. Cellular O-Glycome Reporter/Amplification to explore O-glycans of living cells. Nat. Methods 2016, 13, 81–86. [Google Scholar] [CrossRef] [Green Version]
- Bernardo, C.; Costa, C.; Amaro, T.; Gonçalves, M.; Lopes, P.; Freitas, R.; Gärtner, F.; Amado, F.; Ferreira, J.A.; Santos, L. Patient-derived sialyl-Tn-positive invasive bladder cancer xenografts in nude mice: An exploratory model study. Anticancer Res. 2014, 34, 735–744. [Google Scholar]
- Peixoto, A.; Relvas-Santos, M.; Azevedo, R.; Santos, L.L.; Ferreira, J.A. Protein Glycosylation and Tumor Microenvironment Alterations Driving Cancer Hallmarks. Front. Oncol. 2019, 9, 380. [Google Scholar] [CrossRef] [Green Version]
- Julien, S.; Krzewinski-Recchi, M.A.; Harduin-Lepers, A.; Gouyer, V.; Huet, G.; Le Bourhis, X.; Delannoy, P. Expression of sialyl-Tn antigen in breast cancer cells transfected with the human CMP-Neu5Ac: GalNAc alpha2,6-sialyltransferase (ST6GalNac I) cDNA. Glycoconj. J. 2001, 18, 883–893. [Google Scholar] [CrossRef]
- Pinho, S.; Marcos, N.T.; Ferreira, B.; Carvalho, A.S.; Oliveira, M.J.; Santos-Silva, F.; Harduin-Lepers, A.; Reis, C.A. Biological significance of cancer-associated sialyl-Tn antigen: Modulation of malignant phenotype in gastric carcinoma cells. Cancer Lett. 2007, 249, 157–170. [Google Scholar] [CrossRef]
- Clément, M.; Rocher, J.; Loirand, G.; Le Pendu, J. Expression of sialyl-Tn epitopes on beta1 integrin alters epithelial cell phenotype, proliferation and haptotaxis. J. Cell Sci. 2004, 117 Pt 21, 5059–5069. [Google Scholar] [CrossRef] [Green Version]
- Wang, W.-Y.; Cao, Y.-X.; Zhou, X.; Wei, B.; Zhan, L.; Sun, S.-Y. Stimulative role of ST6GALNAC1 in proliferation, migration and invasion of ovarian cancer stem cells via the Akt signaling pathway. Cancer Cell Int. 2019, 19, 86. [Google Scholar] [CrossRef] [PubMed] [Green Version]
- Loureiro, L.R.; Sousa, D.P.; Ferreira, D.; Chai, W.; Lima, L.; Pereira, C.; Lopes, C.B.; Correia, V.G.; Silva, L.M.; Li, C.; et al. Novel monoclonal antibody L2A5 specifically targeting sialyl-Tn and short glycans terminated by alpha-2–6 sialic acids. Sci. Rep. 2018, 8, 12196. [Google Scholar] [CrossRef] [PubMed]
- Sunpaweravong, S.; Bunbanjerdsuk, S.; Pongrujikorn, T.; Naktang, C.; Sunpaweravong, P.; Nitiruangjaras, A.; Dechaphankul, T.; Jinawath, N. Clonal relationship of synchronous head and neck cancer and esophageal cancer assessed by single nucleotide polymorphism-based loss of heterozygosity analysis. BMC Cancer 2019, 19, 1174. [Google Scholar] [CrossRef] [PubMed]
- Yan, W.; Wistuba, I.I.; Emmert-Buck, M.R.; Erickson, H.S. Squamous Cell Carcinoma—Similarities and Differences among Anatomical Sites. Am. J. Cancer Res. 2011, 1, 275–300. [Google Scholar]
- Kim, J.S.; Kim, B.W. Esophageal cancer and head and neck cancer: The earlier, the better. Gut Liver 2015, 9, 131–132. [Google Scholar] [CrossRef] [Green Version]
- Chiba, I.; Ogawa, K.; Morioka, T.; Shimoji, H.; Sunagawa, N.; Iraha, S.; Nishimaki, T.; Yoshimi, N.; Murayama, S. Clinical significance of GLUT-1 expression in patients with esophageal cancer treated with concurrent chemoradiotherapy. Oncol. Lett. 2011, 2, 21–28. [Google Scholar] [CrossRef] [PubMed]
- Lin, Z.; Weinberg, J.M.; Malhotra, R.; Merritt, S.E.; Holzman, L.B.; Brosius, F.C. 3rd, GLUT-1 reduces hypoxia-induced apoptosis and JNK pathway activation. Am. J. Physiol. Endocrinol. Metab. 2000, 278, E958–E966. [Google Scholar] [CrossRef]
- Sawayama, H.; Ishimoto, T.; Watanabe, M.; Yoshida, N.; Baba, Y.; Sugihara, H.; Izumi, D.; Kurashige, J.; Baba, H. High expression of glucose transporter 1 on primary lesions of esophageal squamous cell carcinoma is associated with hematogenous recurrence. Ann. Surg. Oncol. 2014, 21, 1756–1762. [Google Scholar] [CrossRef]
- Sawayama, H.; Ogata, Y.; Ishimoto, T.; Mima, K.; Hiyoshi, Y.; Iwatsuki, M.; Baba, Y.; Miyamoto, Y.; Yoshida, N.; Baba, H. Glucose transporter 1 regulates the proliferation and cisplatin sensitivity of esophageal cancer. Cancer Sci. 2019, 110, 1705–1714. [Google Scholar] [CrossRef] [Green Version]
- Blayney, J.K.; Cairns, L.; Li, G.; McCabe, N.; Stevenson, L.; Peters, C.J.; Reid, N.B.; Spence, V.J.; Chisambo, C.; McManus, D.; et al. Glucose transporter 1 expression as a marker of prognosis in oesophageal adenocarcinoma. Oncotarget 2018, 9, 18518–18528. [Google Scholar] [CrossRef]
- Bern, M.; Kil, Y.J.; Becker, C. Byonic: Advanced peptide and protein identification software. Curr. Protoc. Bioinform. 2012, 40, 13.20.1–13.20.14. [Google Scholar] [CrossRef] [Green Version]
- Younes, M.; Lechago, L.V.; Lechago, J. Overexpression of the human erythrocyte glucose transporter occurs as a late event in human colorectal carcinogenesis and is associated with an increased incidence of lymph node metastases. Clin. Cancer Res. 1996, 2, 1151–1154. [Google Scholar] [PubMed]
- De Wit, M.; Jimenez, C.R.; Carvalho, B.; Belien, J.A.; Delis-van Diemen, P.M.; Mongera, S.; Piersma, S.R.; Vikas, M.; Navani, S.; Pontén, F.; et al. Cell surface proteomics identifies glucose transporter type 1 and prion protein as candidate biomarkers for colorectal adenoma-to-carcinoma progression. Gut 2012, 61, 855–864. [Google Scholar] [CrossRef] [PubMed] [Green Version]
- Goos, J.A.; de Cuba, E.M.; Coupé, V.M.; Diosdado, B.; Delis-Van Diemen, P.M.; Karga, C.; Beliën, J.A.; Menke-Van der Houven van Oordt, C.W.; Geldof, A.A.; Meijer, G.A.; et al. Glucose Transporter 1 (SLC2A1) and Vascular Endothelial Growth Factor A (VEGFA) Predict Survival After Resection of Colorectal Cancer Liver Metastasis. Ann. Surg. 2016, 263, 138–145. [Google Scholar] [CrossRef]
- Gupta, R.; Jung, E.; Brunak, S. Prediction of N-glycosylation sites in human proteins. 2004, In preparation. 2004. In preparation. [Google Scholar]
- Mohl, J.E.; Gerken, T.A.; Leung, M.Y. ISOGlyP: De novo prediction of isoform specific mucin-type O-glycosylation. Glycobiology 2020, cwaa067. [Google Scholar] [CrossRef] [PubMed]
- Gahmberg, C.G.; Andersson, L.C. Role of sialic acid in the mobility of membrane proteins containing O-linked oligosaccharides on polyacrylamide gel electrophoresis in sodium dodecyl sulfate. Eur. J. Biochem. 1982, 122, 581–586. [Google Scholar] [CrossRef]
- Liu, C.; Erickson, A.K.; Henning, D.R. Distribution and carbohydrate structures of high molecular weight glycoproteins, MUC1 and MUCX, in bovine milk. J. Dairy Sci. 2005, 88, 4288–4294. [Google Scholar] [CrossRef]
- Scicchitano, M.S.; Dalmas, D.A.; Boyce, R.W.; Thomas, H.C.; Frazier, K.S. Protein extraction of formalin-fixed, paraffin-embedded tissue enables robust proteomic profiles by mass spectrometry. J. Histochem. Cytochem. 2009, 57, 849–860. [Google Scholar] [CrossRef] [Green Version]
- Thompson, S.M.; Craven, R.A.; Nirmalan, N.J.; Harnden, P.; Selby, P.J.; Banks, R.E. Impact of pre-analytical factors on the proteomic analysis of formalin-fixed paraffin-embedded tissue. Proteom. Clin. Appl. 2013, 7, 241–251. [Google Scholar] [CrossRef]
- Shi, S.R.; Taylor, C.R.; Fowler, C.B.; Mason, J.T. Complete solubilization of formalin-fixed, paraffin-embedded tissue may improve proteomic studies. Proteom. Clin. Appl. 2013, 7, 264–272. [Google Scholar] [CrossRef] [Green Version]
- Zhang, Y.; Muller, M.; Xu, B.; Yoshida, Y.; Horlacher, O.; Nikitin, F.; Garessus, S.; Magdeldin, S.; Kinoshita, N.; Fujinaka, H.; et al. Unrestricted modification search reveals lysine methylation as major modification induced by tissue formalin fixation and paraffin embedding. Proteomics 2015, 15, 2568–2579. [Google Scholar] [CrossRef]
- Azevedo, R.; Gaiteiro, C.; Peixoto, A.; Relvas-Santos, M.; Lima, L.; Santos, L.L.; Ferreira, J.A. CD44 glycoprotein in cancer: A molecular conundrum hampering clinical applications. Clin. Proteom. 2018, 15, 22. [Google Scholar] [CrossRef] [Green Version]
- Ribeiro-Samy, S.; Oliveira, M.I.; Pereira-Veiga, T.; Muinelo-Romay, L.; Carvalho, S.; Gaspar, J.; Freitas, P.P.; López-López, R.; Costa, C.; Diéguez, L. Fast and efficient microfluidic cell filter for isolation of circulating tumor cells from unprocessed whole blood of colorectal cancer patients. Sci. Rep. 2019, 9, 8032. [Google Scholar] [CrossRef]
- Dirks, W.G.; MacLeod, R.A.; Nakamura, Y.; Kohara, A.; Reid, Y.; Milch, H.; Drexler, H.G.; Mizusawa, H. Cell line cross-contamination initiative: An interactive reference database of STR profiles covering common cancer cell lines. Int. J. Cancer 2010, 126, 303–304. [Google Scholar] [CrossRef]
- Puttamallesh, V.N.; Patel, K.; Gowda, H. Rapid Processing of Archival Tissue Samples for Proteomic Analysis Using Pressure-Cyclin Technology. J. Proteins Proteom. 2017, 8, 127. [Google Scholar]
- Uhlen, M.; Fagerberg, L.; Hallstrom, B.M.; Lindskog, C.; Oksvold, P.; Mardinoglu, A.; Sivertsson, A.; Kampf, C.; Sjostedt, E.; Asplund, A.; et al. Proteomics. Tissue-based map of the human proteome. Science 2015, 347, 1260419. [Google Scholar] [CrossRef]


| n (%) | |
|---|---|
| Stage | |
| I | 13 (27) |
| II | 11 (23) |
| III | 23 (48) |
| IV | 1 (2) |
| Tumour (pT) | |
| T1 | 9 (19) |
| T2 | 13 (27) |
| T3 | 25 (52) |
| T4 | 1 (2) |
| Lymph node metastasis (pN) | |
| N0 | 21 (44) |
| N1 | 11 (23) |
| N2 | 10 (21) |
| N3 | 6 (12) |
| Distant Metastasis (M) | |
| M0 | 47 (98) |
| M1 | 1 (2) |
| Distant Recurrence (DR) | |
| No | 31 (65) |
| Yes | 17 (35) |
| Histological Classification | |
| Squamous cell carcinoma | 48 (100) |
| Adenocarcinoma | 0 (0) |
| Keratinization Degree | |
| Non-keratinized | 30 (63) |
| Moderately keratinized | 2 (4) |
| Keratinized | 16 (33) |
| Differentiation Degree | |
| Well-differentiated | 7 (15) |
| Moderately differentiated | 26 (54) |
| Poorly differentiated | 10 (21) |
| Missing information | 5 (10) |
| Extra-tumoral growth | |
| Present | 12 (25) |
| Absent | 36 (75) |
| Lymphovascular Permeation | |
| Present | 21 (44) |
| Absent | 27 (56) |
| Neural Permeation | |
| Present | 13 (27) |
| Absent | 35 (73) |
| n (%) | |
|---|---|
| Stage | |
| I | 0 (0) |
| II | 7 (70) |
| III | 3 (30) |
| IV | 0 (0) |
| Tumour (pT) | |
| T1 | 1 (10) |
| T2 | 2 (20) |
| T3 | 6 (60) |
| T4 | 1 (10) |
| Lymph node metastasis (pN) | |
| N0 | 7 (70) |
| N1 | 3 (30) |
| Distant metastasis (M) | |
| M0 | 10 (100) |
| M1 | 0 (0) |
| Histological Classification | |
| Squamous cell carcinoma | 10 (100) |
| Adenocarcinoma | 0 (0) |
| Lymphovascular Permeation | |
| Present | 3 (30) |
| Absent | 3 (30) |
| Missing information | 4 (40) |
| Neural Permeation | |
| Present | 1 (10) |
| Absent | 5 (50) |
| Missing information | 4 (40) |
| STn Expression | Positive Cases/Total (%) | p Value |
|---|---|---|
| Stage | ||
| I | 7/13 (54) | 0.414 |
| II | 8/11 (72) | |
| III | 18/23 (78) | |
| IV | 1/1 (100) | |
| Tumour (pT) | ||
| T1 | 4/9 (44) | 0.261 |
| T2 | 10/13 (77) | |
| T3 | 19/25 (76) | |
| T4 | 1/1 (100) | |
| Lymph node metastasis (pN) | ||
| N0 | 13/21 (62) | 0.639 |
| N1 | 8/11 (73) | |
| N2 | 8/10 (80) | |
| N3 | 5/6 (83) | |
| Distant metastasis (M) | ||
| M0 | 33/47 (70) | 0.708 |
| M1 | 1/1 (100) | |
| Distant recurrence (DR) | ||
| No | 20/31 (65) | 0.167 |
| Yes | 14/17 (82) | |
| Borrmann Classification | ||
| I | 4/7 (57) | 0.583 |
| II | 15/21 (71) | |
| III | 6/7 (86) | |
| IV | 9/11 (82) | |
| Missing information | 0/2 (0) | |
| Keratinization Degree | ||
| Non-keratinized | 22/30 (73) | 0.762 |
| Moderately keratinized | 1/2 (50) | |
| Keratinized | 11/16 (69) | |
| Differentiation Degree | ||
| Well-differentiated | 4/7 (57) | 0.577 |
| Moderately differentiated | 19/26 (73) | |
| Poorly differentiated | 8/10 (80) | |
| Missing information | 3/5 (60) | |
| Extra-tumoral growth | ||
| Present | 10/12 (83) | 0.237 |
| Absent | 24/36 (67) | |
| Lymphatic Permeation | ||
| Present | 16/21 (76) | 0.347 |
| Absent | 18/27 (67) | |
| Vascular Permeation | ||
| Present | 14/21 (67) | 0.403 |
| Absent | 20/27 (74) | |
| Neural Permeation | ||
| Present | 8/13 (62) | 0.301 |
| Absent | 26/35 (74) |
| GLUT1 Expression | Low Expression (% Total) | High Expression (% Total) | p Value |
|---|---|---|---|
| Stage | |||
| I | 8 (62) | 5 (38) | 0.081 |
| II | 10 (91) | 1 (9) | |
| III | 19 (83) | 4 (17) | |
| IV | 0 (0) | 1 (100) | |
| Tumour (pT) | |||
| T1 | 8 (89) | 1 (11) | 0.406 |
| T2 | 8 (62) | 5 (38) | |
| T3 | 20 (80) | 5 (20) | |
| T4 | 1 (100) | 0 (0) | |
| Lymph node metastasis (pN) | |||
| N0 | 15 (71) | 6 (29) | 0.575 |
| N1 | 10 (91) | 1 (9) | |
| N2 | 7 (79) | 3 (30) | |
| N3 | 5 (83) | 1 (17) | |
| Distant metastasis (M) | |||
| M0 | 37 (79) | 10 (21) | 0.064 |
| M1 | 0 (0) | 1 (100) | |
| Distant recurrence (DR) | |||
| No | 27 (87) | 4 (13) | 0.026 |
| Yes | 10 (59) | 7 (41) | |
| Keratinization Degree | |||
| Non-keratinized | 23 (77) | 7 (23) | 0.727 |
| Moderately keratinized | 2 (100) | 0 (0) | |
| Keratinized | 12 (75) | 4 (25) | |
| Differentiation Degree | |||
| Well-differentiated | 3 (43) | 4 (57) | 0.081 |
| Moderately differentiated | 20 (77) | 6 (23) | |
| Poorly differentiated | 9 (90) | 1 (10) | |
| Missing information | 5 (100) | 0 (0) | |
| Extra-tumoral growth | |||
| Present | 9 (75) | 3 (25) | 0.563 |
| Absent | 28 (78) | 8 (22) | |
| Lymphatic Permeation | |||
| Present | 15 (71) | 6 (29) | 0.316 |
| Absent | 22 (81) | 5 (19) | |
| Vascular Permeation | |||
| Present | 15 (71) | 6 (29) | 0.316 |
| Absent | 22 (81) | 5 (19) | |
| Neural Permeation | |||
| Present | 10 (77) | 3 (23) | 0.632 |
| Absent | 27 (77) | 8 (23) |
Publisher’s Note: MDPI stays neutral with regard to jurisdictional claims in published maps and institutional affiliations. |
© 2021 by the authors. Licensee MDPI, Basel, Switzerland. This article is an open access article distributed under the terms and conditions of the Creative Commons Attribution (CC BY) license (http://creativecommons.org/licenses/by/4.0/).
Share and Cite
Cotton, S.; Ferreira, D.; Soares, J.; Peixoto, A.; Relvas-Santos, M.; Azevedo, R.; Piairo, P.; Diéguez, L.; Palmeira, C.; Lima, L.; et al. Target Score—A Proteomics Data Selection Tool Applied to Esophageal Cancer Identifies GLUT1-Sialyl Tn Glycoforms as Biomarkers of Cancer Aggressiveness. Int. J. Mol. Sci. 2021, 22, 1664. https://0-doi-org.brum.beds.ac.uk/10.3390/ijms22041664
Cotton S, Ferreira D, Soares J, Peixoto A, Relvas-Santos M, Azevedo R, Piairo P, Diéguez L, Palmeira C, Lima L, et al. Target Score—A Proteomics Data Selection Tool Applied to Esophageal Cancer Identifies GLUT1-Sialyl Tn Glycoforms as Biomarkers of Cancer Aggressiveness. International Journal of Molecular Sciences. 2021; 22(4):1664. https://0-doi-org.brum.beds.ac.uk/10.3390/ijms22041664
Chicago/Turabian StyleCotton, Sofia, Dylan Ferreira, Janine Soares, Andreia Peixoto, Marta Relvas-Santos, Rita Azevedo, Paulina Piairo, Lorena Diéguez, Carlos Palmeira, Luís Lima, and et al. 2021. "Target Score—A Proteomics Data Selection Tool Applied to Esophageal Cancer Identifies GLUT1-Sialyl Tn Glycoforms as Biomarkers of Cancer Aggressiveness" International Journal of Molecular Sciences 22, no. 4: 1664. https://0-doi-org.brum.beds.ac.uk/10.3390/ijms22041664