
Ultrasound-Based Molecular Imaging of Tumors with PTPmu Biomarker-Targeted Nanobubble Contrast Agents

 , and
, and
Abstract
:1. Introduction
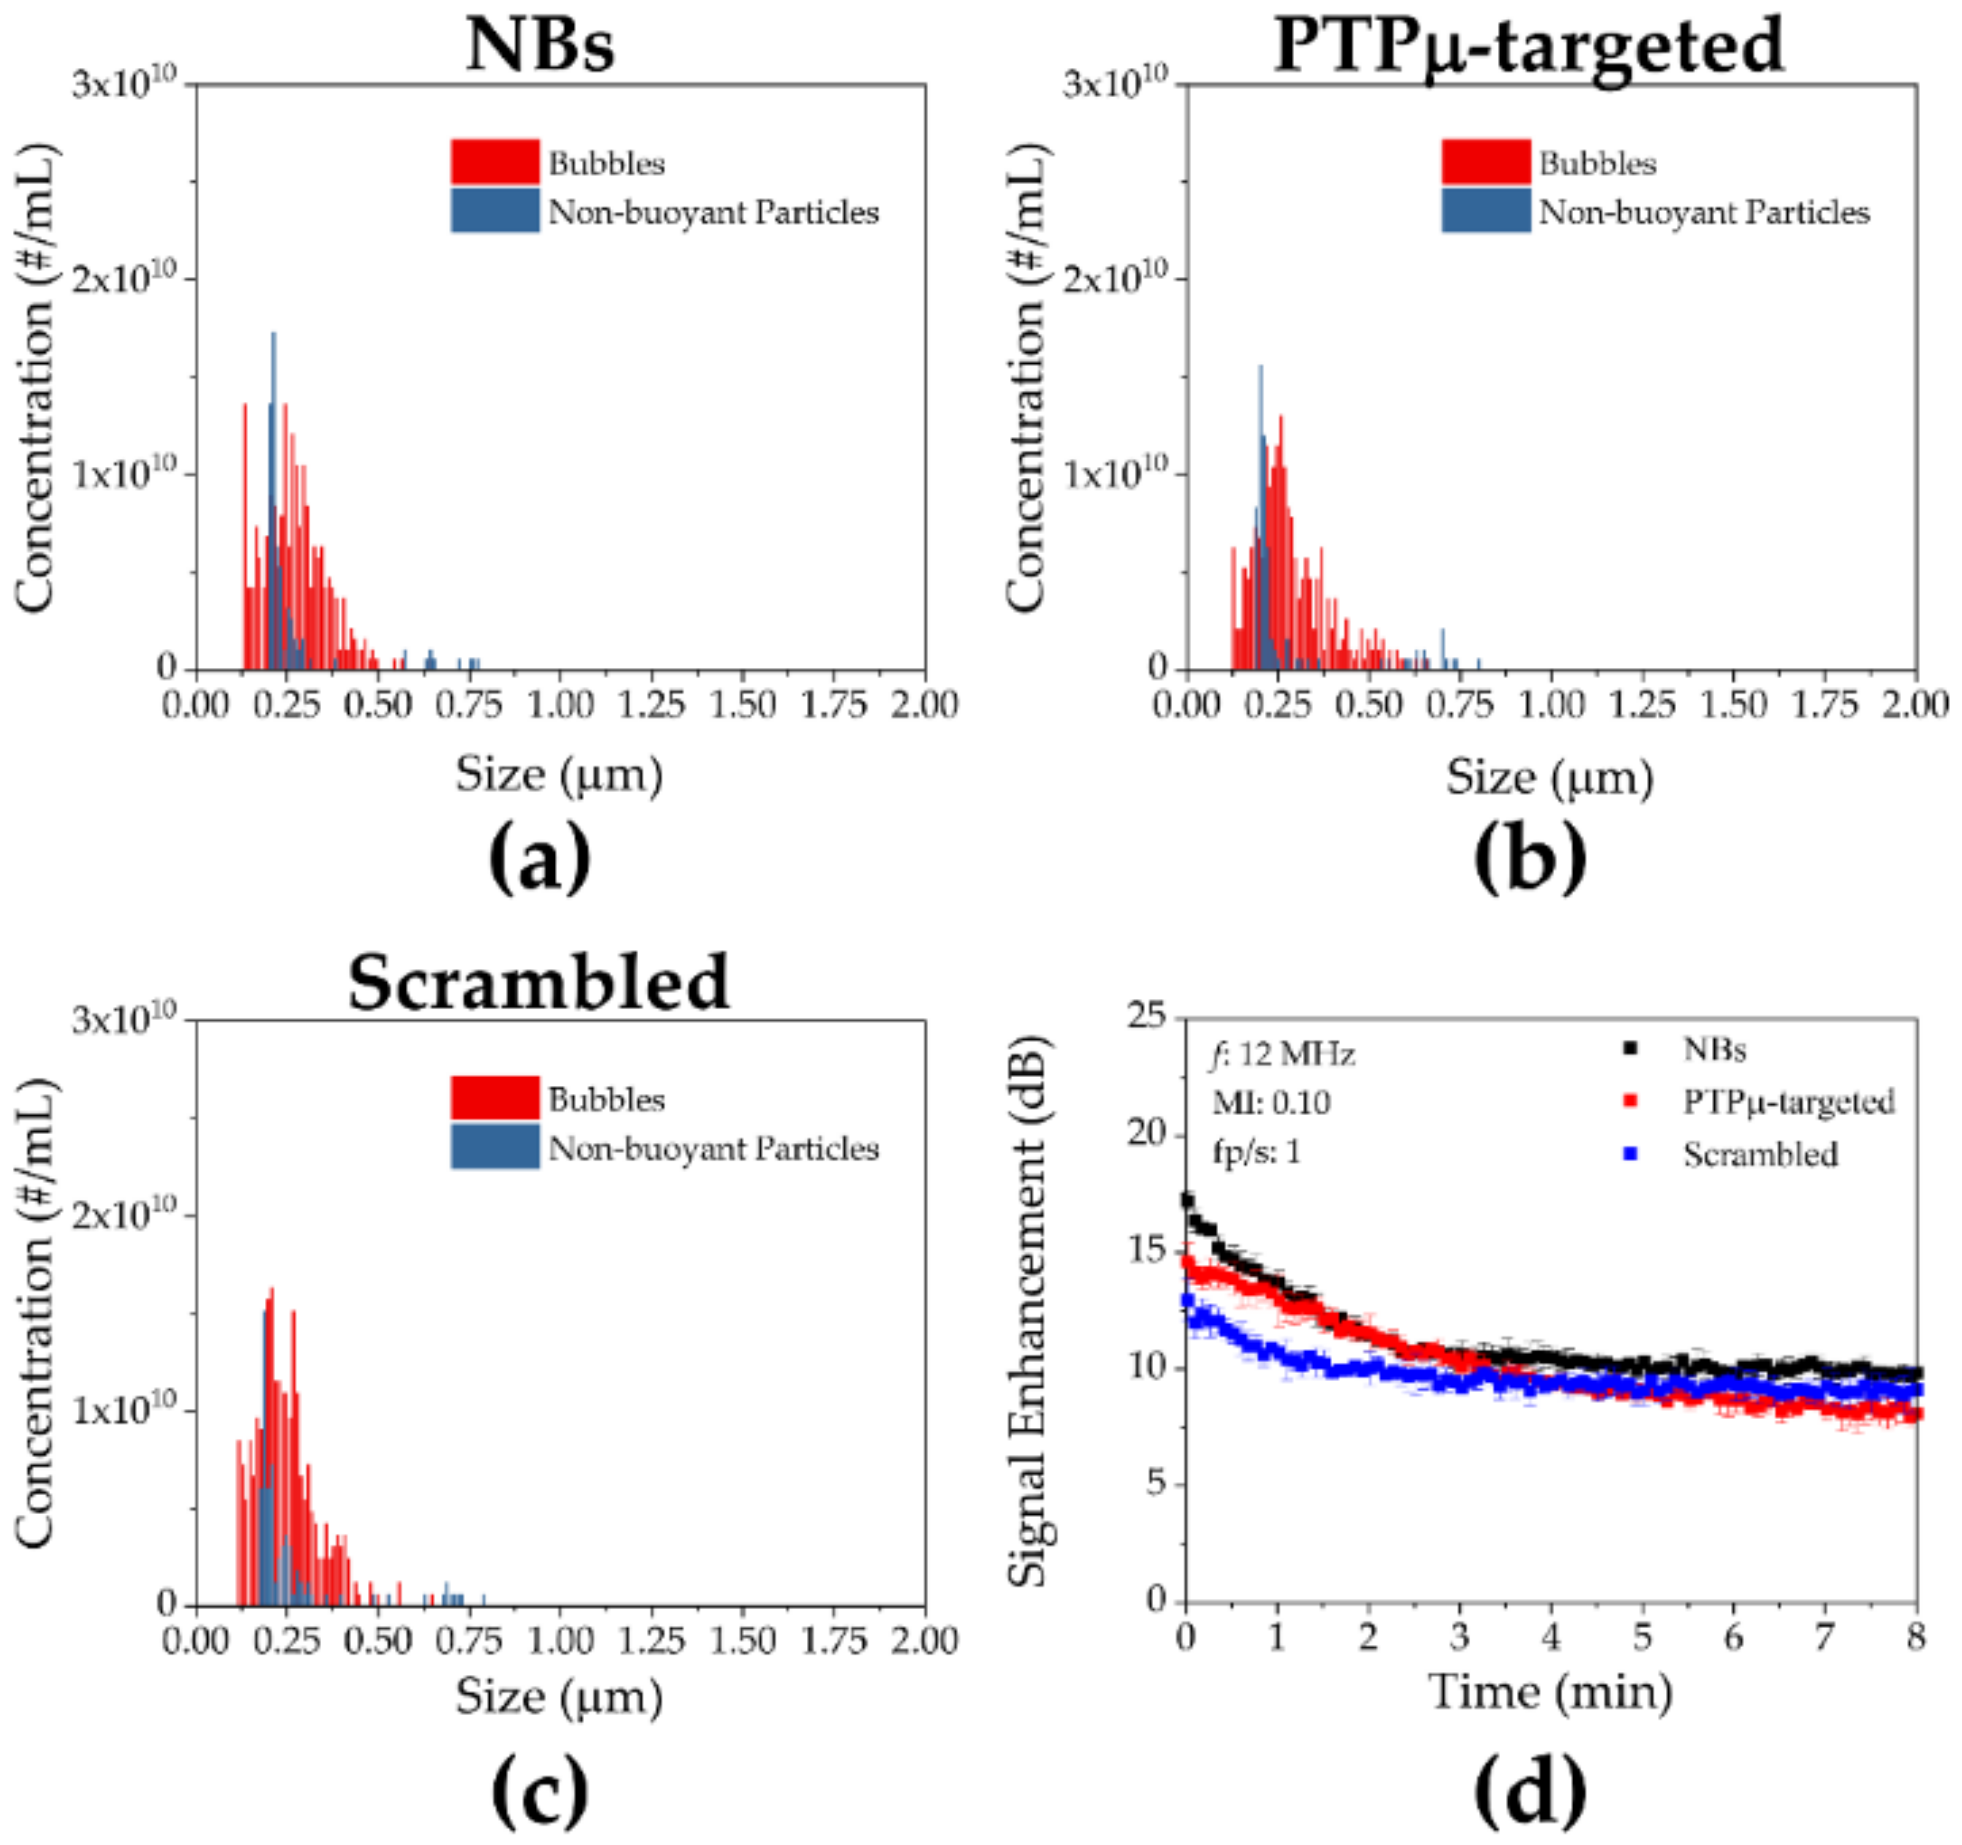
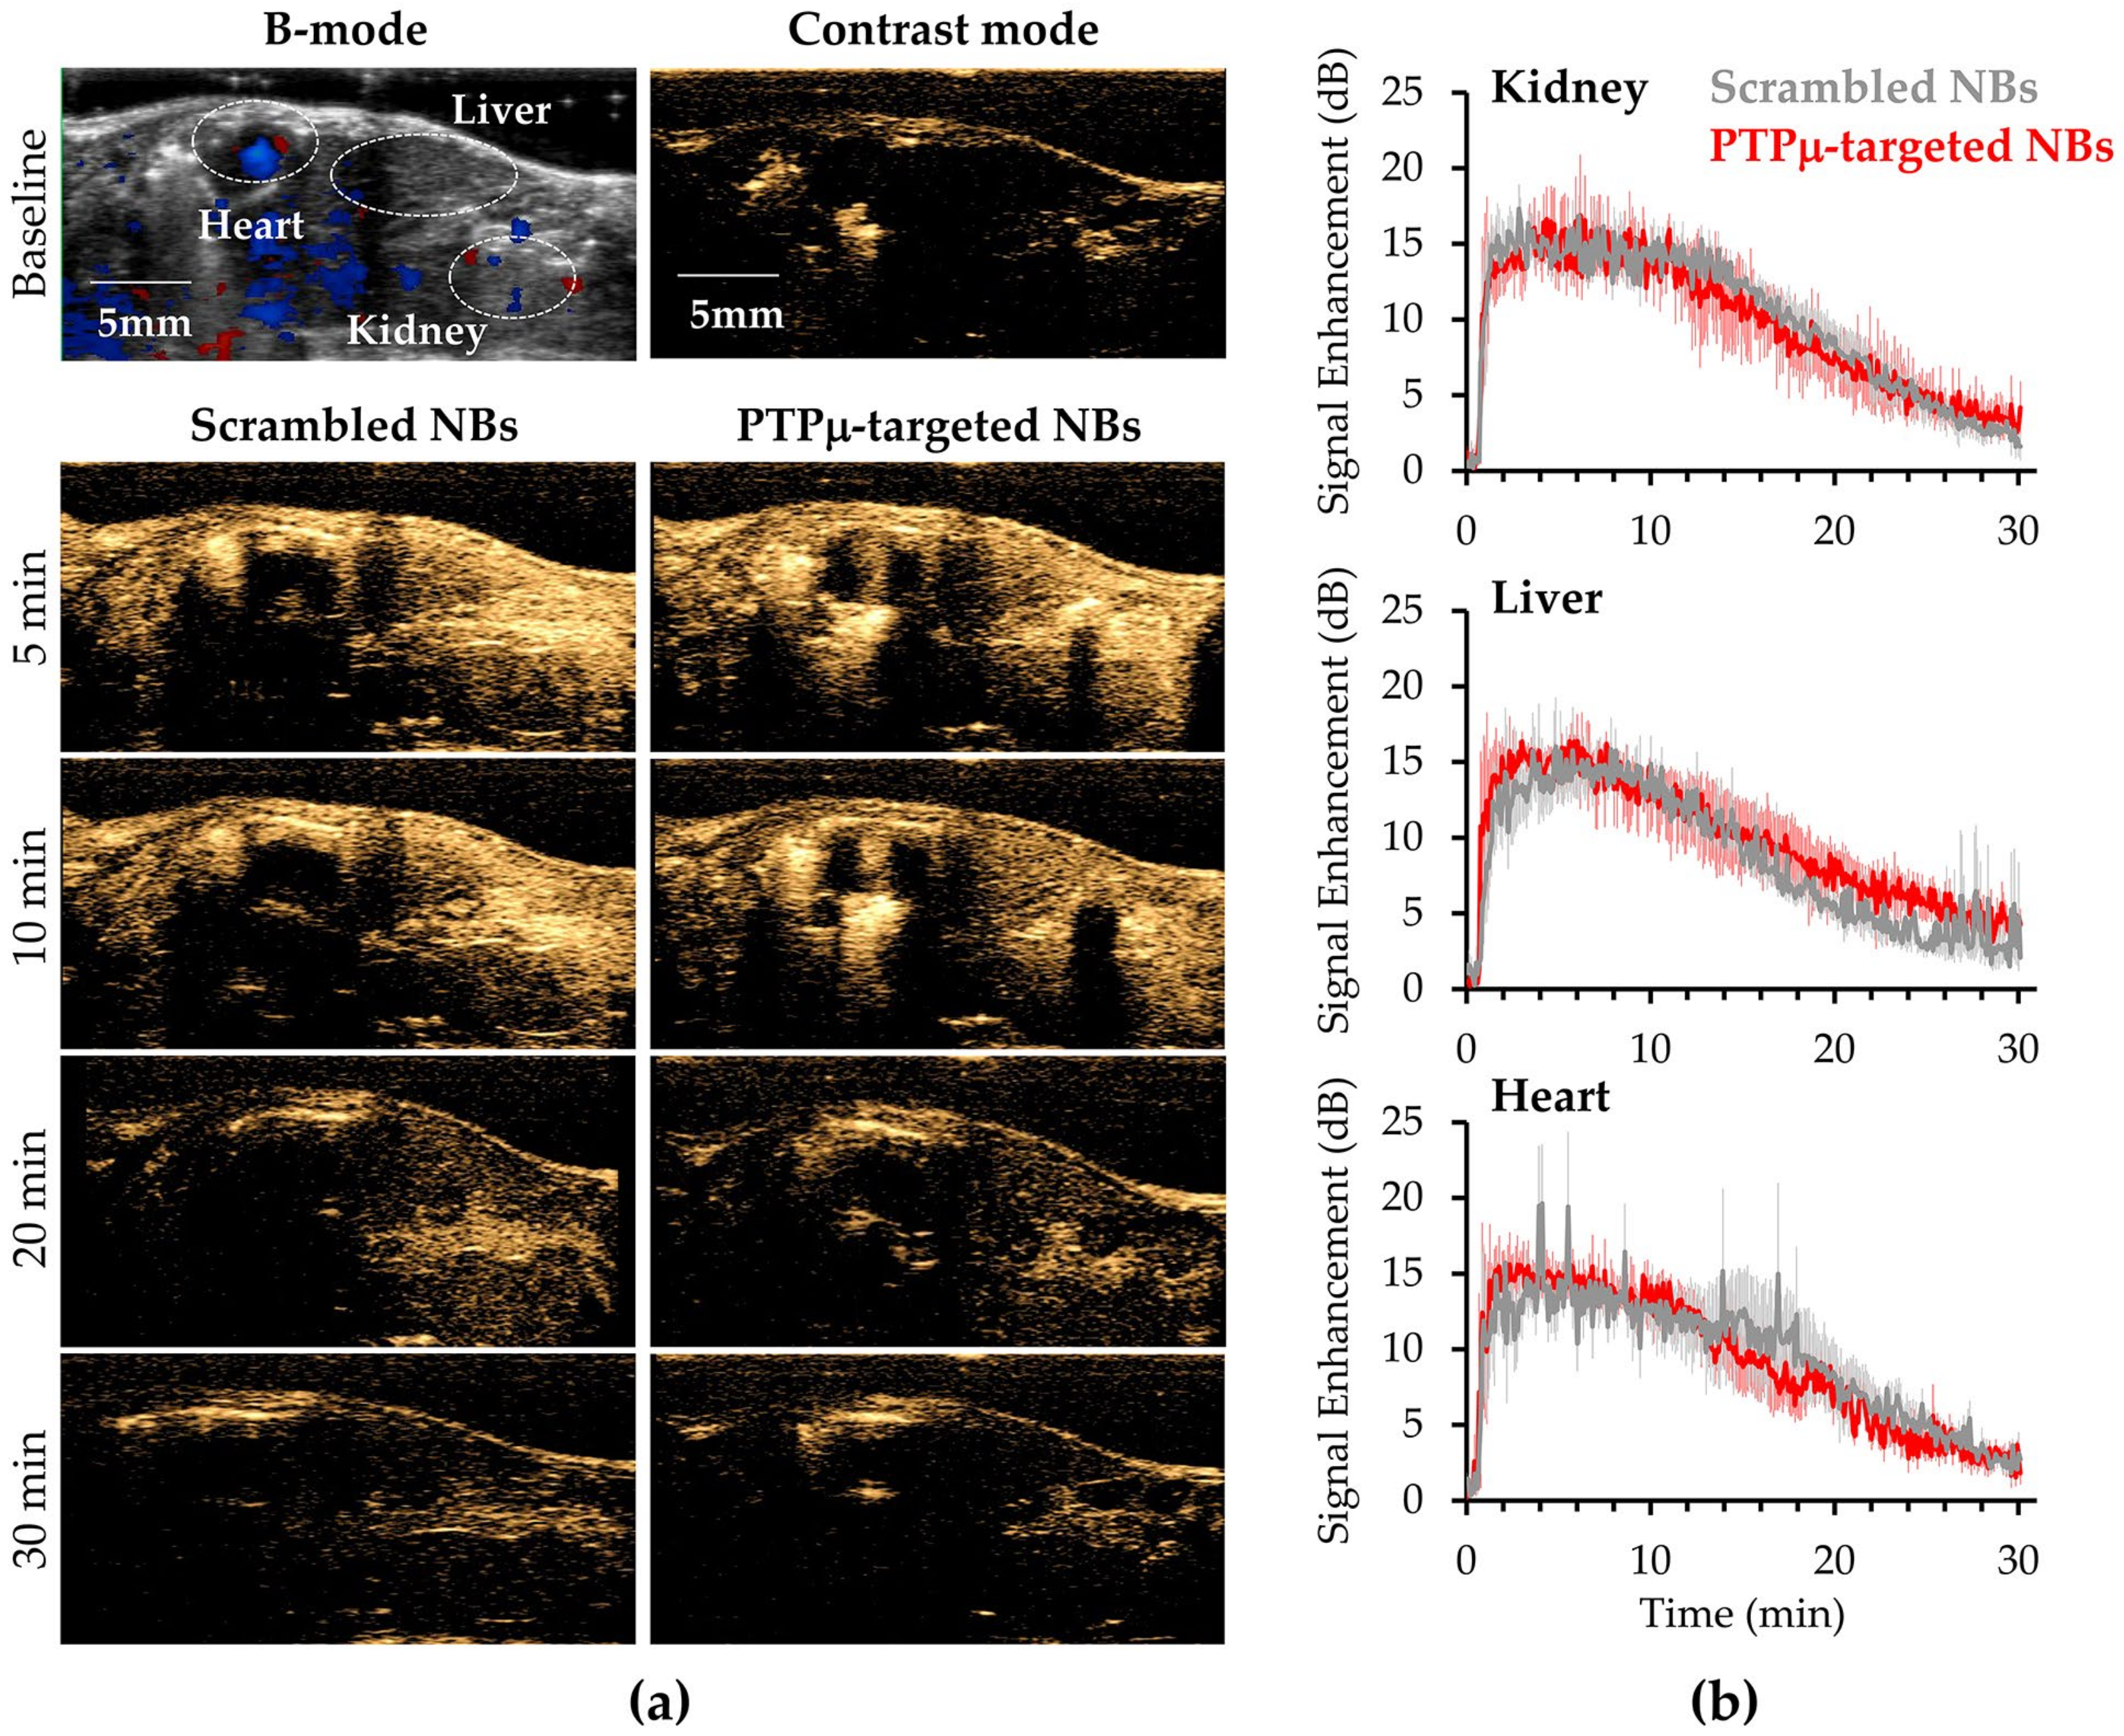
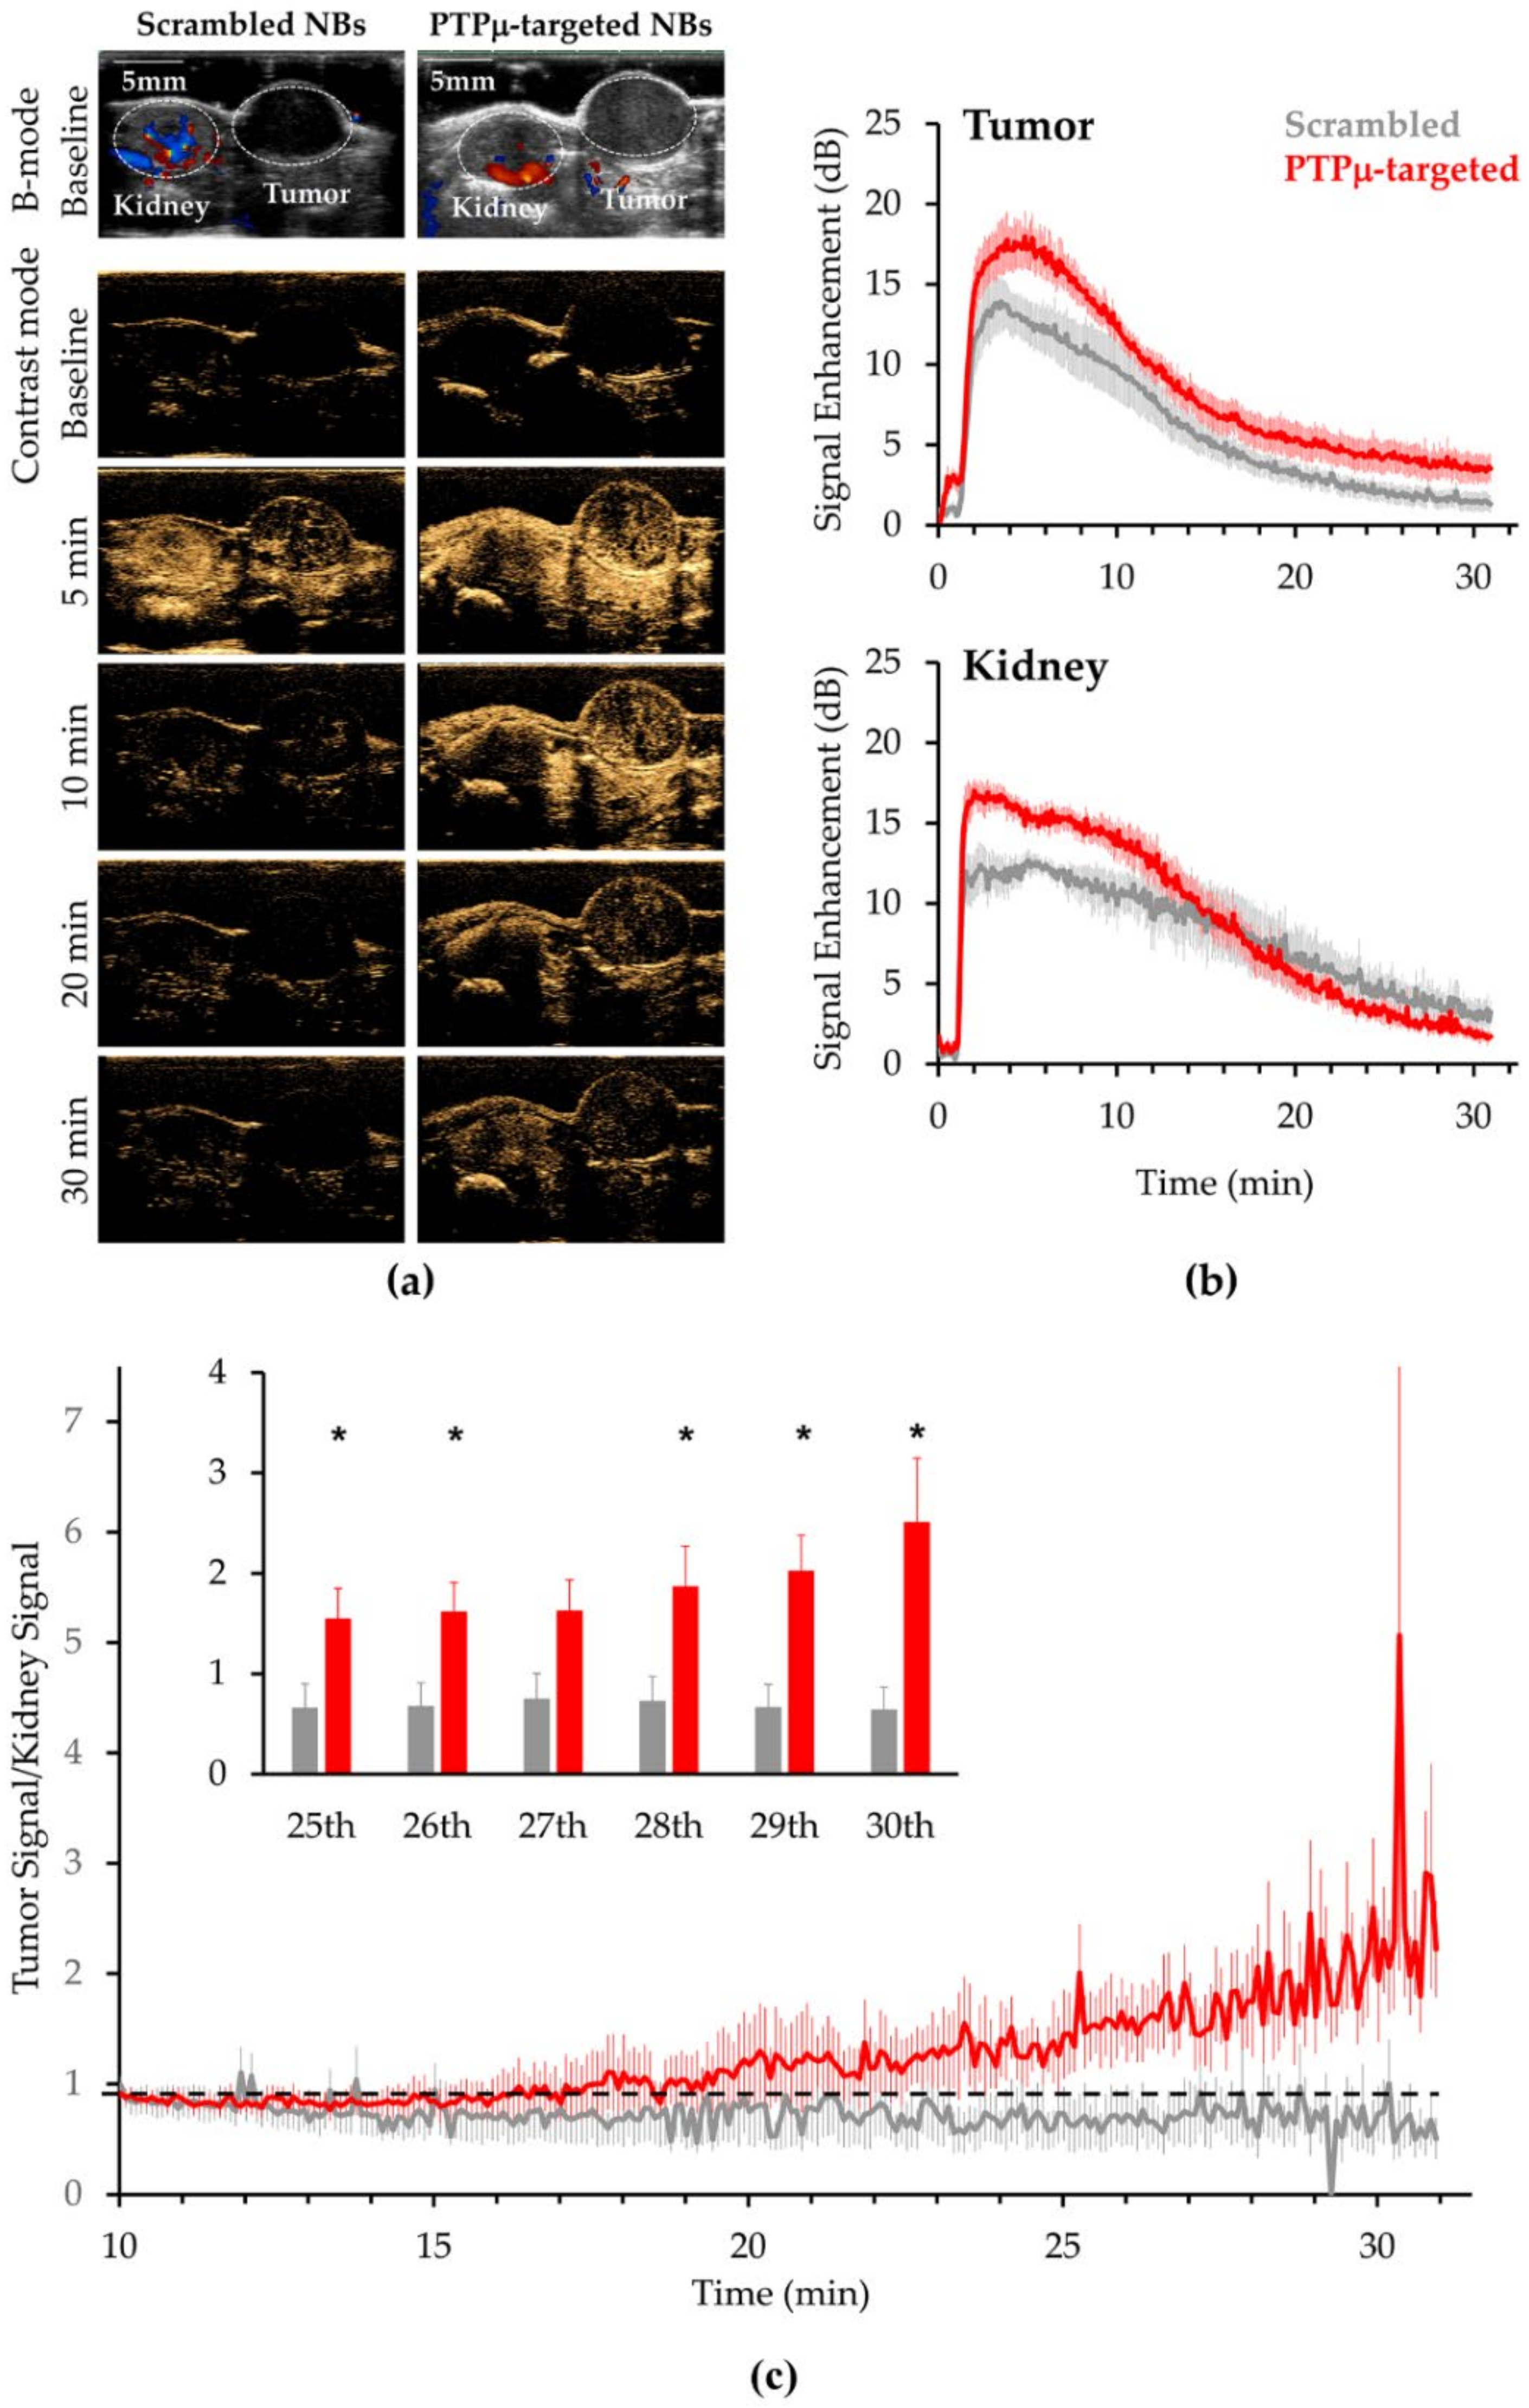
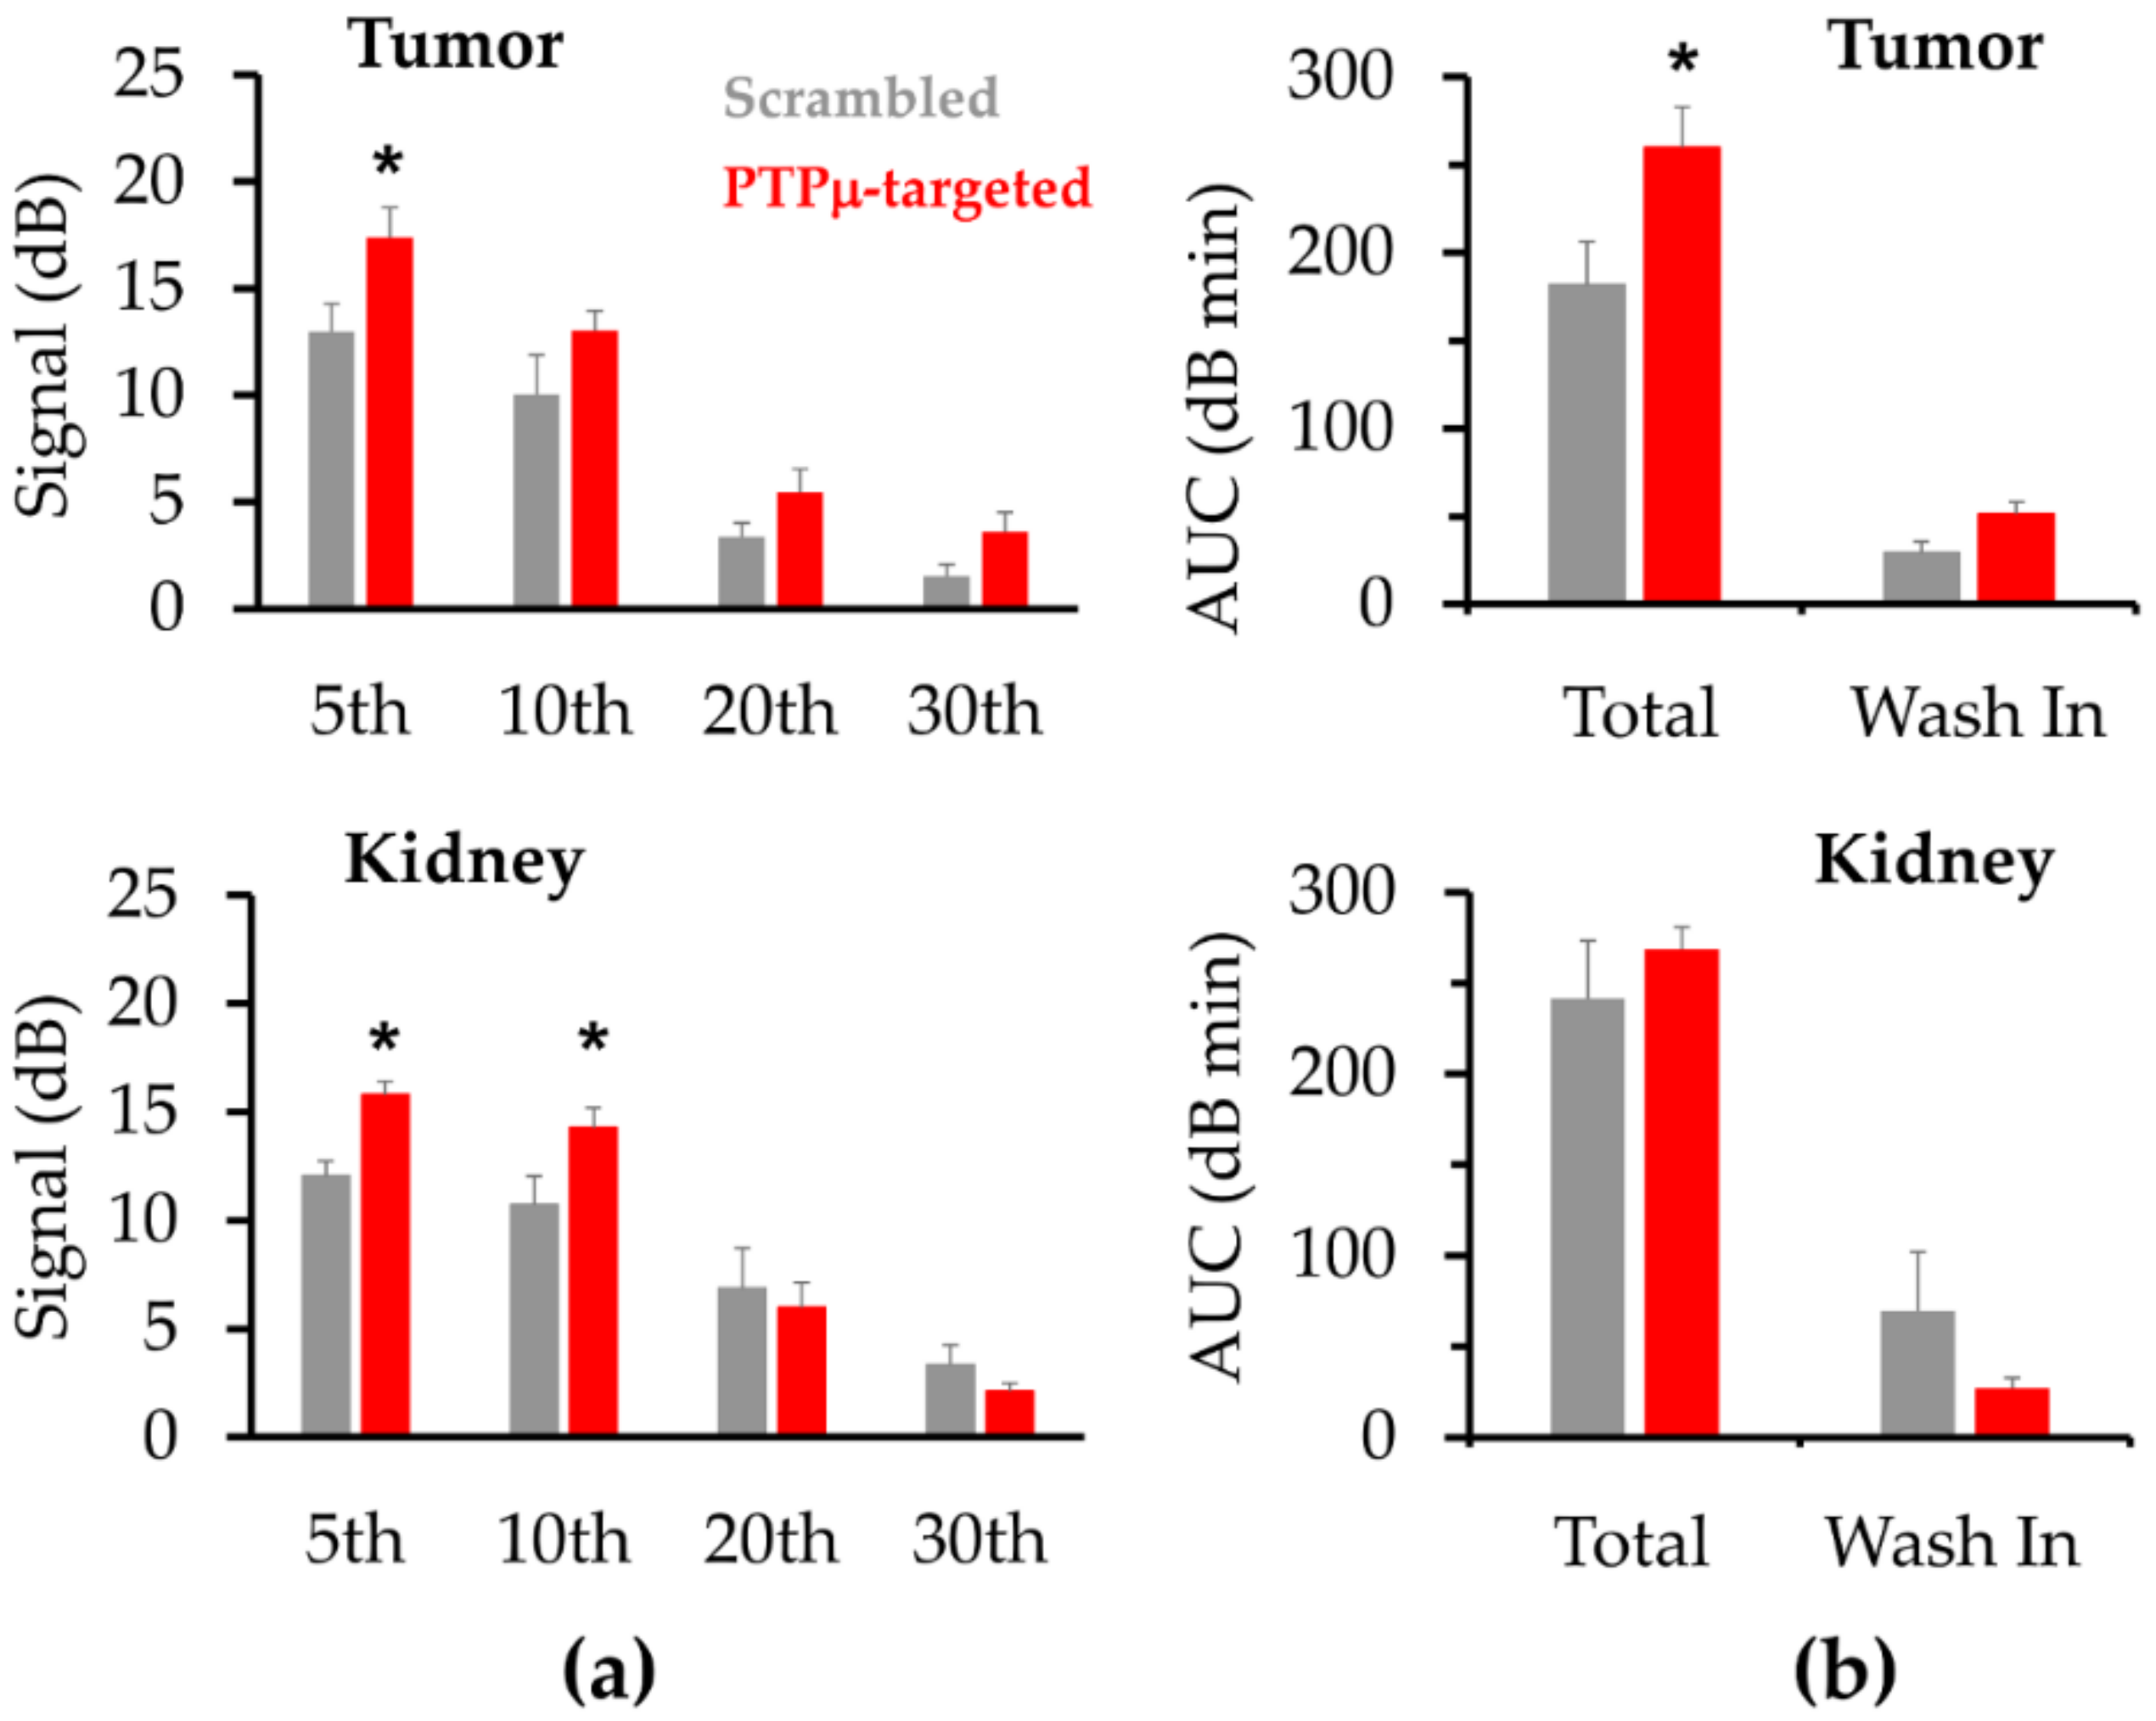
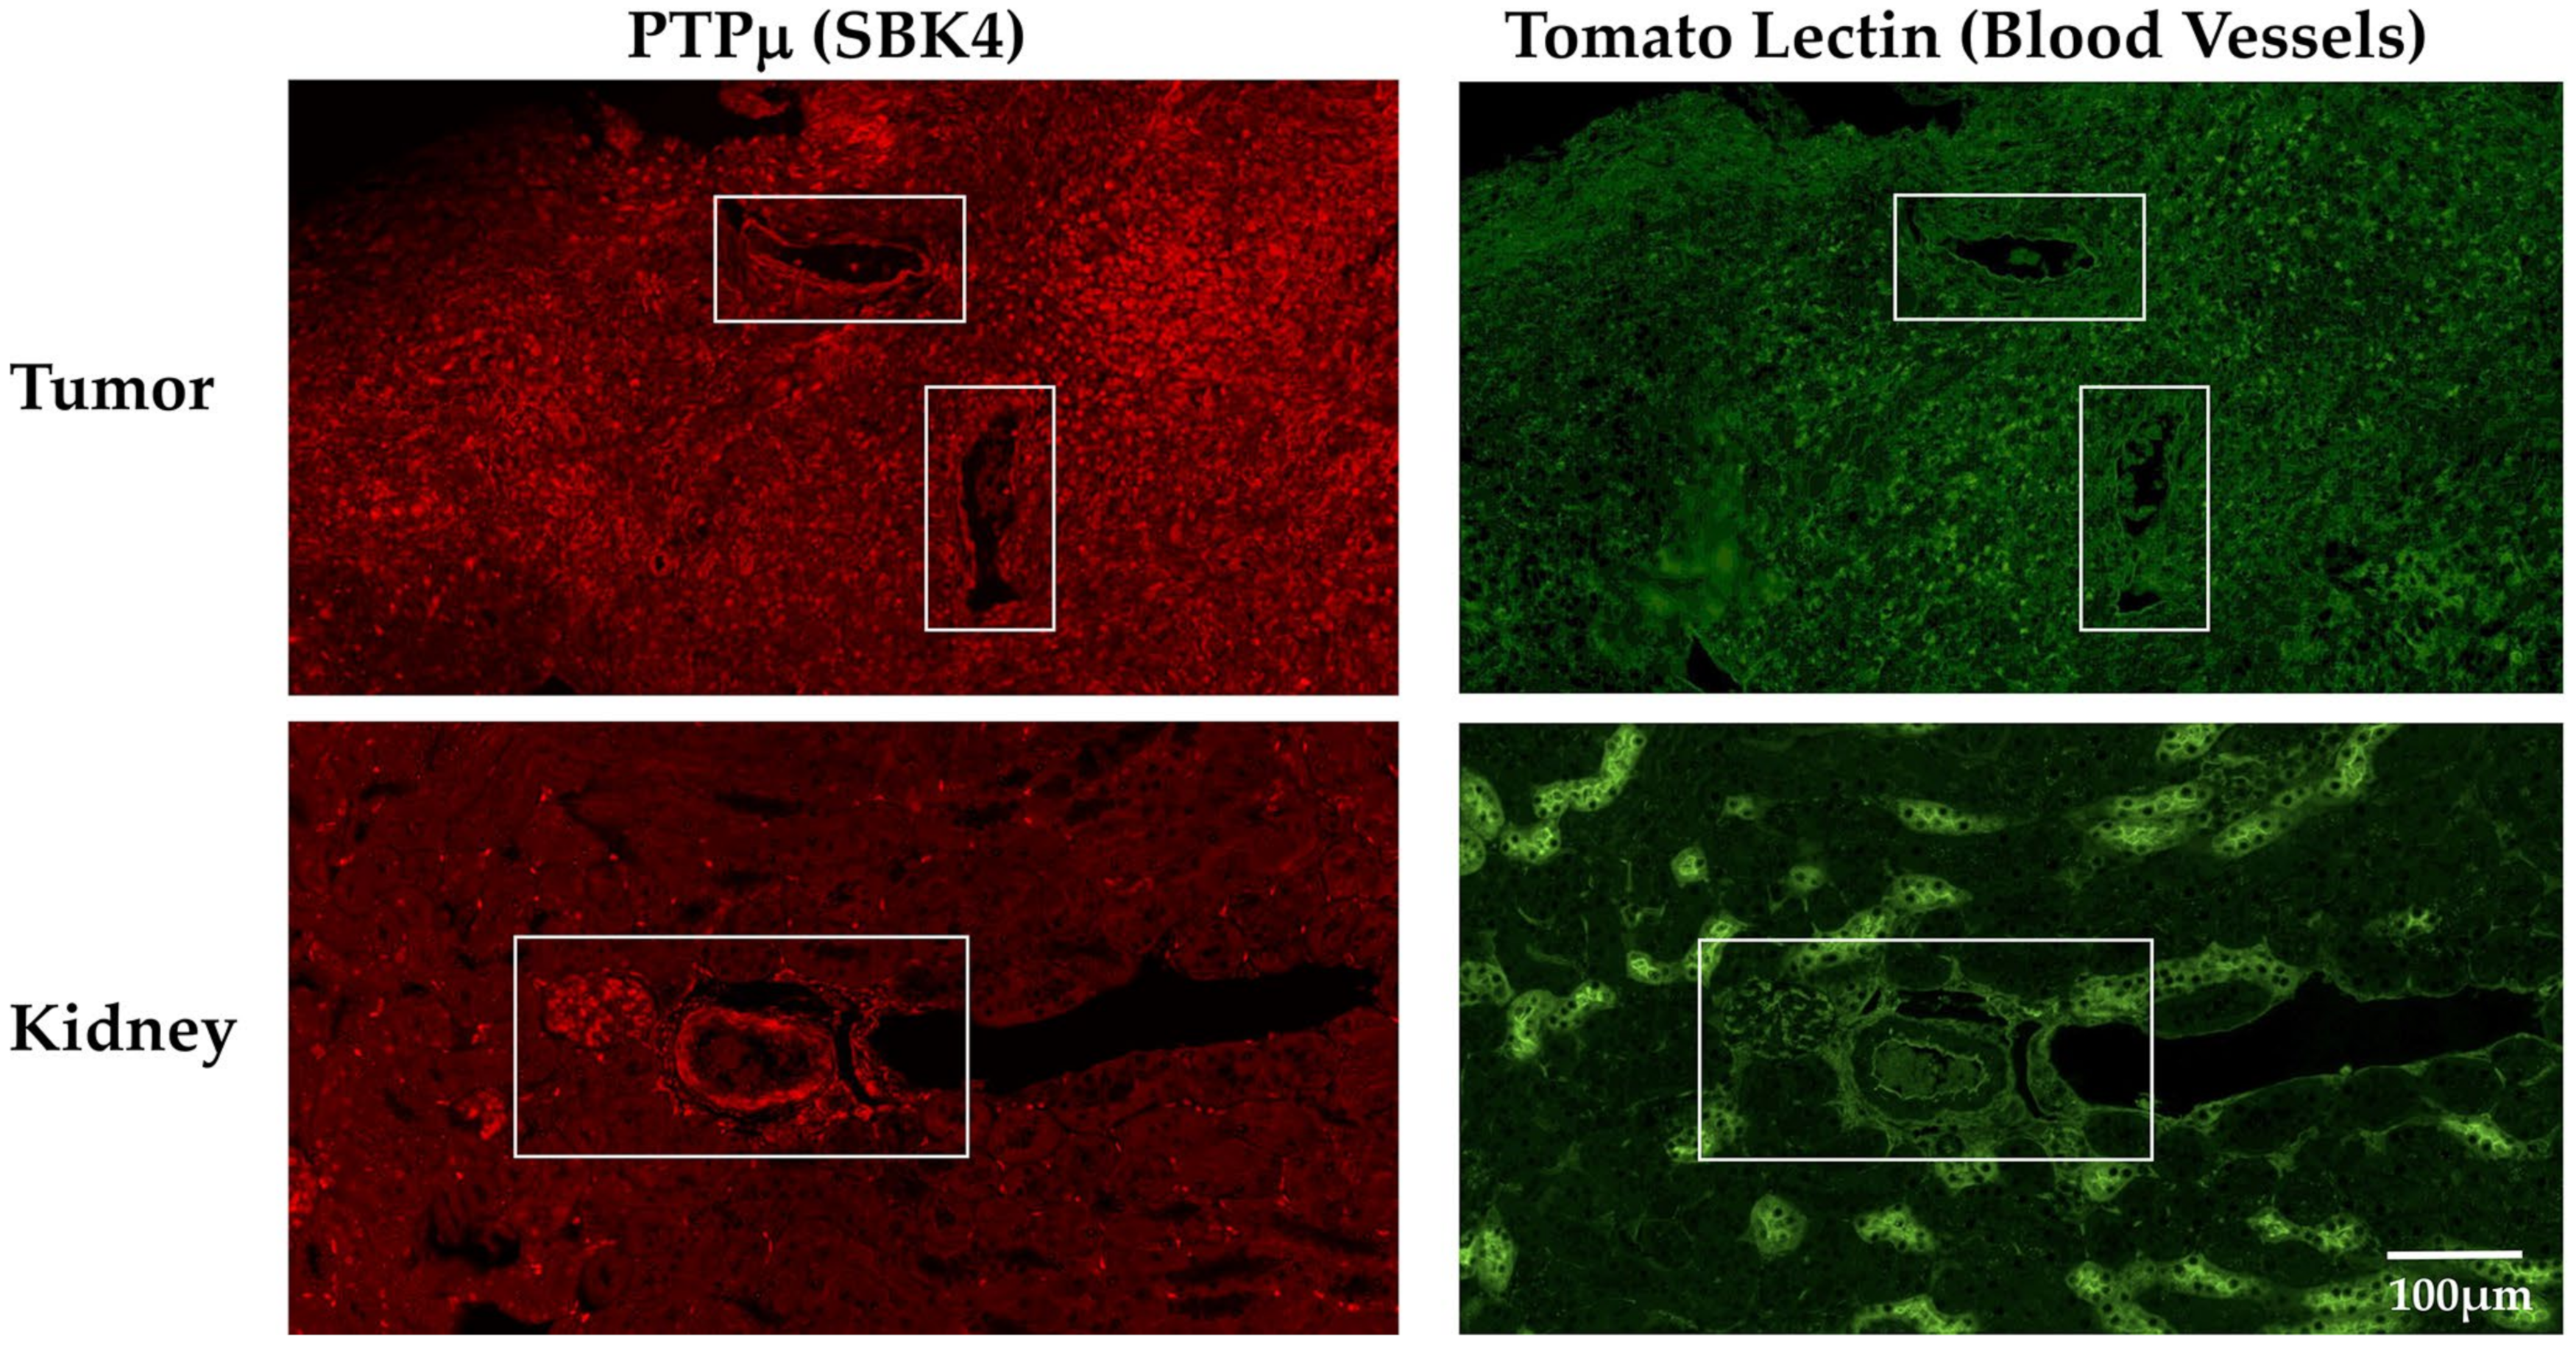
2. Results
3. Discussion
4. Materials and Methods
4.1. Materials
4.2. Peptide-Lipid Conjugation
4.3. Nanobubble Formulation
4.4. In Vitro Nanobubble Characterization
4.5. Mice and Experimental Tumor Models
4.6. In Vivo US Imaging
4.7. Histology
4.8. Statistical Analysis
Supplementary Materials
Author Contributions
Funding
Institutional Review Board Statement
Informed Consent Statement
Data Availability Statement
Acknowledgments
Conflicts of Interest
References
- Szabo, T.L. Diagnostic Ultrasound Imaging: Inside Out, 2nd ed.; Elsevier: Amsterdam, The Netherlands, 2014. [Google Scholar]
- Abou-Elkacem, L.; Bachawal, S.V.; Willmann, J.K. Ultrasound molecular imaging: Moving toward clinical translation. Eur. J. Radiol. 2015, 84, 1685–1693. [Google Scholar] [CrossRef] [Green Version]
- De Leon, A.; Perera, R.; Nittayacharn, P.; Cooley, M.; Jung, O.; Exner, A.A. Ultrasound Contrast Agents and Delivery Systems in Cancer Detection and Therapy. Adv. Cancer Res. 2018, 139, 57–84. [Google Scholar] [CrossRef] [PubMed]
- Erlichman, D.B.; Weiss, A.; Koenigsberg, M.; Stein, M.W. Contrast enhanced ultrasound: A review of radiology applications. Clin. Imaging 2020, 60, 209–215. [Google Scholar] [CrossRef] [PubMed] [Green Version]
- Bierig, S.M.; Jones, A. Accuracy and Cost Comparison of Ultrasound Versus Alternative Imaging Modalities, Including CT, MR, PET, and Angiography. J. Diagn. Med. Sonogr. 2009, 25, 138–144. [Google Scholar] [CrossRef] [Green Version]
- Hunt, D.; Romero, J. Contrast-Enhanced Ultrasound. Magn. Reson. Imaging Clin. N. Am. 2017, 25, 725–736. [Google Scholar] [CrossRef]
- Caskey, C.F. Ultrasound Molecular Imaging and Drug Delivery. Mol. Imaging Biol. 2017, 3, 336–340. [Google Scholar] [CrossRef]
- Kosareva, A.; Abou-Elkacem, L.; Chowdhury, S.; Lindner, J.R.; Kaufmann, B.A. Seeing the Invisible—Ultrasound Molecular Imaging. Ultrasound Med. Biol. 2020, 46, 479–497. [Google Scholar] [CrossRef] [PubMed] [Green Version]
- Hyvelin, J.-M.; Gaud, E.; Costa, M.; Helbert, A.; Bussat, P.; Bettinger, T.; Frinking, P. Characteristics and Echogenicity of Clinical Ultrasound Contrast Agents: An In Vitro and In Vivo Comparison Study. J. Ultrasound Med. 2017, 36, 941–953. [Google Scholar] [CrossRef] [Green Version]
- Lindner, J.R. Contrast echocardiography: Current status and future directions. Heart 2021, 107, 18–24. [Google Scholar] [CrossRef] [PubMed]
- Perera, R.H.; De Leon, A.; Wang, X.; Wang, Y.; Ramamurthy, G.; Peiris, P.; Abenojar, E.; Basilion, J.P.; Exner, A.A. Real time ultrasound molecular imaging of prostate cancer with PSMA-targeted nanobubbles. Nanomed. Nanotechnol. Biol. Med. 2020, 28, 102213. [Google Scholar] [CrossRef] [PubMed]
- Fan, X.; Guo, Y.; Wang, L.; Xiong, X.; Zhu, L.; Fang, K. Diagnosis of prostate cancer using anti-PSMA aptamer A10-3.2-oriented lipid nanobubbles. Int. J. Nanomed. 2016, 11, 3939–3950. [Google Scholar] [CrossRef] [PubMed] [Green Version]
- Pochon, S.; Tardy, I.; Bussat, P.; Bettinger, T.; Brochot, J.; Von Wronski, M.; Passantino, L.; Schneider, M. BR55: A Lipopeptide-Based VEGFR2-Targeted Ultrasound Contrast Agent for Molecular Imaging of Angiogenesis. Investig. Radiol. 2010, 45, 89–95. [Google Scholar] [CrossRef]
- Pysz, M.A.; Foygel, K.; Rosenberg, J.; Gambhir, S.S.; Schneider, M.; Willmann, J.K. Antiangiogenic Cancer Therapy: Monitoring with Molecular US and a Clinically Translatable Contrast Agent (BR55). Radiology 2010, 256, 519–527. [Google Scholar] [CrossRef] [Green Version]
- Stride, E.; Segers, T.; Lajoinie, G.; Cherkaoui, S.; Bettinger, T.; Versluis, M.; Borden, M. Microbubble Agents: New Directions. Ultrasound Med. Biol. 2020, 46, 1326–1343. [Google Scholar] [CrossRef] [PubMed]
- Roovers, S.; Segers, T.; Lajoinie, G.; Deprez, J.; Versluis, M.; De Smedt, S.C.; Lentacker, I. The Role of Ultrasound-Driven Microbubble Dynamics in Drug Delivery: From Microbubble Fundamentals to Clinical Translation. Langmuir 2019, 35, 10173–10191. [Google Scholar] [CrossRef]
- Lee, H.; Kim, H.; Han, H.; Lee, M.; Lee, S.; Yoo, H.; Chang, J.H.; Kim, H. Microbubbles used for contrast enhanced ultrasound and theragnosis: A review of principles to applications. Biomed. Eng. Lett. 2017, 7, 59–69. [Google Scholar] [CrossRef]
- De Leon, A.; Perera, R.; Hernandez, C.; Cooley, M.; Jung, O.; Jeganathan, S.; Abenojar, E.; Fishbein, G.; Sojahrood, A.J.; Emerson, C.C.; et al. Contrast enhanced ultrasound imaging by nature-inspired ultrastable echogenic nanobubbles. Nanoscale 2019, 11, 15647–15658. [Google Scholar] [CrossRef]
- Brady-Kalnay, S.M.; Tonks, N.K. Identification of the homophilic binding site of the receptor protein tyrosine phosphatase PTP mu. J. Biol. Chem. 1994, 269, 28472–28477. [Google Scholar] [CrossRef]
- Aricescu, A.R.; Hon, W.C.; Siebold, C.; Lu, W.; van der Merwe, P.A.; Jones, E.Y. Molecular analysis of receptor protein tyrosine phosphatase mu-mediated cell adhesion. EMBO J. 2006, 25, 701–712. [Google Scholar] [CrossRef] [PubMed] [Green Version]
- Cismasiu, V.B.; Denes, S.A.; Reilander, H.; Michel, H.; Szedlacsek, S.E. The MAM (meprin/A5-protein/PTPmu) domain is a homophilic binding site promoting the lateral dimerization of receptor-like protein-tyrosine phosphatase mu. J. Biol. Chem. 2004, 279, 26922–26931. [Google Scholar] [CrossRef] [Green Version]
- Martin, C.E.; List, K. Cell surface–anchored serine proteases in cancer progression and metastasis. Cancer Metastasis Rev. 2019, 38, 357–387. [Google Scholar] [CrossRef]
- Braun, E.; Sauter, D. Furin-mediated protein processing in infectious diseases and cancer. Clin. Transl. Immunol. 2019, 8, e1073. [Google Scholar] [CrossRef] [Green Version]
- Mitschke, J.; Burk, U.C.; Reinheckel, T. The role of proteases in epithelial-to-mesenchymal cell transitions in cancer. Cancer Metastasis Rev. 2019, 38, 431–444. [Google Scholar] [CrossRef] [PubMed]
- Burden-Gulley, S.M.; Gates, T.J.; Burgoyne, A.M.; Cutter, J.L.; Lodowski, D.T.; Robinson, S.; Sloan, A.E.; Miller, R.H.; Basilion, J.P.; Brady-Kalnay, S.M. A novel molecular diagnostic of glioblastomas: Detection of an extracellular fragment of protein tyrosine phosphatase mu. Neoplasia 2010, 12, 305–316. [Google Scholar] [CrossRef] [Green Version]
- Burgoyne, A.M.; Palomo, J.M.; Phillips-Mason, P.J.; Burden-Gulley, S.M.; Major, D.L.; Zaremba, A.; Robinson, S.; Sloan, A.E.; Vogelbaum, M.A.; Miller, R.H.; et al. PTPmu suppresses glioma cell migration and dispersal. Neuro Oncol. 2009, 11, 767–778. [Google Scholar] [CrossRef] [Green Version]
- Burgoyne, A.M.; Phillips-Mason, P.J.; Burden-Gulley, S.M.; Robinson, S.; Sloan, A.E.; Miller, R.H.; Brady-Kalnay, S.M. Proteolytic cleavage of protein tyrosine phosphatase mu regulates glioblastoma cell migration. Cancer Res. 2009, 69, 6960–6968. [Google Scholar] [CrossRef] [Green Version]
- Johansen, M.L.; Vincent, J.; Gittleman, H.; Craig, S.E.L.; Couce, M.; Sloan, A.E.; Barnholtz-Sloan, J.S.; Brady-Kalnay, S.M. A PTPmu Biomarker is Associated with Increased Survival in Gliomas. Int. J. Mol. Sci. 2019, 20, 2372. [Google Scholar] [CrossRef] [Green Version]
- Burden-Gulley, S.M.; Qutaish, M.Q.; Sullivant, K.E.; Lu, H.; Wang, J.; Craig, S.E.; Basilion, J.P.; Wilson, D.L.; Brady-Kalnay, S.M. Novel Cryo-Imaging of the Glioma Tumor Microenvironment Reveals Migration and Dispersal Pathways in Vivid Three-Dimensional Detail. Cancer Res. 2011, 71, 5932–5940. [Google Scholar] [CrossRef] [PubMed] [Green Version]
- Burden-Gulley, S.M.; Qutaish, M.Q.; Sullivant, K.E.; Tan, M.; Craig, S.E.; Basilion, J.P.; Lu, Z.-R.; Wilson, D.L.; Brady-Kalnay, S.M. Single cell molecular recognition of migrating and invading tumor cells using a targeted fluorescent probe to receptor PTPmu. Int. J. Cancer 2012, 132, 1624–1632. [Google Scholar] [CrossRef] [Green Version]
- Mazzetti, S.; Frigerio, S.; Gelati, M.; Salmaggi, A.; Vitellaro-Zuccarello, L. Lycopersicon esculentum lectin: An effective and versatile endothelial marker of normal and tumoral blood vessels in the central nervous system. Eur. J. Histochem. 2004, 48, 423–428. [Google Scholar] [CrossRef] [Green Version]
- Gearing, A.J.; Hemingway, I.; Pigott, R.; Hughes, J.; Rees, A.J.; Cashman, S.J. Soluble forms of vascular adhesion molecules, E-selectin, ICAM-1, and VCAM-1: Pathological significance. Ann. N. Y. Acad. Sci. 1992, 667, 324–331. [Google Scholar] [CrossRef]
- Banks, R.E.; Gearing, A.J.; Hemingway, I.K.; Norfolk, D.R.; Perren, T.J.; Selby, P.J. Circulating intercellular adhesion molecule-1 (ICAM-1), E-selectin and vascular cell adhesion molecule-1 (VCAM-1) in human malignancies. Br. J. Cancer 1993, 68, 122–124. [Google Scholar] [CrossRef] [Green Version]
- Velikova, G.; Banks, R.E.; Gearing, A.J.H.; Hemingway, I.; Forbes, M.A.; Preston, S.R.; Jones, M.J.K.; Wyatt, J.E.; Miller, K.D.; Ward, U.; et al. Circulating soluble adhesion molecules E-cadherin, E-selectin, intercellular adhesion molecule-1 (ICAM-1) and vascular cell adhesion molecule-1 (VCAM-1) in patients with gastric cancer. Br. J. Cancer 1997, 76, 1398–1404. [Google Scholar] [CrossRef] [PubMed] [Green Version]
- Katayama, M.; Hirai, S.; Kamihagi, K.; Nakagawa, K.; Yasumoto, M.; Kato, I. Soluble E-cadherin fragments increased in circulation of cancer patients. Br. J. Cancer 1994, 69, 580–585. [Google Scholar] [CrossRef] [PubMed] [Green Version]
- De Wever, O.; DeRycke, L.; Hendrix, A.; De Meerleer, G.; Godeau, F.; Depypere, H.; Bracke, M. Soluble cadherins as cancer biomarkers. Clin. Exp. Metastasis 2007, 24, 685–697. [Google Scholar] [CrossRef] [PubMed]
- Bianchi, C.; Sellke, F.W.; Del Vecchio, R.L.; Tonks, N.K.; Neel, B.G. Receptor-type protein-tyrosine phosphatase mu is expressed in specific vascular endothelial beds in vivo. Exp. Cell Res. 1999, 248, 329–338. [Google Scholar] [CrossRef]
- Sui, X.F.; Kiser, T.D.; Hyun, S.W.; Angelini, D.J.; Del Vecchio, R.L.; Young, B.A.; Hasday, J.D.; Romer, L.H.; Passaniti, A.; Tonks, N.K.; et al. Receptor protein tyrosine phosphatase micro regulates the paracellular pathway in human lung microvascular endothelia. Am. J. Pathol. 2005, 166, 1247–1258. [Google Scholar] [CrossRef]
- Koop, E.A.; Lopes, S.M.C.D.S.; Feiken, E.; Bluyssen, H.A.R.; Van Der Valk, M.; Voest, E.E.; Mummery, C.L.; Moolenaar, W.H.; Gebbink, M.F.B.G. Receptor protein tyrosine phosphatase mu expression as a marker for endothelial cell heterogeneity; analysis of RPTPmu gene expression using LacZ knock-in mice. Int. J. Dev. Biol. 2003, 47, 345–354. [Google Scholar]
- Young, B.A.; Sui, X.; Kiser, T.D.; Hyun, S.W.; Wang, P.; Sakarya, S.; Angelini, D.J.; Schaphorst, K.L.; Hasday, J.D.; Cross, A.S.; et al. Protein tyrosine phosphatase activity regulates endothelial cell-cell interactions, the paracellular pathway, and capillary tube stability. Am. J. Physiol. Cell. Mol. Physiol. 2003, 285, L63–L75. [Google Scholar] [CrossRef] [Green Version]
- Shetty, M. Imaging and Differential Diagnosis of Ovarian Cancer. Semin. Ultrasound CT MRI 2019, 40, 302–318. [Google Scholar] [CrossRef]
- Vincent, J.; Craig, S.; Johansen, M.; Narla, J.; Avril, S.; DiFeo, A.; Brady-Kalnay, S. Detection of Tumor-Specific PTPmu in Gynecological Cancer and Patient Derived Xenografts. Diagnostics 2021, 11, 181. [Google Scholar] [CrossRef]
- Johansen, M.L.; Gao, Y.; Hutnick, M.A.; Craig, S.E.L.; Pokorski, J.K.; Flask, C.A.; Brady-Kalnay, S.M. Quantitative Molecular Imaging with a Single Gd-Based Contrast Agent Reveals Specific Tumor Binding and Retention in Vivo. Anal. Chem. 2017, 89, 5932–5939. [Google Scholar] [CrossRef] [PubMed]
- Hernandez, C.; Abenojar, E.C.; Hadley, J.; De Leon, A.C.; Coyne, R.; Perera, R.; Gopalakrishnan, R.; Basilion, J.P.; Kolios, M.C.; Exner, A.A. Sink or float? Characterization of shell-stabilized bulk nanobubbles using a resonant mass measurement technique. Nanoscale 2019, 11, 851–855. [Google Scholar] [CrossRef] [PubMed] [Green Version]
- Wu, H.; Abenojar, E.C.; Perera, R.; De Leon, A.C.; An, T.; Exner, A.A. Time-intensity-curve Analysis and Tumor Extravasation of Nanobubble Ultrasound Contrast Agents. Ultrasound Med. Biol. 2019, 45, 2502–2514. [Google Scholar] [CrossRef] [PubMed]
- Quaia, E.; Sozzi, M.; Angileri, R.; Gennari, A.G.; Cova, M.A. Time-Intensity Curves Obtained after Microbubble Injection Can Be Used to Differentiate Responders from Nonresponders among Patients with Clinically Active Crohn Disease after 6 Weeks of Pharmacologic Treatment. Radiology 2016, 281, 606–616. [Google Scholar] [CrossRef]


| Scrambled Mean (± SE) | PTPµ-Targeted Mean (± SE) | p-Value | |
|---|---|---|---|
| Tumor | |||
| AUC (dB·min) | 181.8 (24.6) | 260.1 (23.1) | 0.04 * |
| AUCwash-in (dB·min) | 29.4 (6.4) | 51.6 (6.8) | 0.04 * |
| AUCwash-out (dB·min) | 152.4 (22.8) | 208.5 (22.6) | 0.11 |
| Peak intensity (dB) | 15.2 (1.5) | 18.8 (1.6) | 0.13 |
| Peak time (tmax) (min) | 3.9 (0.7) | 5.2 (0.7) | 0.23 |
| Time to reach 50% of peak (t50%) (min) | 12.3 (1.5) | 15.1 (2.7) | 0.40 |
| Wash-out rate (ΔdB/min) | −1.0 (0.3) | −1.1 (0.2) | 0.84 |
| Kidney | |||
| AUC (dB·min) | 241.6 (31.6) | 268.9 (11.8) | 0.41 |
| AUCwash-in (dB·min) | 69.6 (32.3) | 26.8 (5.9) | 0.19 |
| AUCwash-out (dB·min) | 172.0 (28.3) | 242.1 (11.9) | 0.03 * |
| Peak intensity (dB) | 15.5 (1.1) | 18.2 (0.6) | 0.04 * |
| Peak time (min) | 7.4 (2.9) | 2.9 (0.5) | 0.13 |
| Time to reach 50% of peak (t50%) (min) | 17.8 (3.2) | 16.5 (1.4) | 0.69 |
| Wash-out rate (ΔdB/min) | −0.6 (0.1) | −0.5 (0.1) | 0.44 |
Publisher’s Note: MDPI stays neutral with regard to jurisdictional claims in published maps and institutional affiliations. |
© 2021 by the authors. Licensee MDPI, Basel, Switzerland. This article is an open access article distributed under the terms and conditions of the Creative Commons Attribution (CC BY) license (http://creativecommons.org/licenses/by/4.0/).
Share and Cite
Johansen, M.L.; Perera, R.; Abenojar, E.; Wang, X.; Vincent, J.; Exner, A.A.; Brady-Kalnay, S.M. Ultrasound-Based Molecular Imaging of Tumors with PTPmu Biomarker-Targeted Nanobubble Contrast Agents. Int. J. Mol. Sci. 2021, 22, 1983. https://0-doi-org.brum.beds.ac.uk/10.3390/ijms22041983
Johansen ML, Perera R, Abenojar E, Wang X, Vincent J, Exner AA, Brady-Kalnay SM. Ultrasound-Based Molecular Imaging of Tumors with PTPmu Biomarker-Targeted Nanobubble Contrast Agents. International Journal of Molecular Sciences. 2021; 22(4):1983. https://0-doi-org.brum.beds.ac.uk/10.3390/ijms22041983
Chicago/Turabian StyleJohansen, Mette L., Reshani Perera, Eric Abenojar, Xinning Wang, Jason Vincent, Agata A. Exner, and Susann M. Brady-Kalnay. 2021. "Ultrasound-Based Molecular Imaging of Tumors with PTPmu Biomarker-Targeted Nanobubble Contrast Agents" International Journal of Molecular Sciences 22, no. 4: 1983. https://0-doi-org.brum.beds.ac.uk/10.3390/ijms22041983