
Rainbow Trout (Oncorhynchus mykiss) Na+/H+ Exchangers tNhe3a and tNhe3b Display Unique Inhibitory Profiles Dissimilar from Mammalian NHE Isoforms

 , ,
, ,  and
and 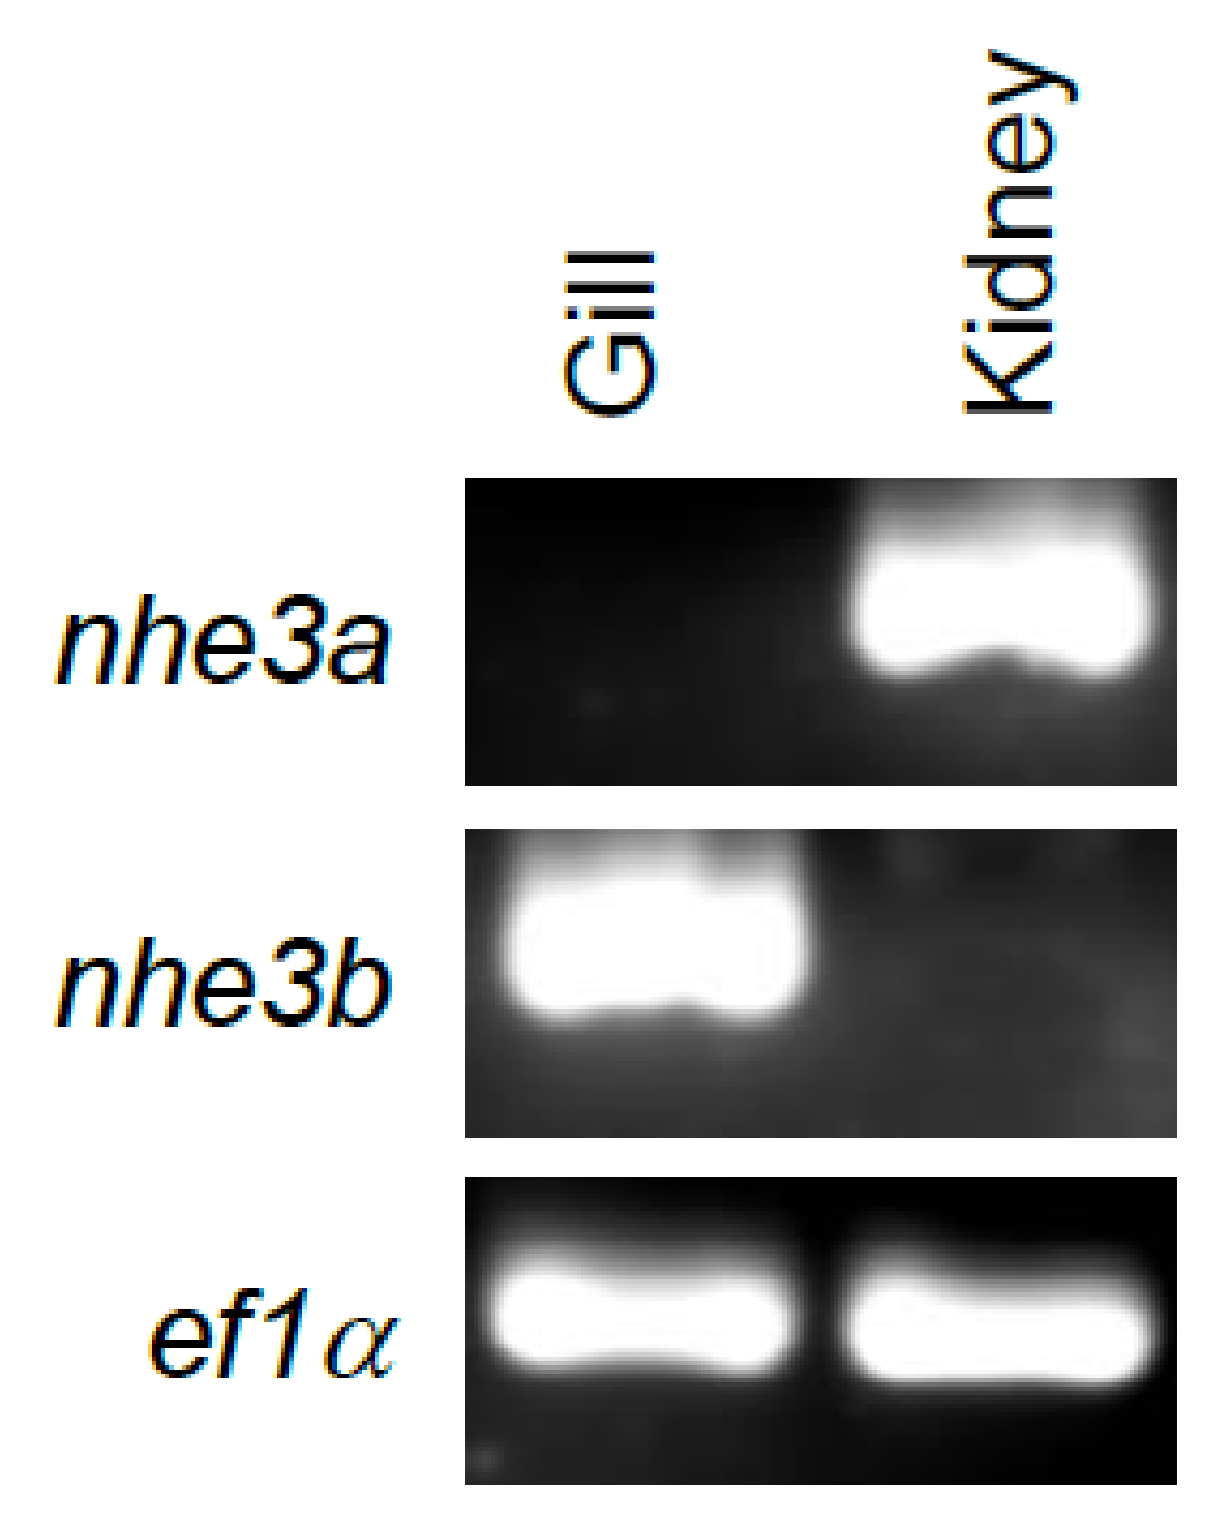
Abstract
:1. Introduction
2. Results
2.1. Cloning and Analysis of Nhe3a and Nhe3b
2.2. Tissue Gene Expression
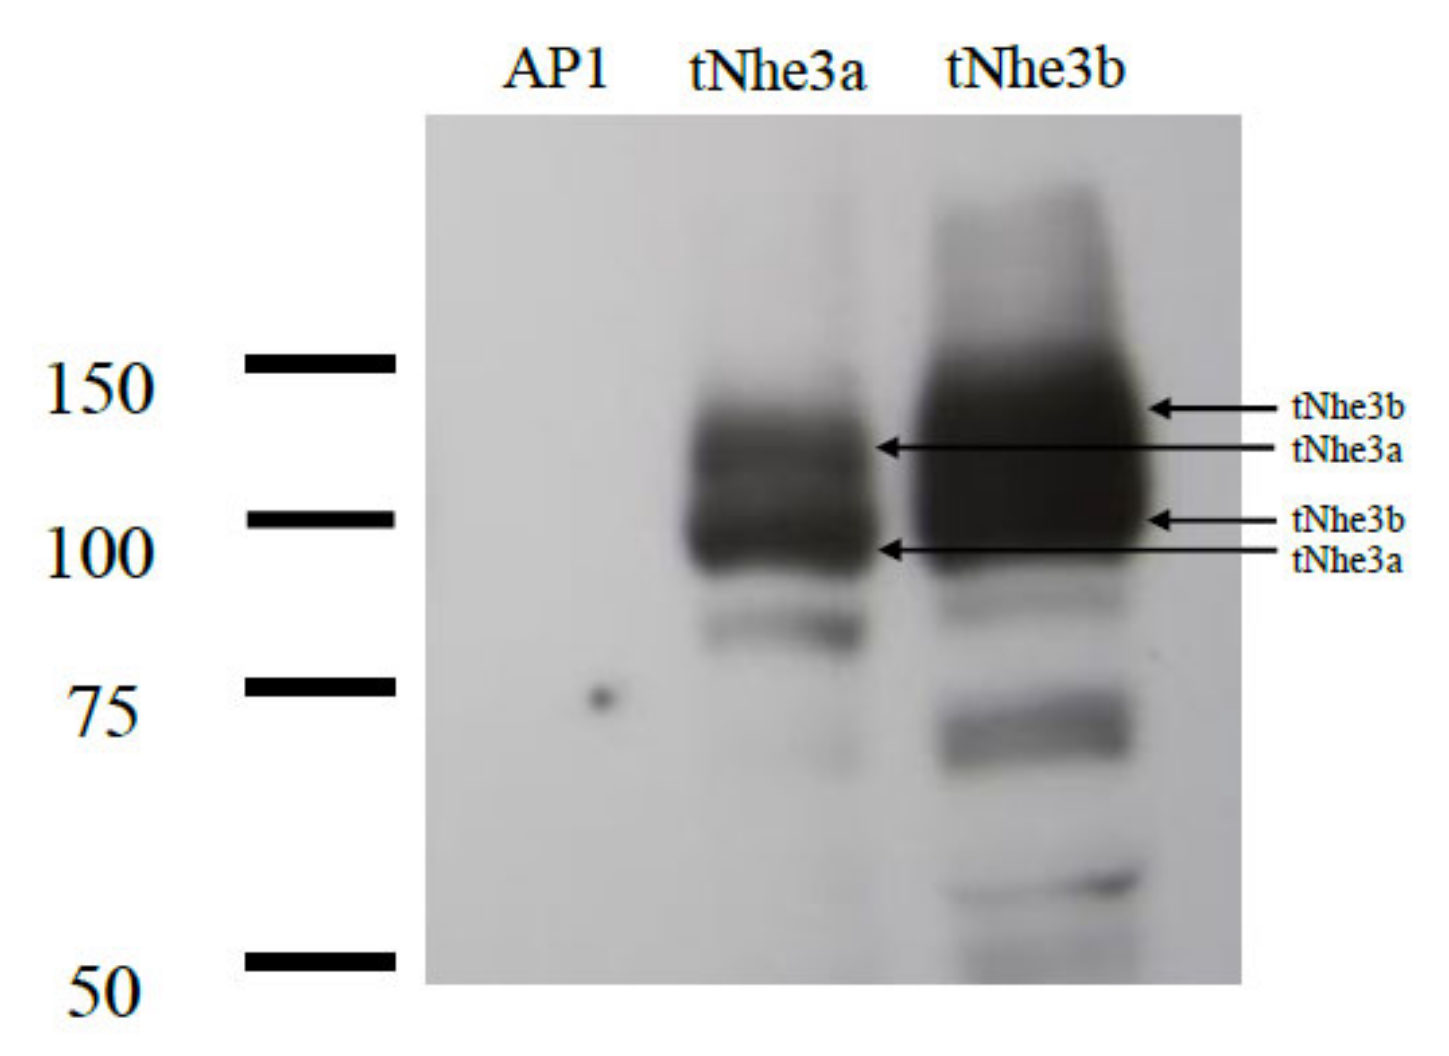
2.3. Transfection and Protein Expression
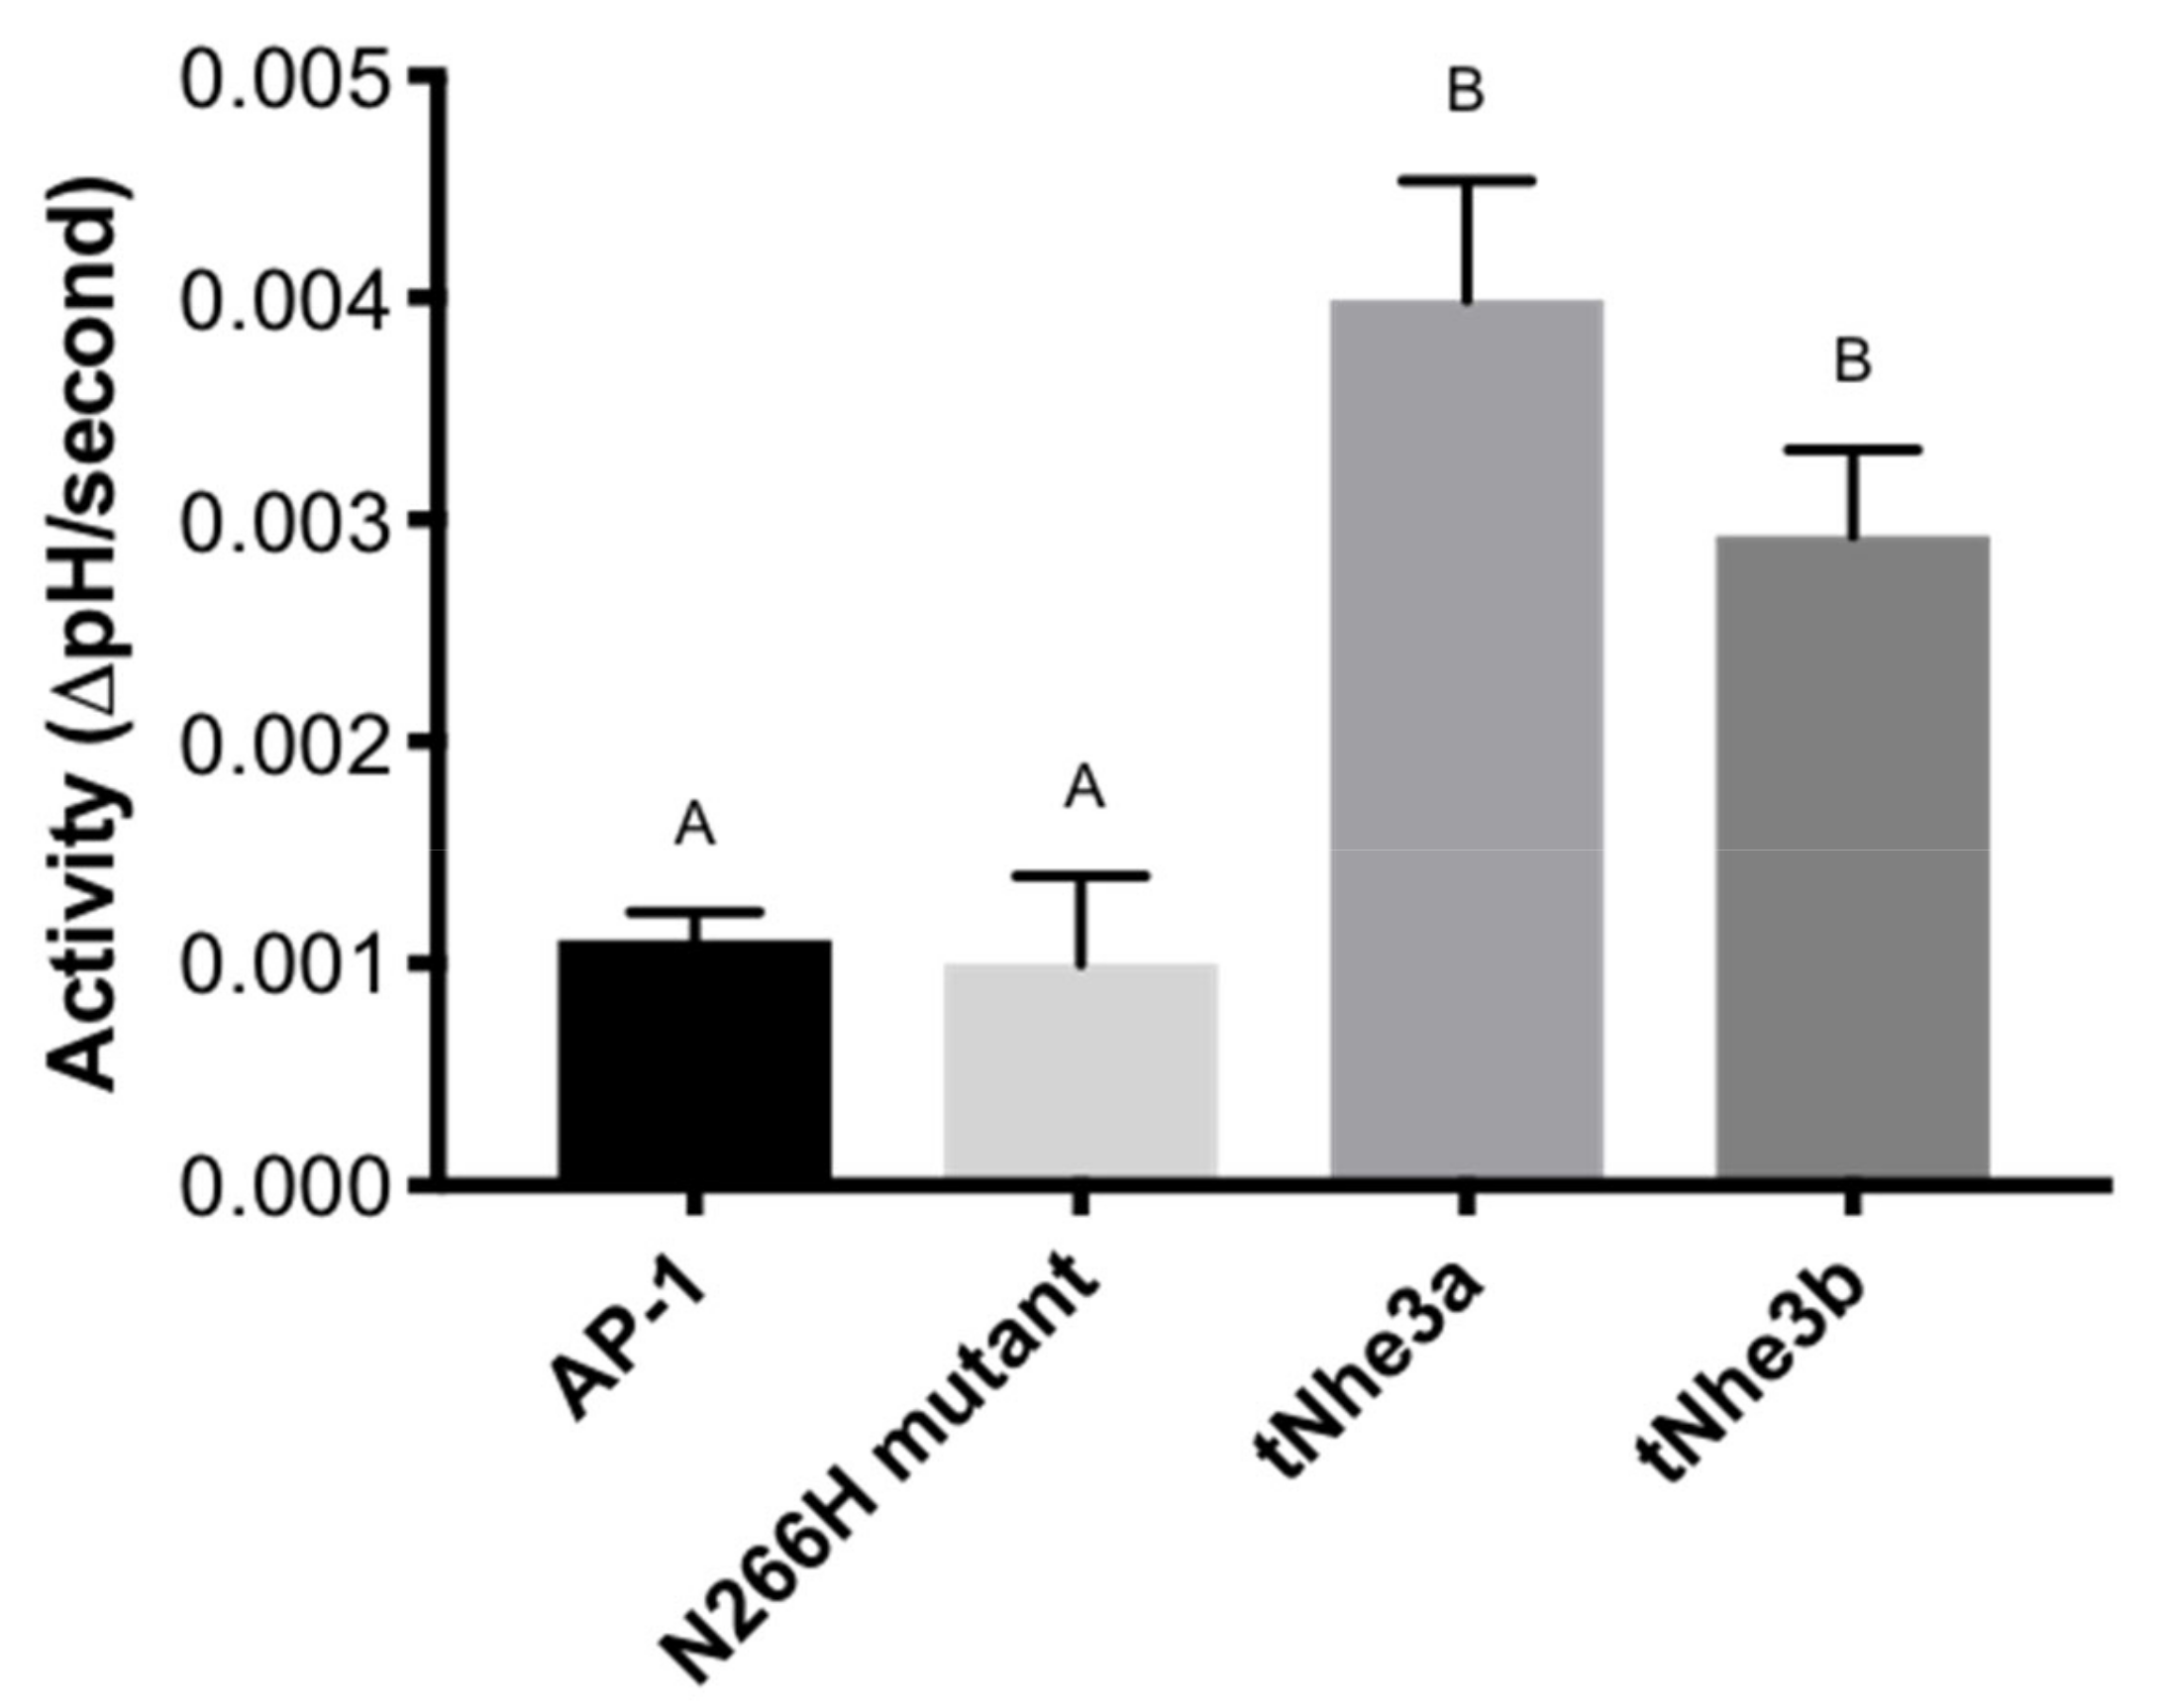
2.4. tNHE Activity
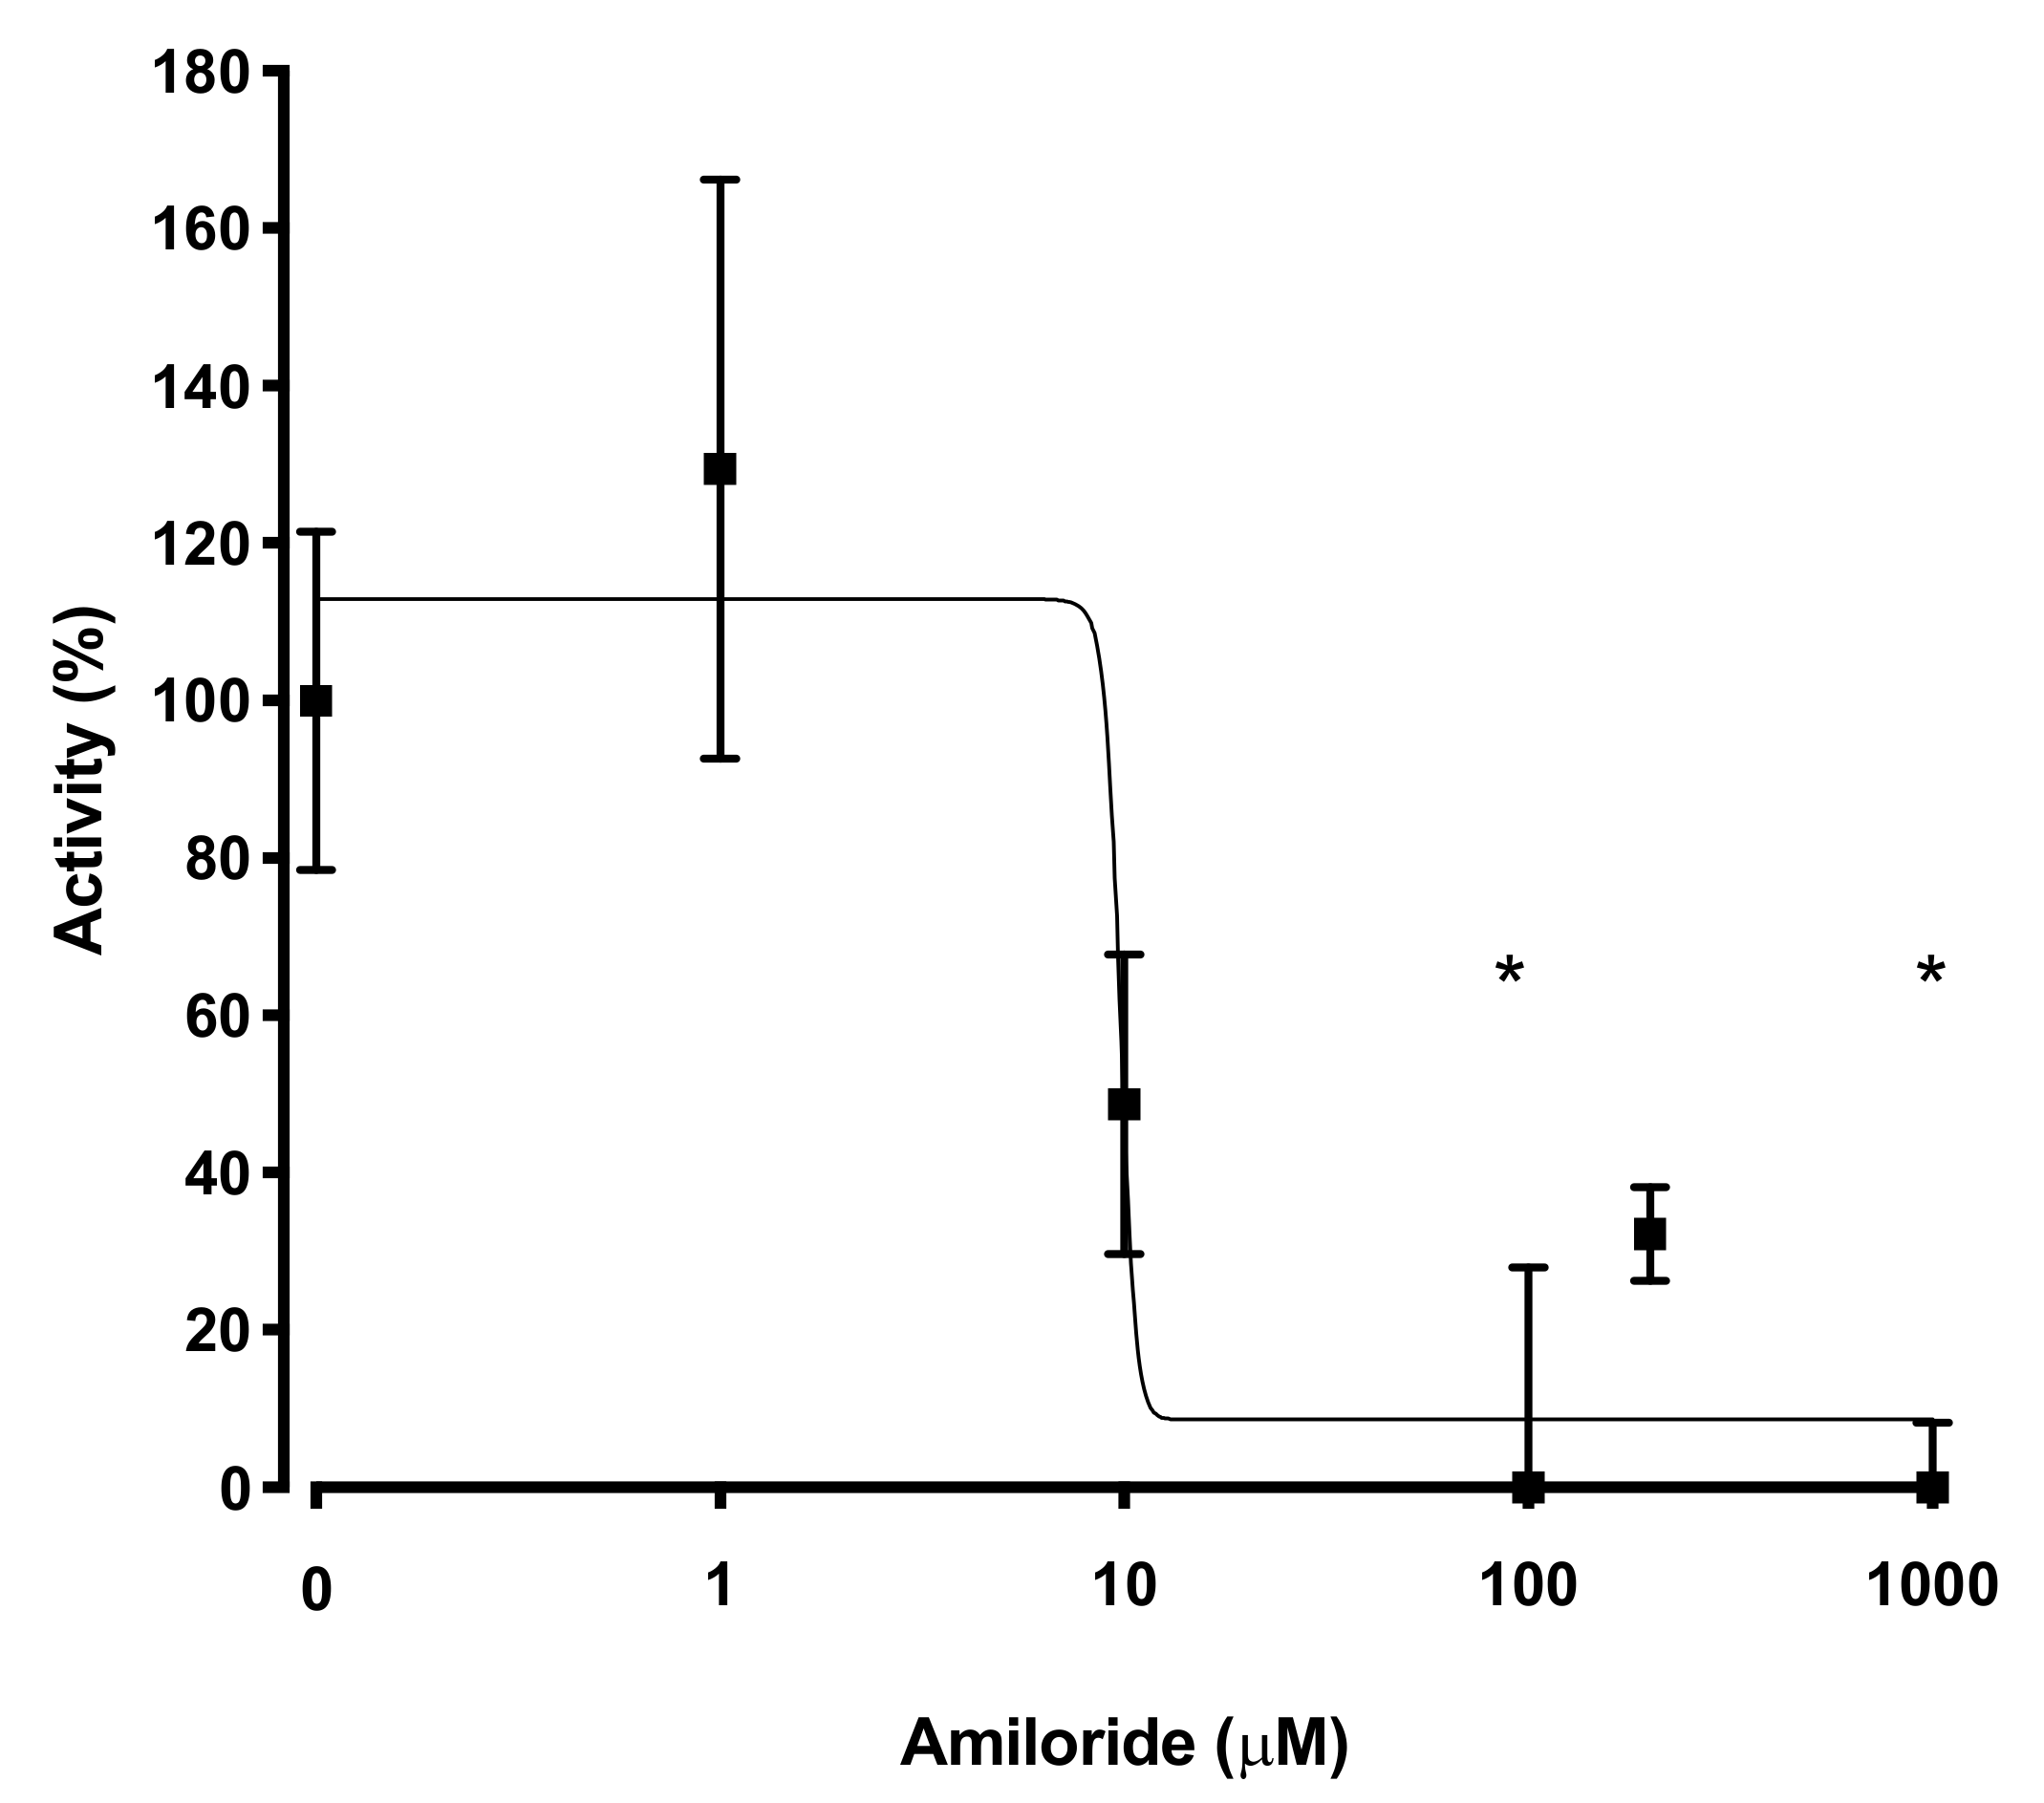
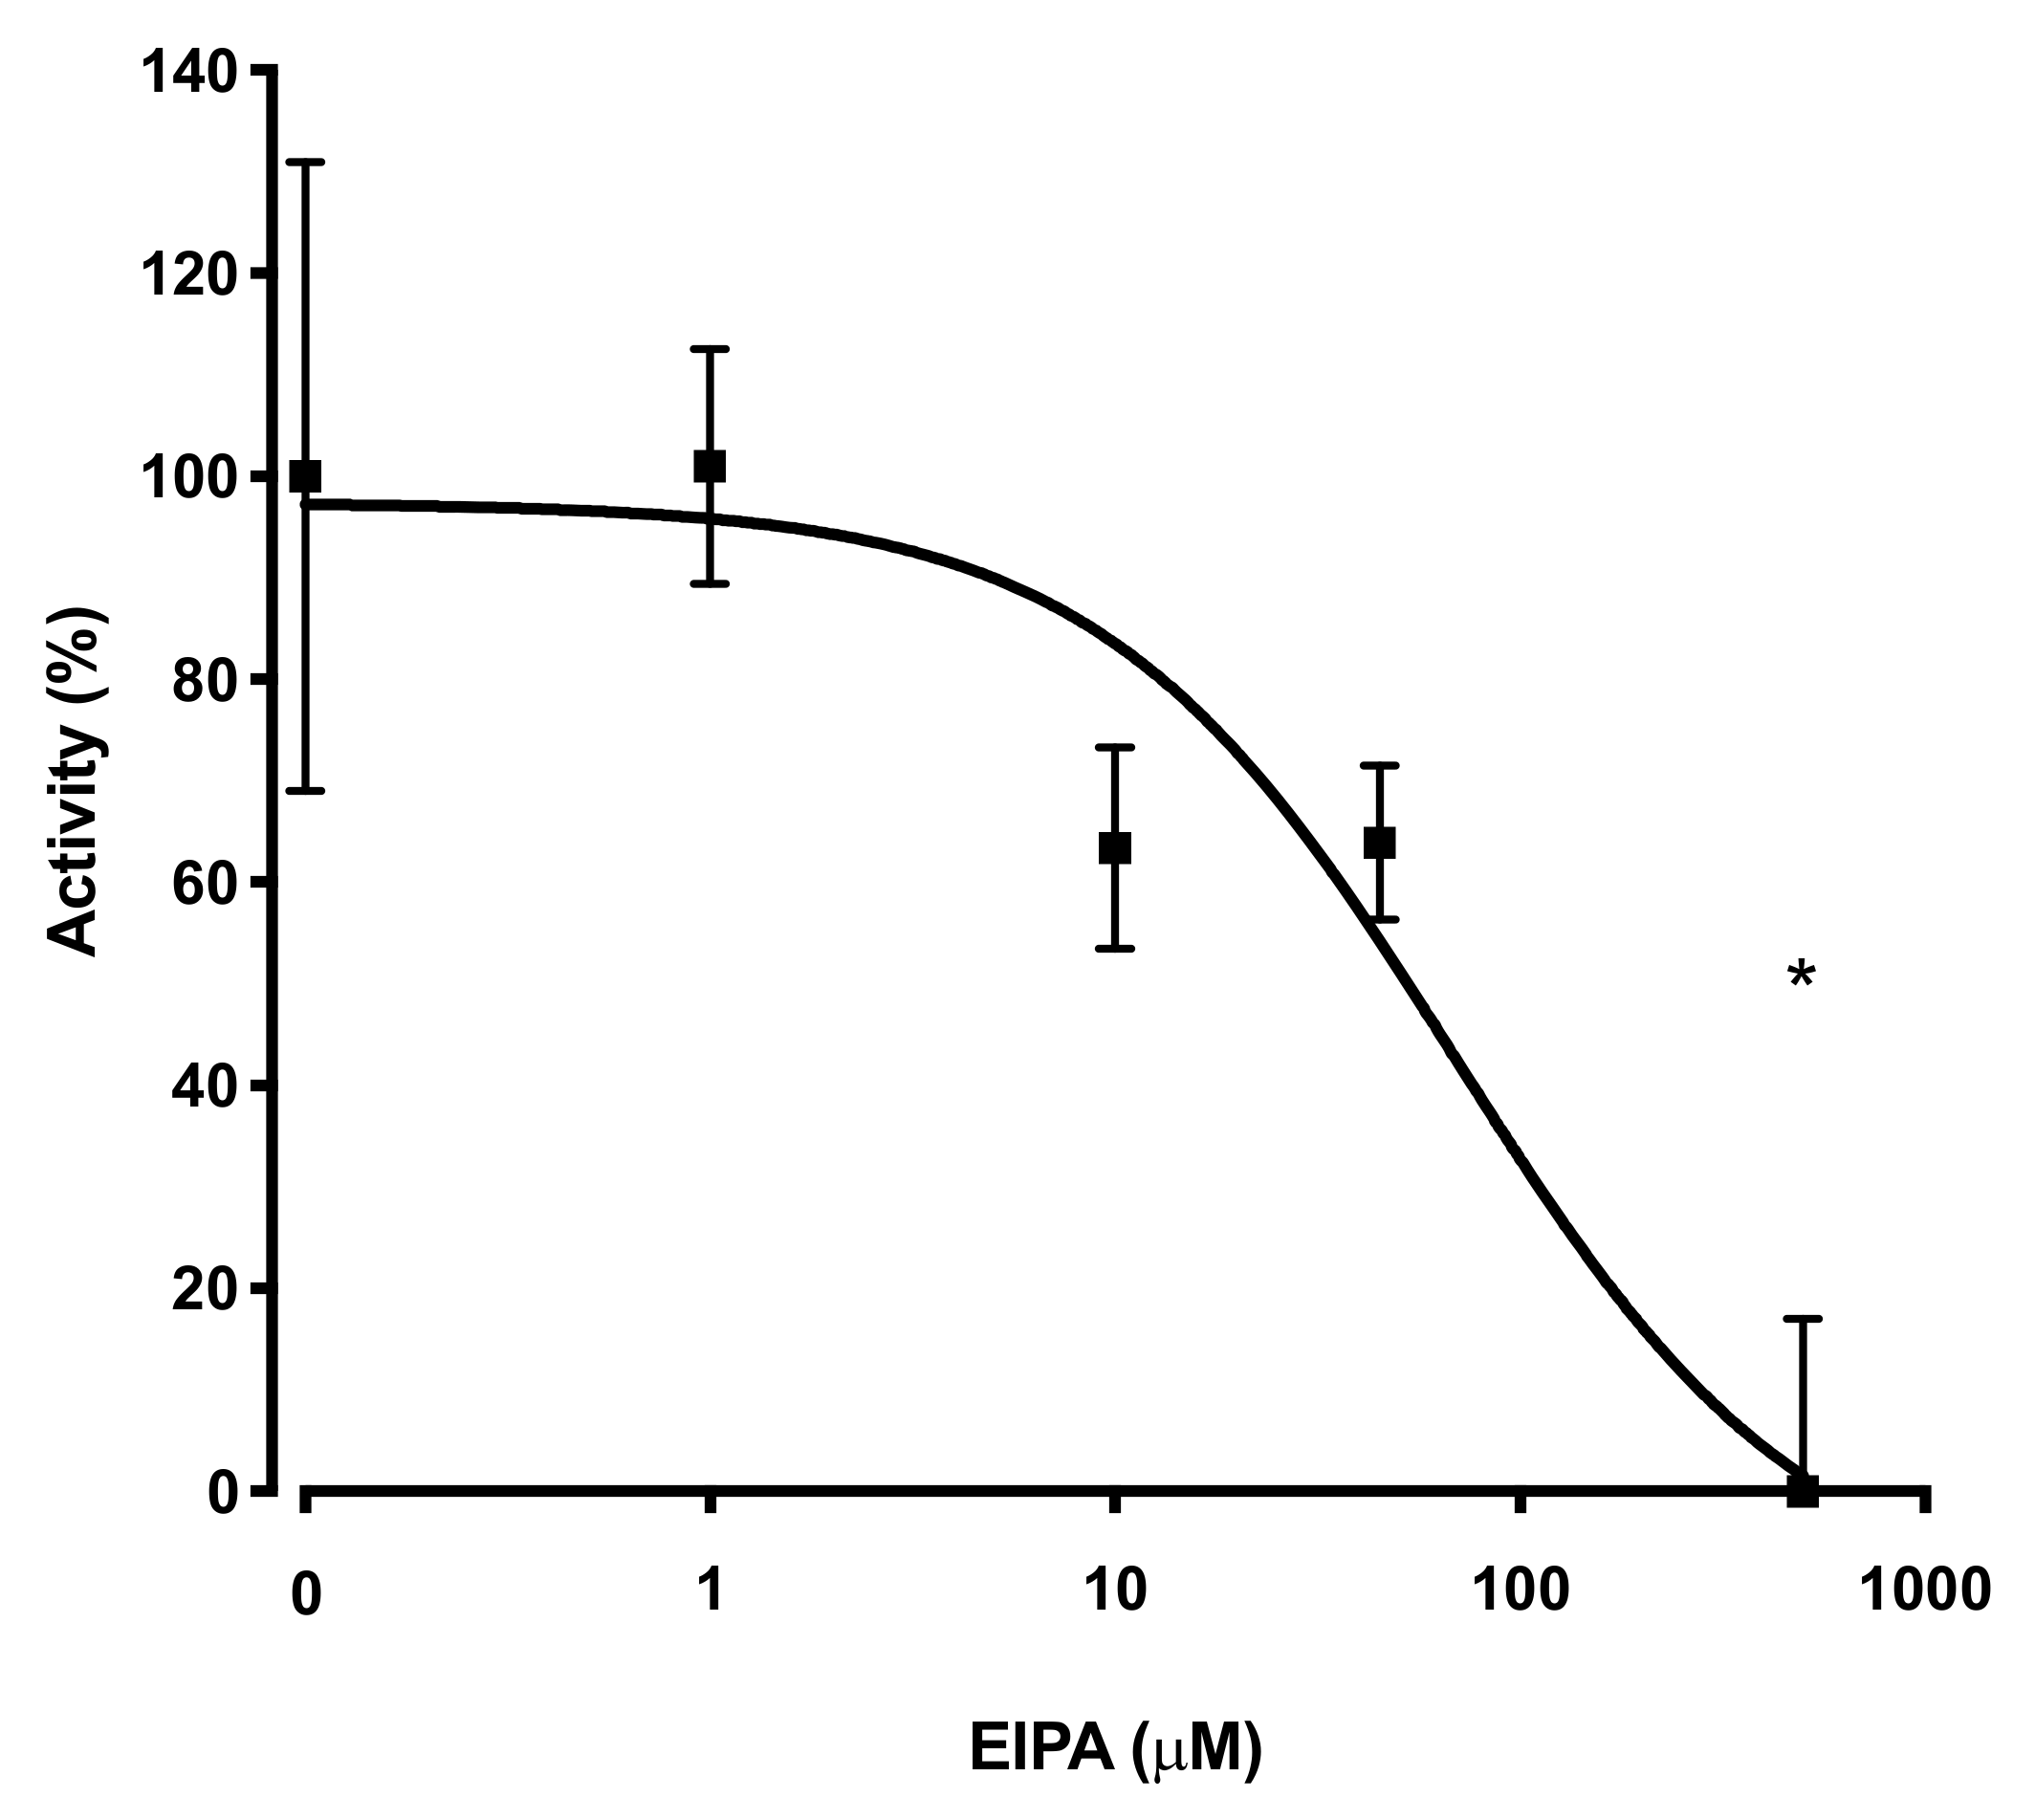
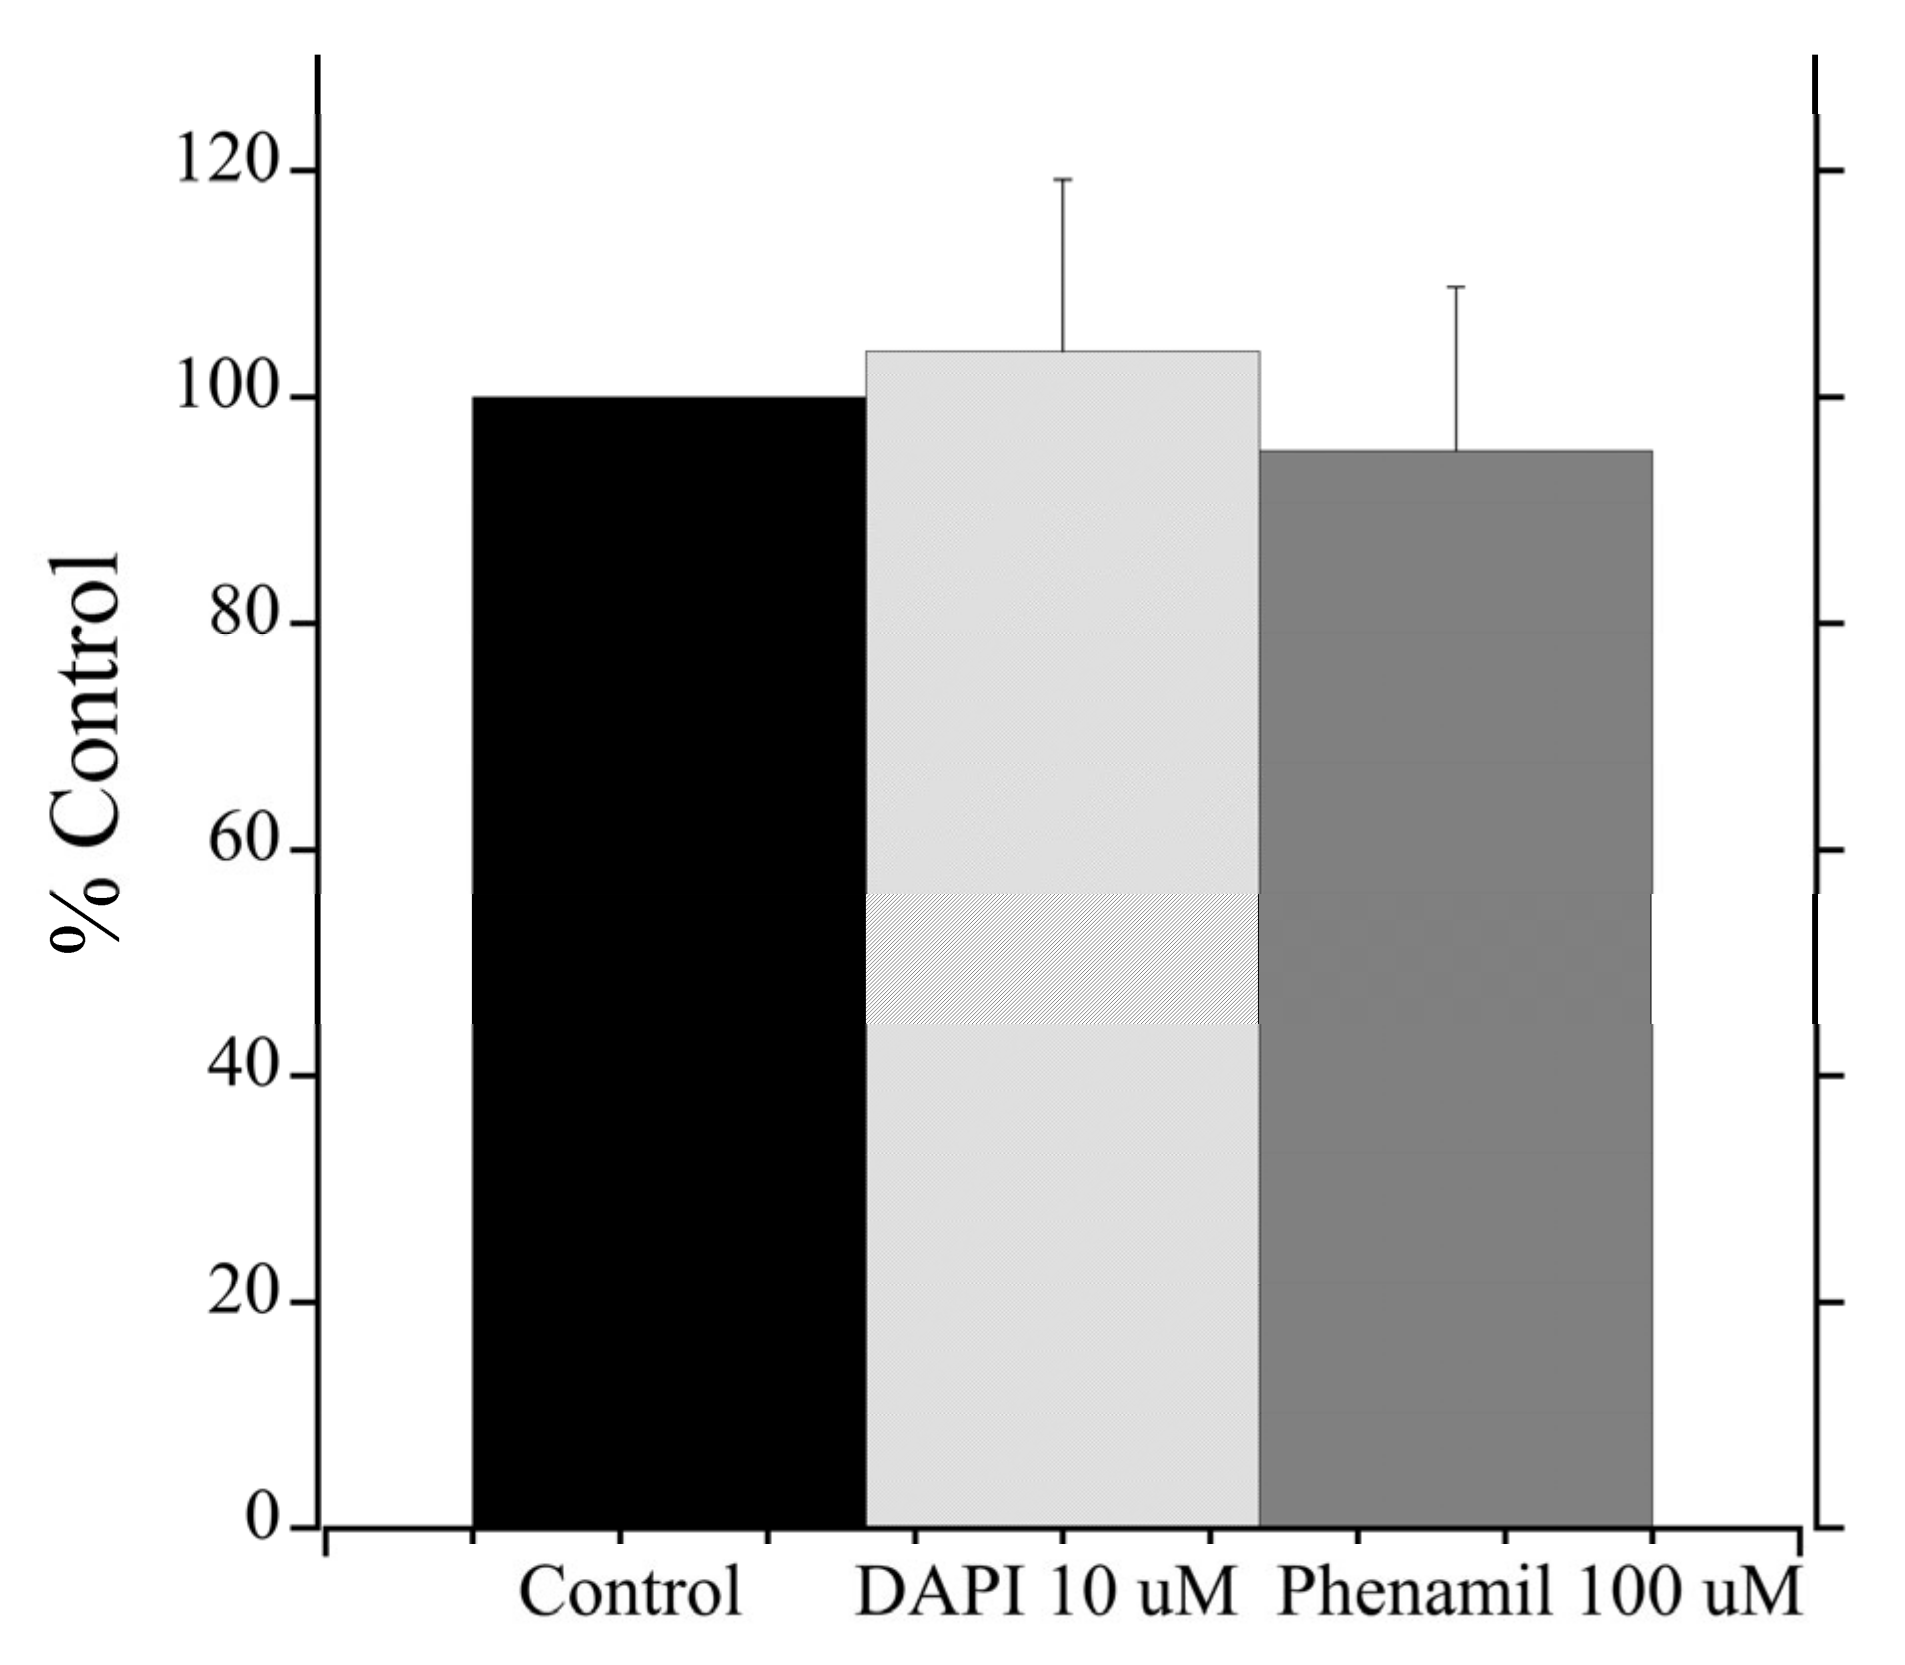
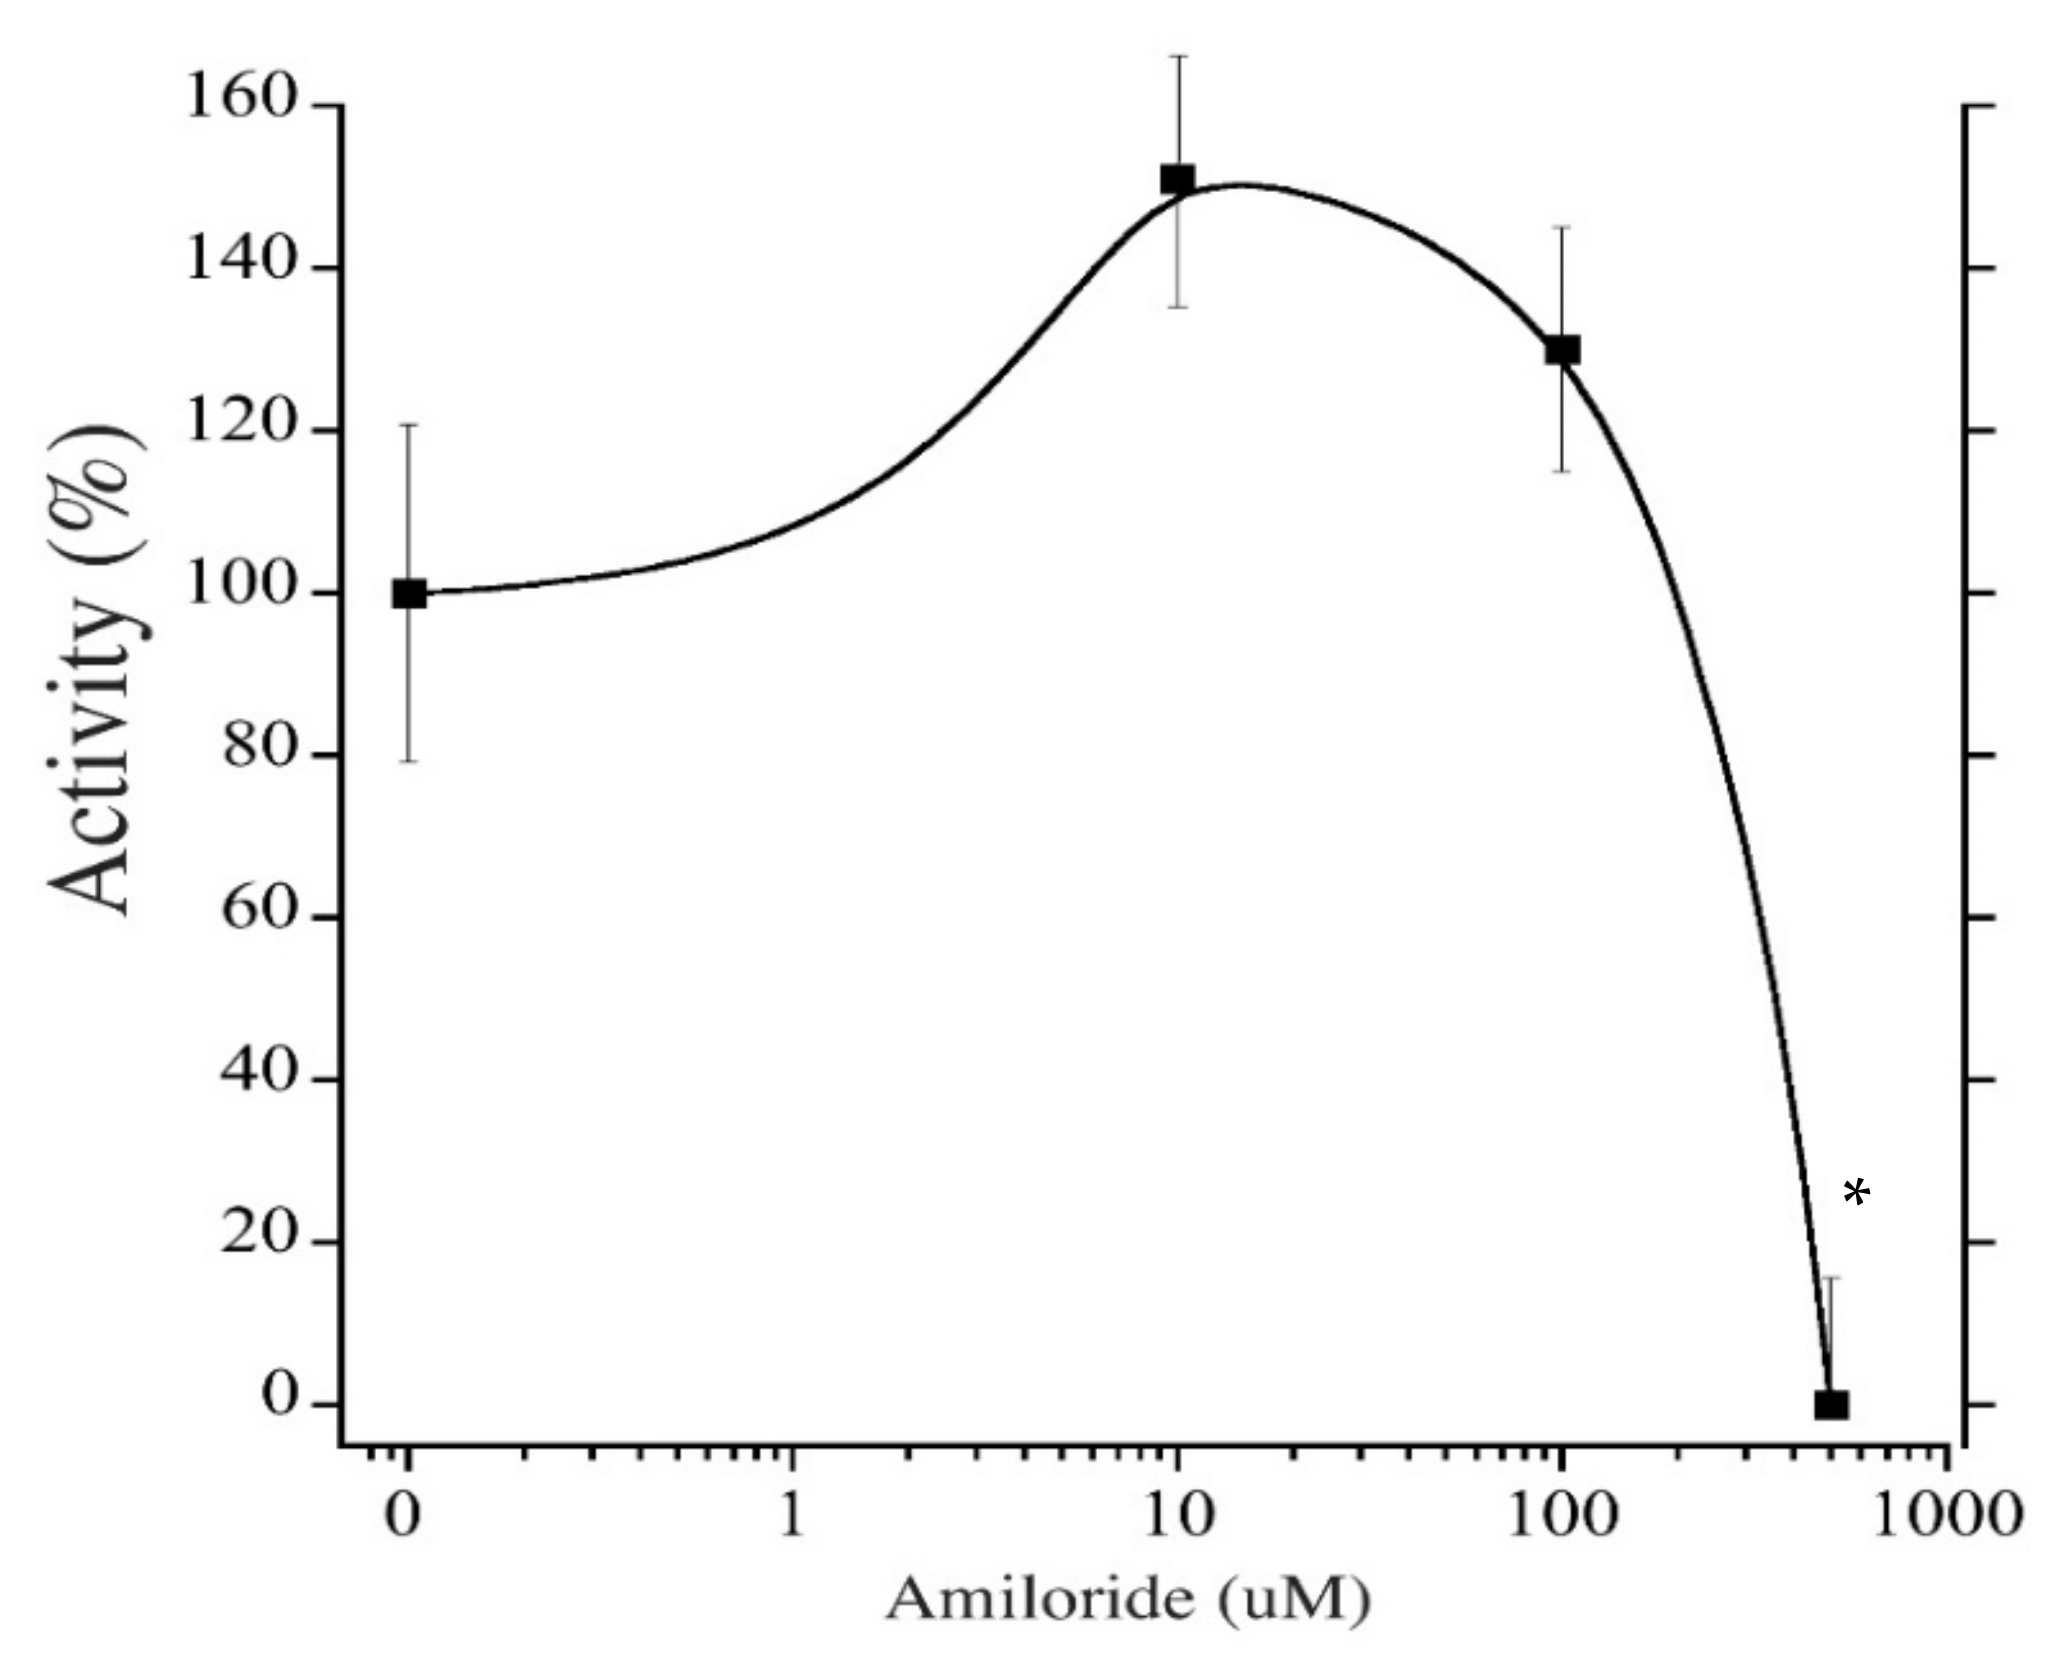
2.5. Pharmacological Inhibition
3. Methods
3.1. Animals
3.2. RNA Isolation, cDNA Synthesis, and PCR
3.3. Cloning
3.4. Cell Culture and Stable Transfection
3.5. SDS-PAGE and Immunoblotting
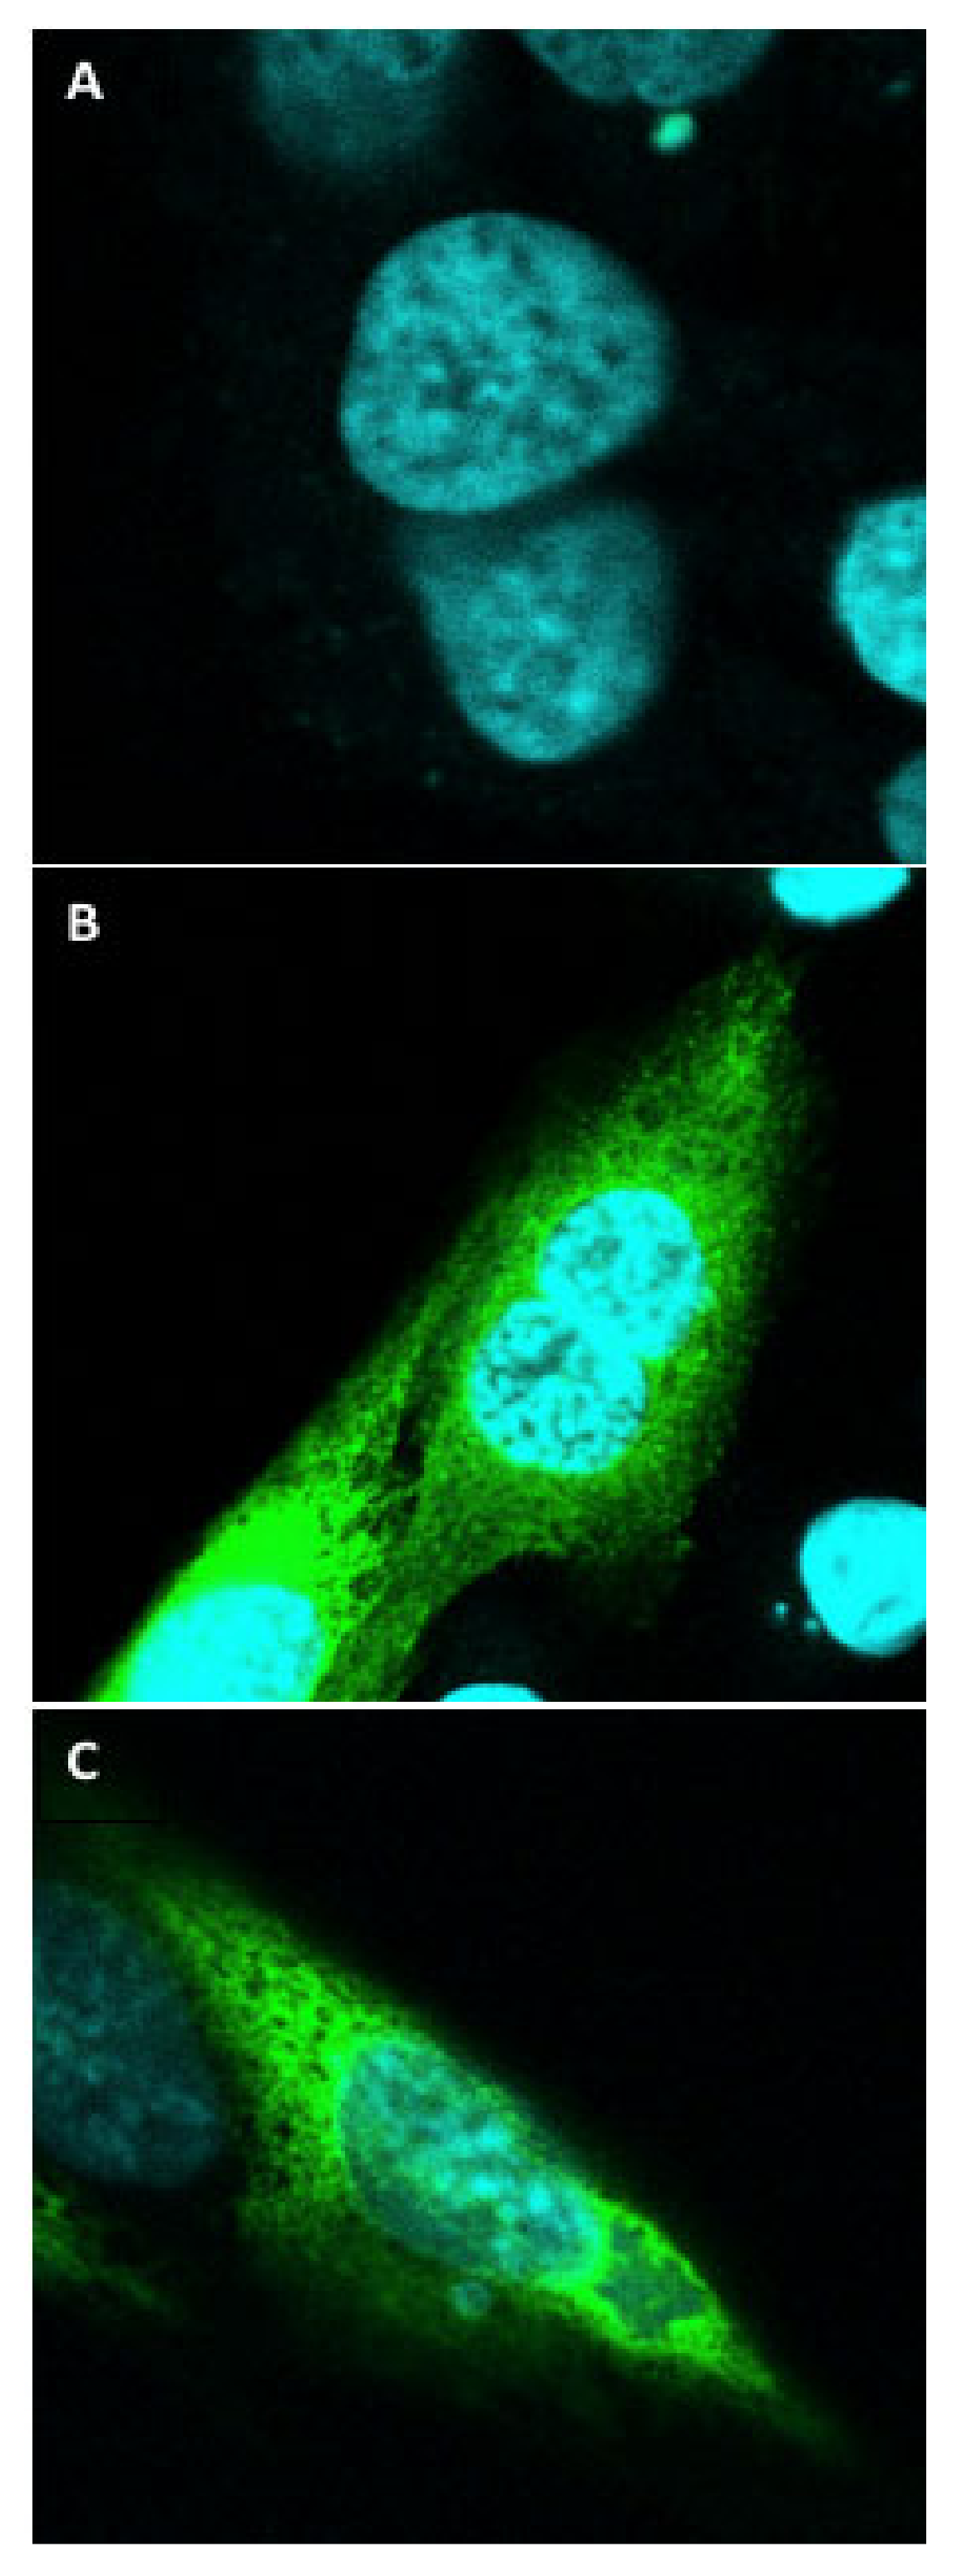
3.6. Immunocytochemistry
3.7. Intracellular pH Measurement (Na+/H+ Exchange Activity)
4. Discussion
Supplementary Materials
Author Contributions
Funding
Institutional Review Board Statement
Informed Consent Statement
Data Availability Statement
Acknowledgments
Conflicts of Interest
References
- Orlowski, J.; Grinstein, S. Diversity the mammalian sodium/proton exchanger, SLC9 gene family. Arch. Eur. J. Physiol. 2004, 447, 549–565. [Google Scholar] [CrossRef]
- Counillon, L.; Pouysségur, J. The expanding family eucaryotic, Na+/H+ exchangers. J. Biol. Chem. 2000, 275, 1–4. [Google Scholar] [CrossRef] [PubMed] [Green Version]
- Grinstein, S.; Clarke, C.A.; Rothstein, A. Activation Na+/H+ exchange in lymphocytes by osmotically induced volume changes and by cytoplasmic acidification. J. Gen. Physiol. 1983, 82, 619–638. [Google Scholar] [CrossRef] [Green Version]
- Harris, C.; Fliegel, L. Amiloride and the, Na+/H+ exchanger protein. Mechanism and significance inhibition the, Na+/H+ exchanger. Int. J. Mol. Med. 1999, 3, 315–336. [Google Scholar] [CrossRef]
- Slepkov, E.R.; Rainey, J.K.; Sykes, B.D.; Fliegel, L. Structural and functional analysis the Na+/H+ exchanger. Biochem. J. 2007, 401, 623. [Google Scholar] [CrossRef] [PubMed] [Green Version]
- Lee, B.L.; Li, X.; Liu, Y.; Sykes, B.D.; Fliegel, L. Structural and functional analysis transmembrane, X.I. the, N.H.E1 isoform the Na+/H+ exchanger. J. Biol. Chem. 2009, 284, 11546–11556. [Google Scholar] [CrossRef] [PubMed] [Green Version]
- Fuster, D.G.; Alexander, R.T. Traditional and emerging roles for the, SLC9 Na+/H+ exchangers. Arch. Eur. J. Physiol. 2014, 466, 61–76. [Google Scholar] [CrossRef] [Green Version]
- Evans, D.H.; Piermarini, P.M.; Choe, K.P. The multifunctional fish gill: Dominant site gas exchange, osmoregulation, acid-base regulation, and excretion Nnitrogenous waste. Physiol. Rev. 2005, 85, 97–177. [Google Scholar] [CrossRef]
- Kumai, Y.; Perry, S.F. Ammonia excretion via, Rhcg1 facilitates, Na+ uptake in larval zebrafish, Danio rerio, in acidic water. AJP Regul. Integr. Comp. Physiol. 2011, 301, R1517–R1528. [Google Scholar] [CrossRef] [PubMed]
- Dymowska, A.K.; Hwang, P.-P.; Goss, G.G. Structure and function ionocytes in the freshwater fish gill. Respiratory Physiol. Neurobiol. 2012, 184, 282–292. [Google Scholar] [CrossRef]
- Evans, D.H. Teleost fish osmoregulation: What have we learned since, August, Krogh, Homer, Smith, and, Ancel, Keys. Ajp Regul. Integr. Comp. Physiol. 2008, 295, R704–R713. [Google Scholar] [CrossRef] [PubMed] [Green Version]
- Hsu, H.-H.; Lin, L.-Y.; Tseng, Y.-C.; Horng, J.-L.; Hwang, P.-P. A new model for fish ion regulation: Identification ionocytes in freshwater- and seawater-acclimated medaka (Oryzias latipes). Cell Tissue Res. 2014, 357, 225–243. [Google Scholar] [CrossRef]
- Guh, Y.-J.; Lin, C.-H.; Hwang, P.-P. Osmoregulation in zebrafish: Ion transport mechanisms and functional regulation. EXCLI J. 2015, 14, 627. [Google Scholar] [CrossRef] [PubMed]
- Edwards, S.L.; Tse, C.M.; Toop, T. Immunolocalisation N.H.E3-like immunoreactivity in the gills the rainbow trout (Oncorhynchus mykiss) and the blue-throated wrasse (Pseudolabrus tetrious). J. Anat. 1999, 195, 465–469. [Google Scholar] [CrossRef]
- Edwards, S.L.; Wall, B.P.; Morrison-Shetlar, A.; Sligh, S.; Weakley, J.C.; Claiborne, J.B. The effect environmental hypercapnia and salinity on the expression NHE-like isoforms in the gills a euryhaline fish (Fundulus heteroclitus). J. Exp. Zool. Part A Comp. Exp. Biol. 2005, 303, 464–475. [Google Scholar] [CrossRef]
- Hirata, T.; Kaneko, T.; Ono, T.; Nakazato, T.; Furukawa, N.; Hasegawa, S.; Wakabayashi, S.; Shigekawa, M.; Chang, M.-H.; Romero, M.F.; et al. Mechanism acid adaptation a fish living in a pH 3.5 lake. Am. J. Physiol. Regul. Integr. Comp. Physiol. 2003, 284, R1199–R1212. [Google Scholar] [CrossRef] [Green Version]
- Ivanis, G.; Braun, M.; Perry, S.F. Renal expression and localization SLC9A3 sodium/hydrogen exchanger and its possible role in acid-base regulation in freshwater rainbow trout (Oncorhynchus mykiss). AJP Regul. Integr. Comp. Physiol. 2008, 295, R971–R978. [Google Scholar] [CrossRef] [PubMed] [Green Version]
- Ivanis, G.; Esbaugh, A.J.; Perry, S.F. Branchial expression and localization SLC9A2 and, SLC9A3 sodium/hydrogen exchangers and their possible role in acid-base regulation in freshwater rainbow trout (Oncorhynchus mykiss). J. Exp. Biol. 2008, 211, 2467–2477. [Google Scholar] [CrossRef] [Green Version]
- Inokuchi, M.; Hiroi, J.; Watanabe, S.; Hwang, P.-P.; Kaneko, T. Morphological and functional classification ion-absorbing mitochondria-rich cells in the gills Mozambique tilapia. J. Exp. Biol. 2009, 212, 1003–1010. [Google Scholar] [CrossRef] [Green Version]
- Boyle, D.; Blair, S.D.; Chamot, D.; Goss, G.G. Characterization developmental, Na+ uptake in rainbow trout larvae supports a significant role for, Nhe3b. Comp. Biochem. Physiol. Part A Mol. Integr. Physiol. 2016, 201, 30–36. [Google Scholar] [CrossRef]
- Hiroi, J.; McCormick, S.D. New insights into gill ionocyte and ion transporter function in euryhaline and diadromous fish. Respir. Physiol. Neurobiol. 2012, 184, 257–268. [Google Scholar] [CrossRef] [PubMed]
- Wright, P.A.; Wood, C.M. A new paradigm for ammonia excretion in aquatic animals: Role Rhesus (Rh) glycoproteins. J. Exp. Biol. 2009, 212, 2303–2312. [Google Scholar] [CrossRef] [PubMed] [Green Version]
- Takei, Y.; Hiroi, J.; Takahashi, H.; Sakamoto, T. Diverse mechanisms for body fluid regulation in teleost fishes. Ajp Regul. Integr. Comp. Physiol. 2014, 307, R778–R792. [Google Scholar] [CrossRef] [PubMed] [Green Version]
- Eigler, J.; Kelter, J.; Renner, E. Wirkungscharakteristika eines neuen, Aeylguanidins—Amiloride-HCL (MK 870)—An der isolierten, Haut von, Amphibien. Klin. Wochenschr. 1967, 45, 737–738. [Google Scholar] [CrossRef]
- Kirschner, L.B.; Greenwald, L.; Kerstetter, T.H. Effect amiloride on sodium transport across body surfaces freshwater animals. Am. J. Physiol. Content 1973, 224, 832–837. [Google Scholar] [CrossRef]
- Kleyman, T.R.; Cragoe, E.J. Amiloride and its analogs as tools in the study ion transport. J. Membr. Biol. 1988, 105, 1–21. [Google Scholar] [CrossRef]
- Sardet, C.; Franchi, A.; Pouysségur, J. Molecular cloning, primary structure, and expression the human growth factor-activatable, Na+ H+ antiporter. Cell 1989, 56, 271–280. [Google Scholar] [CrossRef]
- Guffey, S.C.; Fliegel, L.; Goss, G.G. Cloning and characterization Na+/H+ Exchanger isoforms, NHE2 and, NHE3 from the gill Pacific dogfish, Squalus suckleyi. Comp. Biochem. Physiol. Part B Biochem. Mol. Biol. 2015, 188, 46–53. [Google Scholar] [CrossRef]
- Masereel, B. An overview inhibitors Na+/H+ exchanger. Eur. J. Med. Chem. 2003, 38, 547–554. [Google Scholar] [CrossRef]
- Wright, P.A.; Wood, C.M. An analysis branchial ammonia excretion in the freshwater rainbow trout: Effects environmental pH change and sodium uptake blockade. J. Exp. Biol. 1985, 114, 329–353. [Google Scholar]
- Avella, M.; Bornancin, M. A new analysis ammonia and sodium transport through the gills the freshwater rainbow trout (Salmo gairdneri). J. Exp. Biol. 1989, 142, 155–175. [Google Scholar]
- Lin, H.; Randall, D. Evidence for the presence an electrogenic proton pump on the trout gill epithelium. J. Exp. Biol. 1991, 161, 119–134. [Google Scholar]
- Lin, H.; Randall, D. 9 Proton pumps in fish gills. Fish Physiol. 1995, 14, 229–255. [Google Scholar] [CrossRef]
- Fenwick, J.C.; Bonga, S.W.; Flik, G. In vivo bafilomycin-sensitive, Na(+) uptake in young freshwater fish. J. Exp. Biol. 1999, 202, 3659–3666. [Google Scholar]
- Claiborne, J.B.; Edwards, S.L.; Morrison-Shetlar, A.I. Acid-base regulation in fishes: Cellular and molecular mechanisms. J. Exp. Zool. 2002, 293, 302–319. [Google Scholar] [CrossRef]
- Hwang, P.-P.; Lee, T.-H.; Lin, L.-Y. Ion regulation in fish gills: Recent progress in the cellular and molecular mechanisms. Ajp Regul. Integr. Comp. Physiol. 2011, 301, R28–R47. [Google Scholar] [CrossRef]
- Reid, S.D. Localization and characterization phenamil-sensitive, Na+ influx in isolated rainbow trout gill epithelial cells. J. Exp. Biol. 2003, 206, 551–559. [Google Scholar] [CrossRef] [Green Version]
- Harvey, B.J. Energization sodium absorption by the, H(+)-ATPase pump in mitochondria-rich cells frog skin. J. Exp. Biol. 1992, 172, 289–309. [Google Scholar]
- Ehrenfeld, J.; Klein, U. The key role the, H+ V-ATPase in acid-base balance and, Na+ transport processes in frog skin. J. Exp. Biol. 1997, 200, 247–256. [Google Scholar]
- Hendus-Altenburger, R.; Kragelund, B.B.; Pedersen, S.F. Structural Dynamics and Regulation the MammalianS.L.C9A Family Na+/H+ Exchangers. Current Topics in Membranes; Elsevier: Amsterdam, The Netherlands, 2014; pp. 69–148. [Google Scholar] [CrossRef]
- Blair, S. Branchial ionoregulatory mechanisms sodium regulation in freshwater salmonids with conservational implications for, Arctic grayling (Thymallus arcticus). Univ. Alta. 2016. [Google Scholar] [CrossRef]
- Rotin, D.; Grinstein, S. Impaired cell volume regulation in, Na(+)-H+ exchange-deficient mutants. Am. J. Physiol. 1989, 257, C1158–C1165. [Google Scholar] [CrossRef]
- Goss, G.G.; Woodside, M.; Wakabayashi, S.; Pouyssegur, J.; Waddell, T.; Downey, G.P.; Grinstein, S. ATP dependence NHE-1, the ubiquitous isoform the, Na+/H+ antiporter. Analysis phosphorylation and subcellular localization. J. Biol. Chem. 1994, 269, 8741–8748. [Google Scholar] [CrossRef]
- Ding, J.; Rainey, J.K.; Xu, C.; Sykes, B.D.; Fliegel, L. Structural and functional characterization transmembrane segment, VII the, Na+/H+ exchanger isoform 1. J. Biol. Chem. 2006, 281, 29817–29829. [Google Scholar] [CrossRef] [PubMed] [Green Version]
- Slepkov, E.R.; Rainey, J.K.; Li, X.; Liu, Y.; Cheng, F.J.; Lindhout, D.A.; Sykes, B.D.; Fliegel, L. Structural and functional characterization transmembrane segment, IV the, NHE1 isoform the, Na+/H+ exchanger. J. Biol. Chem. 2005, 280, 17863–17872. [Google Scholar] [CrossRef] [Green Version]
- Li, X.; Fliegel, L. A novel human mutation in the, SLC9A1 gene results in abolition Na+/H+ exchanger activity. PLoS ONE 2015, 10, e0119453. [Google Scholar] [CrossRef]
- Rath, A.; Tulumello, D.V.; Deber, C.M. Peptide models membrane protein folding. Biochemistry 2009, 48, 3036–3045. [Google Scholar] [CrossRef]
- Wong, K.Y.; McKay, R.; Liu, Y.; Towle, K.; Elloumi, Y.; Li, X.; Quan, S.; Dutta, D.; Sykes, B.D.; Fliegel, L. Diverse residues intracellular loop 5 the, Na+/H+ exchanger modulate proton sensing, expression, activity and targeting. Biochim. Biophys. Acta Biomembr. 2019, 1861, 191–200. [Google Scholar] [CrossRef]
- Li, X.; Augustine, A.; Chen, S.; Fliegel, L. Stop codon polymorphisms in the human, SLC9A1 gene disrupt or compromise, Na+/H+ exchanger function. PLoS ONE 2016, 11, e0162902. [Google Scholar] [CrossRef] [Green Version]
- Li, X.; Quan, S.; Corsiatto, T.; Fliegel, L. Acidic residues extracellular loop 3 the, Na+/H+ exchanger type 1 are important in cation transport. Mol. Cell Biochem. 2020, 468, 13–20. [Google Scholar] [CrossRef]
- Li, X.; Dutta, D.; Jung, M.; Zimmermann, R.; Fliegel, L. Amino acids 563–566 the, Na+/H+ exchanger isoform 1 C-terminal cytosolic tail prevent protein degradation and stabilize protein expression and activity. Int. J. Mol. Sci. 2020, 21, 1737. [Google Scholar] [CrossRef] [PubMed] [Green Version]
- Chow, C.-W.; Khurana, S.; Woodside, M.; Grinstein, S.; Orlowski, J. The, Epithelial, Na+/H+ exchanger, NHE3, is internalized through a clathrin-mediated pathway. J. Biol. Chem. 1999, 274, 37551–37558. [Google Scholar] [CrossRef] [Green Version]
- Chow, C.W. Regulation and intracellular localization the epithelial isoforms the, Na+/H+ exchangers, NHE2 and, NHE3. Clin. Investig. Med. 1999, 22, 195–206. [Google Scholar] [PubMed]
- Biemesderfer, D.; Rutherford, P.; Nagy, T.; Pizzonia, J.H.; Abu-Alfa, A.K.; Aronson, P.S. Monoclonal antibodies for high-resolution localization NHE3 in adult and neonatal rat kidney. Am. J. Physiol. 1997, 273, 289–299. [Google Scholar] [CrossRef]
- Maidorn, R.; Cragoe, E.; Tannock, I. Therapeutic potential analogues amiloride: Inhibition the regulation intracellular pH as a possible mechanism tumour selective therapy. Br. J. Cancer 1993, 67, 297–303. [Google Scholar] [CrossRef] [PubMed] [Green Version]
- Noel, J.; Pouyssegur, J. Hormonal regulation, pharmacology, and membrane sorting vertebrate, Na+/H+ exchanger isoforms. Am. J. Physiol. 1995, 268, C283–C296. [Google Scholar] [CrossRef] [PubMed]
- Ito, Y.; Kato, A.; Hirata, T.; Hirose, S.; Romero, M.F. Na+/H+ and, Na+/NH4+ formula exchange activities zebrafish, NHE3b expressed in, Xenopus oocytes. Am. J. Physiol. Regul. Integr. Comp. 2014, 306, R315–R327. [Google Scholar] [CrossRef] [Green Version]
- Dutta, D.; Fliegel, L. Structure and function yeast and fungal, Na+/H+ antiporters. Iubmb Life 2018, 70, 23–31. [Google Scholar] [CrossRef] [PubMed] [Green Version]
- Yun, C.H.; Little, P.J.; Nath, S.K.; Levine, S.A.; Pouyssegur, J.; Tse, C.M.; Donowitz, M. Leu143 in the putative fourth membrane spanning domain is critical for amiloride inhibition an epithelial, Na+/H+ exchanger isoform (NHE-2). Biochem. Biophys. Res. Commun. 1993, 193, 532–539. [Google Scholar] [CrossRef] [PubMed]
- Counillon, L.; Scholz, W.; Lang, H.J.; Pouyssegur, J. Pharmacological characterization stably transfected, Na+/H+ antiporter isoforms using amiloride analogs and a new inhibitor exhibiting anti-ischemic properties. Mol. Pharmacol. 1993, 44, 1041–1045. [Google Scholar]
- Counillon, L.; Noël, J.; Reithmeier, R.A.F.; Pouysségur, J. Random mutagenesis reveals a novel site involved in inhibitor interaction within the fourth transmembrane segment the, Na+/H+ exchanger-1. Biochemistry 2003, 36, 2951–2959. [Google Scholar] [CrossRef] [PubMed]
- Pedersen, S.F.; King, S.A.; Rigor, R.R.; Zhuang, Z.; Warren, J.M.; Cala, P.M. Molecular cloning NHE1 from winter flounder, RBCs: Activation by osmotic shrinkage, cAMP, and calyculin, A. Am. J. Physiol. Cell Physiol. 2003, 284, C1561–C1576. [Google Scholar] [CrossRef] [PubMed] [Green Version]
- Dutta, D.; Fliegel, L. Molecular modeling and inhibitor docking analysis the, Na+/H+ exchanger isoform one. Biochem. Cell Biol. 2018, 1–11. [Google Scholar] [CrossRef] [PubMed] [Green Version]
- Preest, M.R.; Gonzalez, R.J.; Wilson, R.W. A pharmacological examination Na+ and, Cl− transport in two species freshwater fish. Physiol. Biochem. Zool. 2005, 78, 259–272. [Google Scholar] [CrossRef]
- Dymowska, A.K.; Schultz, A.G.; Blair, S.D.; Chamot, D.; Goss, G.G. Acid-sensing ion channels are involved in epithelial, Na+ uptake in the rainbow trout, Oncorhynchus mykiss. Am. J. Physiol. Cell Physiol. 2014, 307, C255–C265. [Google Scholar] [CrossRef] [PubMed] [Green Version]
- Chen, X.; Qiu, L.; Li, M.; Durrnagel, S.; Orser, B.A.; Xiong, Z.-G.; MacDonald, J.F. Diarylamidines: High potency inhibitors acid-sensing ion channels. Neuropharmacology 2010, 58, 1045–1053. [Google Scholar] [CrossRef] [Green Version]
- Claiborne, J.B.; Blackston, C.R.; Choe, K.P.; Dawson, D.C.; Harris, S.P.; Mackenzie, L.A.; Morrison-Shetlar, A.I. A mechanism for branchial acid excretion in marine fish: Identification multiple, Na+/H+ antiporter (NHE) isoforms in gills two seawater teleosts. J. Exp. Biol. 1999, 202, 315–324. [Google Scholar]
- Wilson, J.M.; Laurent, P.; Benos, D.J.; Donowitz, M.; Vogl, A.W.; Randall, D.J. NaCl uptake by the branchial epithelium in freshwater teleost fish: An immunological approach to ion-transport protein localization. J. Exp. Biol. 2000, 203, 2279–2296. [Google Scholar] [PubMed]
- Yan, J.-J.; Chou, M.-Y.; Kaneko, T.; Hwang, P.-P. Gene expression Na+/H+ exchanger in zebrafish, H+-ATPase-rich cells during acclimation to low-Na+ and acidic environments. Am. J. Physiol. Cell Physiol. 2007, 293, C1814–C1823. [Google Scholar] [CrossRef] [Green Version]
- Hiroi, J.; Yasumasu, S.; McCormick, S.D.; Hwang, P.-P.; Kaneko, T. Evidence for an apical, Na-Cl cotransporter involved in ion uptake in a teleost fish. J. Exp. Biol. 2008, 211, 2584–2599. [Google Scholar] [CrossRef] [Green Version]
- Perry, S.F.; Randall, D.J. Effects amiloride and, SITS on branchial ion fluxes in rainbow trout, Salmo gairdneri. J. Exp. Zool. Part A Ecol. Genet. Physiol. 1981, 215, 225–228. [Google Scholar] [CrossRef] [PubMed]
- Boisen, A.M.Z.; Amstrup, J.; Novak, I.; Grosell, M. Sodium and chloride transport in soft water and hard water acclimated zebrafish (Danio rerio). Biochim. Biophys. Acta Biomembr. 2003, 1618, 207–218. [Google Scholar] [CrossRef] [PubMed] [Green Version]
- Raleigh, R.F.; Hickman, T.; Soloman, R.C.; Nelson, P.C. Habitat Suitability Information: Rainbow Trout; US Department the Interior Fish and Wildlife Service: Washington, DC, USA, 1984; FWS/OBS-82/1060 76.
- Hoshino, K.; Avkiran, M. Effects moderate hypothermia on sarcolemmal, Na+/H+ exchanger activity and its inhibition by cariporide in cardiac ventricular myocytes. Br. J. Pharmacol. 2001, 134, 1587–1595. [Google Scholar] [CrossRef] [PubMed]
- Seifter, J.L.; Aronson, P.S. Properties and physiologic roles the plasma membrane sodium-hydrogen exchanger. J. Clin. Investig. 1986, 78, 859–864. [Google Scholar] [CrossRef] [PubMed]


Publisher’s Note: MDPI stays neutral with regard to jurisdictional claims in published maps and institutional affiliations. |
© 2021 by the authors. Licensee MDPI, Basel, Switzerland. This article is an open access article distributed under the terms and conditions of the Creative Commons Attribution (CC BY) license (http://creativecommons.org/licenses/by/4.0/).
Share and Cite
Blair, S.; Li, X.; Dutta, D.; Chamot, D.; Fliegel, L.; Goss, G. Rainbow Trout (Oncorhynchus mykiss) Na+/H+ Exchangers tNhe3a and tNhe3b Display Unique Inhibitory Profiles Dissimilar from Mammalian NHE Isoforms. Int. J. Mol. Sci. 2021, 22, 2205. https://0-doi-org.brum.beds.ac.uk/10.3390/ijms22042205
Blair S, Li X, Dutta D, Chamot D, Fliegel L, Goss G. Rainbow Trout (Oncorhynchus mykiss) Na+/H+ Exchangers tNhe3a and tNhe3b Display Unique Inhibitory Profiles Dissimilar from Mammalian NHE Isoforms. International Journal of Molecular Sciences. 2021; 22(4):2205. https://0-doi-org.brum.beds.ac.uk/10.3390/ijms22042205
Chicago/Turabian StyleBlair, Salvatore, Xiuju Li, Debajyoti Dutta, Danuta Chamot, Larry Fliegel, and Greg Goss. 2021. "Rainbow Trout (Oncorhynchus mykiss) Na+/H+ Exchangers tNhe3a and tNhe3b Display Unique Inhibitory Profiles Dissimilar from Mammalian NHE Isoforms" International Journal of Molecular Sciences 22, no. 4: 2205. https://0-doi-org.brum.beds.ac.uk/10.3390/ijms22042205