
Ca2+-ATPase Molecules as a Calcium-Sensitive Membrane-Endoskeleton of Sarcoplasmic Reticulum


Abstract
:
1. Introduction
2. Results
3. Discussion
4. Materials and Methods
5. Conclusions
Author Contributions
Funding
Acknowledgments
Conflicts of Interest
Abbreviations
| SR | sarcoplasmic reticulum |
| E1 | high affinity state of Ca2+-ATPase for calcium |
| E2 | low affinity state of Ca2+-ATPase for calcium |
| RyR | ryanodine receptor |
| EGTA | ethylenebis (oxyethylenenitrilo) tetraacetic acid |
| TG | thapsigargin |
| DMSO | dimethylsulfoxide |
| EM | Electron Microscopy/Microscope |
| TEM | Transmission Electron Microscopy/Microscope |
References
- Hasselbach, W. Relaxing factor and the relaxation of muscle. In Progress in Biophysics and Molecular Biology; Bupler, J.A.V., Huxley, H.E., Eds.; Pergamon Press: London, UK, 1964; pp. 167–222. [Google Scholar]
- Ebashi, S.; Endo, M. Calcium ion and muscle contraction. In Progress in Biophysics and Molecular Biology; Bupler, J.A.V., Huxley, H.E., Eds.; Pergamon Press: London, UK, 1968; pp. 123–183. [Google Scholar]
- Franzini-Armstrong, C.; Protasi, F. Ryanodine receptors of striated muscles: A complex channel capable of multiple interactions. Physical. Rev. 1997, 77, 699–729. [Google Scholar] [CrossRef]
- MacLennan, D.H.; Brandl, C.J.; Korczak, B.; Green, N.M. Amino-acid sequence of a Ca2+ + Mg2+-dependent ATPase from rabbit muscle sarcoplasmic reticulum, deduced from its complimentary DNA sequence. Nature 1985, 316, 696–700. [Google Scholar] [CrossRef] [PubMed]
- Brandl, C.J.; Green, N.M.; Korczak, B.; MacLennan, D.H. Two Ca2+ ATPase genes: Homologies and mechanistic implications of deduced amino acid sequences. Cell 1986, 44, 597–607. [Google Scholar] [CrossRef]
- Tada, M.; Yamamoto, T.; Tonomura, Y. Molecular Mechanism of active calcium transport by sarcoplasmic reticulum. Physiol. Rev. 1978, 58, 1–79. [Google Scholar] [CrossRef] [PubMed]
- De Meis, L.; Inesi, G. The transport of calcium by sarcoplasmic reticulum and various microsomal preparations. In Membrane Transport of Calcium; Carafoli, E., Ed.; Academic Press Inc.: Orland, FL, USA, 1982; pp. 141–186. [Google Scholar]
- Inesi, G.; Sumbilla, C.; Kirtley, M.E. Relationships of molecular structure and function in Ca2+-transport ATPase. Physiol. Rev. 1990, 70, 749–760. [Google Scholar] [CrossRef]
- MacLennan, D.H.; Rice, W.J.; Green, N.M. The mechanism of Ca2+ transport by sarco(endo)plasmic reticulum Ca2+-ATPase. J. Biol. Chem. 1997, 272, 28815–28818. [Google Scholar] [CrossRef] [Green Version]
- Porter, K.R.; Palade, G.E. Studies on the endoplasmic reticulum. III. Its form and distribution in striated muscle cells. J. Biophys. Biochem. Cytol. 1957, 3, 269–300. [Google Scholar] [CrossRef]
- Peachey, L.D. The sarcoplasmic reticulum and transverse tubules of the frog’s Sartorius. J. Cell Biol. 1965, 25, 209–231. [Google Scholar] [CrossRef] [PubMed] [Green Version]
- Franzini-Armstrong, C. Studies of the triad. I. Structure of the junction in frog twitch fibers. J. Cell. Biol. 1970, 47, 488–499. [Google Scholar] [CrossRef]
- Inui, M.; Saito, A.; Fleischer, S. Purification of the ryanodine receptor and identity with feet structures of junctional terminal cisternae of sarcoplasmic reticulum from fast skeletal muscle. J. Biol. Chem. 1987, 262, 1740–1747. [Google Scholar] [CrossRef]
- Lai, F.A.; Erickson, H.P.; Pousseau, E.; Liu, Q.Y.; Meissner, G. Purification and reconstitution of the calcium release channel from skeletal muscle. Nature 1988, 331, 315–319. [Google Scholar] [PubMed]
- Ogata, T.; Yamasaki, Y. Scanning electron-microscopic studied on the three-dimensional structure of sarcoplasmic reticulum in the mammalian red, white and intermediate muscle fibers. Cell Tissue Res. 1985, 242, 461–467. [Google Scholar] [CrossRef] [PubMed]
- Meissner, G. Isolation and characterization of two types of sarcoplasmic reticulum vesicles. Biochim. Biophys. Acta 1975, 389, 51–68. [Google Scholar] [CrossRef]
- Saito, A.; Seiler, S.; Chu, A.; Fleisher, S. Preparation and morphology of sarcoplasmic reticulum terminal cisternae from rabbit skeletal muscle. J. Cell Biol. 1984, 99, 875–885. [Google Scholar] [CrossRef] [PubMed]
- Scales, D.; Inesi, G. Assembly of ATPase protein in sarcoplasmic reticulum membranes. Biophys. J. 1976, 16, 735–751. [Google Scholar] [CrossRef] [Green Version]
- Stewart, P.S.; MacLennan, D.H. Surface particles of sarcoplasmic reticulum membranes. Structural features of the adenosine triphosphatase. J. Biol. Chem. 1974, 249, 985–993. [Google Scholar] [CrossRef]
- Saito, A.; Wang, C.-T.; Fleischer, S. Membrane asymmetry and enhanced ultrastructural detail of sarcoplasmic reticulum revealed with use of tannic acid. J. Cell Biol. 1978, 79, 601–616. [Google Scholar] [CrossRef] [PubMed] [Green Version]
- Tillack, T.W.; Boland, R.; Martonosi, A. The ultrastructure of developing sarcoplasmic reticulum. J. Biol. Chem. 1974, 249, 624–633. [Google Scholar] [CrossRef]
- Pacher, L.; Mehard, C.W.; Meissner, G.; Zahler, W.L.; Fleischer, S. The structural role of lipids in mitochondrial and sarcoplasmic reticulum membranes. Freeze-fracture electron microscope studies. Biochim. Biophys. Acta 1974, 363, 159–189. [Google Scholar] [CrossRef]
- Franzini-Armstrong, C.; Ferguson, D.G. Density and disposition of Ca2+-ATPase in sarcoplasmic reticulum membrane as determined by shadowing techniques. Biophys. J. 1985, 48, 607–615. [Google Scholar] [CrossRef] [Green Version]
- Andersen, J.P.; Møller, J.V.; Jørgensen, P.L. The functional unit of sarcoplasmic reticulum Ca2+-ATPase. J. Biol. Chem. 1982, 257, 8300–8307. [Google Scholar] [CrossRef]
- Andersen, J.P.; Lassen, K.; Møller, J.V. Changes in Ca2+ affinity related to conformational transitions in the phosphorylated state of soluble monomeric Ca2+-ATPase from sarcoplasmic reticulum. J. Biol. Chem. 1985, 260, 371–380. [Google Scholar] [CrossRef]
- Nakamura, J. Two types of proton-modulated calcium binding in the sarcoplasmic reticulum Ca2+-ATPase. II. Characteristics of their calcium binding. J. Biol. Chem. 1994, 269, 30822–30827. [Google Scholar] [CrossRef]
- Nakamura, J. Are the conformational variants of Ca2+-ATPase a model for other proteins? J. NIH Res. 1995, 7, 54–55. [Google Scholar]
- Kotake, A.; Tajima, G.; Maruyama, Y.; Nakamura, J.; Sato, C. Susceptibility test of two Ca2+-ATPase conformers to denaturants and polyols to outline their structural difference. J. Memb. Biol. 2013, 246, 141–149. [Google Scholar] [CrossRef]
- Nakamura, J.; Tajima, G. Independence of two conformations of sarcoplasmic reticulum Ca2+-ATPase molecules in hydrolyzing acetyl phosphate. J. Biol. Chem. 1997, 272, 19290–19294. [Google Scholar] [CrossRef] [PubMed] [Green Version]
- Nakamura, J.; Tajima, G.; FuruKohri, T. Oligomer of two types of conformational variants of sarcoplasmic reticulum Ca2+-ATPase molecules. In Na/K-ATPase and Related ATPases; Taniguchi, K., Kaya, S., Eds.; Elsevier Science: Amsterdam, The Netherlands, 2000; pp. 373–379. [Google Scholar]
- De Meis, L.; Hasselbach, W. Acetylphosphate as substrate for Ca2+ uptake in skeletal muscle microsomes. J. Biol. Chem. 1971, 246, 4759–4763. [Google Scholar] [CrossRef]
- Toyoshima, C.; Inesi, G. Structural basis of ion pumping by Ca2+-ATPase of the sarcoplasmic reticulum. Annu. Rev. Biochem. 2004, 73, 269–292. [Google Scholar] [CrossRef] [PubMed]
- Olesen, C.; Picard, M.; Winther, A.-M.L.; Gyrup, C.; Morth, J.P.; Oxvig, C.; Møller, J.V.; Nissen, P. The structural basis of calcium transport by the calcium pump. Nature 2007, 450, 1036–1042. [Google Scholar] [CrossRef]
- Dux, L.; Taylor, K.A.; Ting-Beall, H.P.; Martonosi, A. Crystallization of the Ca2+-ATPase of sarcoplasmic reticulum by calcium and lanthanide ions. J. Bio. Chem. 1985, 260, 11730–11743. [Google Scholar] [CrossRef]
- Fabiato, A.; Fabiato, F. Effects of pH on the myofilaments and the sarcoplasmic reticulum of skinned cells from cardiac and skeletal muscles. J. Physiol. 1978, 276, 233–255. [Google Scholar] [CrossRef]
- Nakamura, J.; Tajima, G.; Sato, C.; Furukohri, T.; Konishi, K. Substrate regulation of calcium binding in Ca2+-ATPase molecules of the sarcoplasmic reticulum. I. Effect of ATP. J. Biol. Chem. 2002, 277, 24180–24190. [Google Scholar] [CrossRef] [PubMed] [Green Version]
- Deamer, D.W.; Baskin, R.J. Ultrastructure of sarcoplasmic reticulum preparations. J. Cell Biol. 1969, 42, 296–307. [Google Scholar] [CrossRef] [PubMed] [Green Version]
- Nakamura, S.; Suzuki, H.; Kanazawa, T. Stoichiometry of phosphorylation to fluorescein 5-isothiocyanate binding in the Ca2+-ATPase of sarcoplasmic reticulum vesicles. J. Biol. Chem. 1997, 272, 6232–6237. [Google Scholar] [CrossRef] [Green Version]
- Dixon, M.; Webb, E.C. Allosteric and cooperative effects. In Enzymes, 3rd ed.; Academic Press: London, UK, 1979; pp. 399–402. [Google Scholar]
- Sorensen, T.L.-M.; Moller, J.V.; Nissen, P. Phosphoryl transfer and calcium ion occlusion in the calcium pump. Science 2004, 304, 1672–1675. [Google Scholar] [CrossRef]
- Nakamura, J.; Endo, Y.; Konishi, K. The formation of phosphoenzyme of sarcoplasmic reticulum; requirement for membrane-bound Ca2+. Biochim. Biophys. Acta 1977, 471, 260–272. [Google Scholar] [CrossRef]
- Dux, L.; Martonosi, A. Two-dimensional arrays of proteins in sarcoplasmic reticulum and purified Ca2+-ATPase vesicles treated with vanadate. J. Biol. Chem. 1983, 258, 2599–2603. [Google Scholar] [CrossRef]
- Varga, S.; Csermely, P.; Martonosi, A. The binding of vanadium (V) oligomer to sarcoplasmic reticulum. Eur. J. Biochem. 1985, 148, 119–126. [Google Scholar] [CrossRef] [Green Version]
- Sagara, Y.; Wade, J.B.; Inesi, G. A conformational mechanism for formation of a dead-end complex by the sarcoplasmic reticulum ATPase with thapsigargin. J. Biol. Chem. 1992, 267, 1286–1292. [Google Scholar] [CrossRef]
- Taylor, K.A.; Dux, L.; Martonosi, A. Three-dimensional reconstruction of negatively stained crystals of the Ca2+-ATPase from muscle sarcoplasmic reticulum. J. Mol. Biol. 1986, 187, 417–427. [Google Scholar] [CrossRef]
- Stokes, D.L.; Lacapère, J.-J. Conformation of Ca2+-ATPase in two crystal forms. Effect of Ca2+, thapsigargin, adenosine 5’-(β, γ-methylene)triphosphate, and chromium(III)-ATP on crystallization. J. Biol. Chem. 1994, 269, 11606–11613. [Google Scholar] [CrossRef]
- Patel, A.; Malinovska, L.; Saha, S.; Wang, J.; Alberti, S.; Krishnan, Y.; Hyman, A.A. ATP as a biological hydrotrope. Science 2017, 356, 753–756. [Google Scholar] [CrossRef]
- Nakamura, J.; Tajima, G.; Sato, C. Substrate regulation of calcium binding in Ca2+-ATPase molecules of the sarcoplasmic reticulum. II. Effect of CTP, GTP, ITP, and UTP. J. Biol. Chem. 2002, 277, 24191–24196. [Google Scholar] [CrossRef] [Green Version]
- Yajima, H.; Ogura, T.; Nitta, R.; Okada, Y.; Sato, C.; Hirokawa, N. Conformational changes in tubulin in GMPCPP and GDP-taxol microtubules observed by cryoelectron microscopy. J. Cell Biol. 2012, 198, 315–322. [Google Scholar] [CrossRef] [Green Version]
- Maruyama, Y.; Ebihara, T.; Nishiyama, H.; Konyuba, Y.; Senda, M.; Numaga-Tomita, T.; Senda, T.; Suga, M.; Sato, C. Direct observation of protein microcrystals in crystallization buffer by atmospheric scanning electron microscopy. Int. J. Mol. Sci. 2012, 13, 10553–10567. [Google Scholar] [CrossRef] [Green Version]
- Murai, T.; Sato, M.; Nishiyama, H.; Suga, M.; Sato, C. Ultrastructural analysis of nanogold-labeled cell surface microvilli in liquid by atmospheric scanning electron microscopy and their relevance in cell adhesion. Int. J. Mol. Sci. 2013, 14, 20809–20819. [Google Scholar] [CrossRef] [Green Version]
- Komenami, T.; Yoshimura, A.; Matsuno, Y.; Sato, M.; Sato, C. Network of palladium-based nanorings synthesized by liquid-phase reduction using DMSO-H2O: In situ monitoring of structure formation and drying deformation by ASEM. Int. J. Mol. Sci. 2020, 21, 3271. [Google Scholar] [CrossRef]
- Naya, M.; Sato, C. Pyrene Excimer-Based Fluorescent Labeling of Neighboring Cysteines by Protein Dynamics: ASEM-Induced Thiol-Ene Click Reaction for High Spatial Resolution CLEM. Int. J. Mol. Sci. 2020, 21, 7550. [Google Scholar] [CrossRef]
- Sato, C.; Yamazaki, D.; Sato, M.; Takeshima, H.; Memtily, N.; Hatano, Y.; Tsukuba, T.; Sakai, E. Calcium phosphate mineralization in bone tissues directly observed in aqueous liquid by atmospheric SEM (ASEM) without staining: Microfluidics crystallization chamber and immuno-EM. Sci. Rep. 2019, 9, 1–13. [Google Scholar] [CrossRef]
- Weber, A.; Herz, R.; Reiss, I. Study of the kinetics of calcium transport by isolated fragmented sarcoplasmic reticulum. Biochem. Z. 1966, 345, 329–369. [Google Scholar]
- Nakamura, J.; Furukohri, T. Two types of proton-modulated calcium binding in the sarcoplasmic reticulum Ca2+-ATPase. J. Biol. Chem. 1994, 269, 30818–30821. [Google Scholar] [CrossRef]
- Harafuji, H.; Ogawa, Y. Re-examination of the apparent binding constant of ethylene glycol bis(β-aminoethy ether)-N,N,N’,N’-tetraactic acid with calcium around neutral pH. J. Biochem. (Tokyo) 1980, 87, 1305–1312. [Google Scholar] [CrossRef] [PubMed]
- Khan, M.M.T.; Martell, A.E. Thermodynamic quantities associated with the interaction of adenosine triphosphate with metal ions. J. Am. Chem. Soc. 1966, 88, 668–671. [Google Scholar] [CrossRef] [PubMed]
- Sato, C.; Sato, M.; Iwasaki, A.; Doi, T.; Engel, A. The sodium channel has four domains surrounding a central pore. J. Struct. Biol. 1998, 121, 314–325. [Google Scholar] [CrossRef] [PubMed]


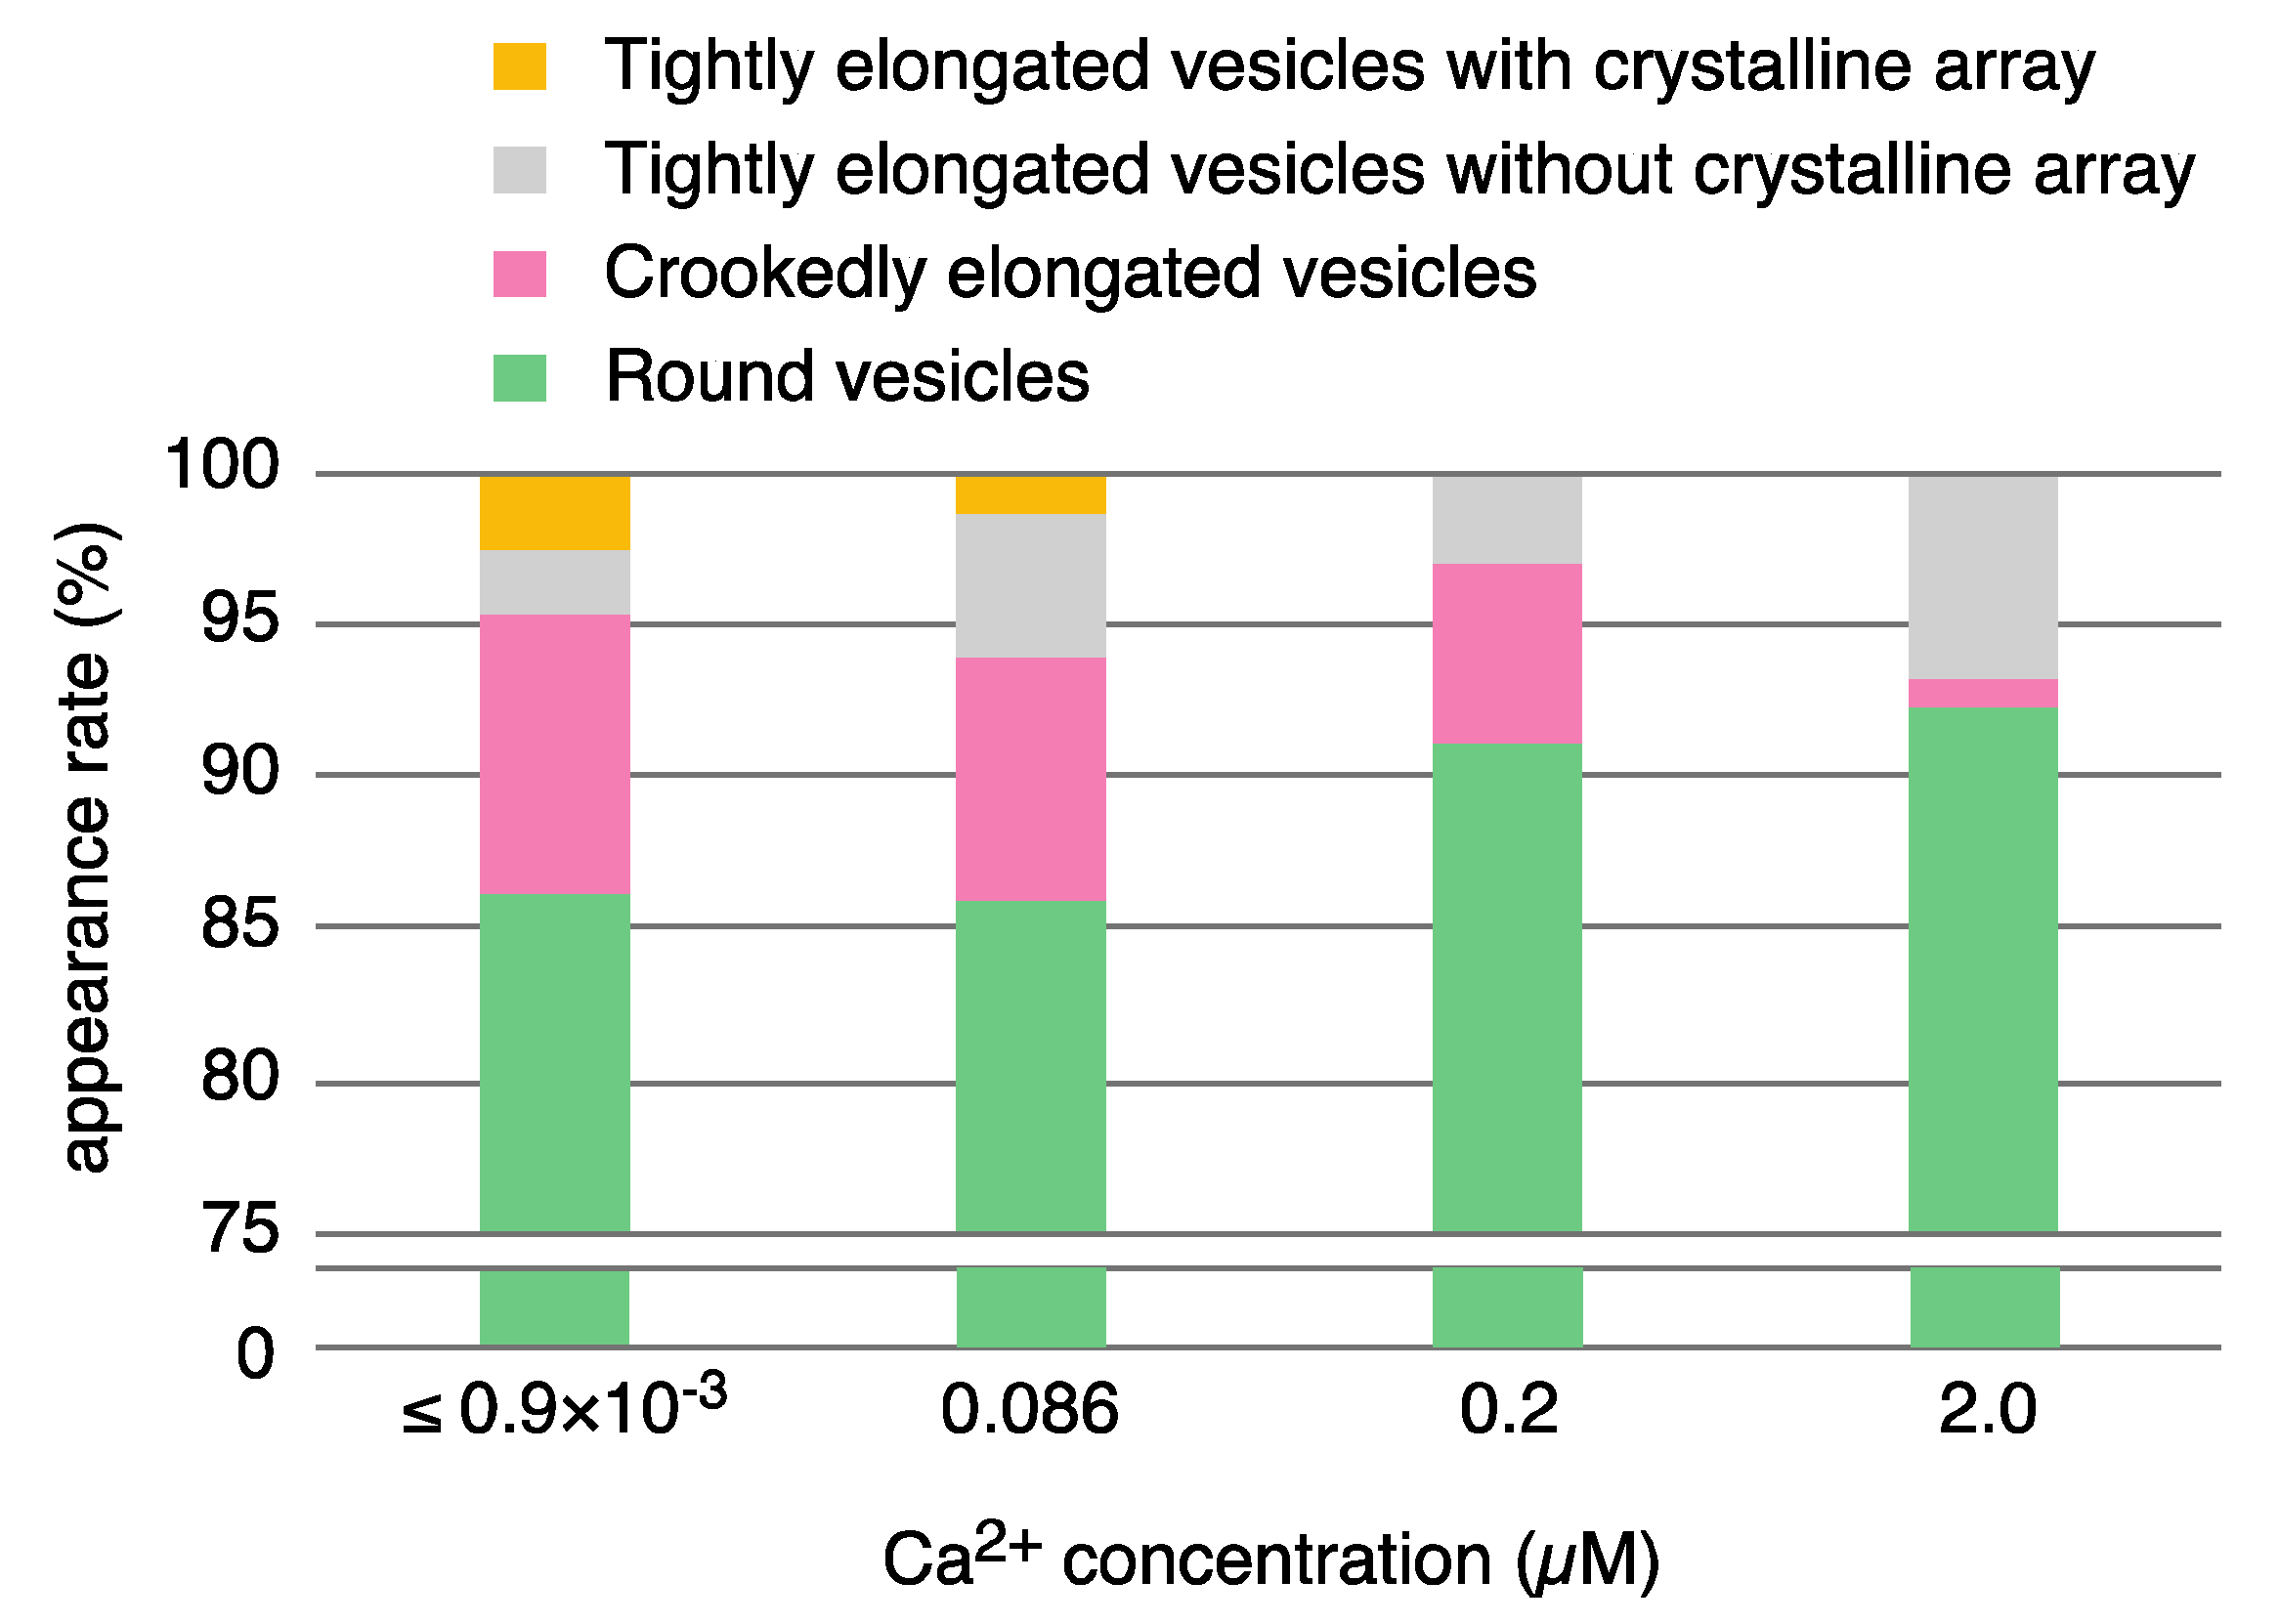
| Calcium Concentration | |||||||
|---|---|---|---|---|---|---|---|
| ≤0.9 nM | 0.086 µM | 0.2 µM | 2.0 µM | ||||
| elongated vesicles * | 169 (13.8%) | 234 (14.2%) | 168 (8.9%) | 106 (7.7%) | |||
| tightly elongated | 55 (4.5) | 100 (6.0) | 55 (6.0) | 93 (6.8) | |||
| with crystal-array | 31 (2.5) | 22 (1.3) | 0 | 0 | |||
| including tetramer | 1 ** (0.08) | 0 | 0 | 0 | |||
| without crystal-array | 24 (2.0) | 78 (4.7) | 55 (2.9) | 93 (6.8) | |||
| crookedly elongated | 114 (9.3) | 134 (8.1) | 113 (6.0) | 13 (0.9) | |||
| round vesicles * | 1056 (86.2) | 1419 (85.8) | 1716 (91.1) | 1270 (92.3) | |||
| total *** | 1225 | 1653 | 1884 | 1376 | |||
| Calcium Concentration | ||
|---|---|---|
| 0.02 nM | 2.0 µM | |
| Elongated (crookedly) vesicles | 47 (3.9%) | 65 (2.9%) |
| round vesicles * | 1146 (96.1) | 2189 (97.1) |
| total *** | 1193 | 2254 |
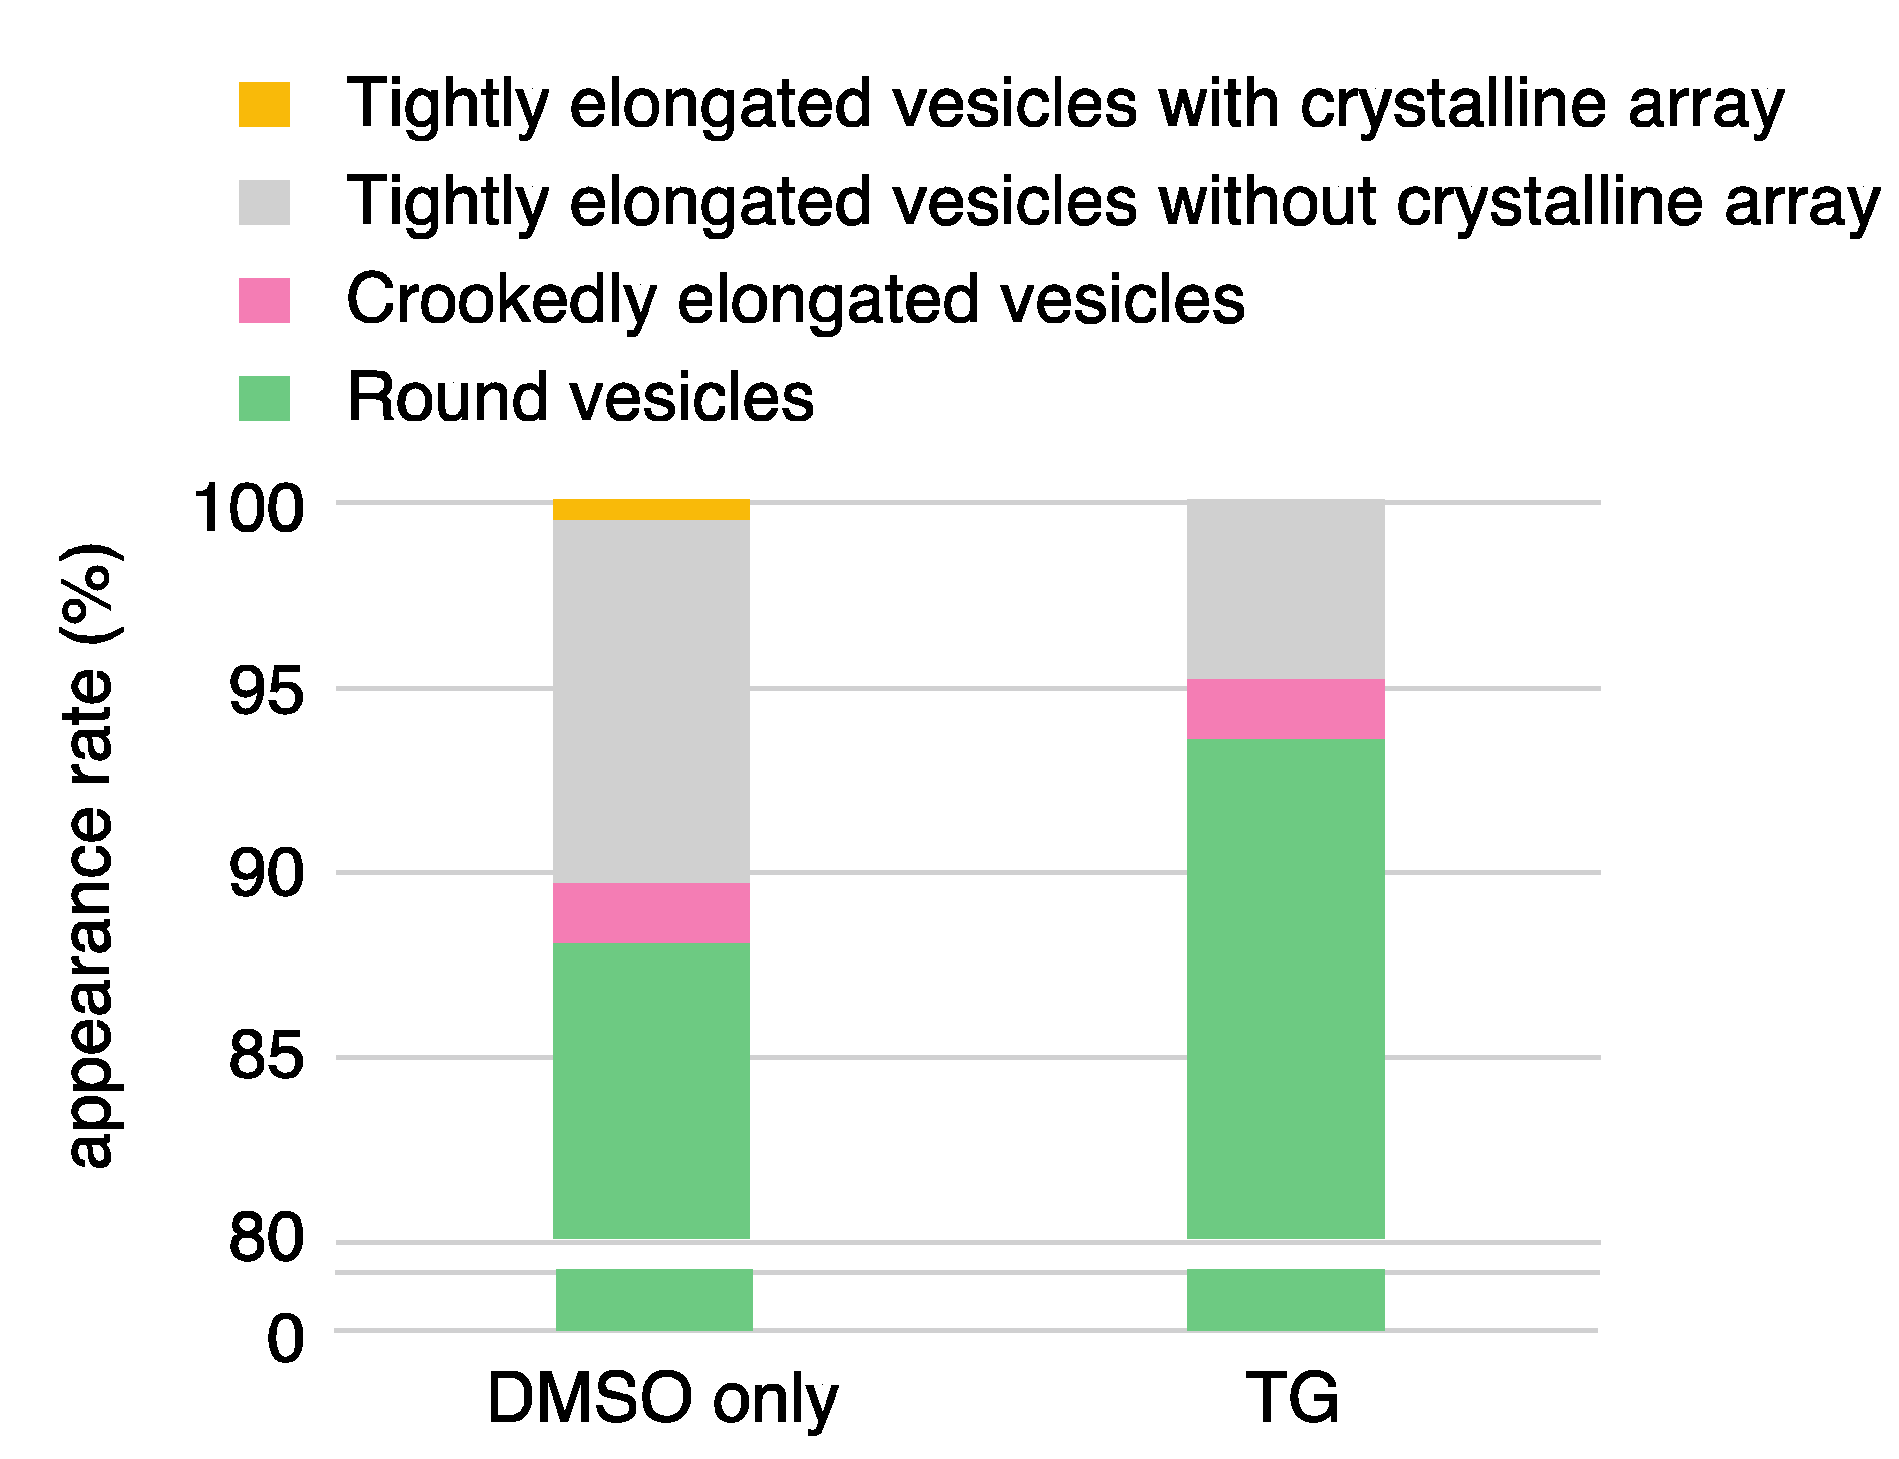
| DMSO Only (0.09% (v/v)) | TG | |||
|---|---|---|---|---|
| elongated vesicles * | 256 (11.9%) | 132 (6.3%) | ||
| tightly elongated | 221 (10.3) | 101 (4.8) | ||
| with crystal-array | 8 (0.4) | 0 (0) | ||
| without crystal-array | 213 (9.9) | 101 (4.8) | ||
| crookedly elongated | 35 (1.6) | 31 (1.5) | ||
| round vesicles * | 1887 (88.1) | 1954 (93.7) | ||
| total *** | 2143 | 2086 | ||
Publisher’s Note: MDPI stays neutral with regard to jurisdictional claims in published maps and institutional affiliations. |
© 2021 by the authors. Licensee MDPI, Basel, Switzerland. This article is an open access article distributed under the terms and conditions of the Creative Commons Attribution (CC BY) license (http://creativecommons.org/licenses/by/4.0/).
Share and Cite
Nakamura, J.; Maruyama, Y.; Tajima, G.; Komeiji, Y.; Suwa, M.; Sato, C. Ca2+-ATPase Molecules as a Calcium-Sensitive Membrane-Endoskeleton of Sarcoplasmic Reticulum. Int. J. Mol. Sci. 2021, 22, 2624. https://0-doi-org.brum.beds.ac.uk/10.3390/ijms22052624
Nakamura J, Maruyama Y, Tajima G, Komeiji Y, Suwa M, Sato C. Ca2+-ATPase Molecules as a Calcium-Sensitive Membrane-Endoskeleton of Sarcoplasmic Reticulum. International Journal of Molecular Sciences. 2021; 22(5):2624. https://0-doi-org.brum.beds.ac.uk/10.3390/ijms22052624
Chicago/Turabian StyleNakamura, Jun, Yuusuke Maruyama, Genichi Tajima, Yuto Komeiji, Makiko Suwa, and Chikara Sato. 2021. "Ca2+-ATPase Molecules as a Calcium-Sensitive Membrane-Endoskeleton of Sarcoplasmic Reticulum" International Journal of Molecular Sciences 22, no. 5: 2624. https://0-doi-org.brum.beds.ac.uk/10.3390/ijms22052624