
Mitochondrial Mistranslation in Brain Provokes a Metabolic Response Which Mitigates the Age-Associated Decline in Mitochondrial Gene Expression

 ,
,
Abstract
:1. Introduction
2. Results
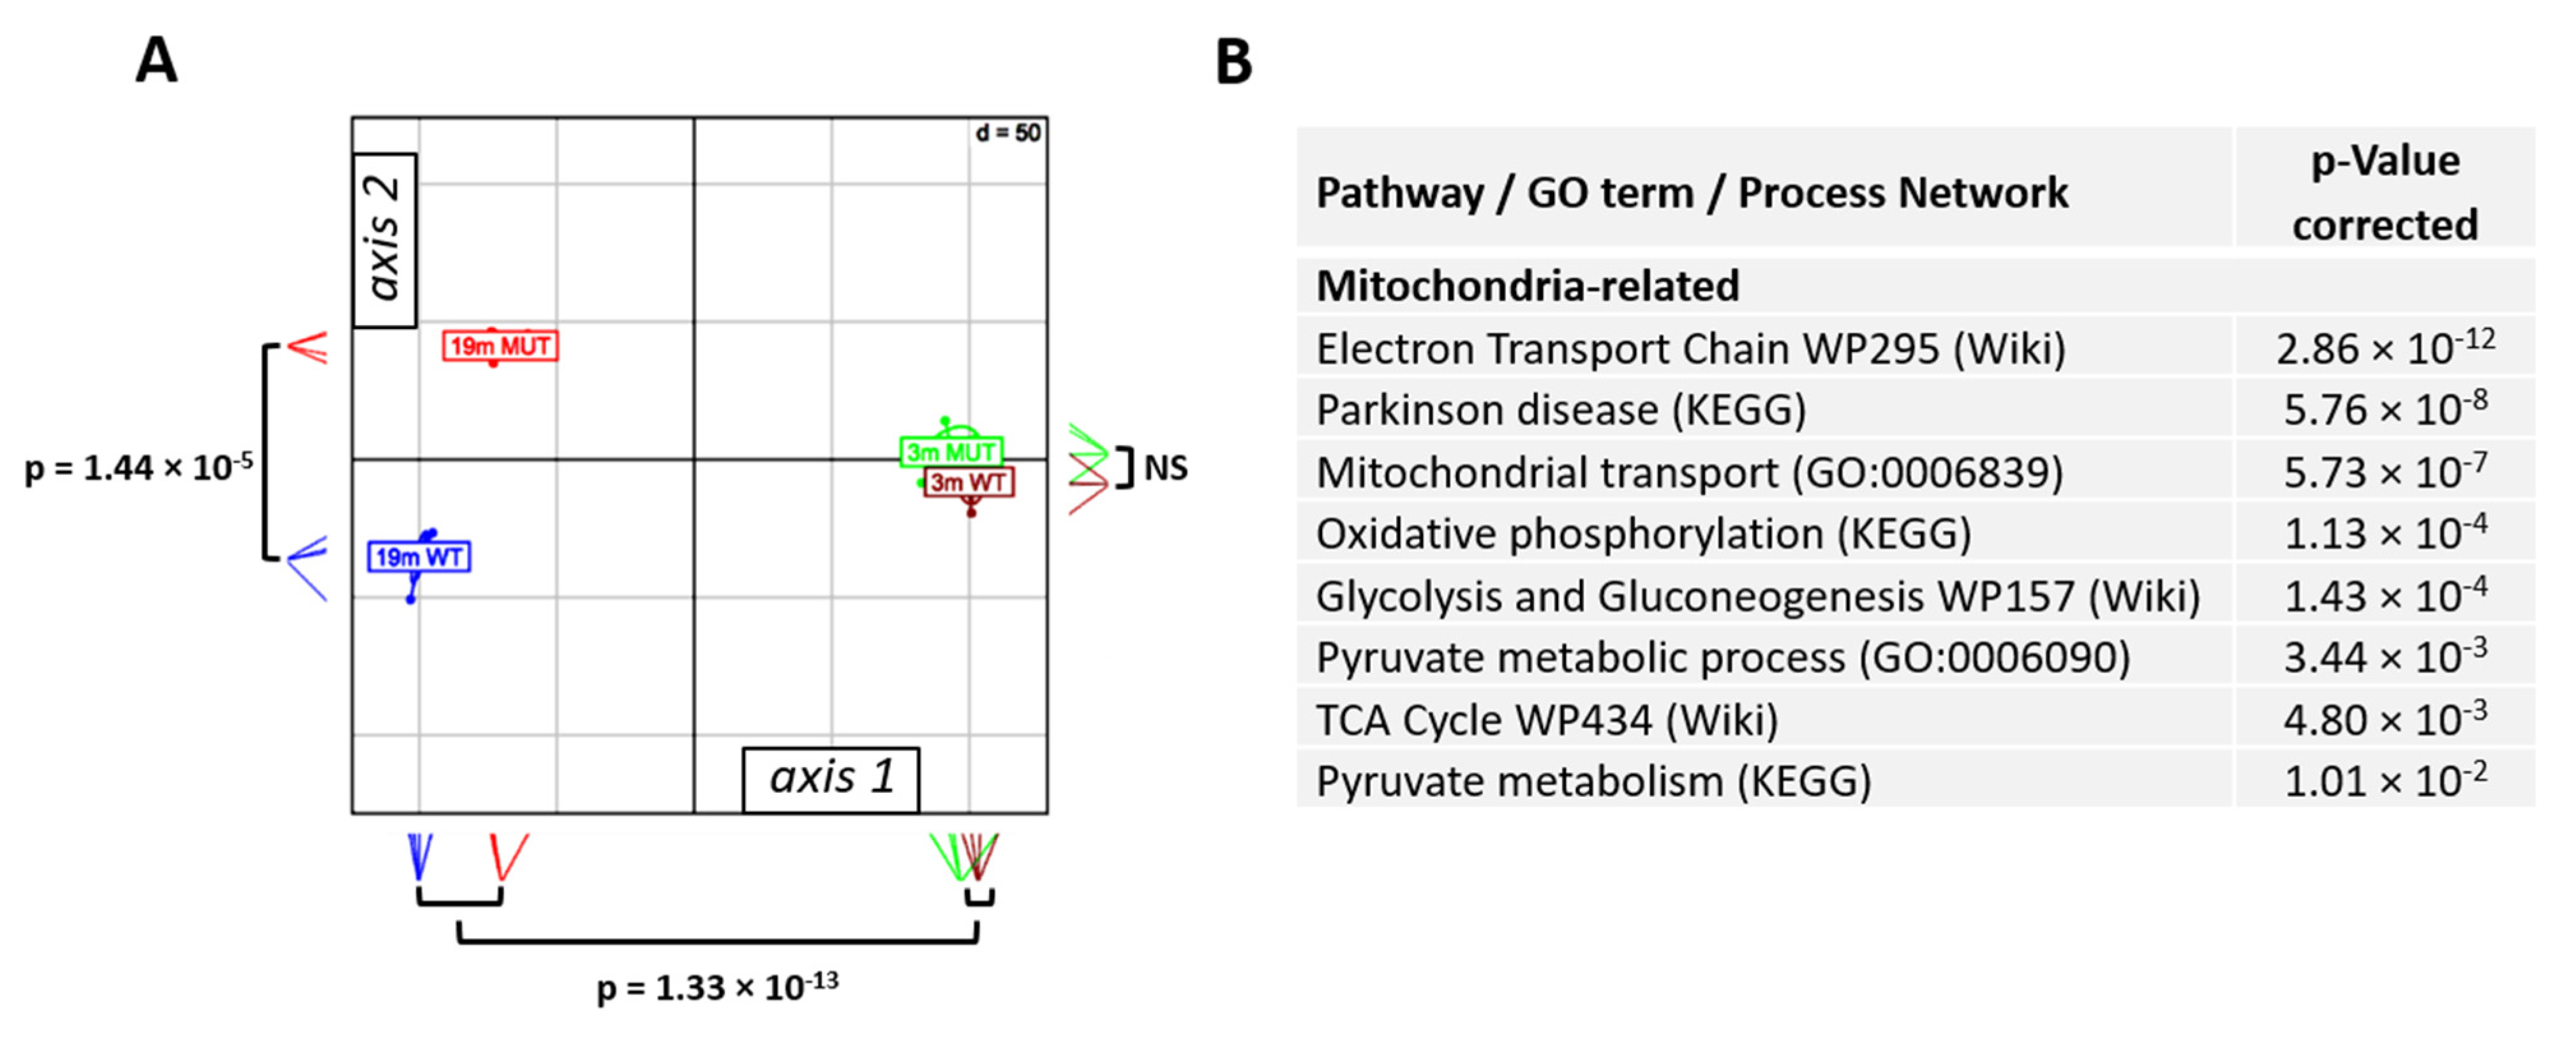
2.1. Transcriptome Sequencing and Age-Related Changes
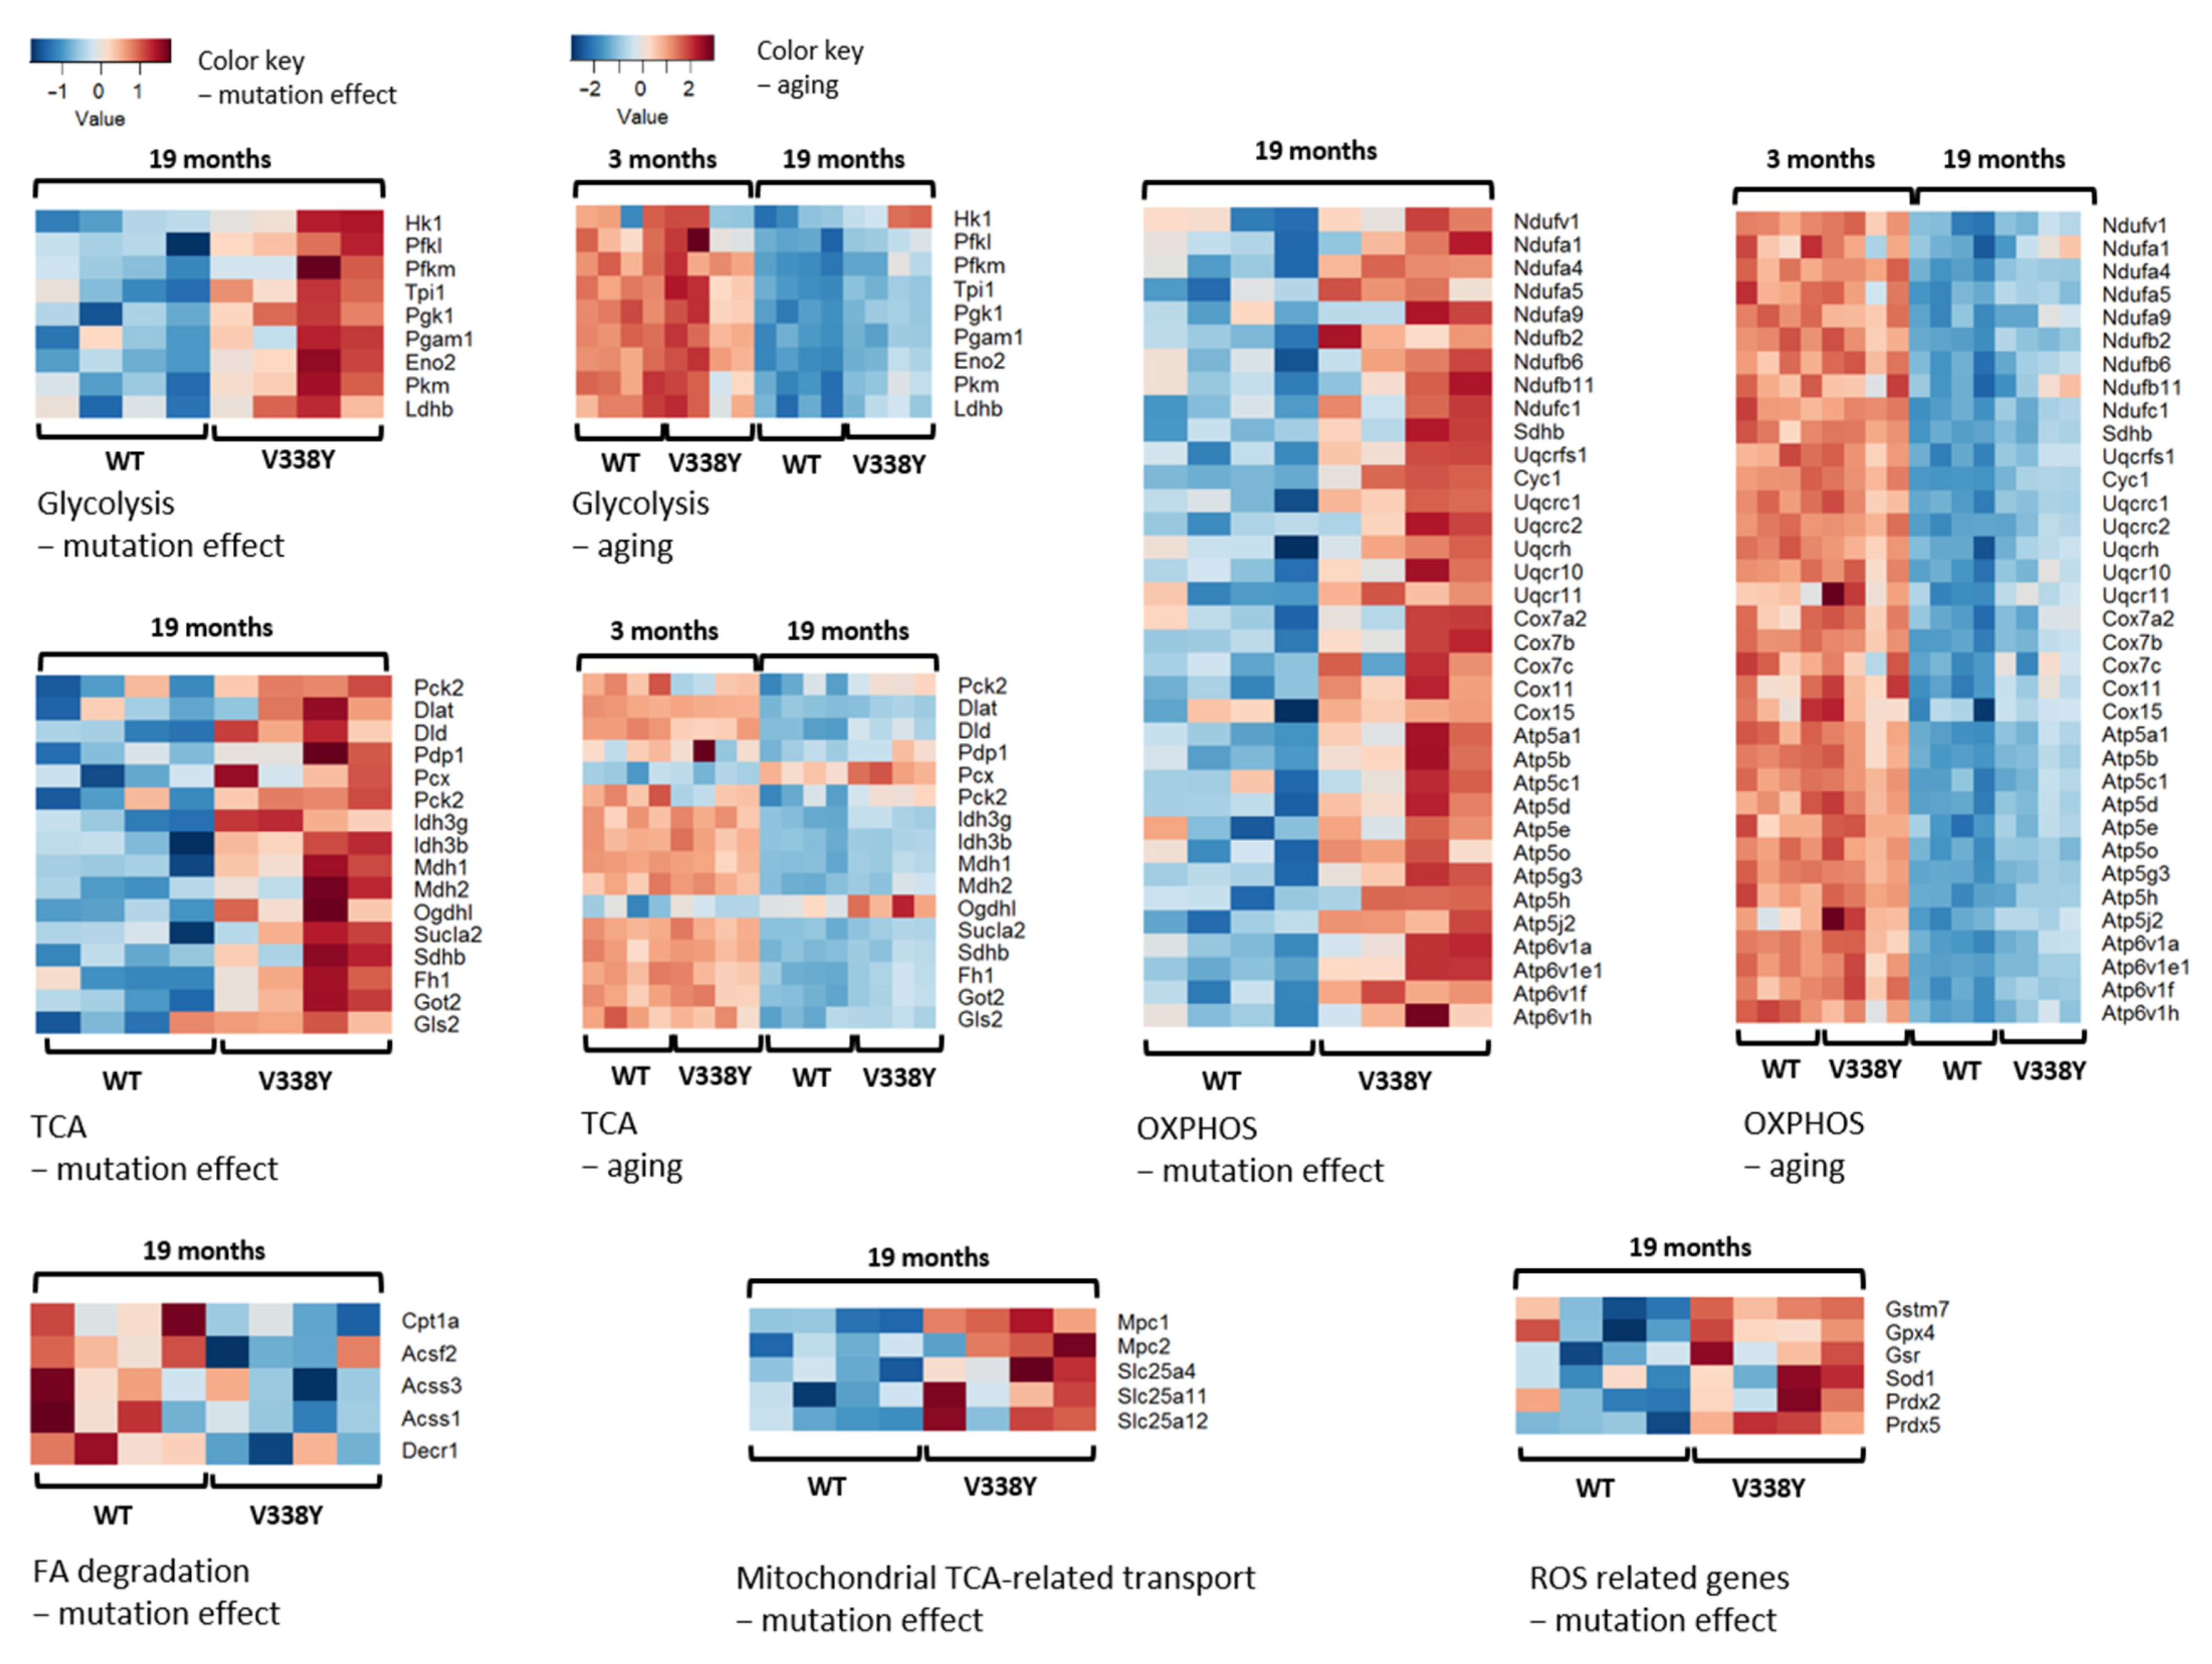
2.2. Mutation-Related Transcriptome Changes in 19-Month-Old Animals
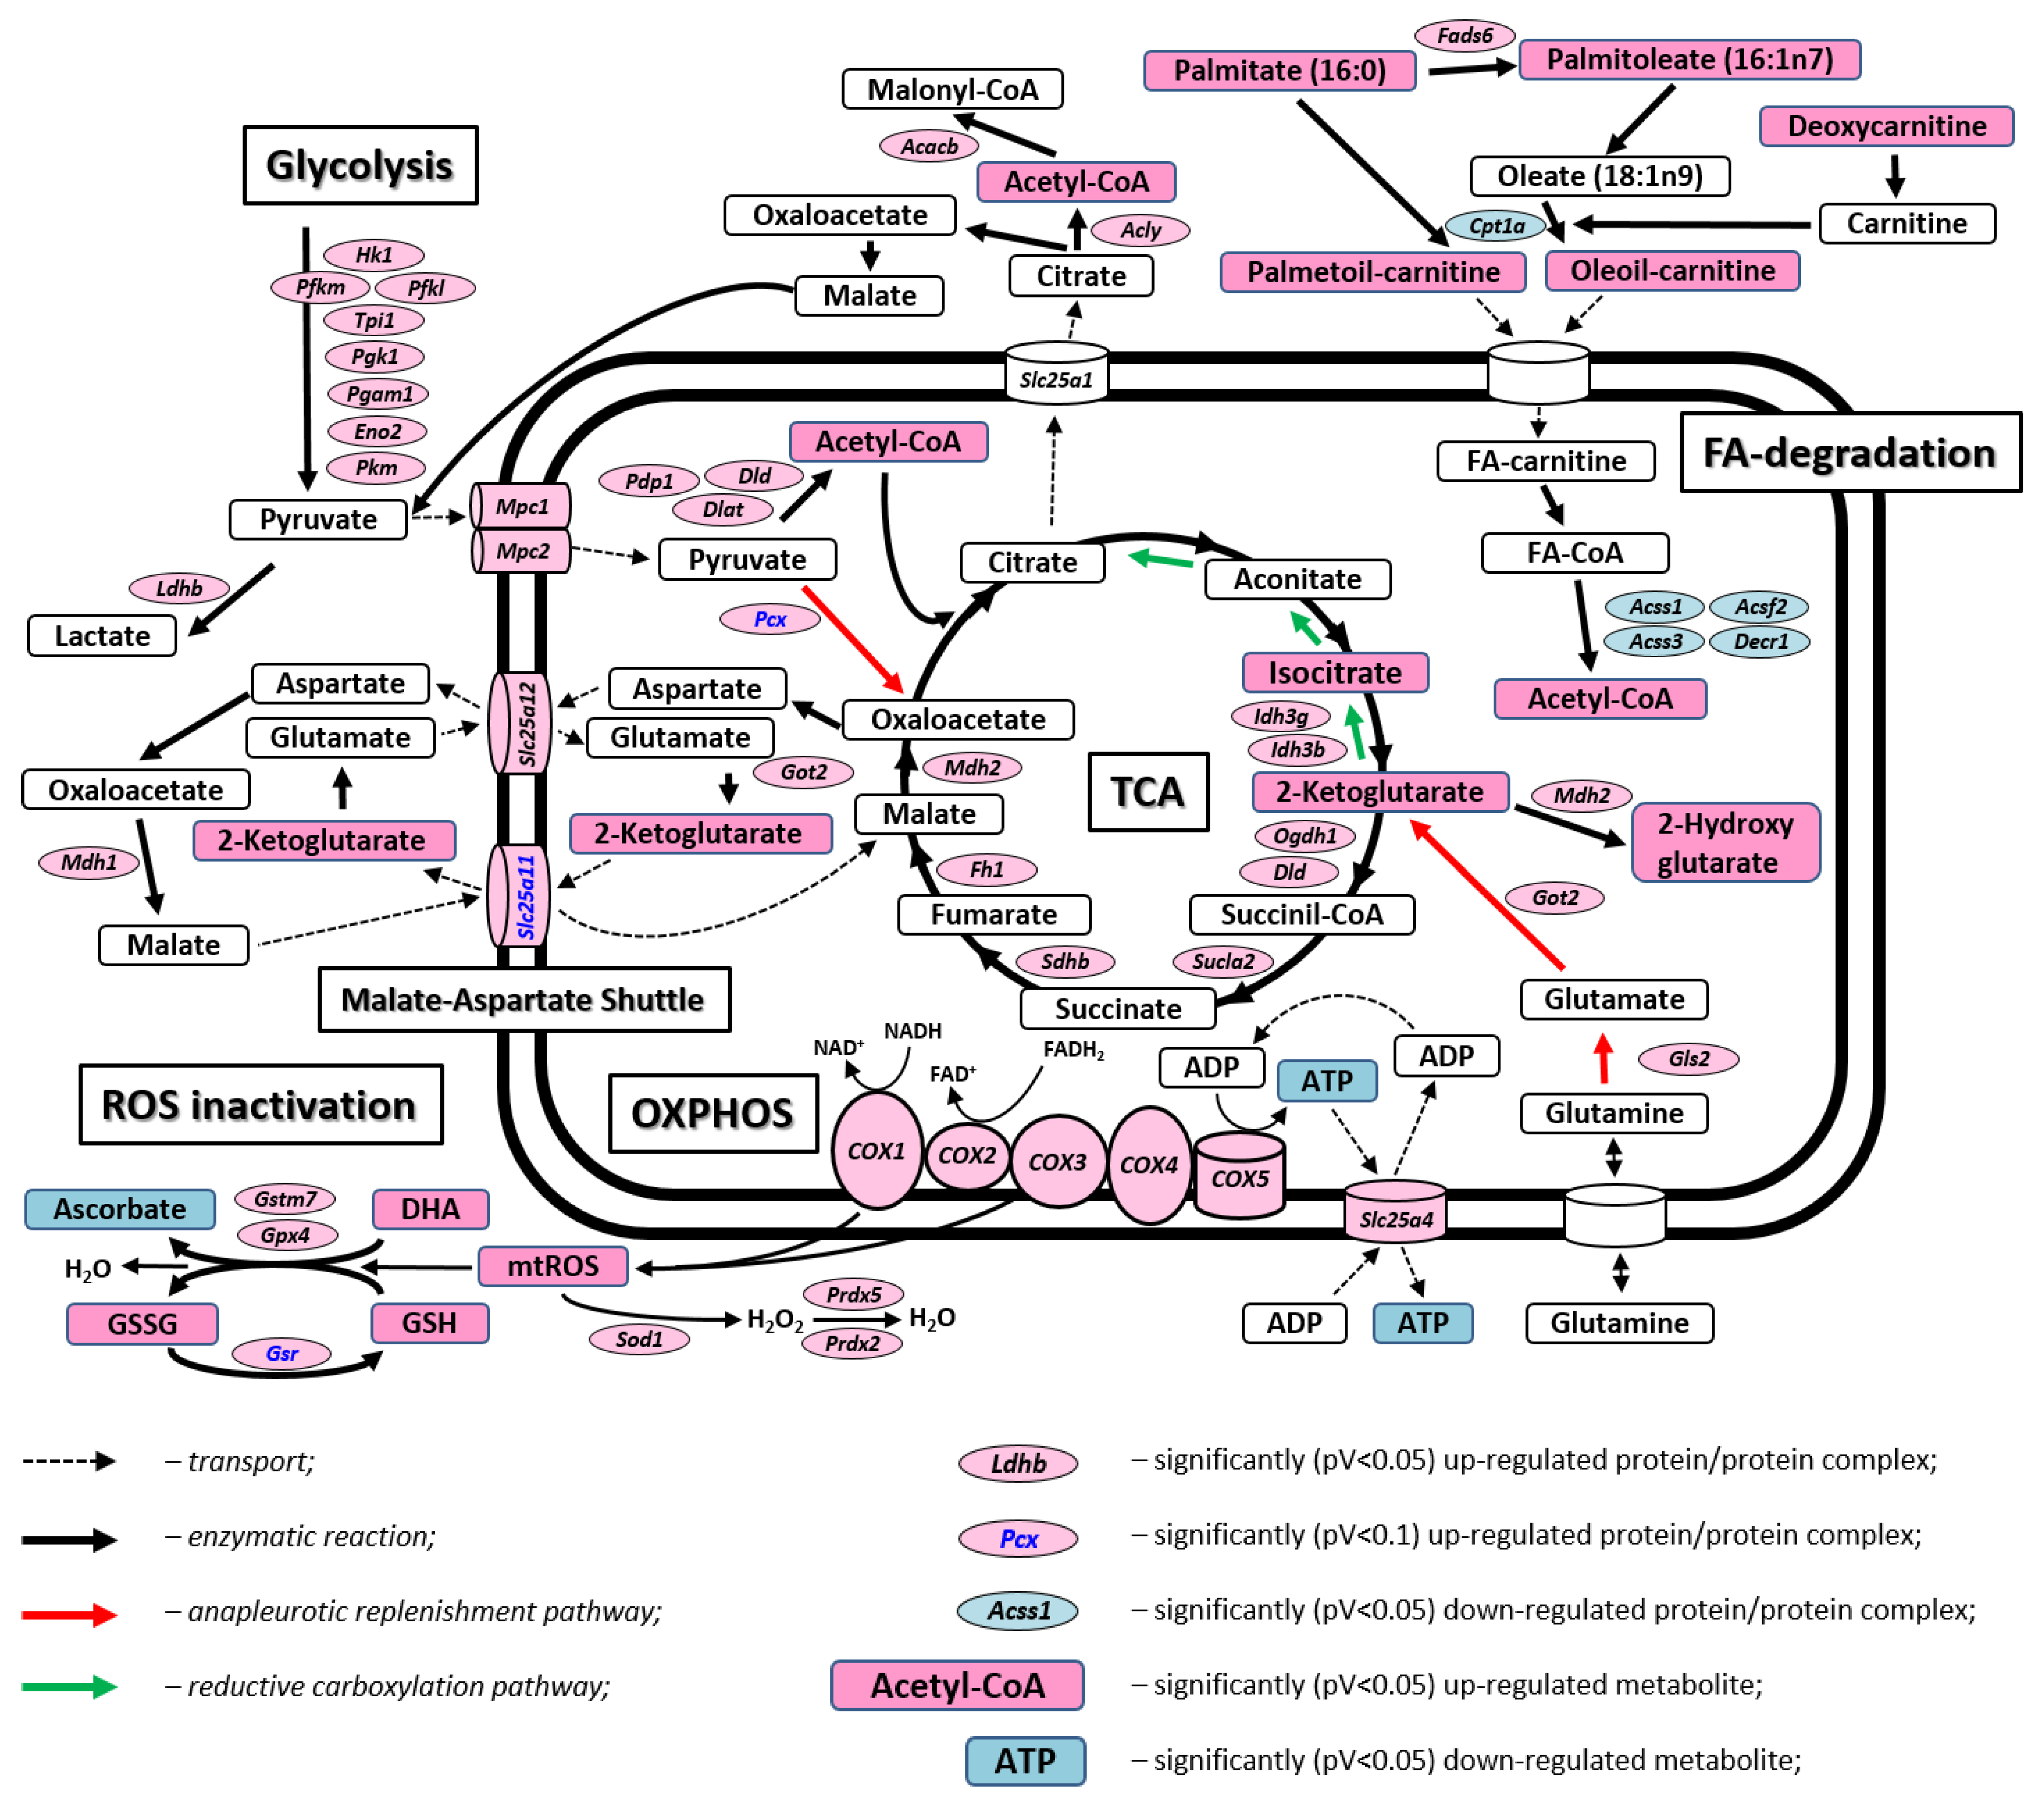
2.3. Mutation-Related Metabolic Changes in 19-Month-Old Animals
3. Discussion
4. Materials and Methods
4.1. Animals
4.2. RNA Extraction
4.3. cDNA Library Preparation and Sequencing
4.4. Transcriptome Data Analysis
4.5. qRT-PCR
4.6. Metabolome Analysis
4.7. Database Submission
Supplementary Materials
Author Contributions
Funding
Institutional Review Board Statement
Informed Consent Statement
Data Availability Statement
Acknowledgments
Conflicts of Interest
References
- Anderson, A.J.; Jackson, T.D.; Stroud, D.A.; Stojanovski, D. Mitochondria-hubs for regulating cellular biochemistry: Emerging concepts and networks. Open Biol. 2019, 9, 190126. [Google Scholar] [CrossRef] [Green Version]
- Vakifahmetoglu-Norberg, H.; Ouchida, A.T.; Norberg, E. The role of mitochondria in metabolism and cell death. Biochem. Biophys. Res. Commun. 2017, 482, 426–431. [Google Scholar] [CrossRef]
- Kasahara, A.; Scorrano, L. Mitochondria: From cell death executioners to regulators of cell differentiation. Trends Cell Biol. 2014, 24, 761–770. [Google Scholar] [CrossRef]
- Spinelli, J.B.; Haigis, M.C. The multifaceted contributions of mitochondria to cellular metabolism. Nat. Cell Biol. 2018, 20, 745–754. [Google Scholar] [CrossRef]
- Vafai, S.B.; Mootha, V.K. Mitochondrial disorders as windows into an ancient organelle. Nature 2012, 491, 374–383. [Google Scholar] [CrossRef] [PubMed]
- Javadov, S.; Kozlov, A.V.; Camara, A.K.S. Mitochondria in health and diseases. Cells 2020, 9, 1177. [Google Scholar] [CrossRef] [PubMed]
- Craven, L.; Alston, C.L.; Taylor, R.W.; Turnbull, D.M. Recent advances in mitochondrial disease. Annu. Rev. Genom. Hum. Genet. 2017, 18, 257–275. [Google Scholar] [CrossRef] [PubMed] [Green Version]
- Böttger, E.C.; Schacht, J. The mitochondrion: A perpetrator of acquired hearing loss. Hear. Res. 2013, 303, 12–19. [Google Scholar] [CrossRef] [PubMed] [Green Version]
- Bibb, M.J.; Van Etten, R.A.; Wright, C.T.; Walberg, M.W.; Clayton, D.A. Sequence and gene organization of mouse mitochondrial DNA. Cell 1981, 26, 167–180. [Google Scholar] [CrossRef]
- Szklarczyk, R.; Huynen, M.A. Mosaic origin of the mitochondrial proteome. Proteomics 2010, 10, 4012–4024. [Google Scholar] [CrossRef]
- Akbergenov, R.; Duscha, S.; Fritz, A.K.; Juskeviciene, R.; Oishi, N.; Schmitt, K.; Shcherbakov, D.; Teo, Y.; Boukari, H.; Freihofer, P.; et al. Mutant MRPS5 affects mitoribosomal accuracy and confers stress-related behavioral alterations. EMBO Rep. 2018, 19, e46193. [Google Scholar] [CrossRef] [PubMed]
- Kuleshov, M.V.; Jones, M.R.; Rouillard, A.D.; Fernandez, N.F.; Duan, Q.; Wang, Z.; Koplev, S.; Jenkins, S.L.; Jagodnik, K.M.; Lachmann, A.; et al. Enrichr: A comprehensive gene set enrichment analysis web server 2016 update. Nucleic Acids Res. 2016, 44, W90–W97. [Google Scholar] [CrossRef] [PubMed] [Green Version]
- de Magalhães, J.P.; Curado, J.; Church, G.M. Meta-analysis of age-related gene expression profiles identifies common signatures of aging. Bioinformatics 2009, 25, 875–881. [Google Scholar] [CrossRef] [Green Version]
- Mattson, M.P.; Arumugam, T.V. Hallmarks of brain aging: Adaptive and pathological modification by metabolic states. Cell Metab. 2018, 27, 1176–1199. [Google Scholar] [CrossRef] [Green Version]
- Sun, N.; Youle, R.J.; Finkel, T. The mitochondrial basis of aging. Mol. Cell 2016, 61, 654–666. [Google Scholar] [CrossRef] [Green Version]
- Kauppila, T.E.S.; Kauppila, J.H.K.; Larsson, N.G. Mammalian mitochondria and aging: An update. Cell Metab. 2017, 25, 57–71. [Google Scholar] [CrossRef] [PubMed]
- Oldham, W.M.; Clish, C.B.; Yang, Y.; Loscalzo, J. Hypoxia-mediated increases in L-2-hydroxyglutarate coordinate the metabolic response to reductive stress. Cell Metab. 2015, 22, 291–303. [Google Scholar] [CrossRef] [Green Version]
- Fendt, S.M.; Bell, E.L.; Keibler, M.A.; Olenchock, B.A.; Mayers, J.R.; Wasylenko, T.M.; Vokes, N.I.; Guarente, L.; Vander Heiden, M.G.; Stephanopoulos, G. Reductive glutamine metabolism is a function of the α-ketoglutarate to citrate ratio in cells. Nat. Commun. 2013, 4, 2236. [Google Scholar] [CrossRef] [Green Version]
- Agranoff, B.W.; Benjamins, J.A.; Hajra, A.K. Brain lipid biosynthesis. In Basic Neurochemistry: Molecular, Cellular and Medical Aspects, 6th ed.; Siegel, G.J., Agranoff, B.W., Albers, R.W., Eds.; Lippincott-Raven: Philadelphia, PA, USA, 1999. [Google Scholar]
- Ebert, D.; Haller, R.G.; Walton, M.E. Energy contribution of octanoate to intact rat brain metabolism measured by 13C nuclear magnetic resonance spectroscopy. J. Neurosci. 2003, 23, 5928–5935. [Google Scholar] [CrossRef] [Green Version]
- Gargus, J.J.; Boyle, K.; Bocian, M.; Roe, D.S.; Vianey-Saban, C.; Roe, C.R. Respiratory complex II defect in siblings associated with a symptomatic secondary block in fatty acid oxidation. J. Inherit. Metab. Dis. 2003, 26, 659–670. [Google Scholar] [CrossRef]
- Shcherbakov, D.; Duscha, S.; Juskeviciene, R.; Restelli, L.; Frank, S.; Laczko, E.; Böttger, E.C. Mitochondrial misreading in skeletal muscle accelerates metabolic aging and confers lipid accumulation and increased inflammation. RNA 2020, 27, 265–272. [Google Scholar] [CrossRef] [PubMed]
- Munkácsy, E.; Rea, S.L. The paradox of mitochondrial dysfunction and extended longevity. Exp. Gerontol. 2014, 56, 221–233. [Google Scholar] [CrossRef] [Green Version]
- Schulz, T.J.; Zarse, K.; Voigt, A.; Urban, N.; Birringer, M.; Ristow, M. Glucose restriction extends Caenorhabditis elegans life span by inducing mitochondrial respiration and increasing oxidative stress. Cell Metab. 2007, 6, 280–293. [Google Scholar] [CrossRef] [PubMed] [Green Version]
- Ristow, M.; Schmeisser, K. Mitohormesis: Promoting health and lifespan by increased levels of reactive oxygen species (ROS). Doseresponse 2014, 12, 288–341. [Google Scholar] [CrossRef]
- Bárcena, C.; Mayoral, P.; Quirós, P.M. Mitohormesis, an antiaging paradigm. Int. Rev. Cell Mol. Biol. 2018, 340, 35–77. [Google Scholar]
- Langmead, B.; Salzberg, S.L. Fast gapped-read alignment with Bowtie 2. Nat. Methods 2012, 9, 357–359. [Google Scholar] [CrossRef] [PubMed] [Green Version]
- Li, B.; Dewey, C.N. RSEM: Accurate transcript quantification from RNA-Seq data with or without a reference genome. BMC Bioinform. 2011, 12, 323. [Google Scholar] [CrossRef] [Green Version]
- Robinson, M.D.; McCarthy, D.J.; Smyth, G.K. EdgeR: A bioconductor package for differential expression analysis of digital gene expression data. Bioinformatics 2010, 26, 139–140. [Google Scholar] [CrossRef] [Green Version]
- Benjamini, Y.; Hochberg, Y. Controlling the false discovery rate: A practical and powerful approach to multiple testing. J. R. Stat. Soc. Ser. B 1995, 57, 289–300. [Google Scholar] [CrossRef]
- Culhane, A.C.; Thioulouse, J.; Perrière, G.; Higgins, D.G. MADE4: An R package for multivariate analysis of gene expression data. Bioinformatics 2005, 21, 2789–2790. [Google Scholar] [CrossRef] [Green Version]
- Kanehisa, M.; Sato, Y.; Furumichi, M.; Morishima, K.; Tanabe, M. New approach for understanding genome variations in KEGG. Nucleic Acids Res. 2019, 47, D590–D595. [Google Scholar] [CrossRef] [PubMed] [Green Version]
- Slenter, D.N.; Kutmon, M.; Hanspers, K.; Riutta, A.; Windsor, J.; Nunes, N.; Mélius, J.; Cirillo, E.; Coort, S.L.; Digles, D.; et al. WikiPathways: A multifaceted pathway database bridging metabolomics to other omics research. Nucleic Acids Res. 2018, 46, D661–D667. [Google Scholar] [CrossRef]
- Harris, M.A.; Clark, J.; Ireland, A.; Lomax, J.; Ashburner, M.; Foulger, R.; Eilbeck, K.; Lewis, S.; Marshall, B.; Mungall, C.; et al. The gene ontology (GO) database and informatics resource. Nucleic Acids Res. 2004, 32, D258–D261. [Google Scholar] [PubMed] [Green Version]
- Xu, D.; Liu, A.; Wang, X.; Zhang, M.; Zhang, Z.; Tan, Z.; Qiu, M. Identifying suitable reference genes for developing and injured mouse CNS tissues. Dev. Neurobiol. 2018, 78, 39–50. [Google Scholar] [CrossRef] [PubMed]
- Cheung, T.T.; Weston, M.K.; Wilson, M.J. Selection and evaluation of reference genes for analysis of mouse (Mus musculus) sex-dimorphic brain development. PeerJ 2017, 5, e2909. [Google Scholar] [CrossRef] [PubMed] [Green Version]
- Pfaffl, M.W. Quantification strategies in real-time PCR. In A-Z of Quantitative PCR; Bustin, S.A., Ed.; International University Line: San Diego, CA, USA, 2004; Chapter 3; pp. 87–112. [Google Scholar]


| Gene Name | Fold Change | p-Value | |
|---|---|---|---|
| Glycolysis | |||
| hexokinase 1 | Hk1 | 1.07 | 2.09 × 10⁻² |
| hexokinase 3 | Hk3 | 0.79 | 2.41 × 10⁻² |
| phosphofructokinase, liver, B-type | Pfkl | 1.09 | 5.27 × 10⁻³ |
| phosphofructokinase, muscle | Pfkm | 1.08 | 1.22 × 10⁻² |
| triosephosphate isomerase 1 | Tpi1 | 1.09 | 6.05 × 10⁻³ |
| phosphoglycerate kinase 1 | Pgk1 | 1.08 | 1.24 × 10⁻² |
| phosphoglycerate mutase 1 | Pgam1 | 1.10 | 9.78 × 10⁻³ |
| enolase 2 | Eno2 | 1.12 | 2.63 × 10⁻⁴ |
| pyruvate kinase, muscle | Pkm | 1.10 | 3.32 × 10⁻³ |
| lactate dehydrogenase B | Ldhb | 1.07 | 2.75 × 10⁻² |
| Mitochondrial transporters | |||
| mitochondrial pyruvate carrier 1 | Mpc1 | 1.19 | 2.42 × 10⁻⁵ |
| mitochondrial pyruvate carrier 2 | Mpc2 | 1.08 | 3.99 × 10⁻² |
| solute carrier family 25 member 4 (mitochondrial ATP/ADP translocator) | Slc25a4 | 1.10 | 2.70 × 10⁻³ |
| solute carrier family 25 member 12 (mitochondrial aspartate/glutamate antiporter Aralar) | Slc25a12 | 1.07 | 2.54 × 10⁻² |
| TCA and related processes | |||
| dihydrolipoamide S-acetyltransferase (component of pyruvate dehydrogenase complex) | Dlat | 1.07 | 4.00 × 10⁻² |
| dihydrolipoamide dehydrogenase | Dld | 1.16 | 1.17 × 10⁻⁵ |
| pyruvate dehyrogenase phosphatase catalytic subunit 1 | Pdp1 | 1.08 | 1.73 × 10⁻² |
| isocitrate dehydrogenase 3 (NAD+), gamma | Idh3g | 1.10 | 4.79 × 10⁻³ |
| isocitrate dehydrogenase 3 (NAD+) beta | Idh3b | 1.07 | 2.53 × 10⁻² |
| malate dehydrogenase 1, NAD (cytosolic) | Mdh1 | 1.13 | 1.42 × 10⁻⁴ |
| malate dehydrogenase 2, NAD (mitochondrial) | Mdh2 | 1.08 | 8.42 × 10⁻³ |
| oxoglutarate dehydrogenase-like (mitochondrial) | Ogdhl | 1.10 | 1.56 × 10⁻³ |
| succinate-Coenzyme A ligase, ADP-forming, beta subunit | Sucla2 | 1.07 | 2.56 × 10⁻² |
| succinate dehydrogenase complex, subunit B | Sdhb | 1.07 | 3.86 × 10⁻² |
| fumarate hydratase 1 | Fh1 | 1.08 | 3.16 × 10⁻² |
| glutamate oxaloacetate transaminase 2 (mitochondrial) | Got2 | 1.13 | 1.05 × 10⁻⁴ |
| ATP citrate lyase | Acly | 1.09 | 4.38 × 10⁻³ |
| acetyl-Coenzyme A carboxylase beta | Acacb | 1.23 | 4.84 × 10⁻⁵ |
| Fatty acid transport and degradation | |||
| carnitine palmitoyltransferase 1a, liver | Cpt1a | 0.90 | 2.77 × 10⁻³ |
| acyl-CoA synthetase family member 2 | Acsf2 | 0.80 | 1.61 × 10⁻³ |
| acyl-CoA synthetase short-chain family member 3 | Acss3 | 0.82 | 3.30 × 10⁻² |
| acyl-CoA synthetase short-chain family member 1 | Acss1 | 0.91 | 4.41 × 10⁻² |
| 2,4-dienoyl CoA reductase 1, mitochondrial | Decr1 | 0.89 | 1.20 × 10⁻² |
| Glutathione metabolism and ROS | |||
| glutathione S-transferase, mu7 | Gstm7 | 1.15 | 2.43 × 10⁻² |
| glutathione peroxidase 4 | Gpx4 | 1.07 | 3.82 × 10⁻² |
| superoxide dismutase 1, cytosolic | Sod1 | 1.07 | 3.84 × 10⁻² |
| peroxiredoxin 5 | Prdx5 | 1.17 | 1.32 × 10⁻⁶ |
| peroxiredoxin 2 | Prdx2 | 1.09 | 5.83 × 10⁻³ |
| Metabolite | Fold Change (19M MRPS5V338Y/V338Y vs. MRPS5WT/WT) | p-Value (Welch’s t-Test) |
|---|---|---|
| TCA | ||
| alpha-ketoglutarate | 1.19 | 0.003 |
| isocitrate | 1.69 | 0.004 |
| acetyl CoA | 1.38 | 0.014 |
| FA degradation | ||
| deoxycarnitine | 1.21 | 0.096 |
| acetylcarnitine | 1.38 | 0.028 |
| oleoylcarnitine | 1.80 | 0.056 |
| palmitoylcarnitine | 1.60 | 0.098 |
| Ascorbate metabolism | ||
| dehydroascorbate | 1.21 | 0.050 |
| ascorbate (Vitamin C) | 0.44 | 0.062 |
| Glutathione metabolism | ||
| glutathione, oxidized (GSSG) | 1.92 | 0.003 |
| glutathione, reduced (GSH) | 1.39 | 0.048 |
Publisher’s Note: MDPI stays neutral with regard to jurisdictional claims in published maps and institutional affiliations. |
© 2021 by the authors. Licensee MDPI, Basel, Switzerland. This article is an open access article distributed under the terms and conditions of the Creative Commons Attribution (CC BY) license (http://creativecommons.org/licenses/by/4.0/).
Share and Cite
Shcherbakov, D.; Juskeviciene, R.; Cortés Sanchón, A.; Brilkova, M.; Rehrauer, H.; Laczko, E.; Böttger, E.C. Mitochondrial Mistranslation in Brain Provokes a Metabolic Response Which Mitigates the Age-Associated Decline in Mitochondrial Gene Expression. Int. J. Mol. Sci. 2021, 22, 2746. https://0-doi-org.brum.beds.ac.uk/10.3390/ijms22052746
Shcherbakov D, Juskeviciene R, Cortés Sanchón A, Brilkova M, Rehrauer H, Laczko E, Böttger EC. Mitochondrial Mistranslation in Brain Provokes a Metabolic Response Which Mitigates the Age-Associated Decline in Mitochondrial Gene Expression. International Journal of Molecular Sciences. 2021; 22(5):2746. https://0-doi-org.brum.beds.ac.uk/10.3390/ijms22052746
Chicago/Turabian StyleShcherbakov, Dimitri, Reda Juskeviciene, Adrián Cortés Sanchón, Margarita Brilkova, Hubert Rehrauer, Endre Laczko, and Erik C. Böttger. 2021. "Mitochondrial Mistranslation in Brain Provokes a Metabolic Response Which Mitigates the Age-Associated Decline in Mitochondrial Gene Expression" International Journal of Molecular Sciences 22, no. 5: 2746. https://0-doi-org.brum.beds.ac.uk/10.3390/ijms22052746