
Identification of a Minimal 3-Transcript Signature to Differentiate Viral from Bacterial Infection from Best Genome-Wide Host RNA Biomarkers: A Multi-Cohort Analysis

 , ,
, ,  ,
,  and
and 
Abstract
:1. Introduction
2. Results
3. Discussion
4. Conclusions
5. Material and Methods
5.1. Sample Groups
5.2. Data Processing and Statistical Analysis
Supplementary Materials
Author Contributions
Funding
Institutional Review Board Statement
Informed Consent Statement
Data Availability Statement
Acknowledgments
Conflicts of Interest
References
- Martinón-Torres, F.; Salas, A.; Rivero-Calle, I.; Cebey-López, M.; Pardo-Seco, J.; Herberg, J.A.; Boeddha, N.P.; Klobassa, D.S.; Secka, F.; Paulus, S. Life-threatening infections in children in Europe (the EUCLIDS Project): A prospective cohort study. Lancet Child Adolesc. Health 2018, 2, 404–414. [Google Scholar] [CrossRef]
- Hall, C.B.; Weinberg, G.A.; Iwane, M.K.; Blumkin, A.K.; Edwards, K.M.; Staat, M.A.; Auinger, P.; Griffin, M.R.; Poehling, K.A.; Erdman, D. The burden of respiratory syncytial virus infection in young children. N. Engl. J. Med. 2009, 360, 588–598. [Google Scholar] [CrossRef] [PubMed] [Green Version]
- Le Doare, K.; Nichols, A.-L.; Payne, H.; Wells, R.; Navidnia, S.; Appleby, G.; Calton, E.; Sharland, M.; Ladhani, S.N.; Network, C. Very low rates of culture-confirmed invasive bacterial infections in a prospective 3-year population-based surveillance in Southwest London. Arch. Dis. Child. 2014, 99, 526–531. [Google Scholar] [CrossRef] [PubMed]
- Herberg, J.A.; Kaforou, M.; Wright, V.J.; Shailes, H.; Eleftherohorinou, H.; Hoggart, C.J.; Cebey-López, M.; Carter, M.J.; Janes, V.A.; Gormley, S. Diagnostic test accuracy of a 2-transcript host RNA signature for discriminating bacterial vs viral infection in febrile children. JAMA 2016, 316, 835–845. [Google Scholar] [CrossRef] [Green Version]
- Barral-Arca, R.; Pardo-Seco, J.; Martinon-Torres, F.; Salas, A. A 2-transcript host cell signature distinguishes viral from bacterial diarrhea and it is influenced by the severity of symptoms. Sci. Rep. 2018, 8, 1–7. [Google Scholar] [CrossRef] [PubMed]
- Gómez-Carballa, A.; Cebey-López, M.; Pardo-Seco, J.; Barral-Arca, R.; Rivero-Calle, I.; Pischedda, S.; Currás-Tuala, M.J.; Gómez-Rial, J.; Barros, F.; Martinón-Torres, F. A qPCR expression assay of IFI44L gene differentiates viral from bacterial infections in febrile children. Sci. Rep. 2019, 9, 1–12. [Google Scholar] [CrossRef] [PubMed] [Green Version]
- Chu, D.K.; Pan, Y.; Cheng, S.; Hui, K.P.; Krishnan, P.; Liu, Y.; Ng, D.Y.; Wan, C.K.; Yang, P.; Wang, Q. Molecular diagnosis of a novel coronavirus (2019-nCoV) causing an outbreak of pneumonia. Clin. Chem. 2020, 66, 549–555. [Google Scholar] [CrossRef] [Green Version]
- Mahony, J.B. Detection of respiratory viruses by molecular methods. Clin. Microbiol. Rev. 2008, 21, 716–747. [Google Scholar] [CrossRef] [Green Version]
- Ramilo, O.; Mejías, A. Shifting the paradigm: Host gene signatures for diagnosis of infectious diseases. Cell Host Microbe 2009, 6, 199–200. [Google Scholar] [CrossRef] [Green Version]
- Gliddon, H.D.; Herberg, J.A.; Levin, M.; Kaforou, M. Genome-wide host RNA signatures of infectious diseases: Discovery and clinical translation. Immunology 2018, 153, 171–178. [Google Scholar] [CrossRef] [Green Version]
- Cebey-López, M.; Salas, A. Recognising the asymptomatic enemy. Lancet Infect. Dis. 2021, 21, 305–306. [Google Scholar] [CrossRef]
- Mejias, A.; Dimo, B.; Suarez, N.M.; Garcia, C.; Suarez-Arrabal, M.C.; Jartti, T.; Blankenship, D.; Jordan-Villegas, A.; Ardura, M.I.; Xu, Z.; et al. Whole blood gene expression profiles to assess pathogenesis and disease severity in infants with respiratory syncytial virus infection. PLoS Med. 2013, 10, e1001549. [Google Scholar] [CrossRef] [PubMed] [Green Version]
- Berry, M.P.; Graham, C.M.; McNab, F.W.; Xu, Z.; Bloch, S.A.; Oni, T.; Wilkinson, K.A.; Banchereau, R.; Skinner, J.; Wilkinson, R.J.; et al. An interferon-inducible neutrophil-driven blood transcriptional signature in human tuberculosis. Nature 2010, 466, 973–977. [Google Scholar] [CrossRef] [PubMed] [Green Version]
- Zak, D.E.; Penn-Nicholson, A.; Scriba, T.J.; Thompson, E.; Suliman, S.; Amon, L.M.; Mahomed, H.; Erasmus, M.; Whatney, W.; Hussey, G.D.; et al. A blood RNA signature for tuberculosis disease risk: A prospective cohort study. Lancet 2016, 387, 2312–2322. [Google Scholar] [CrossRef] [Green Version]
- Kaforou, M.; Herberg, J.A.; Wright, V.J.; Coin, L.J.M.; Levin, M. Diagnosis of bacterial infection using a 2-transcript host RNA signature in febrile infants 60 days or younger. JAMA 2017, 317, 1577–1578. [Google Scholar] [CrossRef] [PubMed]
- Bhattacharya, S.; Rosenberg, A.F.; Peterson, D.R.; Grzesik, K.; Baran, A.M.; Ashton, J.M.; Gill, S.R.; Corbett, A.M.; Holden-Wiltse, J.; Topham, D.J.; et al. Transcriptomic biomarkers to discriminate bacterial from nonbacterial infection in adults hospitalized with respiratory illness. Sci. Rep. 2017, 7, 6548. [Google Scholar] [CrossRef]
- Sampson, D.L.; Fox, B.A.; Yager, T.D.; Bhide, S.; Cermelli, S.; McHugh, L.C.; Seldon, T.A.; Brandon, R.A.; Sullivan, E.; Zimmerman, J.J.; et al. A Four-Biomarker Blood Signature Discriminates Systemic Inflammation Due to Viral Infection Versus Other Etiologies. Sci. Rep. 2017, 7, 2914. [Google Scholar] [CrossRef]
- Barral-Arca, R.; Gómez-Carballa, A.; Cebey-López, M.; Bello, X.; Martinón-Torres, F.; Salas, A. A meta-analysis of multiple whole blood gene expression data unveils a diagnostic host-response transcript signature for respiratory syncytial virus. Int. J. Mol. Sci. 2020, 21, 1831. [Google Scholar] [CrossRef] [PubMed] [Green Version]
- Mahajan, P.; Kuppermann, N.; Mejias, A.; Suarez, N.; Chaussabel, D.; Casper, T.C.; Smith, B.; Alpern, E.R.; Anders, J.; Atabaki, S.M.; et al. Association of RNA biosignatures with bacterial infections in febrile infants aged 60 days or younger. JAMA 2016, 316, 846–857. [Google Scholar] [CrossRef]
- Sweeney, T.E.; Braviak, L.; Tato, C.M.; Khatri, P. Genome-wide expression for diagnosis of pulmonary tuberculosis: A multicohort analysis. Lancet. Respir. Med. 2016, 4, 213–224. [Google Scholar] [CrossRef] [Green Version]
- DeBerg, H.A.; Zaidi, M.B.; Altman, M.C.; Khaenam, P.; Gersuk, V.H.; Campos, F.D.; Perez-Martinez, I.; Meza-Segura, M.; Chaussabel, D.; Banchereau, J. Shared and organism-specific host responses to childhood diarrheal diseases revealed by whole blood transcript profiling. PLoS ONE 2018, 13, e0192082. [Google Scholar] [CrossRef] [Green Version]
- Ramilo, O.; Allman, W.; Chung, W.; Mejias, A.; Ardura, M.; Glaser, C.; Wittkowski, K.M.; Piqueras, B.; Banchereau, J.; Palucka, A.K. Gene expression patterns in blood leukocytes discriminate patients with acute infections. Blood 2007, 109, 2066–2077. [Google Scholar] [CrossRef] [PubMed] [Green Version]
- Parnell, G.; McLean, A.; Booth, D.; Huang, S.; Nalos, M.; Tang, B. Aberrant cell cycle and apoptotic changes characterise severe influenza A infection–a meta-analysis of genomic signatures in circulating leukocytes. PLoS ONE 2011, 6, e17186. [Google Scholar] [CrossRef] [PubMed]
- Parnell, G.P.; McLean, A.S.; Booth, D.R.; Armstrong, N.J.; Nalos, M.; Huang, S.J.; Manak, J.; Tang, W.; Tam, O.-Y.; Chan, S. A distinct influenza infection signature in the blood transcriptome of patients with severe community-acquired pneumonia. Crit. Care 2012, 16, R157. [Google Scholar] [CrossRef] [Green Version]
- Hu, X.; Yu, J.; Crosby, S.D.; Storch, G.A. Gene expression profiles in febrile children with defined viral and bacterial infection. Proc. Natl. Acad. Sci. USA 2013, 110, 12792–12797. [Google Scholar] [CrossRef] [PubMed] [Green Version]
- Herberg, J.A.; Kaforou, M.; Gormley, S.; Sumner, E.R.; Patel, S.; Jones, K.D.; Paulus, S.; Fink, C.; Martinon-Torres, F.; Montana, G. Transcriptomic profiling in childhood H1N1/09 influenza reveals reduced expression of protein synthesis genes. J. Infect. Dis. 2013, 208, 1664–1668. [Google Scholar] [CrossRef] [PubMed] [Green Version]
- Dickinson, P.; Smith, C.L.; Forster, T.; Craigon, M.; Ross, A.J.; Khondoker, M.R.; Ivens, A.; Lynn, D.J.; Orme, J.; Jackson, A. Whole blood gene expression profiling of neonates with confirmed bacterial sepsis. Genom. Data 2015, 3, 41–48. [Google Scholar] [CrossRef] [PubMed] [Green Version]
- Suarez, N.M.; Bunsow, E.; Falsey, A.R.; Walsh, E.E.; Mejias, A.; Ramilo, O. Superiority of transcriptional profiling over procalcitonin for distinguishing bacterial from viral lower respiratory tract infections in hospitalized adults. J. Infect. Dis. 2015, 212, 213–222. [Google Scholar] [CrossRef] [Green Version]
- Tsalik, E.L.; Henao, R.; Nichols, M.; Burke, T.; Ko, E.R.; McClain, M.T.; Hudson, L.L.; Mazur, A.; Freeman, D.H.; Veldman, T. Host gene expression classifiers diagnose acute respiratory illness etiology. Sci. Transl. Med. 2016, 8, ra311–ra322. [Google Scholar] [CrossRef] [Green Version]
- Hsiang, T.Y.; Zhao, C.; Krug, R.M. Interferon-induced ISG15 conjugation inhibits influenza A virus gene expression and replication in human cells. J. Virol. 2009, 83, 5971–5977. [Google Scholar] [CrossRef] [Green Version]
- Kuang, Z.; Seo, E.J.; Leis, J. Mechanism of inhibition of retrovirus release from cells by interferon-induced gene ISG15. J. Virol. 2011, 85, 7153–7161. [Google Scholar] [CrossRef] [PubMed] [Green Version]
- Okumura, A.; Pitha, P.M.; Harty, R.N. ISG15 inhibits Ebola VP40 VLP budding in an L-domain-dependent manner by blocking Nedd4 ligase activity. Proc. Natl. Acad. Sci. USA 2008, 105, 3974–3979. [Google Scholar] [CrossRef] [PubMed] [Green Version]
- Vivekanandan, P.; Daniel, H.D.; Kannangai, R.; Martinez-Murillo, F.; Torbenson, M. Hepatitis B virus replication induces methylation of both host and viral DNA. J. Virol. 2010, 84, 4321–4329. [Google Scholar] [CrossRef] [Green Version]
- Laurson, J.; Khan, S.; Chung, R.; Cross, K.; Raj, K. Epigenetic repression of E-cadherin by human papillomavirus 16 E7 protein. Carcinogenesis 2010, 31, 918–926. [Google Scholar] [CrossRef] [PubMed] [Green Version]
- Tolg, C.; Sabha, N.; Cortese, R.; Panchal, T.; Ahsan, A.; Soliman, A.; Aitken, K.J.; Petronis, A.; Bagli, D.J. Uropathogenic E. coli infection provokes epigenetic downregulation of CDKN2A (p16INK4A) in uroepithelial cells. Lab. Investig. 2011, 91, 825–836. [Google Scholar] [CrossRef] [PubMed] [Green Version]
- Barral-Arca, R.; Gomez-Carballa, A.; Cebey-Lopez, M.; Curras-Tuala, M.J.; Pischedda, S.; Viz-Lasheras, S.; Bello, X.; Martinon-Torres, F.; Salas, A. RNA-Seq Data-Mining Allows the Discovery of Two Long Non-Coding RNA Biomarkers of Viral Infection in Humans. Int. J. Mol. Sci. 2020, 21, 2748. [Google Scholar] [CrossRef] [Green Version]
- Morey, J.S.; Ryan, J.C.; Van Dolah, F.M. Microarray validation: Factors influencing correlation between oligonucleotide microarrays and real-time PCR. Biol. Proced. Online 2006, 8, 175–193. [Google Scholar] [CrossRef] [PubMed] [Green Version]
- Du, P.; Kibbe, W.A.; Lin, S.M. lumi: A pipeline for processing Illumina microarray. Bioinformatics 2008, 24, 1547–1548. [Google Scholar] [CrossRef] [Green Version]
- Bumgarner, R. Overview of DNA microarrays: Types, applications, and their future. Curr. Protoc. Mol. Biol. 2013, 101. [Google Scholar] [CrossRef] [Green Version]
- Hoggart, C.J. PRReMS: Parallel Regularised Regression Model Search for bio-signature discovery. bioRxiv 2018, 355479. [Google Scholar] [CrossRef]
- Robin, X.; Turck, N.; Hainard, A.; Tiberti, N.; Lisacek, F.; Sanchez, J.-C.; Müller, M. pROC: An open-source package for R and S+ to analyze and compare ROC curves. Bmc Bioinform. 2011, 12, 77. [Google Scholar] [CrossRef] [PubMed]
- Yu, G.; Wang, L.G.; Han, Y.; He, Q.Y. clusterProfiler: An R package for comparing biological themes among gene clusters. Omics J. Integr. Biol. 2012, 16, 284–287. [Google Scholar] [CrossRef] [PubMed]
- Yu, G. enrichplot: Visualization of Functional Enrichment Result; R Package Version 1.6.1. 2019. Available online: https://rdrr.io/bioc/enrichplot/ (accessed on 11 March 2021).
- Gu, Z.; Eils, R.; Schlesner, M. Complex heatmaps reveal patterns and correlations in multidimensional genomic data. Bioinformatics 2016, 32, 2847–2849. [Google Scholar] [CrossRef] [PubMed] [Green Version]


| GEO ID | n (Virus) | n (Bacteria) | Platform Description | Cohort | Source | Reference |
|---|---|---|---|---|---|---|
| GSE69529 | 80 | 140 | HiSeq 2500 (I); RNA-seq | C | WB | [21] |
| GSE64456 | 190 | 89 | HT12 V4 (I); MA | C | WB | [19] |
| GSE72829 | 92 | 52 | HT12 V3 (I); MA | C | WB | [4] |
| GSE6269 | 8 | 16 | HG U133A Array (A); MA | C | PBMCs | [22] |
| GSE20346 | 19 | 26 | HT-12 V3 (I); MA | A | WB | [23] |
| GSE40012 | 39 | 61 | HT-12 V3 (I); MA | A | WB | [24] |
| GSE40396 | 35 | 8 | HT-12 V4 (I); MA | C | WB | [25] |
| GSE42026 | 41 | 18 | HT-12 V3 (I); MA | C | WB | [26] |
| GSE25504 | 3 | 9 | HG U133 Plus 2.0 Array (A); MA | C | WB | [27] |
| GSE60244 | 71 | 22 | HT-12 V4 (I); MA | A | WB | [28] |
| GSE63990 | 117 | 73 | HG U133 Plus 2.0 Array (I); MA | A/C | WB | [29] |
| Totals | 695 | 514 |
| Study | Thresholds | Sensitivity | Specificity | AUC | 95% CI |
|---|---|---|---|---|---|
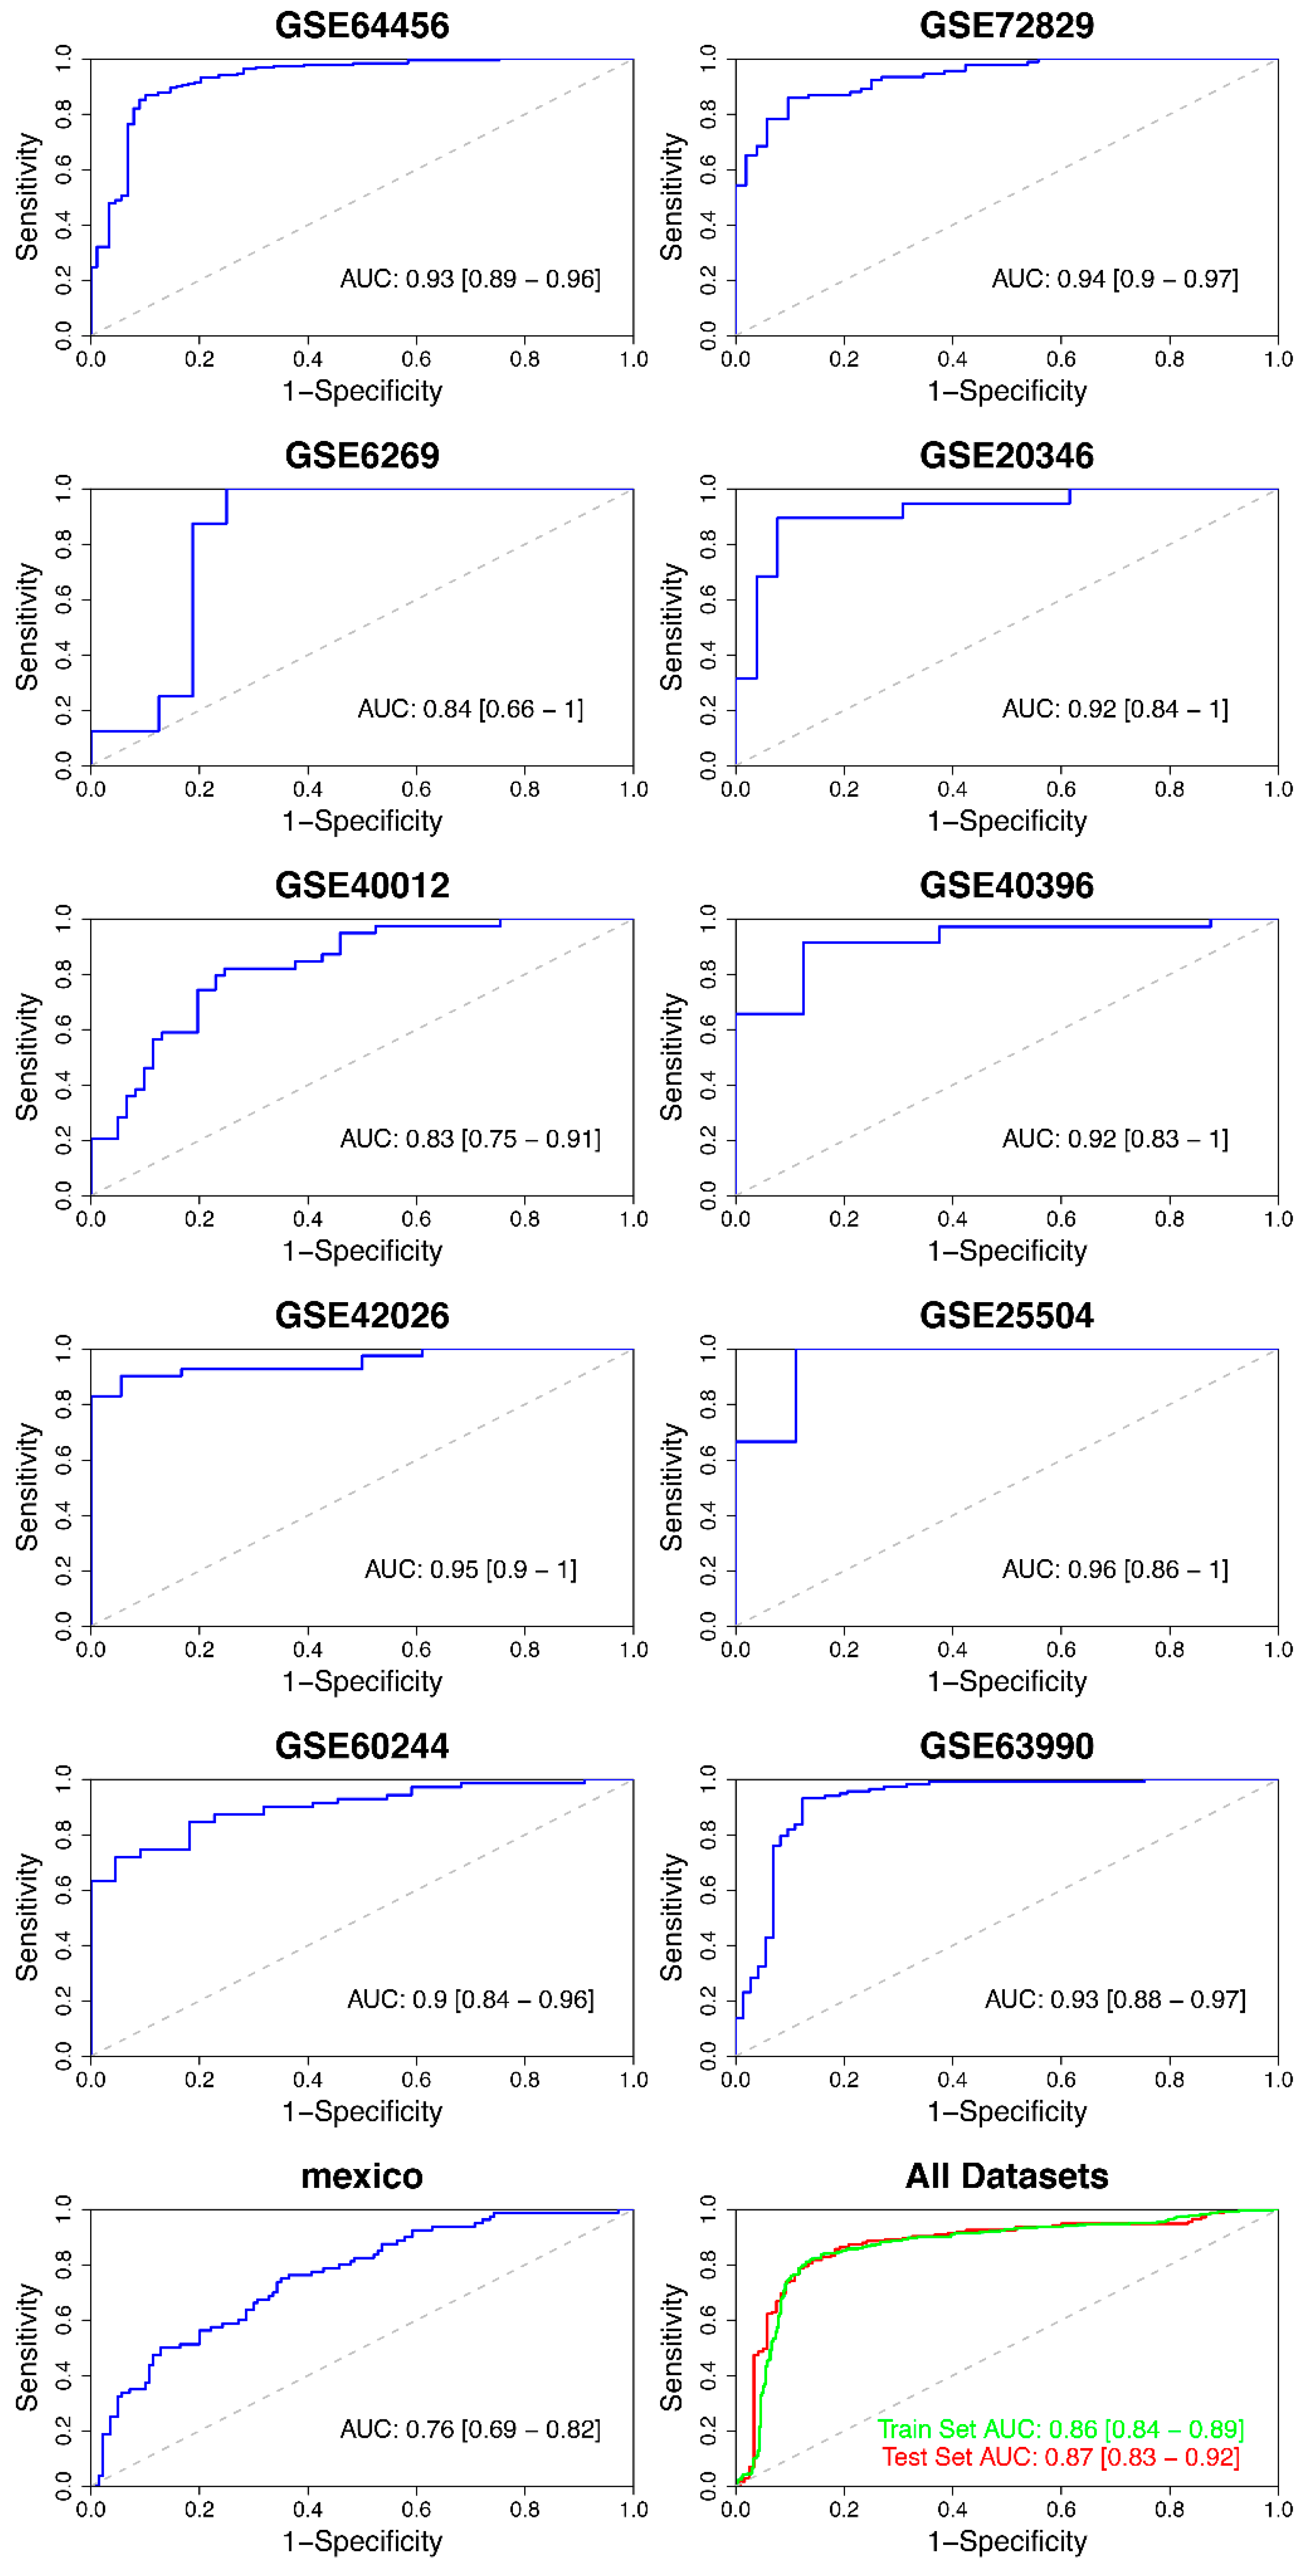
| GSE64456 | 10.80 | 0.87 | 0.90 | 0.93 | 0.89–0.96 |
| GSE72829 | 2.96 | 0.86 | 0.90 | 0.94 | 0.90–0.97 |
| GSE6269 | 12.49 | 1.00 | 0.75 | 0.84 | 0.66–1.00 |
| GSE20346 | 7.00 | 0.89 | 0.92 | 0.92 | 0.84–1.00 |
| GSE40012 | 7.07 | 0.82 | 0.75 | 0.83 | 0.75–0.91 |
| GSE40396 | 11.64 | 0.90 | 0.88 | 0.92 | 0.83–1.00 |
| GSE42026 | 8.27 | 1.00 | 0.94 | 0.95 | 0.90–1.00 |
| GSE25504 | 10.34 | 1.00 | 0.89 | 0.96 | 0.86–1.00 |
| GSE60244 | 9.75 | 0.72 | 0.95 | 0.90 | 0.84–0.96 |
| GSE63990 | 6.83 | 0.93 | 0.88 | 0.93 | 0.88–0.97 |
| GSE69529 | 792.62 | 0.75 | 0.65 | 0.76 | 0.69–0.82 |
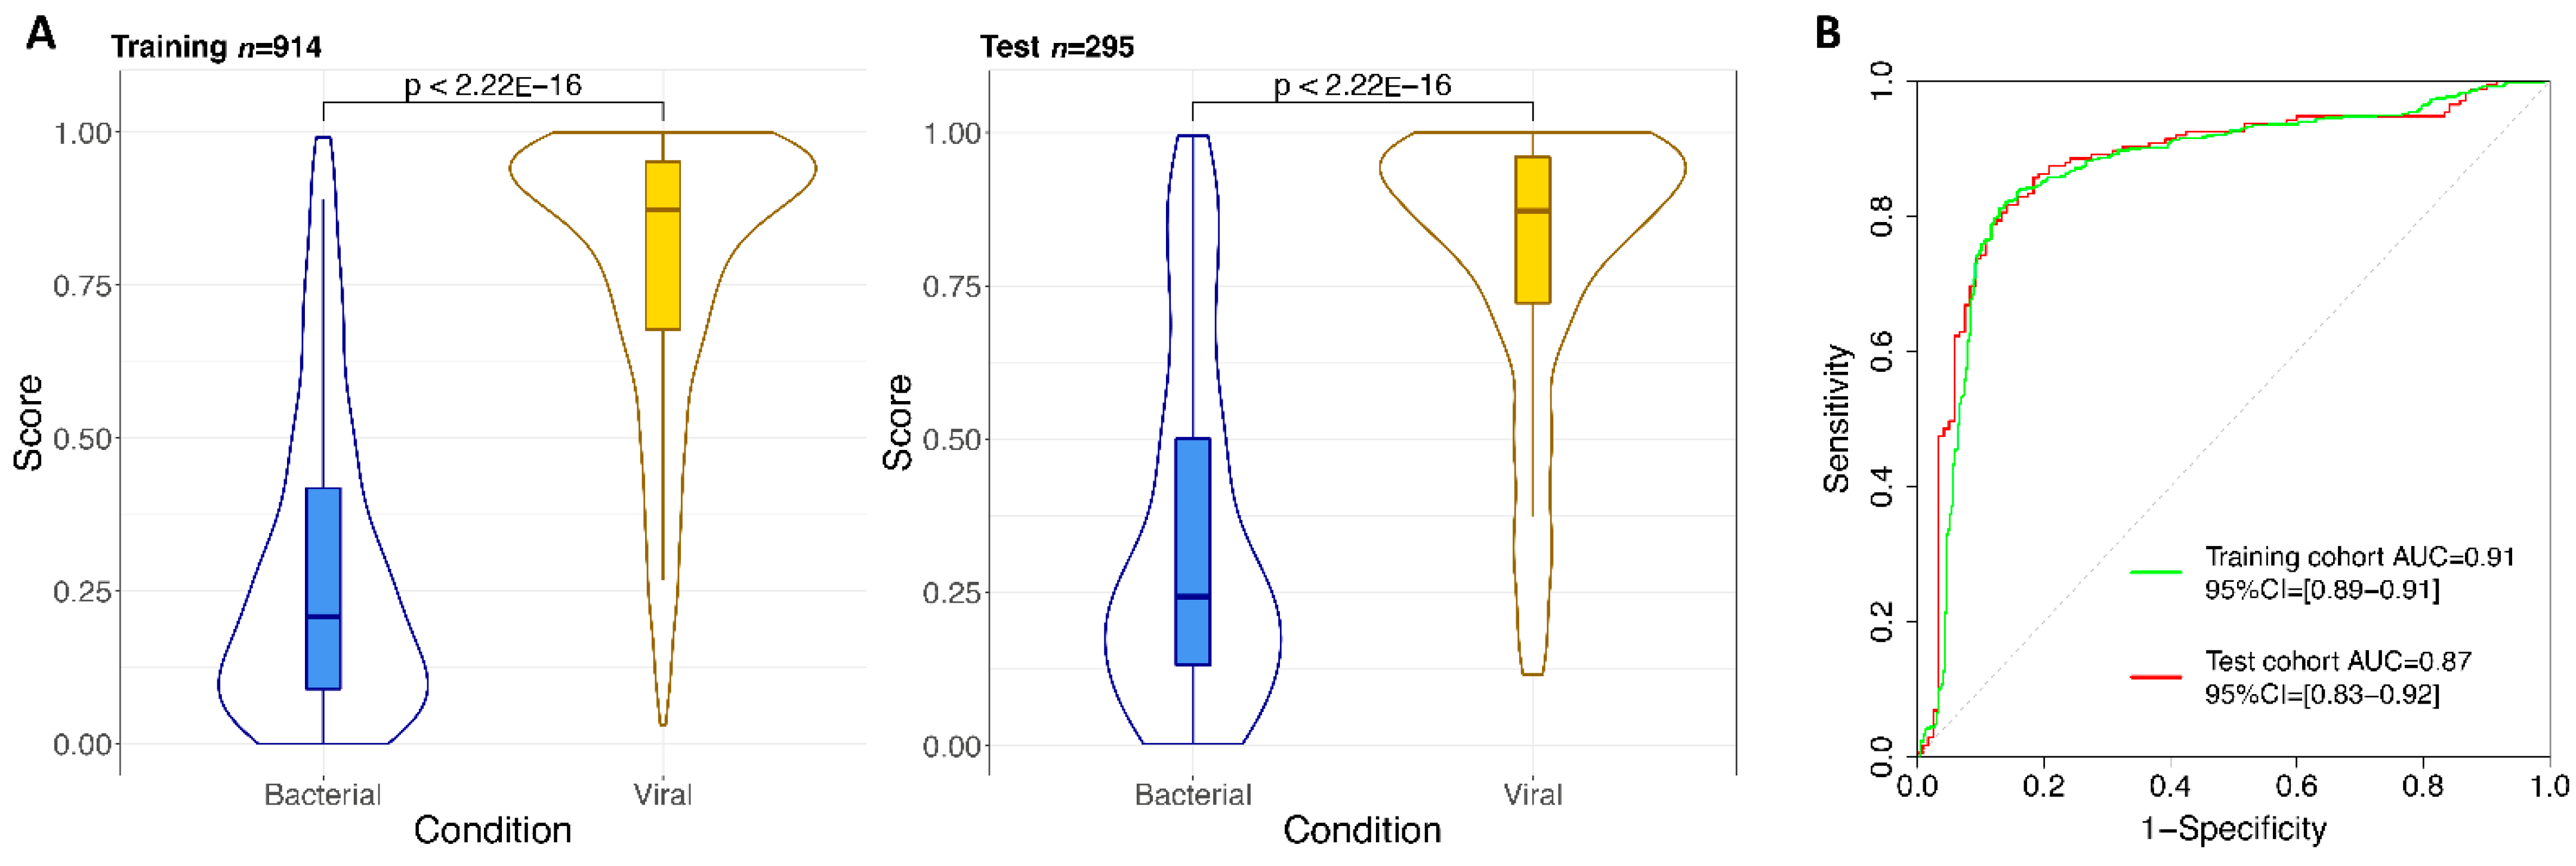
| Training set | 439.56 | 0.81 | 0.87 | 0.86 | 0.84–0.89 |
| Test set | 439.77 | 0.82 | 0.86 | 0.87 | 0.83–0.92 |
| Gene Symbol | Gene Name | LRC |
|---|---|---|
| BATF | Basic Leucine Zipper ATF-Like Transcription Factor | −1.16 |
| ISG15 | ISG15 Ubiquitin Like Modifier | 0.64 |
| DNMT1 | DNA Methyltransferase 1 | 1.24 |
Publisher’s Note: MDPI stays neutral with regard to jurisdictional claims in published maps and institutional affiliations. |
© 2021 by the authors. Licensee MDPI, Basel, Switzerland. This article is an open access article distributed under the terms and conditions of the Creative Commons Attribution (CC BY) license (http://creativecommons.org/licenses/by/4.0/).
Share and Cite
Gómez-Carballa, A.; Barral-Arca, R.; Cebey-López, M.; Bello, X.; Pardo-Seco, J.; Martinón-Torres, F.; Salas, A. Identification of a Minimal 3-Transcript Signature to Differentiate Viral from Bacterial Infection from Best Genome-Wide Host RNA Biomarkers: A Multi-Cohort Analysis. Int. J. Mol. Sci. 2021, 22, 3148. https://0-doi-org.brum.beds.ac.uk/10.3390/ijms22063148
Gómez-Carballa A, Barral-Arca R, Cebey-López M, Bello X, Pardo-Seco J, Martinón-Torres F, Salas A. Identification of a Minimal 3-Transcript Signature to Differentiate Viral from Bacterial Infection from Best Genome-Wide Host RNA Biomarkers: A Multi-Cohort Analysis. International Journal of Molecular Sciences. 2021; 22(6):3148. https://0-doi-org.brum.beds.ac.uk/10.3390/ijms22063148
Chicago/Turabian StyleGómez-Carballa, Alberto, Ruth Barral-Arca, Miriam Cebey-López, Xabier Bello, Jacobo Pardo-Seco, Federico Martinón-Torres, and Antonio Salas. 2021. "Identification of a Minimal 3-Transcript Signature to Differentiate Viral from Bacterial Infection from Best Genome-Wide Host RNA Biomarkers: A Multi-Cohort Analysis" International Journal of Molecular Sciences 22, no. 6: 3148. https://0-doi-org.brum.beds.ac.uk/10.3390/ijms22063148