Article

Characterization of Differentially Expressed Genes under Salt Stress in Olive

1
Institute of Biosciences and Bioresources, National Research Council, 06128 Perugia, Italy
2
Department of Agricultural, Food and Environmental Sciences, University of Perugia, 06121 Perugia, Italy
*
Author to whom correspondence should be addressed.
Int. J. Mol. Sci. 2022, 23(1), 154; https://0-doi-org.brum.beds.ac.uk/10.3390/ijms23010154
Submission received: 17 November 2021 / Revised: 15 December 2021 / Accepted: 21 December 2021 / Published: 23 December 2021
(This article belongs to the Special Issue Molecular Aspects of Plant Salinity Stress and Tolerance)

Abstract

:
Climate change, currently taking place worldwide and also in the Mediterranean area, is leading to a reduction in water availability and to groundwater salinization. Olive represents one of the most efficient tree crops to face these scenarios, thanks to its natural ability to tolerate moderate salinity and drought. In the present work, four olive cultivars (Koroneiki, Picual, Royal de Cazorla and Fadak86) were exposed to high salt stress conditions (200 mM of NaCl) in greenhouse, in order to evaluate their tolerance level and to identify key genes involved in salt stress response. Molecular and physiological parameters, as well as plant growth and leaves’ ions Na+ and K+ content were measured. Results of the physiological measurements showed Royal de Cazorla as the most tolerant cultivar, and Fadak86 and Picual as the most susceptible ones. Ten candidate genes were analyzed and their complete genomic, CDS and protein sequences were identified. The expression analysis of their transcripts through reverse transcriptase quantitative PCR (RT-qPCR) demonstrated that only OeNHX7, OeP5CS, OeRD19A and OePetD were upregulated in tolerant cultivars, thus suggesting their key role in the activation of a salt tolerance mechanism.

1. Introduction

The Mediterranean area is particularly sensitive to climate change [1], that will lead to a reduction in water availability and to groundwater salinization in the near future [2]. Olive tree (Olea europaea L.), considered one of the most important crops of the Mediterranean area, is able to face the environmental changes and develop adaptive mechanisms, thanks to its huge varietal patrimony [3,4,5,6]. Soil salinization is particularly menacing in the Mediterranean Basin, subject to water scarcity and high evapotranspiration demands, and olives are often irrigated with low-quality or wastewater, containing high concentrations of salts [7,8,9].
Although the olive tree is generally regarded as moderately tolerant to salinity, significant differences in salt tolerance have been reported among cultivars [7,10,11]. Several studies have focused on the response of different olive cultivars to salt stress [7,10,11,12,13], but the mechanisms involved in salt tolerance are still required to be adequately recognized.
Salt stress in plants can lead to ionic, osmotic and secondary stresses, particularly oxidative stress, that may inhibit leaf expansion, restrict photosynthesis and limit the accumulation of biomass [14]. In many plants, the adaptive response to salinity stress includes the active exclusion of sodium (Na+) ions and/or their sequestration into the vacuole, production of compatible solutes and detoxification of reactive oxygen species (ROS) [15]. In glycophytes, excessive Na+ often leads to K+ deficiency under salt stress [16], therefore, maintenance of a high K+/Na+ ratio may help plants to adapt to salt stress [16,17,18]. The olive plant has developed a series of mechanisms to tolerate and grow when prolonged soil salinization occurs [19]. These mechanisms include preventing salt translocation or decreasing its transport, excluding Na+ and Cl from leaves [9,20,21], or compartmentalizing toxic ions within leaves [22].
Several genes are involved in plant response to salt stress. NHX7 is required for the maintenance of ionic homeostasis and, therefore, in the regulation of transport or compartmentalization of Na+ and/or K+ [23]. To counteract saline stress, Na+ may be sequestered in vacuoles [24] and Na+/H+ exchangers, controlled by NHX gene family, transport Na+ from the cytoplasm to the vacuole, a process driven by the H+ gradient established by vacuolar H+-pyrophosphatase and H+-ATPase [25]. The salt tolerant effect of NHX genes has been definitively established by the production of many salt-tolerant transgenic plants [26,27].
Phosphatidylinositol (PI) 4-kinases (PI4Ks) has been shown to confer salt stress tolerance in Arabidopsis plants [28] and its activity is also required for the induction of endocytic trafficking and lateral roots primordium formation [29].
The K+/Na+ ratio is also important for the growth rate of plants [30,31,32] and both low K+ and high Na+ can trigger cellular Ca2+ signaling, leading to the activation of complex molecular networks involved in plant growth [33]. Therefore, an important role in plant response to salt stress is played by Calcineurin B-like proteins (CBLs) [34].
In order to counter the negative effects of high salinity, another useful mechanism is regulating water/osmotic homeostasis through aquaporins (AQP) [35]. In plants, the MIP family is divided into five subfamilies, including the plasma membrane intrinsic proteins (PIPs) [36]. PIPs-mediated transcellular transport of water plays an important role in the maintenance of water homeostasis in plants under stress conditions [37,38,39].
The cysteine protease gene RD19A (Responsive to Dehydration 19A) was induced in Arabidopsis thaliana by water deficit and was responsive to salt stress [40]. The upregulation of this gene in tobacco transgenic plants enhanced their tolerance to salt stress [41], moreover, the expression of RD19A under 500 mM of NaCl in Arabidopsis pumila confirmed its significant upregulation under salt stress conditions [42]. Stress-related proteins (SRPs) are known to be involved in the promotion of stress tolerance and play a positive role in the biogenesis of lipid droplets [43,44,45]. In Arabidopsis, SRP1 and SRP3 were induced by high salinity [45].
Several studies have demonstrated that over-expression of the P5CS gene increases proline production and confers salt tolerance in transgenic plants. Proline increases cellular osmolarity (turgor pressure) that provides the turgor necessary for cell expansion under stress conditions and is a dominant organic molecule that accumulates in many organisms following exposure to environmental stresses, and especially under salt-stress conditions [46].
The family of the B-box (BBX) proteins [47] includes a class of zinc-finger transcription factors involved in regulatory networks and responses to abiotic stresses [48]. BBX19 interacted with ABF3 to negatively regulate drought tolerance in Chrysanthemum morifolium [49]. BBXs enhanced salt tolerance in Arabidopsis compared to wild-type plants [50]. In chloroplast genome, PetD (CytB6) is a component of the plastoquinone-plastocyanin reductase [51], involved in electron transport and generation of ATP. Mousavi et al. [10] reported that OePetD was increasingly upregulated in the susceptible olive cultivar Koroneiki, while, in the tolerant cultivar Royal de Cazorla, the expression of OePetD did not show significant variations under stress conditions.
Although there are several studies on genes involved in salt stress response in different plant species, very few ones have reported on salt inducible genes in olive. Some transcription factors were highly regulated under salt stress in tolerant and susceptible olive cultivars [52] and salt-responsive transcripts were identified [53], some genes were differentially methylated under salt stress [10], meanwhile Poku et al. [54] have demonstrated that the olive OeSRC1 gene may increase salt and drought tolerance in tobacco plants, and an extensive EST-SNP genotyping of numerous olive cultivars and wild plants has allowed identification of salt-stress-responsive homologous genes in olive [55]. The selection of genes to include in this study was based on the following criteria: (i) genes involved in salt stress response mechanisms in other plant species, such as NHX7, NHX6, P5CS and BBX19; (ii) genes already found differentially expressed in olive under salt stress [10], as PIK4g, PIP1.1 and PetD and (iii) some genes derived from transcripts related to the mechanisms of tolerance to saline stress in wild and cultivated olives [55] CBL3, RD19A and SRP.
The present study aims to characterize the tolerance level of some olive cultivars to high salinity stress and to explore differential regulation of some genes putatively involved in salt stress response in olive, through their expression profiling on cultivars under saline stress.

2. Results

2.1. Plant Growth and Visible Symptoms

Salt treatments reduced dry weight in all plant organs of examined cultivars at 200 mM NaCl, but higher reductions were observed in leaves (Figure 1). Shoot length and leaf area in cv. Fadak86 under salt stress decreased by 85.40 and 88.90%, respectively, while in cv. Picual leaf number, and their dry weight, faced the highest reduction (95 and 98.47%, respectively).
Growth reduction in the Royal de Cazorla (Royal) cultivar was the lowest for almost all measured plant organs (Figure 1).
Other remarkable differences among the studied cultivars were observed at the end of the experiment (240 days after treatment start, DATS) (Figure 2). Fadak86 plants faced the most severe stress, with a low number of green leaves and a reduced plant growth. A similar feature was observed for cv. Picual. In fact, visible symptoms of stress were observed also at 180 DATS for these two cultivars. On the contrary, in Royal and Koroneiki plants, only some brown leaves were observed at the end of experiment, even if, in cv. Koroneiki, the fallen leaves were more than cv. Royal. In tolerant cultivar Royal, no plant died, but at the same time did not show visible bud, leaf and shoot growth under salt conditions (Figure 2).

2.2. Mineral Leaf Content

The Na+ ion content measured on control and treated plants at 240 DATS, strongly increased under salt stress in all studied cultivars (Figure 3). The highest concentration of Na+ was measured in cv. Picual and the lowest one in cv. Koroneiki. On the contrary, K+ concentration decreased in all salt treated plants with respect to the control ones. The lowest K+ ion reduction under 200 mM of NaCl was observed in the leaves of Royal cultivar, and the highest decrease with respect to control was revealed in cv. Fadak86. The highest K+/Na+ ratio under stress condition was shown by cv. Royal and the lowest one was measured in cv. Picual.

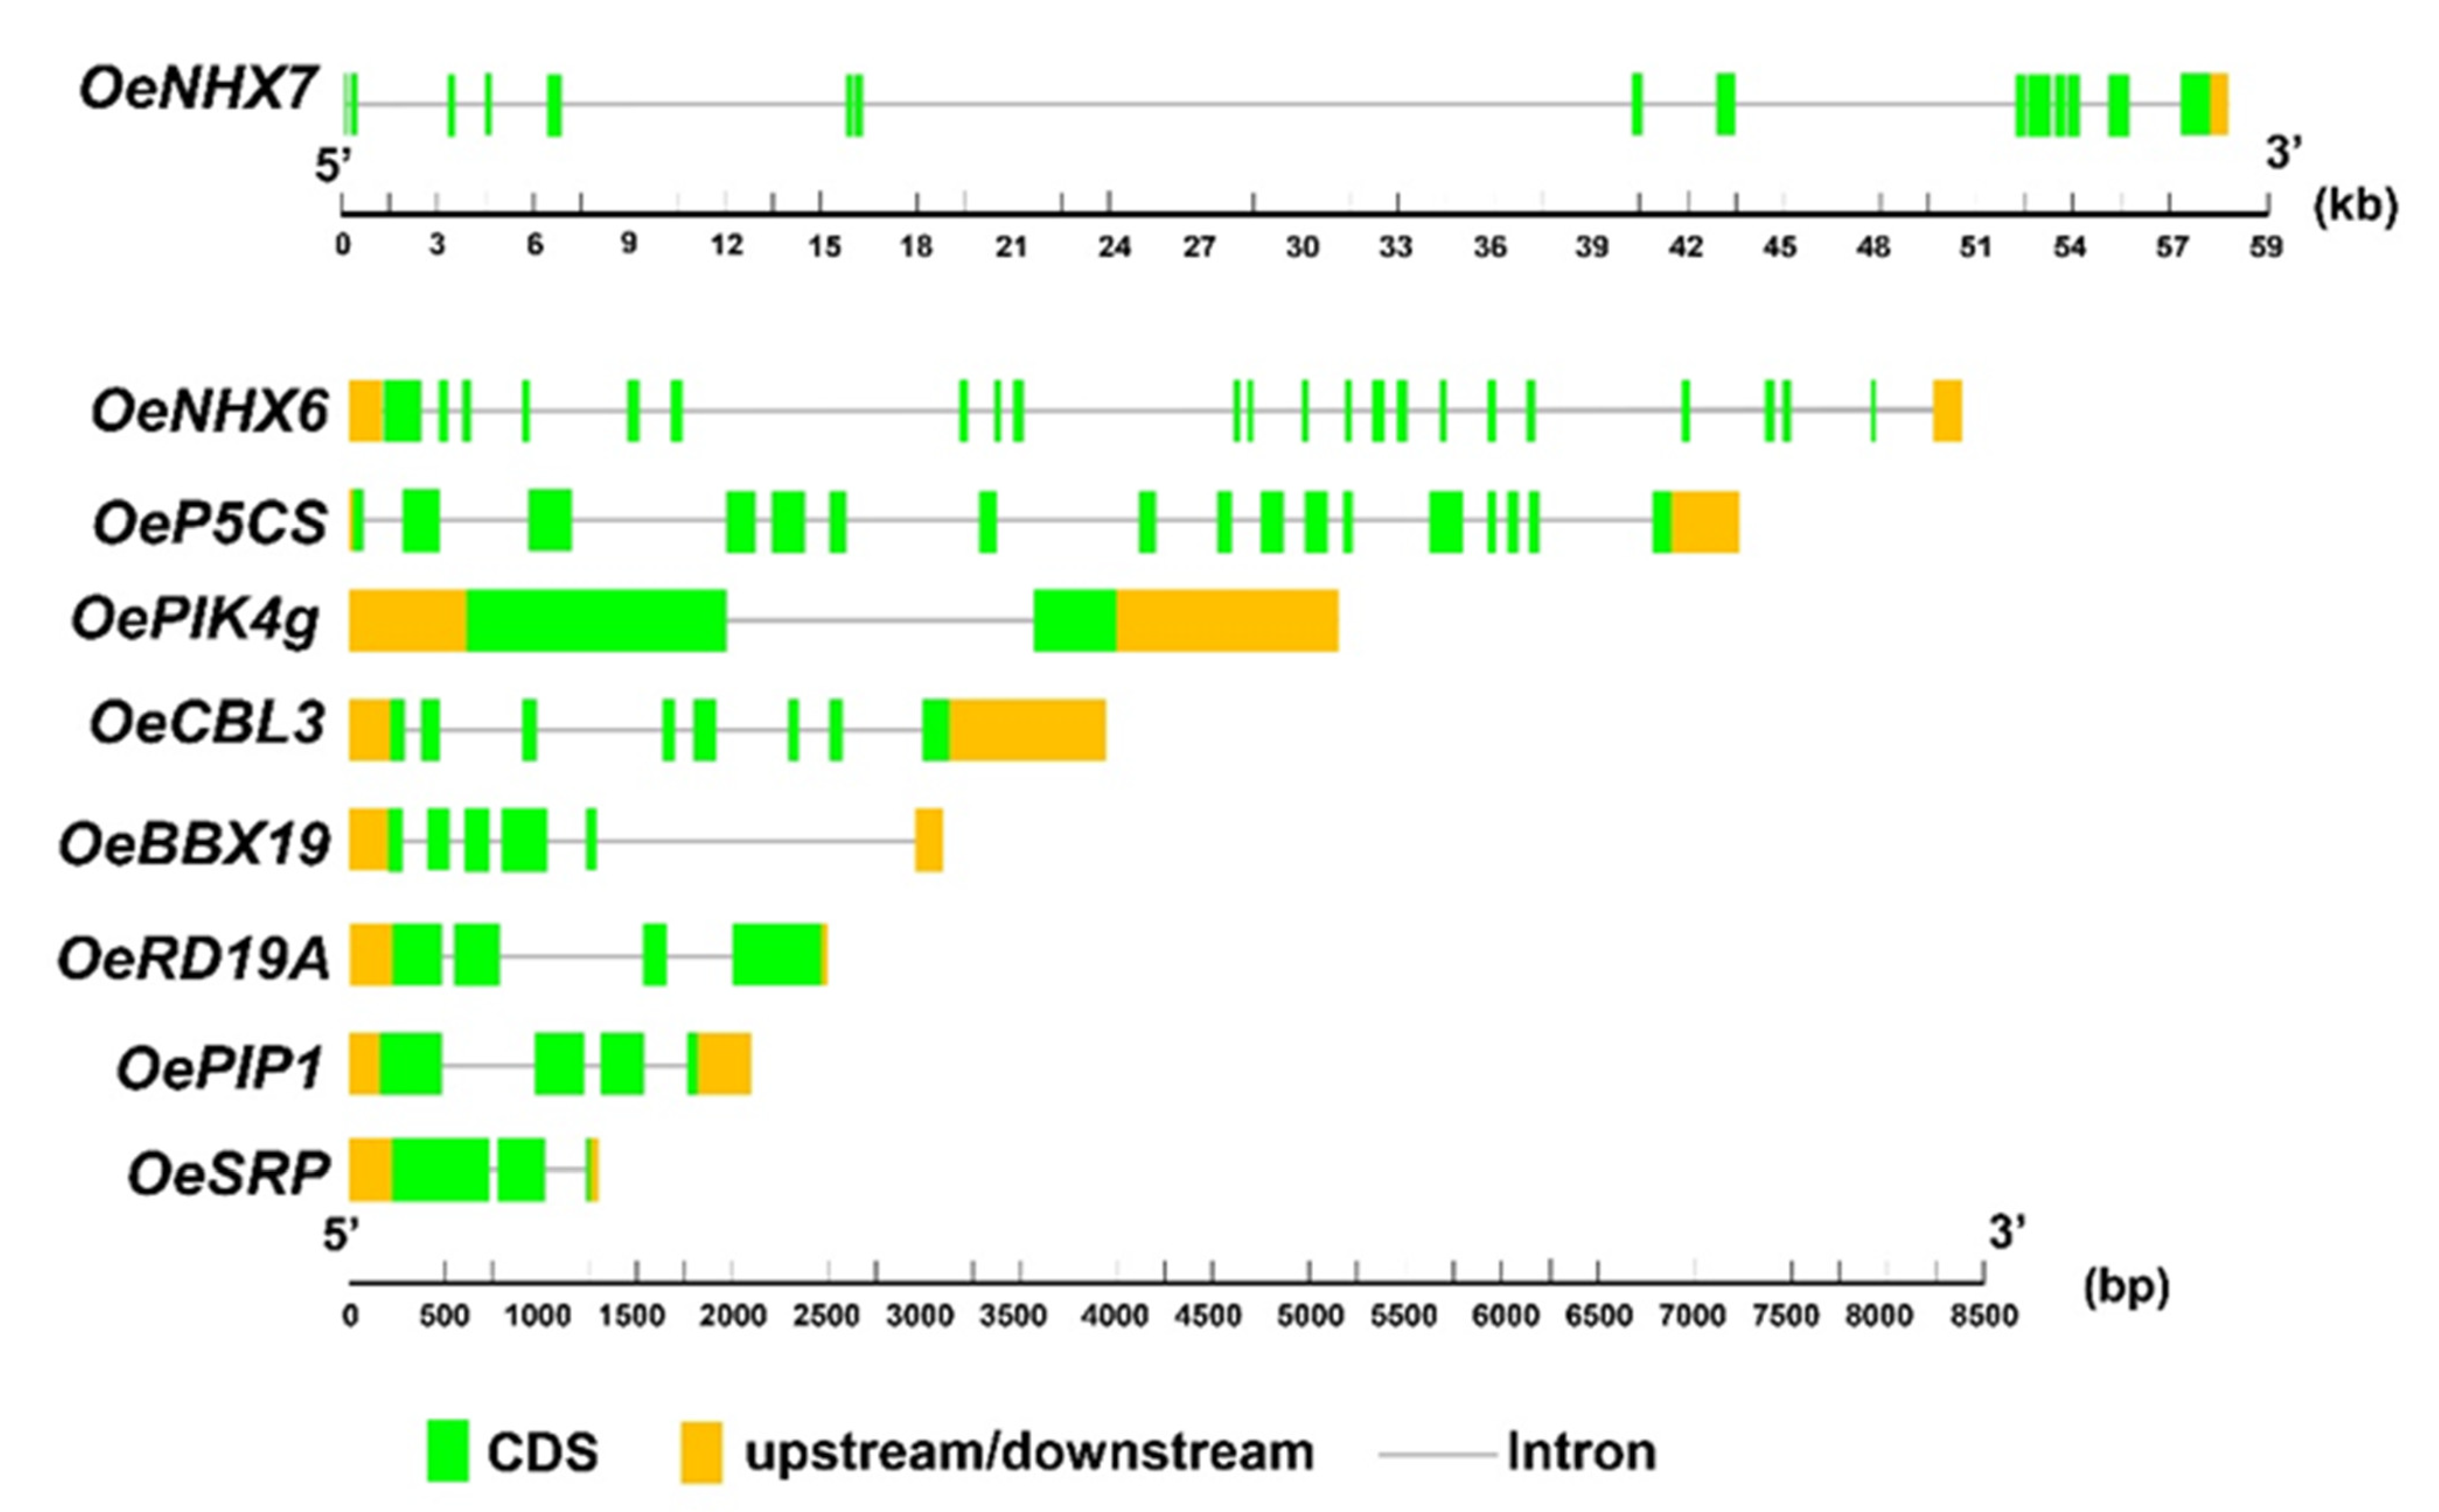
2.3. Identification and Structural Analyses of Selected Genes

Homologous mRNA and CDS of ten most salt-stress-responsive genes were used as query against cvs. Farga, Leccino, Picual and var. sylvestris genomic sequences. Finally, genomic, CDS and protein sequences were fully or partially obtained for all four genomes (Table 1 and Table 2).
OeNHX7 Na+/H+ and K+/H+ antiporter gene, with a length of 58,522 bp, was the longest gene among the studied ones. This gene was characterized by 16 exons and 15 introns including a CDS (2646 bp), coding for 882 amino acids (aa). The complete protein sequence predicted in cv. Farga genome was the same as published for var. sylvestris (XP_022891851.1) without any amino acid change. The OeNHX7 gene in sylvestris genome was placed on chromosome 12, while in cv. Leccino it was placed in linkage group 6. This gene was completely predicted in all four genomes, but the first part was missing in the CDS (Oleur061Scf1390g01001.1) of cv. Picual (Table 1 and Table 2, Figure 4).
OeNHX6 Na+/H+ and K+/H+ antiporter gene, was fully predicted in cv. Farga genome, with a total length of 7410 bp. This gene was reported in chromosome 13 of var. sylvestris and linkage group 8 of cv. Leccino and was characterized by 22 exons and 22 introns. The complete protein sequence was found in three genomes, except that of cv. Leccino, with a total length of 524 amino acids in cv. Farga and var. sylvestris, and 523 aa in cv. Picual, that also showed 26 changes in aa sequence when compared with the sequences of the other cultivars here analyzed (Table 1 and Table 2, Figure 4 and Figure S1). The regulatory elements (REs) detection showed five and six different REs in cv. Farga and var. sylvestris in the upstream part, with five and four REs in the downstream part of the same cultivars, respectively (Table S1). Cultivars Leccino and Picual were not analyzed since the gene was not complete (Table 1).
OeP5CS gene, involved in proline biosynthetic process, with a total length of 6877 bp, was completely predicted in all four genomes. OeP5CS gene is located in chromosome 13 of var. sylvestris and linkage group 8 of cv. Leccino. This gene included 17 exons and 16 introns. The protein sequences were composed by 631 aa in all genomes. The published CDS (Oleur061Scf2321g01015.1) of cv. Picual was different in length and in nucleotide composition with respect to what was predicted in the present study. Picual cultivar had one amino acid change at position 267 in which methionine was replaced by isoleucine, while var. sylvestris had two amino acid changes at position 45 and 267. In cv. Farga, five amino acid changes were found (Table 1 and Table 2, Figure 4 and Figure S1). No polymorphisms were detected in the upstream/downstream part of the gene in each analyzed genome.
OePIK4g gene, involved in cellular response to hypoxia, with a total length of 5122, was predicted in cvs. Farga and Picual and previously published in cv. Leccino (MF958940.1). The published OePIK4g in var. sylvestris was not complete (XM_023040706.1). This gene was located in chromosomes 15 in var. sylvestris and in linkage group 23 of cv. Leccino, and was characterized by two exons and one intron. The protein sequences were 581 aa long in all three genomes, with only one amino acid change in position 166 in cv. Farga, where a histidine was replaced by an arginine (Table 1 and Table 2, Figure 4 and Figure S1). The analysis of RE in upstream/downstream part of polymorphic genomes showed 29, 26 and 30 REs in cvs. Farga, Leccino and Picual, respectively. Var. sylvestris was not analyzed since the gene sequence was not complete (Table 1 and Table S1).
Ogene, a calcium ion binding with 3887 bp length, was completely predicted in Farga and Picual cultivars. This gene was characterized by eight exons and seven introns. OeCBL3 placed in chromosome 7 of var. sylvestris and in linkage group 8 of cv. Leccino. The complete protein sequence was composed by 224 amino acids, without any change in the above-mentioned genomes (Table 1 and Table 2, Figure 4). There was not any polymorphism in the upstream/downstream part of the gene in cvs. Farga and Picual.
OeBBX19 gene, with a zinc ion binding molecular function, had a total length of 3175 bp and was completely predicted in the genomes of Farga and Leccino cultivars. This gene is characterized by five exons and five introns. The published OeBBX19 gene in var. sylvestris (XP_022876209.1) was similar to the predicted ones, while in cv. Picual was not complete. This gene is located in chromosomes 5 of var. sylvestris and in linkage group 23 of cv. Leccino, respectively. The protein sequence was 216 aa long in all three genomes without any amino acid changes (Table 1 and Table 2, Figure 4). RE detection was performed in cvs. Farga and Leccino, since there was not any polymorphism among the latter one and var. sylvestris. In the upstream part, six and 10 REs were found in cvs. Farga and Leccino, respectively, and the same number of REs were detected in the downstream part (Table S1).
OeRD19A gene, with a cysteine-type endopeptidase activity, had a total length of 2471 bp and was completely predicted in cvs. Farga and Leccino. This gene is placed in linkage group 6 of cv. Leccino and characterized by four exons and three introns. The complete protein sequence is composed by 377 aa in three genomes except cv. Picual, without any amino acid change among the genomes (Table 1 and Table 2, Figure 4). Only for cvs. Farga and Leccino was it possible to predict the complete gene and then RE analysis was performed in these genomes. The upstream part did not show any polymorphism among the two cultivars, while the polymorphic downstream showed two REs in cv. Farga and three in cv. Leccino (Table S1).
OePIP1.1 gene, with a water channel activity and total length of 2109 bp, was completely predicted in cvs. Farga and Leccino and sequence information is also reported for two other published genomes (cv. Picual and var. sylvestris) (Table 1). This gene was located in chromosomes 19 of var. sylvestris and in linkage group 14 in cv. Leccino and identified by four exons and three introns. The protein sequence length was 285 aa in all four genomes, with an amino acid change in position 85 of cv. Leccino where lysine was replaced by glutamine (Table 1 and Table 2, Figure 4 and Figure S1). RE analysis was performed in the upstream part of the gene in cvs. Farga, Leccino and Picual, var. sylvestris had the same sequence as cv. Farga in both UTRs. Five, six and five REs were detected in cvs. Farga, Leccino and Picual, respectively. In the downstream part, cv. Farga had the same sequences of var. sylvestris and cv. Picual with five REs, while in cv. Leccino seven REs were detected (Table S1).
For OeSRP gene there was no molecular function reported in Uniprot, while it seemed involved in several biological processes. Its nucleotide sequence showed a total length of 1347 bp, and it was completely predicted in all four genomes, with three exons and two introns. OeSRP gene was located in chromosome 20 of var. sylvestris and in linkage group 17 of cv. Leccino. The complete protein is composed by 250 aa; the only difference between the four genomes resides in position 107 and 236, where in the first one a glycine is present in cvs. Leccino and Picual and glutamine in cv. Farga and var. sylvestris and aspartic acid in the latter position (Table 1 and Table 2, Figure 4 and Figure S1). In the upstream part cv. Leccino showed the same sequence as cv. Picual, while cv. Farga was the same as var. sylvestris. The RE analysis showed seven and six regulatory elements in cvs. Farga and Leccino, respectively. In four analyzed genomes the downstream part did not show any polymorphism (Table S1).
Finally, the chloroplast gene OePetD, with an electron transporter role, had the total length of 160 bp without any polymorphism among the four protein sequences (Table 1 and Table 2, Figure 4).

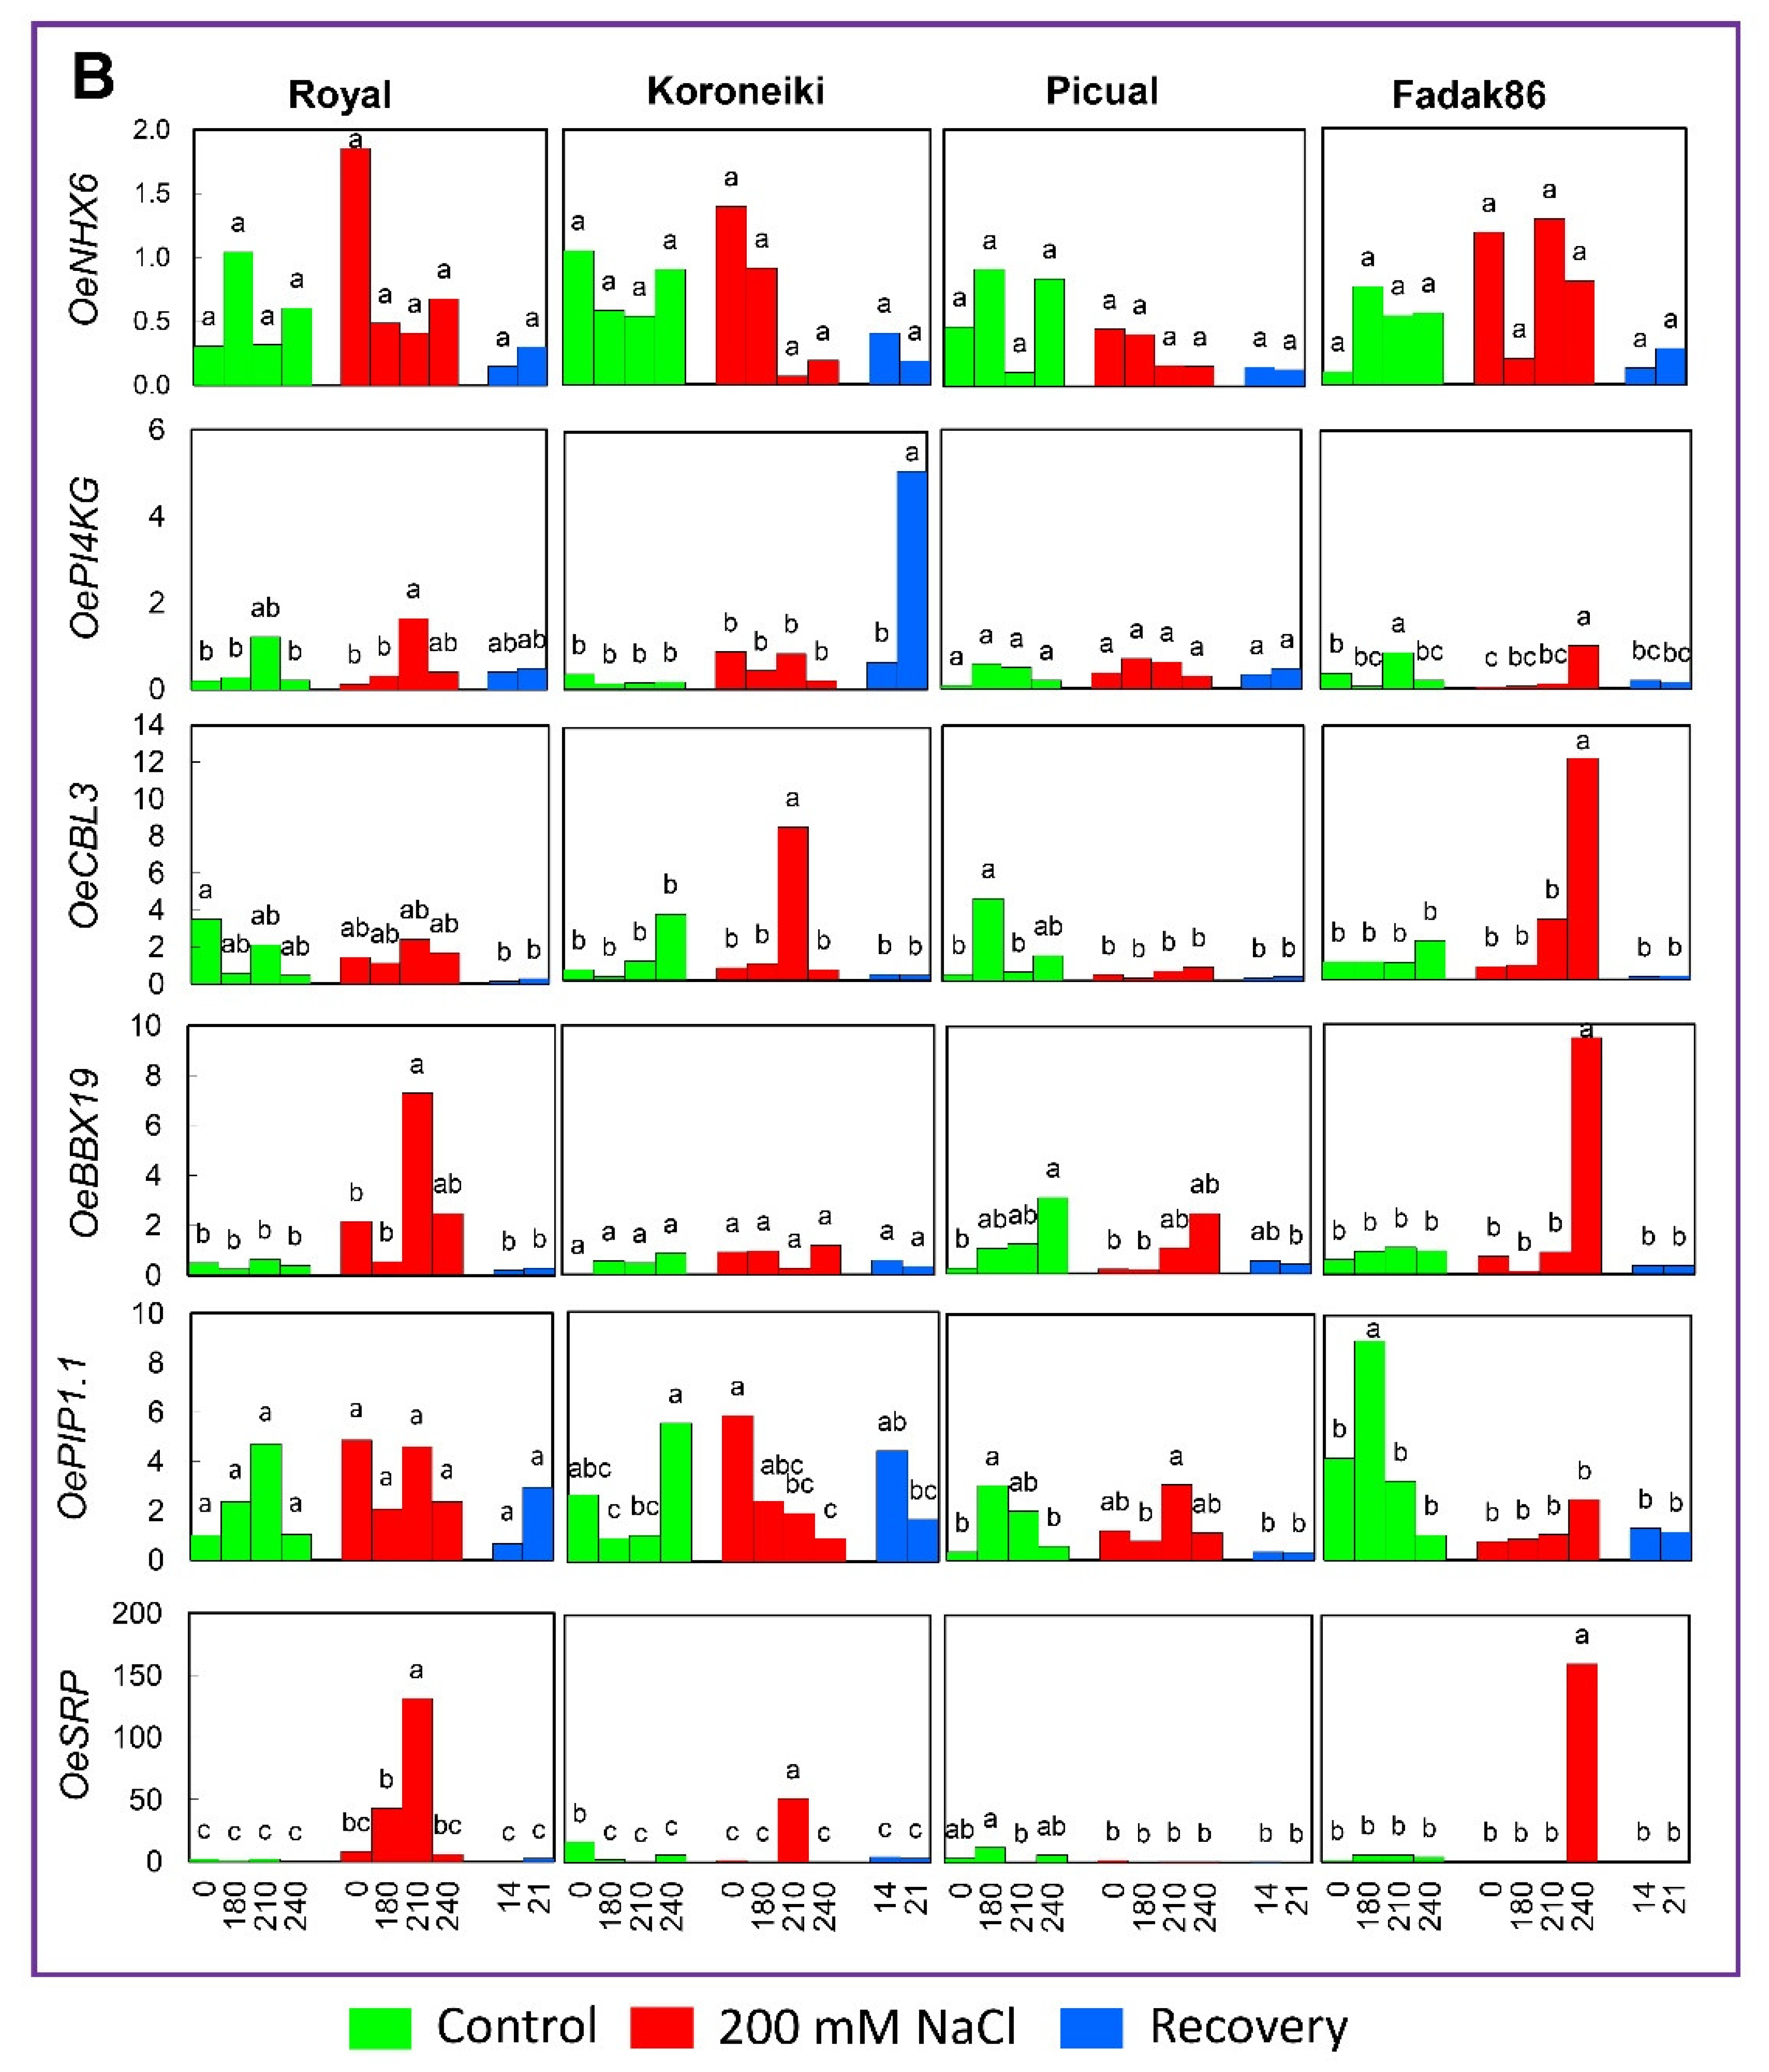
2.4. Gene Expression Analysis

The RT-qPCR experiments showed the expression profiles of the 10 selected genes at 0, 180, 210, 240 DATS and 14 and 21 days after recovery start, DARS (Figure 5).
A sharp increase of OeNHX7 expression was observed in Royal under salt treatment at 210 DATS, about 50 folds with respect to control plants at the same time point, followed by a decrease to the last sampling date. A significant increase was also obtained after 240 DATS in Fadak86 treated plants, 10 folds with respect to the control plants at the same time. In cvs. Picual and Koroneiki the expression levels were very low in all cases. The expression of this gene showed very low regulation in control plants, as well as during the recovery from stress (Figure 5A).
The expression of OeP5CS in Royal and Koroneiki plants under stress showed a significant upregulation of about six and five folds, respectively, compared to control plants at 210 DATS. No significant variations have been noticed for cvs. Picual and Fadak86 at all treatments and sampling times (Figure 5A).
A high and significant increase in the relative abundance of OeRD19A gene transcripts was observed in the salt-tolerant Royal cultivar under stress, with a peak reached at 210 DATS, four folds compared to the control plants at the same time. All other cultivars showed similar but lower patterns of increase under the same conditions. The expression of this gene remained low also in control plants and in plants under recovery (Figure 5A).
OePetD had a slight increase in expression at experiment start (when salt concentration reached 200 mM) in Fadak86 with respect to control plants at the same time and then the expression decreased along the time (Figure 5A).
In Picual cultivar the pattern of expression was the same in control and stressed plants, a slight increase was observed in plants under salt conditions at 240 DATS. Indeed, in plants under recovery conditions, the expression had significant increase at 14 DARS and then had a slight decrease at 21 DARS. OePetD had the variation in expression in the Koroneiki cultivar with respect to the control plants at the same time points, anyway upregulation was at the beginning in stressed plants and then decreased during the time. In salt-tolerant Royal plants, OePetD expression increased in both control and treated plants, reaching a plateau at 240 and 210 DATS, respectively. In cv. Picual the expression levels were not so different, excluding plants under recovery. In Fadak86 cultivar the expression decreased during the time in stressed plants (Figure 5A).
No significant variations were found in the expression levels of OeNHX6 gene for all treatments and all tested cultivars (Figure 5B).
In relation to OePI4Kg4, only Royal and Fadak86 plants under salt treatment experienced a significantly high expression of this gene at 210 and 240 DATS, respectively. Only low and not significant expressions were observed in Picual cultivar at all treatments and time points. OePI4Kg4 showed the highest expression in plants of Koroneiki cultivar after 21 days of recovery (Figure 5B).
OeCBL3 showed a progressive increase of expression in Fadak86 plants, five folds of increment with respect to control plants up to 240 DATS. A similar increase was found in Koroneiki at 210 DATS, an enhancement that was lost at 240 DATS. The other two cultivars did not show significant expression under salt stress with respect to control ones (Figure 5B).
The expression of the B-Box zinc finger (OeBBX19) gene, increased after 210 DAT in stressed plants of Royal and after 240 DATS in Fadak86, four and five folds, respectively. The expression in stressed plants of Picual was progressively increased with respect to control plants, but the increment was not considerable, indeed, in Koroneiki cultivar, the expression was always low with no significant differences (Figure 5B).
The expression of OePIP1.1 was significantly higher in control plants of Fadak86 than in plants under salt stress, with a peak at 180 DATS followed by a continuous decrease. In salt-tolerant Royal plants, the gene was not significantly regulated under different conditions. In Koroneiki plants, OePIP1.1 expression decreased progressively in plants under salt stress, and in Picual it reached a peak at 210 DATS, but similar levels were reached also in control plants at an earlier time point. Also, at 14 days after recovery, the expression was high and then decreased at 21 days (Figure 5B).
The OeSRP gene underwent an increase in expression 150-, 50- and 200-folds with respect to control plants in Royal, Koroneiki and susceptible Fadak86 plants after 210, 210 and 240 DATS, respectively. In Picual cultivar OeSRP did not show any upregulation under all treatments and stages (Figure 5B).

3. Discussion

Climate change, taking place also in the Mediterranean area, can lead to a reduction in water availability, an increase in temperatures and the need to use salty lands and water. Olive growing has expanded in recent decades outside the borders of the Mediterranean, reaching different continents, often affected by scarcity of water and nutritional resources and by phenomena of salinity of soils and irrigation water [57,58].
Olive represents one of the most efficient crops to face these scenarios, thanks to its natural ability to tolerate aridity and produce under limited environmental resources, but the challenges posed by the new climate constraints impose the need to explore the high variability of the species in relation to the abiotic stress tolerance and to characterize the genetic determinants controlling plant response to salt stress.
These goals can be achieved more rapidly thanks to the new genomic tools under development for olive, accelerating the discovery of candidate genes linked to abiotic tolerance. Differentially expressed genes related to salt tolerance were identified in olive [52,53], showing that tolerance to high salinity depends on the genotype, as demonstrated by a lot of other evidence [10,11,22,59], and that this trait is associated with the ability of olive trees to retain Na+ and Cl ions in the roots [9,13,60].
Salinity induces changes in gene expression at global scale. Salt tolerance in olive cultivars is associated with effective mechanisms of ion exclusion and retention of Na+ and Cl in the root, limiting the accumulation of these ions into actively growing shoots. It is more likely that K+/Na+ exchange at the plasmalemma is involved in regulating the transport of Na+ to the shoot by preventing apoplastic transport into the xylem [59].
In the present study, plant growth parameters and visible symptoms have been recorded in four olive cultivars under 200 mM of NaCl. Among the studied cultivars, the most susceptible ones were Fadak86 and Picual, that showed a harsh decrease in growth and, by increasing stress duration, plants have faced the noxious concentration of NaCl, leading to the death of several replicates. In the same condition, Koroneiki plants under salt treatment did not suffer severe growth damages, but several leaves turned brown and fell off. Royal was the unique cultivar with low damage and few brown leaves, with plants somewhat similar to the control ones. These observations have confirmed the tolerance of this cultivar to stress conditions [10,11].
The Na+ and K+ ions concentration in the leaves of examined plants were concordant with the level of susceptibility or tolerance to salt stress of cultivars. Despite the high level of Na+ in the plant, Royal cultivar was able to tolerate salt stress, indicating that its elevated salinity tolerance was not a consequence of Na+ exclusion. In a previous experiment conducted by the authors [10], it was shown that, with respect to Koroneiki, Royal cultivar accumulated a high concentration of salt in the roots, showing that Royal salt tolerance may derive from its ability to protect the above ground meristematic tissues from the accumulations of Na+. In glycophytes, excessive Na+ often leads to K+ deficiency under salt stress [16]. In fact, K+ concentration decreased in all three cultivars except Royal, that maintained a high K+/Na+ concentration in the leaves, an important mechanism used by plants to adapt to salt stress [16,17,18,21]. The susceptible cultivars Fadak86 and Picual, with a high concentration of Na+ in their leaves, did not activate the mechanisms to prevent salt translocation or decreasing its transport and did not exclude Na+ from leaves, replacing it with K+, while the cultivar Koroneiki, partially salt susceptible, with the lowest concentration of Na+ in the leaves, seemed to apply the mechanism of compartmentalizing toxic ions within the leaves [22,61].
NHX genes induce enhanced Na+ accumulation in wild tomato when grown in the presence of NaCl [62]. The upregulation of OeNHX7 in Royal and Fadak86 olive plants under stress at different time points was in accordance with Wu et al. [32], reporting that NHX genes were significantly upregulated by salt both in roots and leaves, and the transcription levels under high salinity were significantly higher than those under low or moderate salinity. The upregulation of OeNHX7 gene at the end of the experiment (240 DATS) in Fadak86 plants could not activate any defense mechanisms against salt and plants harshly collapsed at that stage, while upregulation of this gene in salt treated Royal plants at 210 DATS, may have counteracted saline stress by sequestering Na+ in vacuoles, a process carried out by Na+/H+ exchangers that keep the cytosolic Na+ concentration low [24]. The OeNHX6 gene completely failed to be responsive to salt stress. Effectively, also in treated plants of Medicago truncatula, NHX6 did not show any significant expression with respect to the control [24]. Moreover, the not significant response of this gene to the high level of salt could depend on the tissue-specific function of OeNHX6.
P5CS gene expression is directly related to salt stress and ABA function in O. sativa [63,64,65]. P5CS gene expression level and the proline content increased in Lepidium draba with increasing concentrations of NaCl [63], and P5CS1 and P5CS2 increased salt tolerance in Panicum virgatum [64]. In a study of transcriptome analysis of olive [53], ATP binding activity has been observed in three transcripts differentially expressed under salt stress. Over-expression of OeP5CS gene at 210 DATS in both tolerant and moderately tolerant Royal and Koroneiki cultivars, highlighted this gene as one of the most solid candidates regulating salt tolerance. Our results confirmed what was previously observed in Panicum virgatum by Guan et al. [65]. Moreover, the regulatory elements detection in upstream/downstream parts of this gene did not show any differences among the four analyzed genomes, highlighting the strong conservation of UTRs regions. The increase in expression of P5CS by increasing salt concentration to 300 mM was also reported [66]. Moreover, several studies have demonstrated that over-expression of P5CS gene increases proline production and confers salt tolerance on transgenic plants [46]. For this reason, it is conceivable that P5CS and proline synthesis are involved in regulation of Na+ accumulation in leaves and, consequently, in salt stress tolerance [65].
The cysteine protease genes RD21A and RD19A, belonging to the papain family, were induced by water deficit and were responsive to salt stress in Arabidopsis thaliana [40]. Functional analysis of these proteases has shown that cysteine proteases play an important role in the programmed cell-death pathway during stress [67]. Effectively, in our study, OeRD19A was upregulated only in the salt tolerant cvs. Royal and Koroneiki at 210 DATS, strongly supporting the role of this gene to increase salt tolerance also in olive. Detection of only one polymorphism in 3′ UTR region of cvs. Farga and Leccino genomes confirmed the high conservation of OeRD19A in different olive cultivars. These results are in accordance with Qin et al. [41], reporting that the upregulation of this gene in tobacco transgenic plants enhanced their tolerance to salt stress, and, more importantly, this gene was up-regulated in Arabidopsis pumila under 500 mM NaCl [42]. This evidence makes this gene one of the strongest candidates to induce salt tolerance in olive.
PetD (CytB6) chloroplast gene is a component of the plastoquinone-plastocyanin reductase, involved in electron transport and generation of ATP. Under salinity stress, CytB6 and other chloroplast protein complexes were upregulated [50,68] as reported also in Triticum aestivum under salt stress [69]. In the study on the transcriptome response to salinity in olive [52], the same gene was upregulated in the stressed plants of cv. Kalamon. The upregulation of this gene could represent a defense measure to combat the negative oxidative damage caused by salt stress. The OePetD analyzed in this study showed a clear upregulation in the most tolerant cultivar Royal and, to a lesser extent, in Koroneiki, both at 210 DATS, confirming previous evidence [10]. The upregulation of this gene in the susceptible Picual cultivar during the recovery phase, could depend on the sprouting of new leaves and the increase of activity of this chloroplast gene.
PI4Kg4 gene plays a regulatory role in increasing Ca2+ concentration in all parts of stressed plants, thus limiting the toxic effect of Na+ on the integrity of the plasma membrane [59] and contributing to Na+ exclusion [8]. The slight upregulation of OePI4Kg4 in the most tolerant and in the most susceptible cultivar can be explained by the fact that the gene is activated in the presence of salt but, at least in olive, OePI4Kg4 does not contribute to increase the ability of the plant to tolerate stress. This result confirmed what was observed in a previous work on olive [10], while the over-expression of this gene, even if significant among stressed and control plants, was not particularly high. The high number of REs (38) detected in the UTR regions can also justify the high polymorphism in this gene in different cultivars, which can affect gene expression. Moreover, the upregulation of this gene during recovery in cv. Koroneiki, could depend on the recovery of plant functions.
The interaction between CBL-CIPK (CBL-interacting protein kinase) regulates the activity of a series of transport proteins involved in the absorption and translocation of K+ and Na+, keeping the right balance of these cations in plants under stress conditions [33,70]. The role of OeCBL3 to maintain the balance in K+ and Na+ ions in olive is controversial. In fact, the maximum expression was obtained in the most susceptible cultivar (Fadak86), which however showed the strongest reduction of K+ ions compared to the other cultivars and the highest stress damages. The upregulation of this gene at 210 DATS in a medium-tolerant cultivar such as Koroneiki, could support its effectiveness in controlling the K+/Na+ ratio of leaves, as in the tolerant cultivar Royal.
Among several zinc finger proteins belonging to the BBX proteins family, two are known to induce salt tolerance [49,50,71]. The OeBBX19 analyzed in this study effectively showed over-expression in Royal plants at 210 DATS, confirming the effect of this gene to increase salt tolerance, but its upregulation in the most susceptible and damaged cultivar Fadak86 at 240 DATS could not activate salt tolerance mechanisms, likely when irreversible damages in the plant have already occurred. In the study of olive transcriptome under salt stress, two zinc ion binding transcripts were differentially expressed in salt-stressed plants [53].
PIPs improve Na+ exclusion in roots, tissue compartmentalization of Na+, water uptake by roots and leaf cell hydration [36]. A PIP1 subgroup of the AQP genes, was upregulated in response to NaCl and able to increase root elongation under salt stress with elevated Na+ and K+ content [23]. The study on the AQP response to salt stress in tomato showed PIP1;1, PIP1;3, PIP1;7, PIP2;10 and PIP2;12 played an important role in regulating water transport under salt stress. Results suggest that PIPs were involved in mediating water transport in tomato plants, and the regulation of PIP expression under salt stress was associated with tissue type and stress duration [72]. But in our study, OePIP1.1 did not show a clear pattern of expression associated with the ability to tolerate salt stress in olive, confirming its ambiguous role in salt stress response shown in a previous work, even if was demethylated under salt stress in susceptible cultivars [10]. The studies demonstrate that the expression response of AQPs is quite variable in different tissues, different plants and in different stress conditions (such as stress duration), and different AQP isoforms exhibited different responses even to the same stress condition [73,74,75].
Arabidopsis SRP homologs play a positive role in tissue growth and development and are related with cell wall organization, especially in the biogenesis of lipid droplets (LD), and SRP1 and SRP3 were induced by abiotic stresses like drought, low temperature and high salinity [45]. The involvement of SRPs and their upregulation under salinity stress was reported also by Hosseini et al. [76] and Fercha et al. [77]. Unfortunately, also OeSRP showed doubtful expression patterns in olive, with upregulation in both tolerant and susceptible cultivars. Probably, it could play a role in salt response that does not involve changes in tolerance.

4. Materials and Methods

4.1. Plant Material and Experimental Design

Four olive cultivars, with different tolerance to salt stress, have been studied in this experiment: Royal, as a high-tolerant cultivar [10,11], Koroneiki and Picual, selected as medium salt-tolerant cultivars [10,78] and Fadak86, as a susceptible cultivar [11]. Two-years old plants, average height 1.3–1.5 m, were grown in the greenhouse in 2.5 L plastic pots containing a substrate composed of 60% peat and 40% pumice (w/w). Twenty replicates/treatment/cultivar were considered, and, from these replicates, five plants were selected for destructive measurements Plants were exposed to natural light and an automatic ventilation system avoided to exceed a temperature of 35 °C. The minimum and maximum daily temperatures ranged between 9.4 and 15.2 °C, and 10.4–30.4 °C, respectively. Two treatments were applied: control (0) and 200 mM NaCl. Plants were irrigated three times a week, for three months, using salt-free half-strength Hoagland solution and for subsequent eight months from October, with half-strength Hoagland solution containing 200 mM NaCl.
In order to prevent osmotic shock, salt concentration was increased daily by 25 mM, to reach the 200 mM level, maintained along the entire experiment. Electrical Conductivity (EC) was determined weekly in the leaching solution with the conductometer Hanna Instruments- HI 9033, with values of about 1.2 and 21.4 dS m−1, in relation to 0 and 200 mM NaCl, respectively. EC measurement confirmed that an irrigation rate with a leaching fraction of 20–30% ensured a stable salinity level in pots throughout the course of the experiment. After treatment completion, stressed plants were irrigated with salt-free half-strength Hoagland solution for 21 days to recover plants from the stress.

4.2. Plant Growth and Chemical Measurements

Plant size was measured at the beginning and the end of experiment (240 DATS). Plant growth measurement of Koroneiki, Royal and Fadak86 cultivars are from the previous published study [11], those of cv. Picual are de novo provided in the present study.
In order to measure the content of sodium (Na+), and potassium (K+) ions, leaf tissue of control and 200 mM NaCl treated plants was collected at 240 DATS and dried at 65 °C for 48 h, finely ground and extracted with diluted nitric acid. The concentration of Na+ and K+ of leaf extract was measured through a flame photometer (Digiflame, GDV) [60,79].

4.3. Molecular Characterization of Salt Responsive Genes in Olive

The partial or full-length mRNA sequences, previously identified in olive [10,55], were used as queries to identify the genomic scaffolds in a BLAST search on four different olive genomes: cv. Leccino (http://olgenome.crea.gov.it/index.php/en/ (accessed on 23 December 2021)), cv. Farga (https://denovo.cnag.cat/olive (accessed on 23 December 2021)) [80], wild olive (Olea europaea var. sylvestris, http://olivegenome.org/ (accessed on 23 December 2021)) [81] and cv. Picual (https://genomaolivar.dipujaen.es/db/ (accessed on 23 December 2021)) [56]. Gene sequences and transcripts with best ID, E-values and hit scores were identified, followed by a nucleotide BLAST search in the NCBI database (https://blast.ncbi.nlm.nih.gov/Blast.cgi (accessed on 23 December 2021)) and the alignment with gene orthologs. BioEdit software (https://bioedit.software.informer.com/ (accessed on 23 December 2021)) was used to align gene sequences, distinguishing exons and introns. ORFs and corresponding proteins were predicted using the ExPASy translate tool (http://web.expasy.org/translate/ (accessed on 23 December 2021)) and fgenesh (http://www.softberry.com/berry.phtml (accessed on 23 December 2021)). Predicted olive proteins and their putative orthologues were aligned through ClustalW (https://bioedit.software.informer.com/ (accessed on 23 December 2021)). Protein homology with other plant species was verified by BLASTP in the non-redundant protein sequences database of NCBI. TAIR (https://www.arabidopsis.org/Blast (accessed on 23 December 2021)) and UNIPROT database resources (http://www.uniprot.org/blast (accessed on 23 December 2021)) were used to search gene ontology terms. Regulatory elements (RE) were predicted for each complete predicted or published gene where polymorphism among the four genomes in upstream/downstream part was found. The analysis was performed by the program Nsite, version 5 [82] with search parameters including: expected mean number 0.010, statistical significance level 0.950, level of homology between known RE and motif 80% and variation of distance between RE blocks 20%.
The complete sequence of each gene was amplified on DNA (25 ng) of cvs. Royal, Koroneiki, Picual and Fadak86 (using cv. Leccino as reference genome), by using LA Taq polymerase (Takara Bio Company), with the following PCR program: 98 °C for three min; 50 cycles of 98 °C for 25 s, 58 °C for 25 s, 68 °C for four min and final extension at 68 °C for 10 min. In order to verify sequence homology, portions of these genes were sequenced using BigDye Terminator v.3.1 Cycle Sequencing Kit (Applied Biosystems, Foster, CA, USA). Purified PCR products were sequenced on an ABI PRISM 3130 XL Genetic Analyzer (Applied Biosystems, Foster, CA, USA). The BioEdit 7.1.7 was used to align the sequenced fragments and identify polymorphisms within and between cultivars.

4.4. RNA Extraction, cDNA Synthesis and Gene Expression Analysis

Leaf samples were collected at 0, 180, 210 and 240 DATS, where 0 was the experiment start, exactly when salt concentration arrived at 200 mM in the treated plants (daily increase of 25 mM NaCl). After 210 DATS, two plants of each cultivar/treatment were placed in recovery condition, 14 and 21 days after recovery (14 and 21 DARS) their leaves were sampled for molecular analysis.
Total RNA was extracted from leaves by using the RNeasy Plant Mini Kit (Qiagen), according to manufacturer’s instructions. To avoid DNA contamination, each sample was treated with DNase I (Ambion, Thermo Fisher Scientific) and tested by amplifying the reference gene Elongation Factor 1 alpha (EF1α). Concentration of total RNA was assessed using a Nanodrop 2000c spectrophotometer (Thermo Fisher Scientific, DE, USA). Single-strand cDNA was synthesized from 500 ng of total RNA using oligo (dT)18 and SuperScript III Reverse Transcriptase (Thermo Fisher Scientific), according to manufacturer’s instructions. cDNA amplification was evaluated by PCR amplification of the EF1α gene.
Expression analyses were performed by RT-qPCR. Primers for the RT-qPCR experiments were designed using the program Primer3 version 4.0 (Table 3). Reactions were performed on three biological cDNA samples and three technical replicates for each sample by the same procedure reported in Mousavi et al. [10].

4.5. Statistical Analysis

Physiological and chemical data were analyzed using Two-way ANOVA followed by Tukey’s multiple comparisons test of GraphPad Prism version 9.0.0 (GraphPad Software, San Diego, CA, USA, www.graphpad.com (accessed on 23 December 2021)). Molecular data were analyzed by DAASTAT [83] using one-way ANOVA (**** p = 0.000, *** p < 0.001, ** p < 0.01 and * p < 0.05, n = 3), Tukey test was used to compare mean values.

5. Conclusions

In the present study, potted plants of four olive cultivars showing different levels of salt stress tolerance were subjected to strong salt stress (200 mM NaCl) for a long period under partially controlled conditions in the greenhouse. Plant growth measurements and observations on stress symptoms confirmed their tolerance level. The analysis of Na+ and K+ ions allowed an understanding of how the balance of these cations can influence the response to high salinity level in different cultivars. Sequence characterization and quantitative RT-qPCR analyses of the ten most interesting candidate genes, putatively involved in salt stress tolerance, based on evidence obtained in other species or directly from previous studies on olive, demonstrated that only four of them, namely OeNHX7, OeP5CS, OeRD19A and OePetD, showed a pattern of expression highly consistent with the level of salt tolerance of the olive cultivars. These genes, as well as most of the other six, were fully characterized and positioned on the olive linkage groups of cv. Leccino. The identification of salt stress responsive genes in olive represents a new resource for the genomics-assisted breeding and for genome editing. We strongly support olive phenomics and genomics as strategic tools for improving adaptation of olive to environmental stress and to overcome future scenarios of climate change.

Supplementary Materials

The following are available online at www.mdpi.com/article/10.3390/ijms23010154/s1.

Author Contributions

Conceptualization, S.M.; R.M.; L.R.; E.A.; P.P. and L.B.; methodology, S.M.; R.M.; L.R.; E.L.; E.A. and D.B.; software, S.M. and R.M.; validation, S.M.; R.M.; L.R.; P.P.; D.B.; E.A. and L.B.; formal analysis, S.M. and R.M.; investigation, S.M.; R.M. and L.R.; resources, S.M.; L.R.; P.P. and L.B.; data curation, S.M.; R.M. and L.R.; writing—original draft preparation, S.M.; M.C.V. and R.M.; writing—review and editing, S.M.; R.M.; L.R.; P.P.; D.B.; E.A. and L.B.; visualization, S.M.; R.M. and L.B.; supervision, S.M.; R.M. and L.B.; project administration, S.M.; R.M. and L.B.; funding acquisition, L.B. All authors have read and agreed to the published version of the manuscript.

Funding

This research received no external funding.

Institutional Review Board Statement

Not applicable.

Informed Consent Statement

Not applicable.

Data Availability Statement

The data presented in this study are available in here.

Acknowledgments

We would like to thank OLGENOME project, financed by MIPAAF DM 13938, for allowing access to the genome sequence data of cv. Leccino and also ENI CBC MED “LIVINGAGRO—Cross Border Living Laboratories for Agroforestry” project (GC A_A.2.1_0190 38/1315 OF). Special thanks to Marika Bocchini for her precious help in sampling of plant materials.

Conflicts of Interest

The authors declare no conflict of interest. The funders had no role in the design of the study; in the collection, analyses, or interpretation of data; in the writing of the manuscript, or in the decision to publish the results.

References

  1. Kim, G.U.; Seo, K.H.; Chen, D. Climate change over the Mediterranean and current destruction of marine ecosystem. Sci. Rep. 2019, 9, 18813. [Google Scholar] [CrossRef]
  2. Zaied, Y.B.; Zouabi, O. Impacts of climate change on Tunisian olive oil output. Clim. Change 2016, 139, 535–549. [Google Scholar] [CrossRef]
  3. Mousavi, S.; de la Rosa, R.; Moukhli, A.; El Riachy, M.; Mariotti, R.; Torres, M.; Pierantozzi, P.; Stanzione, V.; Mastio, V.; Zaher, H.; et al. Plasticity of fruit and oil traits in olive among different environments. Sci. Rep. 2019, 9, 16968. [Google Scholar] [CrossRef] [PubMed] [Green Version]
  4. Mousavi, S.; Mariotti, R.; Bagnoli, F.; Costantini, L.; Cultrera, N.G.; Arzani, K.; Pandolfi, S.; Vendramin, G.G.; Torkzaban, B.; Hosseini-Mazinani, M.; et al. The eastern part of the Fertile Crescent concealed an unexpected route of olive (Olea europaea L.) differentiation. Ann. Bot. 2017, 119, 1305–1318. [Google Scholar] [CrossRef]
  5. Trujillo, I.; Ojeda, M.A.; Urdiroz, N.M.; Potter, D.; Barranco, D.; Rallo, L.; Diez, C.M. Identification of the Worldwide Olive Germplasm Bank of Córdoba (Spain) using SSR and morphological markers. Tree Genet. 2014, 10, 141–155. [Google Scholar] [CrossRef]
  6. Diez, C.M.; Trujillo, I.; Martinez-Urdiroz, N.; Barranco, D.; Rallo, L.; Marfil, P.; Gaut, B.S. Olive domestication and diversification in the Mediterranean Basin. New Phytol. 2015, 206, 436–447. [Google Scholar] [CrossRef] [PubMed]
  7. Kchaou, H.; Larbi, A.; Gargouri, K.; Chaieb, M.; Morales, F.; Msallem, M. Assessment of tolerance to NaCl salinity of five olive cultivars, based on growth characteristics and Na+ and Cl exclusion mechanisms. Sci. Hortic. 2010, 124, 306–315. [Google Scholar] [CrossRef]
  8. Kasırğa, E.; Demiral, M. Salt stress-mineral nutrient relations in olive (Olea europaea L.) plant. Eurasian J. Soil Sci. 2016, 5, 307–313. [Google Scholar] [CrossRef] [Green Version]
  9. Soda, N.; Ephrath, J.E.; Dag, A.; Beiersdorf, I.; Presnov, E.; Yermiyahu, U.; Ben-Gal, A. Root growth dynamics of olive (Olea europaea L.) affected by irrigation induced salinity. Plant Soil 2017, 411, 305–318. [Google Scholar] [CrossRef]
  10. Mousavi, S.; Regni, L.; Bocchini, M.; Mariotti, R.; Cultrera, N.G.M.; Mancuso, S.; Googlani, J.; Chakerolhosseini, M.R.; Guerrero, C.; Albertini, E.; et al. Physiological, epigenetic and genetic regulation in some olive cultivars under salt stress. Sci. Rep. 2019, 9, 1093. [Google Scholar] [CrossRef] [Green Version]
  11. Regni, L.; Del Pino, A.M.; Mousavi, S.; Palmerini, C.A.; Baldoni, L.; Mariotti, R.; Mairech, H.; Gardi, T.; D’Amato, R.; Proietti, P. Behavior of four olive cultivars during salt stress. Front. Plant Sci. 2019, 10, 867. [Google Scholar] [CrossRef]
  12. Rossi, L.; Francini, A.; Minnocci, A.; Sebastiani, L. Salt stress modifies apoplastic barriers in olive (Olea europaea L.): A comparison between a salt-tolerant and a salt-sensitive cultivar. Sci. Hortic. 2015, 192, 38–46. [Google Scholar] [CrossRef]
  13. Rossi, L.; Borghi, M.; Francini, A.; Lin, X.; Xie, D.Y.; Sebastiani, L. Salt stress induces differential regulation of the phenylpropanoid pathway in Olea europaea cultivars Frantoio (salt-tolerant) and Leccino (salt-sensitive). J. Plant Physiol. 2016, 204, 8–15. [Google Scholar] [CrossRef] [PubMed]
  14. Yang, Y.; Guo, Y. Elucidating the molecular mechanisms mediating plant salt-stress responses. New Phytol. 2018, 217, 523–539. [Google Scholar] [CrossRef] [Green Version]
  15. Sun, L.; Zang, W.J.; Wang, H.; Zhao, M.; Yu, X.J.; He, X.; Miao, Y.; Zhou, J. Acetylcholine promotes ROS detoxification against hypoxia/reoxygenation-induced oxidative stress through FoxO3a/PGC-1α dependent superoxide dismutase. Cell. Physiol. Biochem. 2014, 34, 1614–1625. [Google Scholar] [CrossRef] [PubMed]
  16. Assaha, D.V.M.; Ueda, A.; Saneoka, H.; Al-Yahyai, R.; Yaish, M.W. The role of Na+ and K+ transporters in salt stress adaptation in glycophytes. Front. Physiol. 2017, 8, 509. [Google Scholar] [CrossRef] [PubMed]
  17. Ardie, S.W.; Liu, S.; Takano, T. Expression of the AKT1-type K (+) channel gene from Puccinellia tenuiflora, PutAKT1, enhances salt tolerance in Arabidopsis. Plant Cell Rep. 2010, 29, 865–874. [Google Scholar] [CrossRef]
  18. Ma, L.; Zhang, H.; Sun, L.; Jiao, Y.; Zhang, G.; Miao, C.; Hao, F. NADPH oxidase AtrbohD and AtrbohF function in ROS-dependent regulation of Na+/K+homeostasis in Arabidopsis under salt stress. J. Exp. Bot. 2012, 63, 305–317. [Google Scholar] [CrossRef] [PubMed]
  19. Ben Abdallah, M.; Trupiano, D.; Polzella, A.; De Zio, E.; Sassi, M.; Scaloni, A.; Zarrouk, M.; Ben Youssef, N.; Scippa, G.S. Unraveling physiological, biochemical and molecular mechanisms involved in olive (Olea europaea L. cv. Chétoui) tolerance to drought and salt stresses. J. Plant Physiol. 2018, 220, 83–95. [Google Scholar] [CrossRef]
  20. Melgar, J.C.; Syvertsen, J.P.; Martínez, V.; García-Sánchez, F. Leaf gas exchange, water relations, nutrient content and growth in citrus and olive seedlings under salinity. Biol. Plant 2008, 52, 385–390. [Google Scholar] [CrossRef]
  21. Assimakopoulou, A.; Salmas, I.; Roussos, P.A.; Nifakos, K.; Kalogeropoulos, P.; Kostelenos, G. Salt tolerance evaluation of nine indigenous Greek olive cultivars. J. Plant Nutr. 2017, 40, 1099–1110. [Google Scholar] [CrossRef]
  22. Bracci, T.; Minnocci, A.; Sebastiani, L. In vitro olive (Olea europaea L.) cvs Frantoio and Moraiolo microshoot tolerance to NaCl. Plant Biosyst. 2008, 142, 563–571. [Google Scholar] [CrossRef]
  23. Hu, W.; Yuan, Q.; Wang, Y.; Cai, R.; Deng, X.; Wang, J.; Zhou, S.; Chen, M.; Chen, L.; Huang, C.; et al. Overexpression of a wheat aquaporin gene, TaAQP8, enhances salt stress tolerance in transgenic tobacco. Plant Cell Physiol. 2012, 53, 2127–2141. [Google Scholar] [CrossRef] [PubMed] [Green Version]
  24. Sandhu, D.; Pudussery, M.V.; Kaundal, R.; Suarez, D.L.; Kaundal, A.; Sekhon, R.S. Molecular characterization and expression analysis of the Na+/H+ exchanger gene family in Medicago truncatula. Funct. Integr. Genom. 2018, 18, 141–153. [Google Scholar] [CrossRef]
  25. Brini, F.; Masmoudi, K. Ion Transporters and abiotic stress tolerance in plants. ISRN Mol. Biol. 2012, 2012, 927436. [Google Scholar] [CrossRef] [PubMed]
  26. Baghour, M.; Gálvez, F.J.; Sánchez, M.E.; Aranda, M.N.; Venema, K.; Rodríguez-Rosales, M.P. Overexpression of LeNHX2 and SlSOS2 increases salt tolerance and fruit production in double transgenic tomato plants. Plant Physiol. Biochem. 2019, 135, 77–86. [Google Scholar] [CrossRef] [PubMed]
  27. Yarra, R.; Kirti, P.B. Expressing class I wheat NHX (TaNHX2) gene in eggplant (Solanum melongena L.) improves plant performance under saline condition. Funct. Integr. Genom. 2019, 19, 541–554. [Google Scholar] [CrossRef]
  28. Liu, P.; Xu, Z.S.; Pan-Pan, L.; Hu, D.; Chen, M.; Li, L.C.; Ma, Y.Z. A wheat PI4K gene whose product possesses threonine autophophorylation activity confers tolerance to drought and salt in Arabidopsis. J. Exp. Bot. 2013, 64, 2915–2927. [Google Scholar] [CrossRef] [Green Version]
  29. Rubilar-Hernández, C.; Osorio-Navarro, C.; Cabello, F.; Norambuena, L. PI4KIIIβ activity regulates lateral root formation driven by endocytic trafficking to the vacuole. Plant Physiol. 2019, 181, 112–126. [Google Scholar] [CrossRef]
  30. Adams, E.; and Shin, R. Transport, signaling, and homeostasis of potassium and sodium in plants. J. Integr. Plant Biol. 2014, 56, 231–249. [Google Scholar] [CrossRef]
  31. Mazars, C.; Bourque, S.; Mithöfer, A.; Pugin, A.; Ranjeva, R. Calcium homeostasis in plant cell nuclei. New Phytol. 2009, 181, 261–274. [Google Scholar] [CrossRef] [PubMed]
  32. Wu, H.; Zhang, X.; Giraldo, J.P.; Shabala, S. It is not all about sodium: Revealing tissue specificity and signalling roles of potassium in plant responses to salt stress. Plant Soil 2018, 431, 1–17. [Google Scholar] [CrossRef]
  33. Luan, S.; Lan, W.; Chul Lee, S. Potassium nutrition, sodium toxicity, and calcium signaling: Connections through the CBL–CIPK network. Curr. Opin. Plant Biol. 2009, 12, 339–346. [Google Scholar] [CrossRef]
  34. Batistič, O.; Kudla, J. Plant calcineurin B-like proteins and their interacting protein kinases. Biochim. Biophys. Acta (BBA)-Mol. Cell Res. 2009, 1793, 985–992. [Google Scholar] [CrossRef] [PubMed] [Green Version]
  35. Chaumont, F.; Tyerman, S.D. Aquaporins: Highly regulated channels controlling plant water relations. Plant Physiol. 2014, 164, 1600–1618. [Google Scholar] [CrossRef] [Green Version]
  36. Zhou, L.; Wang, C.; Liu, R.; Han, Q.; Vandeleur, R.K.; Du, J.; Tyerman, S.; Shou, H. Constitutive overexpression of soybean plasma membrane intrinsic protein GmPIP1; 6 confers salt tolerance. BMC Plant Biol. 2014, 14, 181. [Google Scholar] [CrossRef] [Green Version]
  37. Kapilan, R.; Vaziri, M.; Zwiazek, J.J. Regulation of aquaporins in plants under stress. Biol. Res. 2018, 51, 4. [Google Scholar] [CrossRef]
  38. Pawłowicz, I.; Masajada, K. Aquaporins as a link between water relations and photosynthetic pathway in abiotic stress tolerance in plants. Gene 2019, 687, 166–172. [Google Scholar] [CrossRef]
  39. Zargar, S.M.; Nagar, P.; Deshmukh, R.; Nazir, M.; Wani, A.A.; Masoodi, K.Z.; Agrawal, G.K.; Rakwal, R. Aquaporins as potential drought tolerance inducing proteins: Towards instigating stress tolerance. J. Proteom. 2017, 169, 233–238. [Google Scholar] [CrossRef]
  40. Zheng, L.; Chen, S.; Xie, L.; Lu, Z.; Liu, M.; Han, X.; Qiao, G.; Jiang, J.; Zhuo, R.; Qiu, W.; et al. Overexpression of cysteine protease gene from Salix matsudana enhances salt tolerance in transgenic Arabidopsis. Environ. Exp. Bot. 2018, 147, 53–62. [Google Scholar] [CrossRef]
  41. Qin, Y.; Tian, Y.; Liu, X. A wheat salinity-induced WRKY transcription factor TaWRKY93 confers multiple abiotic stress tolerance in Arabidopsis thaliana. Biochem. Biophys. Res. Commun. 2015, 464, 428–433. [Google Scholar] [CrossRef] [PubMed]
  42. Huang, X.; Yang, L.; Jin, Y.; Lin, J.; Liu, F. Generation, annotation, and analysis of a large-scale expressed sequence tag library from Arabidopsis pumila to explore salt-responsive genes. Front. Plant Sci. 2017, 8, 955. [Google Scholar] [CrossRef] [PubMed] [Green Version]
  43. Laibach, N.; Schmidl, S.; Müller, B.; Bergmann, M.; Prüfer, D.; Schulze Gronover, C. Small rubber particle proteins from Taraxacum brevicorniculatum promote stress tolerance and influence the size and distribution of lipid droplets and artificial poly (cis -1,4-isoprene) bodies. Plant J. 2018, 93, 1045–1061. [Google Scholar] [CrossRef] [Green Version]
  44. Park, K.Y.; Kim, W.T.; Kim, E.Y. The proper localization of responsive to desiccation 20 in lipid droplets depends on their biogenesis induced by stress-related proteins in vegetative tissues. Biochem. Biophys. Res. Commun. 2018, 495, 1885–1889. [Google Scholar] [CrossRef]
  45. Kim, E.Y.; Park, K.Y.; Seo, Y.S.; Kim, W.T. Arabidopsis small rubber particle protein homolog SRPs play dual roles as positive factors for tissue growth and development and in drought stress responses. Plant Physiol. 2016, 170, 2494–2510. [Google Scholar] [CrossRef] [Green Version]
  46. Reddy, P.S.; Jogeswar, G.; Rasineni, G.K.; Maheswari, M.; Reddy, A.R.; Varshney, R.K.; Kishor, P.K. Proline over-accumulation alleviates salt stress and protects photosynthetic and antioxidant enzyme activities in transgenic sorghum [Sorghum bicolor (L.) Moench]. Plant Physiol. Biochem. 2015, 94, 104–113. [Google Scholar] [CrossRef] [PubMed] [Green Version]
  47. Khanna, R.; Kronmiller, B.; Maszle, D.R.; Coupland, G.; Holm, M.; Mizuno, T.; Wu, S.H. The Arabidopsis B-box zinc finger family. Plant Cell 2009, 21, 3416–3420. [Google Scholar] [CrossRef] [PubMed] [Green Version]
  48. Gangappa, S.N.; Botto, J.F. The BBX family of plant transcription factors. Trends Plant Sci. 2014, 19, 460–470. [Google Scholar] [CrossRef]
  49. Xu, Y.; Zhao, X.; Aiwaili, P.; Mu, X.; Zhao, M.; Zhao, J.; Cheng, L.; Ma, C.; Gao, J.; Hong, B. A zinc finger protein BBX19 interacts with ABF3 to affect drought tolerance negatively in chrysanthemum. Plant J. 2020, 103, 1783–1795. [Google Scholar] [CrossRef]
  50. Wang, M.J.; Ding, L.; Liu, X.H.; Liu, J.X. Two B-box domain proteins, BBX28 and BBX29, regulate flowering time at low ambient temperature in Arabidopsis. Plant Mol. Biol. 2021, 106, 21–32. [Google Scholar] [CrossRef]
  51. Mariotti, R.; Cultrera, N.G.; Díez, C.M.; Baldoni, L.; Rubini, A. Identification of new polymorphic regions and differentiation of cultivated olives (Olea europaea L.) through plastome sequence comparison. BMC Plant Biol. 2010, 10, 211. [Google Scholar] [CrossRef] [Green Version]
  52. Bazakos, C.; Manioudaki, M.E.; Therios, I.; Voyiatzis, D.; Kafetzopoulos, D.; Awada, T.; Kalaitzis, P. Comparative transcriptome analysis of two olive cultivars in response to NaCl-stress. PLoS ONE 2012, 7, e42931. [Google Scholar] [CrossRef]
  53. Bazakos, C.; Manioudaki, M.E.; Sarropoulou, E.; Spano, T.; Kalaitzis, P. 454 Pyrosequencing of olive (Olea europaea L.) transcriptome in response to salinity. PLoS ONE 2015, 10, e0143000. [Google Scholar] [CrossRef] [Green Version]
  54. Poku, S.A.; Seçgin, Z.; Kavas, M. Overexpression of Ks-type dehydrins gene OeSRC1 from Olea europaea increases salt and drought tolerance in tobacco plants. Mol. Biol. Rep. 2019, 46, 5745–5757. [Google Scholar] [CrossRef]
  55. Mariotti, R.; Belaj, A.; De La Rosa, R.; Leòn, L.; Brizioli, F.; Baldoni, L.; Mousavi, S. EST–SNP study of Olea europaea L. uncovers functional polymorphisms between cultivated and wild olives. Genes 2020, 11, 916. [Google Scholar] [CrossRef] [PubMed]
  56. Jiménez-Ruiz, J.; Ramírez-Tejero, J.A.; Fernández-Pozo, N.; Leyva-Pérez, M.D.L.O.; Yan, H.; Rosa, R.D.L.; Belaj, A.; Montes, E.; Rodríguez-Ariza, M.O.; Navarro, F.; et al. Transposon activation is a major driver in the genome evolution of cultivated olive trees (Olea europaea L.). Plant Genome 2020, 13, e20010. [Google Scholar] [CrossRef] [PubMed] [Green Version]
  57. Oteros, J.; García-Mozo, H.; Vázquez, L.; Mestre, A.; Domínguez-Vilches, E.; Galán, C. Modelling olive phenological response to weather and topography. Agric. Ecosyst. Environ. 2013, 179, 62–68. [Google Scholar] [CrossRef]
  58. Torres, M.; Pierantozzi, P.; Searles, P.; Rousseaux, M.C.; García-Inza, G.; Miserere, A.; Bodoira, R.; Contreras, C.; Maestri, D. Olive cultivation in the southern hemisphere: Flowering, water requirements and oil quality responses to new crop environments. Front. Plant Sci. 2017, 8, 1830. [Google Scholar] [CrossRef] [Green Version]
  59. Bader, B.; Aissaoui, F.; Kmicha, I.; Salem, A.B.; Chehab, H.; Gargouri, K.; Boujnah, D.; Chaieb, M. Effects of salinity stress on water desalination, olive tree (Olea europaea L. cvs ‘Picholine’,‘Meski’and ‘Ascolana’) growth and ion accumulation. Desalination 2015, 364, 46–52. [Google Scholar] [CrossRef]
  60. Chartzoulakis, K.; Loupassaki, M.; Bertaki, M.; Androulakis, I. Effects of NaCl salinity on growth, ion content and CO2 assimilation rate of six olive cultivars. Sci. Hortic. 2002, 96, 235–247. [Google Scholar] [CrossRef]
  61. Müller, M.; Kunz, H.H.; Schroeder, J.I.; Kemp, G.; Young, H.S.; Neuhaus, H.E. Decreased capacity for sodium export out of Arabidopsis chloroplasts impairs salt tolerance, photosynthesis and plant performance. Plant J. 2014, 78, 646–658. [Google Scholar] [CrossRef] [Green Version]
  62. Gálvez, F.J.; Baghour, M.; Hao, G.; Cagnac, O.; Rodríguez-Rosales, M.P.; Venema, K. Expression of LeNHX isoforms in response to salt stress in salt sensitive and salt tolerant tomato species. Plant Physiol. Biochem. 2012, 51, 109–115. [Google Scholar] [CrossRef]
  63. Pakzad, R.; Goharrizi, K.J.; Riahi-Madvar, A.; Amirmahani, F.; Mortazavi, M.; Esmaeeli, L. Identification of Lepidium draba Δ 1-pyrroline-5-carboxylate synthetase (P5CS) and assessment of its expression under NaCl stress: P5CS identification in L. draba plant. Proc. Natl. Acad. Sci. India Sect. B Biol. Sc. 2021, 91, 195–203. [Google Scholar] [CrossRef]
  64. Quan, R.; Wang, J.; Yang, D.; Zhang, H.; Zhang, Z.; Huang, R. EIN3 and SOS2 synergistically modulate plant salt tolerance. Sci. Rep. 2017, 7, 44637. [Google Scholar] [CrossRef] [Green Version]
  65. Guan, C.; Cui, X.; Liu, H.; Li, X.; Li, M.; Zhang, Y. Proline biosynthesis enzyme genes confer salt tolerance to switchgrass (Panicum virgatum L.) in cooperation with polyamines metabolism. Front. Plant Sci. 2020, 11, 46. [Google Scholar] [CrossRef]
  66. Funck, D.; Baumgarten, L.; Stift, M.; von Wirén, N.; Schönemann, L. Differential contribution of P5CS isoforms to stress tolerance in Arabidopsis. Front. Plant Sci. 2020, 11, 565134. [Google Scholar] [CrossRef]
  67. Liu, H.; Hu, M.; Wang, Q.; Cheng, L.; Zhang, Z. Role of papain-like cysteine proteases in plant development. Front. Plant Sci. 2018, 9, 1717. [Google Scholar] [CrossRef] [Green Version]
  68. Joaquín-Ramos, A.; Huerta-Ocampo, J.Á.; Barrera-Pacheco, A.; De León-Rodríguez, A.; Baginsky, S.; de la Rosa, A.P.B. Comparative proteomic analysis of amaranth mesophyll and bundle sheath chloroplasts and their adaptation to salt stress. J. Plant Physiol. 2014, 171, 1423–1435. [Google Scholar] [CrossRef]
  69. Mirzaei, S.; Mansouri, M.; Mohammadi-Nejad, G.; Sablok, G. Comparative assessment of chloroplast transcriptional responses highlights conserved and unique patterns across Triticeae members under salt stress. Photosynth. Res. 2018, 136, 357–369. [Google Scholar] [CrossRef]
  70. Pandey, G.K.; Kanwar, P.; Singh, A.; Steinhorst, L.; Pandey, A.; Yadav, A.K.; Tokas, I.; Sanyal, S.K.; Kim, B.G.; Lee, S.C.; et al. Calcineurin B-like protein-interacting protein kinase CIPK21 regulates osmotic and salt stress responses in Arabidopsis. Plant Physiol. 2015, 169, 780–792. [Google Scholar] [CrossRef] [Green Version]
  71. Bai, M.; Sun, J.; Liu, J.; Ren, H.; Wang, K.; Wang, Y.; Wang, C.; Dehesh, K. The B-box protein BBX19 suppresses seed germination via induction of ABI5. Plant J. 2019, 99, 1192–1202. [Google Scholar] [CrossRef]
  72. Jia, J.; Liang, Y.; Gou, T.; Hu, Y.; Zhu, Y.; Huo, H.; Guo, J.; Gong, H. The expression response of plasma membrane aquaporins to salt stress in tomato plants. Environ. Exp. Bot. 2020, 178, 104190. [Google Scholar] [CrossRef]
  73. Pou, A.; Jeanguenin, L.; Milhiet, T.; Batoko, H.; Chaumont, F.; Hachez, C. Salinity-mediated transcriptional and post-translational regulation of the Arabidopsis aquaporin PIP2; 7. Plant Mol. Biol. 2016, 92, 731–744. [Google Scholar] [CrossRef]
  74. Katsuhara, M.; Tsuji, N.; Shibasaka, M.; Panda, S.K. Osmotic stress decreases PIP aquaporin transcripts in barley roots but H 2 O 2 is not involved in this process. J. Plant Res. 2014, 127, 787–792. [Google Scholar] [CrossRef] [PubMed]
  75. Hachez, C.; Veselov, D.; Ye, Q.; Reinhardt, H.; Knipfer, T.; Fricke, W.; Chaumont, F. Short-term control of maize cell and root water permeability through plasma membrane aquaporin isoforms. Plant. Cell Environ. 2012, 35, 185–198. [Google Scholar] [CrossRef]
  76. Hosseini, S.A.; Gharechahi, J.; Heidari, M.; Koobaz, P.; Abdollahi, S.; Mirzaei, M.; Nakhoda, B.; Salekdeh, G.H. Comparative proteomic and physiological characterisation of two closely related rice genotypes with contrasting responses to salt stress. Funct. Plant Biol. 2015, 42, 527–542. [Google Scholar] [CrossRef] [PubMed] [Green Version]
  77. Fercha, A.; Capriotti, A.L.; Caruso, G.; Cavaliere, C.; Stampachiacchiere, S.; Chiozzi, R.Z.; Laganà, A. Shotgun proteomic analysis of soybean embryonic axes during germination under salt stress. Proteomics 2016, 16, 1537–1546. [Google Scholar] [CrossRef] [PubMed]
  78. Weissbein, S.; Wiesman, Z.; Ephrath, Y.; Silberbush, M. Vegetative and reproductive response of olive cultivars to moderate saline water irrigation. HortScience 2008, 43, 320–327. [Google Scholar] [CrossRef] [Green Version]
  79. Cuin, T.A.; Shabala, S. Exogenously supplied compatible solutes rapidly ameliorate NaCl-induced potassium efflux from barley roots. Plant Cell Physiol. 2005, 46, 1924–1933. [Google Scholar] [CrossRef] [Green Version]
  80. Cruz, F.; Julca, I.; Gómez-Garrido, J.; Loska, D.; Marcet-Houben, M.; Cano, E.; Galán, B.; Frias, L.; Ribeca, P.; Derdak, S.; et al. Genome sequence of the olive tree, Olea europaea. Gigascience 2016, 5, s13742-016. [Google Scholar] [CrossRef] [PubMed]
  81. Unver, T.; Wu, Z.; Sterck, L.; Turktas, M.; Lohaus, R.; Li, Z.; Yang, M.; He, L.; Deng, T.; Escalante, F.J.; et al. Genome of wild olive and the evolution of oil biosynthesis. Proc. Natl. Acad. Sci. USA 2017, 114, E9413–E9422. [Google Scholar] [CrossRef] [PubMed] [Green Version]
  82. Solovyev, V.V.; Shahmuradov, I.A.; Salamov, A.A. Identification of promoter regions and regulatory sites. Methods Mol. Biol. 2010, 674, 57–83. [Google Scholar] [CrossRef] [PubMed]
  83. Onofri, A. DSAASTAT a New Excel VBA Macro to Perform Basic Statistical Analyses of Field Trials; Department of Agriculture and Environmental Sciences, University of Perugia: Perugia, Italy, 2010. [Google Scholar]
Figure 1. Plant growth measurements of four cultivars at 0 (green) and 200 mM NaCl (red), after 240 DATS of salt stress. Bars represent means ±SD of three replicates. Asterisks show **** p = 0.000, *** p < 0.001, ** p < 0.01 and * p < 0.05 and ns represents not significant values.
Ijms 23 00154 g001
Figure 2. Plants after 240 DATS under control and salt stress conditions (200 mM of NaCl) of cvs. Royal, Koroneiki, Picual and Fadak86.
Ijms 23 00154 g002
Figure 3. The violin graphs for Na+ and K+ ions and their ratio in leaves of analyzed plants. Each plot shows the distribution of data for four cultivars from the minimum to the maximum level, with horizontal inner lines showing the median. Dot lines represent the lower and upper limits of the first and third quartiles. The horizontal width of the violin depends on data density.
Ijms 23 00154 g003
Figure 4. Gene structure of ten genes was identified in the present study in olive cvs.
Ijms 23 00154 g004
Figure 5. Gene expression under salt stress, as determined by RT-qPCR. (A) Genes highly expressed in tolerant olive cultivars. (B) differentially expressed genes in tolerant and susceptible cultivars. Leaves of plants under control conditions or treated at 200 mM NaCl were analyzed at time point 0, 180, 210 and 240 DATS. Plants in recovery at 14 and 21 DARS. Values are means of three biological replicates and three technical replicates. Different letters correspond to significantly different values at p ≤ 0.01.
Ijms 23 00154 g005aIjms 23 00154 g005b
Table 1. Identified genes and corresponding transcripts, proteins and chromosome position in Olea europaea cv. Leccino genome.
Gene NameGenotypeGenomic ScaffoldmRNA/CDSProteinChromosome/Linkage GroupCommentAccession Number
OeNHX7FargaOe6_s07827predictedpredicted OK637283
var. sylvestrisNC_036248.1publishedpredicted12 XM_023036083.1
Leccino partialtig00005075predicted-6
Picual partialOleur061Scf1390, Oleur061Scf2766predicted partial- [56]
OeNHX6FargaOe6_s09856predictedpredicted OK637277
var. sylvestrisNC_036249.1publishedpublished13 XM_023036540.1
Leccino partialscaffold75631, scaffold60078, scaffold108620predicted partialpredicted partial8
Picual partialOleur061Scf1057predictedpredicted Published cds do not correspond to the other three genomes[56]
OeP5CSFargaOe6_s02546predictedpredicted OL310482
var. sylvestrisCM008527.1publishedpublished13 XM_023036864.1
Leccinoscaffold44052 + 94205.1predictedpredicted8 OK637278
PicualOleur061Scf2321predictedpredicted Published cds are partial[56]
OePIK4gFargaOe6_s03937predictedpredicted OL310483
var. sylvestris partialCM008529.1not completenot complete15 XM_023040706.1
Leccinoscaffold20411.1publishedpublished23 * MF958940.1
PicualOleur061Scf0433predictedpredicted Published cds do not correspond to the other two genomes[56]
OeCBL3FargaOe6_s03919predictedpredicted OK637279
var. sylvestris partialCM008521.1publishedpublished7Published protein does not correspond to the other three genomesXM_023001857.1
Leccino partialscaffold19373predicted partialpredicted partial8
PicualOleur061Scf1775predictedpredicted Published cds is partial[56]
OeBBX19FargaOe6_s01951predictedpredicted OL310484
var. sylvestrisNC_036241.1publishedpublished5 XM_023020441.1
Leccinoscaffold28640.1predictedpredicted23 * OK637280
Picual partialOleur061Scf0258predicted partialpredicted partial Published cds and protein do not correspond to the three genomes[56]
OeRD19AFargaOe6_s05921predictedpredicted OL310485
not find in var. sylvestris XM_023001197.1
Leccinoscaffold33560.1predictedpredicted6 OK637281
not find in Picual --
OePIP1.1FargaOe6_s00807predictedpredicted OL310486
var. sylvestrisNC_036255.1publishedpublished19 XM_022990009.1
Leccinoscaffold116227.1publishedpublished14 * MF784562
PicualOleur061Scf2846predictedpredicted Published cds and protein are partial[56]
OeSRPFargaOe6_s02151predictedpredicted OL310487
var. sylvestrisNC_036256.1publishedpublished20 XM_022991523.1
Leccinoscaffold70781predictedpredicted17 OK637282
PicualOleur061Scf3856publishedpublished [56]
OePetDLeccinoscaffold168451publishedpublished Chloroplast geneGU931818.1
* The scaffolds where the gene is located were mapped in different linkage groups, here was reported the most frequent linkage group based on the position of the gene.
Table 2. Identified genes, their structure and putative biological process.
Gene NameGenomic Sequence Length (bp)Transcript Sequence Length (bp)CDS Sequence Length (bp)Peptide Sequence LengthMolecular FunctionBiological Process
OeNHX7 *58,52229402646882Potassium/proton and sodium/proton antiporter activityPotassium ion transmembrane transport; regulation of intracellular pH; regulation of reactive oxygen species metabolic process; response to hydrogen peroxide; response to oxidative stress; response to reactive oxygen species; response to salt stress; sodium ion imports across plasma membrane sodium ion transport
OeNHX6 *741020871572524Potassium/proton and sodium/proton antiporter activityPotassium ion transmembrane transport; regulation of intracellular pH; sodium ion imports across plasma membrane
OeP5CS687725701893631ATP binding; delta1-pyrroline-5-carboxylate synthetase activity; glutamate 5-kinase activity; glutamate-5-semialdehyde dehydrogenase activityHyperosmotic salinity response; L-proline biosynthetic process; pollen development; proline biosynthetic process; response to oxidative stress; response to salt stress; response to water deprivation; root development
OePIK4g5122357617435811-phosphatidylinositol 4-kinase activity; ATP binding; protein serine/threonine kinase activityCellular response to hypoxia; phosphatidylinositol phosphorylation; protein autophosphorylation; response to salt stress
OeCBL3 *38871661675225Calcium ion binding; kinase bindingDetection of calcium ion; potassium ion homeostasis
OeBBX193175993648216Zinc ion bindingNegative regulation of photo-morphogenesis; photo-morphogenesis; regulation of transcription, DNA-templated
OeRD19A247113681131377Cysteine-type endopeptidase activityDefense response to bacterium; proteolysis involved in cellular protein catabolic process; response to osmotic stress; response to salt stress
OePIP1.121091465858286Water channel activityResponse to water deprivation; water transport
OeSRP13471059750250No information in uniprotDevelopmental vegetative growth; lipid droplet organization; pollen development; positive regulation of growth; positive regulation of response to water deprivation
OePetD160-15953Electron transporter, transferring electrons within cytochrome b6/f complex of photosystem II activity; electron transporter, transferring electrons within the cyclic electron transport pathway of photosynthesis activityPhotosynthetic electron transport chain
* These three genes were predicted from the published scaffolds of cv. Farga, while for other seven genes the reference genome was cv. Leccino.
Table 3. Specific primers used for quantitative expression of ten candidate transcripts.
Gene NamePrimer 5′-3′Amplified Lenght (bp)Position on the Gene Sequence
OeNHX7Fw-GGCGCATATTGGAATACACGA112Exon 20
Rev-GCTGACTGGCCTACTGTTAAGA
OeNHX6Fw-CAGAAGGGCTTGGTCTCTCC382Exon 13–15
Rev-CATAGCTGGTCCCATGTCGG
OeP5CSFw-GGGAAAGGAGGCCAGAAGAT202Exon 8–9
Rev-GGGACTCATTGGACTGGTGA
OePIK4gFw-AGTTCTGGTTAGGTGCCTGC167Exon 1
Rev-TGCGGTCTTGGATATGAGGA
OeCBL3Fw-TGAAACCTTGTTGCTTGAGATCA200Exon 4–5
Rev-GGATGGAATACAGAAAGTGCACG
OeBBX19Fw-CTCAATGCCAGACCTCAACG260Exon 4–5
Rev-TGGCAATCATCATGAAGGTGC
OeRD19AFw-TCCACAAGCTGCTGTTCACT82Exon 4
Rev-CAGCGCTCCGGTTGTACTAA
OePIP1.1Fw-AAATCCGGCAGTGACTTTCG92Exon 2
Rev-GATGCAGTGTCTTGGAGCCA
OeSRPFw-CCATTGGTAGAAACAGCCGG93Exon 1
Rev-GCAGGTAATACGACAGCGGA
OePetDFw-AATGATCCTGTATTAAGAGCT307Chloroplast gene
Rev-CTGCGGGATTATTAACAGTA
Publisher’s Note: MDPI stays neutral with regard to jurisdictional claims in published maps and institutional affiliations.

