
A Holistic Approach to Determining Stereochemistry of Potential Pharmaceuticals by Circular Dichroism with β-Lactams as Test Cases †


Abstract
:
1. Introduction
2. Results and Discussion
2.1. General Information on Calculation Methods
- (1)
- Conformational search.
- (2)
- Calculating the CD spectra of conformers found.
- (3)
- Calculating the Boltzmann average of the CD spectra of single conformers to compare the final CD spectrum with the experimental one.
2.2. Solving Stereochemical Problems Step by Step
3. Materials and Methods
3.1. General Information
3.2. Computational Section
4. Conclusions
Supplementary Materials
Author Contributions
Funding
Institutional Review Board Statement
Informed Consent Statement
Data Availability Statement
Conflicts of Interest
Abbreviations
| 3D | three-dimensional structure |
| AC | absolute configuration |
| CD | circular dichroism |
| DFT | density functional theory |
| DRCD | diffused reflectance CD |
| ECD | electronic circular dichroism |
| PCM | polarizable continuum model |
| PES | potential energy surface |
| QC | quantum chemistry |
| SF | similarity factor |
| TBDMS | tert-Butyldimethylsilyl |
| VCD | vibrational circular dichroism |
References
- Elder, F.C.T.; Feil, E.J.; Snape, J.; Gaze, W.H.; Kasprzyk-Hordern, B. The role of stereochemistry of antibiotic agents in the development of antibiotic resistance in the environment. Environ. Int. 2020, 139, 105681. [Google Scholar] [CrossRef]
- McConathy, J.; Owens, M.J. Stereochemistry in drug action. Prim. Care Companion J. Clin. Psychiatry 2003, 5, 70–73. [Google Scholar] [CrossRef] [PubMed] [Green Version]
- Gandhi, K.; Shah, U.; Patel, S. Drug Stereochemistry: A prodigy for pharmacology and drug development. Curr. Drug Discov. Technol. 2020, 17, 565–573. [Google Scholar] [CrossRef] [PubMed]
- Flack, H.D. Virtual issue on absolute structure. Acta Crystallogr. C 2012, 68, e13–e14. [Google Scholar] [CrossRef] [PubMed] [Green Version]
- Mori, K.; Akasaka, K.; Matsunaga, S. Chemoenzymatic synthesis and HPLC analysis of the stereoisomers of miyakosyne A [(4E,24E)-14-methyloctacosa-4,24-diene-1,27-diyne-3,26-diol], a cytotoxic metabolite of a marine sponge Petrosia sp., to determine the absolute configuration of its major component as 3R,14R,26R. Tetrahedron 2014, 70, 392–401. [Google Scholar]
- Jones, P.G. Crystal structure determination: A critical view. Chem. Soc. Rev. 1984, 13, 157–172. [Google Scholar] [CrossRef]
- Szybinski, M.; Sektas, K.; Sicinski, R.R.; Plum, L.A.; Frelek, J.; DeLuca, H.F. Design, synthesis and biological properties of seco-d-ring modified 1α,25-dihydroxyvitamin D3 analogues. J. Steroid Biochem. Mol. Biol. 2017, 171, 144–154. [Google Scholar] [CrossRef]
- Tranter, G.E.; Le Pevelen, D.D. Chiroptical spectroscopy and the validation of crystal structure stereochemical assignments. Tetrahedron Asymmetry 2017, 28, 1192–1198. [Google Scholar] [CrossRef]
- Covington, C.L.; Raghavan, V.; Smuts, J.P.; Armstrong, D.W.; Polavarapu, P.L. Absolute configuration of an axially chiral sulfonate determined from its optical rotatory dispersion, electronic circular dichroism, and vibrational circular dichroism spectra. Chirality 2017, 29, 670–676. [Google Scholar] [CrossRef]
- Rode, J.E.; Frelek, J. Circular dichroism spectroscopy and DFT calculations in determining absolute configuration and E/Z isomers of conjugated oximes. Chirality 2017, 29, 653–662. [Google Scholar] [CrossRef] [PubMed]
- Superchi, S.; Scafato, P.; Górecki, M.; Pescitelli, G. Absolute configuration determination by quantum mechanical calculation of chiroptical spectra: Basics and applications to fungal metabolites. Curr. Med. Chem. 2017, 25, 287–320. [Google Scholar] [CrossRef] [PubMed]
- Vergura, S.; Pisani, L.; Scafato, P.; Casarini, D.; Superchi, S. Central-to-axial chirality induction in biphenyl chiroptical probes for the stereochemical characterization of chiral primary amines. Org. Biomol. Chem. 2018, 16, 555–565. [Google Scholar] [CrossRef] [PubMed]
- Demarque, D.P.; Pinho, D.R.; Lopes, N.P.; Merten, C. Revisiting empirical rules for the determination of the absolute configuration of cascarosides and other (ox-)anthrones. Chirality 2018, 30, 432–438. [Google Scholar] [CrossRef]
- Pescitelli, G.; Di Bari, L. Revision of the absolute configuration of preussilides a–f established by the exciton chirality method. J. Nat. Prod. 2017, 80, 2855–2859. [Google Scholar] [CrossRef]
- Górecki, M.; Frelek, J. Towards seeking the right chiroptical tool to assign the stereochemistry of bioactive compounds: Effectiveness, challenges, and perspectives. TrAC 2021, 144, 116428. [Google Scholar] [CrossRef]
- Kołodziejska, R.; Górecki, M.; Frelek, J.; Dramiński, M. Enantioselective enzymatic desymmetrization of the prochiral pyrimidine acyclonucleoside. Tetrahedron Asymmetry 2012, 23, 683–689. [Google Scholar] [CrossRef]
- Pech-Puch, D.; Joseph-Nathan, P.; Burgueño-Tapia, E.; González-Salas, C.; Martínez-Matamoros, D.; Pereira, D.M.; Pereira, R.B.; Jiménez, C.; Rodríguez, J. Absolute configuration by vibrational circular dichroism of anti-inflammatory macrolide briarane diterpenoids from the Gorgonian Briareum asbestinum. Sci. Rep. 2021, 11, 496. [Google Scholar] [CrossRef] [PubMed]
- U.S. Pharmacopeia. USP 39-NF34; Chapters 782 and 1782; U.S. Pharmacopeia: North Bethesda, MD, USA, 2016. [Google Scholar]
- Polavarapu, P.L. Why is it important to simultaneously use more than one chiroptical spectroscopic method for determining the structures of chiral molecules? Chirality 2008, 20, 664–672. [Google Scholar] [CrossRef] [PubMed]
- Allenmark, S.; Gawroński, J. Determination of absolute configuration—An overview related to this special issue. Chirality 2008, 20, 606–608. [Google Scholar] [CrossRef] [PubMed]
- Popik, O.; Pasternak-Suder, M.; Leśniak, K.; Jawiczuk, M.; Górecki, M.; Frelek, J.; Mlynarski, J. Amine-catalyzed direct aldol reactions of hydroxy- and dihydroxyacetone: Biomimetic synthesis of carbohydrates. J. Org. Chem. 2014, 79, 5728–5739. [Google Scholar] [CrossRef] [PubMed]
- Polavarapu, P.L.; Frelek, J.; Woźnica, M. Determination of the absolute configurations using electronic and vibrational circular dichroism measurements and quantum chemical calculations. Tetrahedron Asymmetry 2011, 22, 1720–1724. [Google Scholar] [CrossRef]
- Jawiczuk, M.; Górecki, M.; Masnyk, M.; Frelek, J. Complementarity of electronic and vibrational circular dichroism based on stereochemical studies of vic-diols. TrAC 2015, 73, 119–128. [Google Scholar] [CrossRef]
- Berova, N.; Polavarapu, P.L.; Nakanishi, K.; Woody, R.W. Electronic CD exciton chirality method: Principles and applications. In Comprehensive Chiroptical Spectroscopy; John Wiley and Sons: Hoboken, NJ, USA, 2012; Volume 2, pp. 115–167. [Google Scholar]
- Qiu, S.; De Gussem, E.; Abbaspour Tehrani, K.; Sergeyev, S.; Bultinck, P.; Herrebout, W. Stereochemistry of the tadalafil diastereoisomers: A critical assessment of vibrational circular dichroism, electronic circular dichroism, and optical rotatory dispersion. J. Med. Chem. 2013, 56, 8903–8914. [Google Scholar] [CrossRef]
- Górecki, M.; Capozzi, M.A.M.; Albano, G.; Cardellicchio, C.; Di Bari, L.; Pescitelli, G. Stereochemical analysis of β-keto sulfoxides by circular dichroism. Chirality 2018, 30, 29–42. [Google Scholar] [CrossRef] [PubMed]
- Górecki, M.; Zullo, V.; Iuliano, A.; Pescitelli, G. On the absolute stereochemistry of tolterodine: A circular dichroism study. Pharmaceuticals 2019, 12, 21. [Google Scholar] [CrossRef] [Green Version]
- Bush, K.; Bradford, P.A. β-lactams and β-lactamase inhibitors: An overview. Cold Spring Harb. Perspect. Med. 2016, 6, a025247. [Google Scholar] [CrossRef] [PubMed]
- Qin, W.; Panunzio, M.; Biondi, S. β-lactam antibiotics renaissance. Antibiotics 2014, 3, 193–215. [Google Scholar] [CrossRef]
- Woźnica, M.; Frelek, J. Application of on-line HPLC-CD detection in separation and structure elucidation of tricyclic cephalosporine oxaanalogues with chromane moiety. J. Bioanal. Biomed. 2016, 8, 1000e136. [Google Scholar] [CrossRef]
- Woźnica, M.; Kowalska, P.; Łysek, R.; Masnyk, M.; Górecki, M.; Kwit, M.; Furche, F.; Frelek, J. Stereochemical assingment of beta-lactam antibiotics and their analogues by electronic circular dichroism spectroscopy. Curr. Org. Chem. 2010, 14, 1022–1036. [Google Scholar] [CrossRef]
- Łysek, R.; Borsuk, K.; Chmielewski, M.; Kałuża, Z.; Urbańczyk-Lipkowska, Z.; Klimek, A.; Frelek, J. 5-Dethia-5-oxacephams: toward correlation of absolute configuration and chiroptical properties. J. Org. Chem. 2002, 67, 1472–1479. [Google Scholar] [CrossRef]
- Frelek, J.; Kowalska, P.; Masnyk, M.; Kazimierski, A.; Korda, A.; Woźnica, M.; Chmielewski, M.; Furche, F. Circular dichroism and conformational dynamics of cephams and their carba and oxa analogues. Chem.Eur. J. Chem. 2007, 13, 6732–6744. [Google Scholar] [CrossRef]
- Danh, T.T.; Borsuk, K.; Solecka, J.; Chmielewski, M. An entry to 7-amino- and to 2-ethoxycarbonyl-5-dethia-5-oxa-cephams from 1,3-alkylidene-l-erythritol. Tetrahedron 2006, 62, 10928–10936. [Google Scholar] [CrossRef]
- Górecki, M.; Jabłońska, E.; Kruszewska, A.; Suszczyńska, A.; Urbańczyk-Lipkowska, Z.; Gerards, M.; Morzycki, J.W.; Szczepek, W.J.; Frelek, J. Practical method for the absolute configuration assignment of tert/tert 1,2-diols using their complexes with Mo2(OAc)4. J. Org. Chem. 2007, 72, 2906–2916. [Google Scholar] [CrossRef]
- Pescitelli, G.; Bruhn, T. Good computational practice in the assignment of absolute configurations by TDDFT calculations of ecd spectra. Chirality 2016, 28, 466–474. [Google Scholar] [CrossRef] [Green Version]
- Bruhn, T.; Schaumlöffel, A.; Hemberger, Y.; Bringmann, G. SpecDis: Quantifying the comparison of calculated and experimental electronic circular dichroism spectra. Chirality 2013, 25, 243–249. [Google Scholar] [CrossRef]
- Covington, C.L.; Polavarapu, P.L. Similarity in dissymmetry factor spectra: A quantitative measure of comparison between experimental and predicted vibrational circular dichroism. J. Phys. Chem. A 2013, 117, 3377–3386. [Google Scholar] [CrossRef]
- Masi, M.; Reveglia, P.; Baaijens-Billones, R.; Górecki, M.; Pescitelli, G.; Savocchia, S.; Evidente, A. Phytotoxic metabolites from three neofusicoccum species causal agents of botryosphaeria dieback in australia, luteopyroxin, neoanthraquinone, and luteoxepinone, a disubstituted furo-α-pyrone, a hexasubstituted anthraquinone, and a trisubstituted oxepi-2-one from neofusicoccum luteum. J. Nat. Prod. 2020, 83, 453–460. [Google Scholar]
- Bashiri, S.; Abdollahzadeh, J.; Di Lecce, R.; Alioto, D.; Górecki, M.; Pescitelli, G.; Masi, M.; Evidente, A. Rabenchromenone and rabenzophenone, phytotoxic tetrasubstituted chromenone and hexasubstituted benzophenone constituents produced by the oak-decline-associated fungus fimetariella rabenhorstii. J. Nat. Prod. 2020, 83, 447–452. [Google Scholar] [CrossRef] [PubMed]
- Ka, S.; Masi, M.; Merindol, N.; Di Lecce, R.; Plourde, M.B.; Seck, M.; Górecki, M.; Pescitelli, G.; Desgagne-Penix, I.; Evidente, A. Gigantelline, gigantellinine and gigancrinine, cherylline- and crinine-type alkaloids isolated from Crinum jagus with anti-acetylcholinesterase activity. Phytochemistry 2020, 175, 112390. [Google Scholar] [CrossRef] [PubMed]
- Iwanejko, J.; Sowiński, M.; Wojaczyńska, E.; Olszewski, T.K.; Górecki, M. An approach to new chiral bicyclic imines and amines via Horner–Wadsworth–Emmons reaction. RSC Adv. 2020, 10, 14618–14629. [Google Scholar] [CrossRef] [Green Version]
- Cimmino, A.; Nocera, P.; Linaldeddu, B.T.; Masi, M.; Gorecki, M.; Pescitelli, G.; Montecchio, L.; Maddau, L.; Evidente, A. Phytotoxic metabolites produced by diaporthella cryptica, the causal agent of hazelnut branch canker. J. Agric. Food Chem. 2018, 66, 3435–3442. [Google Scholar] [CrossRef]
- Wei, J.; Guo, W.H.; Cao, C.Y.; Kou, R.W.; Xu, Y.Z.; Górecki, M.; Di Bari, L.; Pescitelli, G.; Gao, J.M. Polyoxygenated cyathane diterpenoids from the mushroom Cyathus africanus, and their neurotrophic and anti-neuroinflammatory activities. Sci. Rep. 2018, 8, 2175. [Google Scholar] [CrossRef] [Green Version]
- Woźnica, M.; Masnyk, M.; Stecko, S.; Mames, A.; Furman, B.; Chmielewski, M.; Frelek, J. Structure−chiroptical properties relationship of carbapenams by experiment and theory. J. Org. Chem. 2010, 75, 7219–7226. [Google Scholar] [CrossRef]
- Woźnica, M.; Butkiewicz, A.; Grzywacz, A.; Kowalska, P.; Masnyk, M.; Michalak, K.; Luboradzki, R.; Furche, F.; Kruse, H.; Grimme, S.; et al. Ring-expanded bicyclic β-lactams: A structure−chiroptical properties relationship investigation by experiment and calculations. J. Org. Chem. 2011, 76, 3306–3319. [Google Scholar] [CrossRef]
- Kutaszewicz, R.; Grzeszczyk, B.; Górecki, M.; Staszewska-Krajewska, O.; Furman, B.; Chmielewski, M. Bypassing the stereoselectivity issue: Transformations of Kinugasa adducts from chiral alkynes and non-chiral acyclic nitrones. Org. Biomol. Chem. 2019, 17, 6251–6268. [Google Scholar] [CrossRef] [PubMed]
- Woźnica, M. Structural Studies of β-lactam Antibiotic Analogues by Circular Dichroism. Ph.D. Thesis, Institute of Organic Chemistry Polish Academy of Sciences, Warsaw, Poland, 2011. [Google Scholar]
- Butkiewicz, O. Synthesis, Structure, Chiroptical Properties, and Biological Activity of β-lactam Antibiotic Analogs. Master’s Thesis, Warsaw Uniwersity of Technology, Warsaw, Poland, 2009. [Google Scholar]
- Merten, C. Vibrational optical activity as probe for intermolecular interactions. Phys. Chem. Chem. Phys. 2017, 19, 18803–18812. [Google Scholar] [CrossRef] [PubMed]
- Onys’ko, P.P.; Zamulko, K.A.; Kyselyova, O.I.; Syzonenko, Y.A. Novel 2H-1,3-benzoxazine ring formation by intramolecular heterocyclization of N-(α-aryloxyalkyl)imidoyl chlorides. Heterocycl. Commun. 2017, 23, 421–428. [Google Scholar] [CrossRef]
- Eldin, N.A.E.S. 3,4-Dihydro-2H-1,3-benzoxazines and their oxo-derivatives–chemistry and bioactivities. J. Serb. Chem. Soc. 2021, 86, 213–246. [Google Scholar]
- Kozioł, A.; Frelek, J.; Woźnica, M.; Furman, B.; Chmielewski, M. An enantioselective synthesis of 3,4-Benzo-5-oxacephams. Eur. J. Org. Chem. 2009, 2009, 338–341. [Google Scholar] [CrossRef]
- Kozioł, A.; Furman, B.; Frelek, J.; Woźnica, M.; Altieri, E.; Chmielewski, M. Chiral base-catalyzed enantioselective synthesis of 4-aryloxyazetidinones and 3,4-benzo-5-oxacephams. J. Org. Chem. 2009, 74, 5687–5690. [Google Scholar] [CrossRef] [PubMed]
- Banik, B.K. β-lactams: Novel Synthetic Pathways and Applications; Springer International Publishing: Berlin/Heidelberg, Germany, 2017. [Google Scholar]
- Johnson, J.L.; Raghavan, V.; Cimmino, A.; Moeini, A.; Petrovic, A.G.; Santoro, E.; Superchi, S.; Berova, N.; Evidente, A.; Polavarapu, P.L. Absolute configurations of chiral molecules with multiple stereogenic centers without prior knowledge of the relative configurations: A case study of inuloxin C. Chirality 2018, 30, 1206–1214. [Google Scholar] [CrossRef]
- Laane, J. Frontiers and Advances in Molecular Spectroscopy; Elsevier: Amsterdam, The Netherlands, 2018; Volume 1, pp. 421–471. [Google Scholar]
- Bloino, J.; Biczysko, M.; Barone, V. Anharmonic effects on vibrational spectra intensities: Infrared, raman, vibrational circular dichroism, and raman optical activity. J. Phys. Chem. A 2015, 119, 11862–11874. [Google Scholar] [CrossRef] [Green Version]
- Nafie, L.A. Vibrational optical activity: From discovery and development to future challenges. Chirality 2020, 32, 667–692. [Google Scholar] [CrossRef]
- Merten, C.; Golub, T.P.; Kreienborg, N.M. Absolute configurations of synthetic molecular scaffolds from vibrational cd spectroscopy. J. Org. Chem. 2019, 84, 8797–8814. [Google Scholar] [CrossRef]
- Bannwarth, C.; Caldeweyher, E.; Ehlert, S.; Hansen, A.; Pracht, P.; Seibert, J.; Spicher, S.; Grimme, S. Extended tight-binding quantum chemistry methods. WIREs Comput. Mol. Sci. 2021, 11, e1493. [Google Scholar] [CrossRef]
- Castiglioni, E.; Albertini, P. An integrating sphere to measure CD from difficult samples. Chirality 2000, 12, 291–294. [Google Scholar] [CrossRef]
- Batista, A.N.L.; Angrisani, B.R.P.; Lima, M.E.D.; da Silva, S.M.P.; Schettini, V.H.; Chagas, H.A.; dos Santos, F.M., Jr.; Batista, J.M., Jr.; Valverde, A.L. Absolute configuration reassignment of natural products: An overview of the last decade. J. Braz. Chem. Soc. 2021, 32, 1499–1518. [Google Scholar] [CrossRef]
- Górecki, M.; Frelek, J. A critical appraisal of dimolybdenum tetraacetate application in stereochemical studies of vic-diols by circular dichroism. J. Nat. Prod. 2020, 83, 955–964. [Google Scholar] [CrossRef]
- Lipták, A.; Frelek, J.; Snatzke, G.; Vlahov, I. Chiroptical properties of pyranoid glycols in the presence of [Mo2(O[2CCH3)4]. Carbohydr. Res. 1987, 164, 149–159. [Google Scholar] [CrossRef]
- Górecki, M.; Kamińska, A.; Ruśkowska, P.; Suszczyńska, A.; Frelek, J. Dimolybdenum method for determination of the absolute configuration of vic-diols-foundations and developments. Pol. J. Chem. 2008, 80, 523–534. [Google Scholar]
- Brock, C. Crystal packing in vicinal diols CnHm(OH)2. Acta Crystallogr. B 2002, 58, 1025–1031. [Google Scholar] [CrossRef] [PubMed]
- Berova, N.; Polavarapu, P.L.; Nakanishi, K.; Woody, R.W. Some inherently chiral chromophores-empirical rules and quantum chemical calculations. In Comprehensive Chiroptical Spectroscopy; Wiley: Hoboken, NJ, USA, 2012; Volume 2, pp. 73–114. [Google Scholar]
- Goto, H.; Osawa, E. An efficient algorithm for searching low-energy conformers of cyclic and acyclic molecules. J. Chem. Soc. Perk. Trans. 1993, 2, 187–198. [Google Scholar] [CrossRef]
- Goto, H.; Osawa, E. Corner flapping: A simple and fast algorithm for exhaustive generation of ring conformations. J. Amer. Chem. Soc. 1989, 111, 8950–8951. [Google Scholar] [CrossRef]
- Conflex Corp. CONFLEX 7; Conflex Corp: Tokyo, Japan, 2012. [Google Scholar]
- Frisch, M.J.; Trucks, G.W.; Schlegel, H.B.; Scuseria, G.E.; Robb, M.A.; Cheeseman, J.R.; Scalmani, G.; Barone, V.; Petersson, G.A.; Nakatsuji, H.; et al. Gaussian 16, Revision A.03; Gaussian, Inc.: Wallingford, CT, USA, 2016. [Google Scholar]
- Bruhn, T.S.; Schaumlöffel, A.; Hemberger, Y.; Pescitelli, G. SpecDis Version 1.71; Berlin, Germany. 2017. Available online: https://specdis-software.jimdo.com/ (accessed on 22 December 2021).


| Comp. | Conf. | ΔE/ kcal mol−1 | Pop./% | SF for ECD | SF for VCD | CPU Time/h | ||
|---|---|---|---|---|---|---|---|---|
| DFT opt. | ECD | VCD | ||||||
| 1 | 1-up a | 0.00 | 63.31 | 0.991 | n/a | 111 | 96 | 132 |
| 1-up b | 0.60 | 23.10 | ||||||
| 1-up c | 0.91 | 13.59 | ||||||
| 1-down a | 0.00 | 62.17 | 0.000 | n/a | 127 | 96 | 134 | |
| 1-down b | 0.51 | 26.26 | ||||||
| 1-down c | 1.00 | 11.57 | ||||||
| 2 | 2a | 0.00 | 40.82 | 0.998 | 0.726 | 261 | 204 | 304 |
| 2b | 0.27 | 25.98 | ||||||
| 2c | 0.48 | 18.03 | ||||||
| 2d | 0.97 | 7.94 | ||||||
| 2e | 1.14 | 5.97 | ||||||
| 2f | 2.06 | 1.26 | ||||||
| 3 | 3a | 0.00 | 39.07 | 0.967 | 0.708 | 282 | 204 | 304 |
| 3b | 0.09 | 33.46 | ||||||
| 3c | 0.68 | 12.42 | ||||||
| 3d | 1.13 | 5.75 | ||||||
| 3e | 1.25 | 4.72 | ||||||
| 3f | 1.27 | 4.57 | ||||||
| 4 | 4a | 0.00 | 54.87 | 0.995 | 0.941 | 201 | 222 | 149 |
| 4b | 0.61 | 19.62 | ||||||
| 4c | 0.93 | 11.35 | ||||||
| 4d | 1.32 | 5.92 | ||||||
| 4e | 1.52 | 4.20 | ||||||
| 4f | 1.54 | 4.04 | ||||||
| 5 | 5a | 0.00 | 72.12 | 0.961 | 0.439 | 533 | 696 | 510 |
| 5b | 0.86 | 16.89 | ||||||
| 5c | 1.47 | 6.04 | ||||||
| 5d | 2.06 | 2.21 | ||||||
| 5e | 2.29 | 1.52 | ||||||
| 5f | 2.41 | 1.23 | ||||||
| 6 | 6a | 0.00 | 60.49 | 0.980 | 0.871 | 352 | 252 | 221 |
| 6b | 0.84 | 14.63 | ||||||
| 6c | 1.03 | 10.68 | ||||||
| 6d | 1.30 | 6.70 | ||||||
| 6e | 1.36 | 6.07 | ||||||
| 6f | 2.22 | 1.43 | ||||||
| 7 | 0.00 | 100 | 0.984 | n/a | 3 | 5 | 2 | |
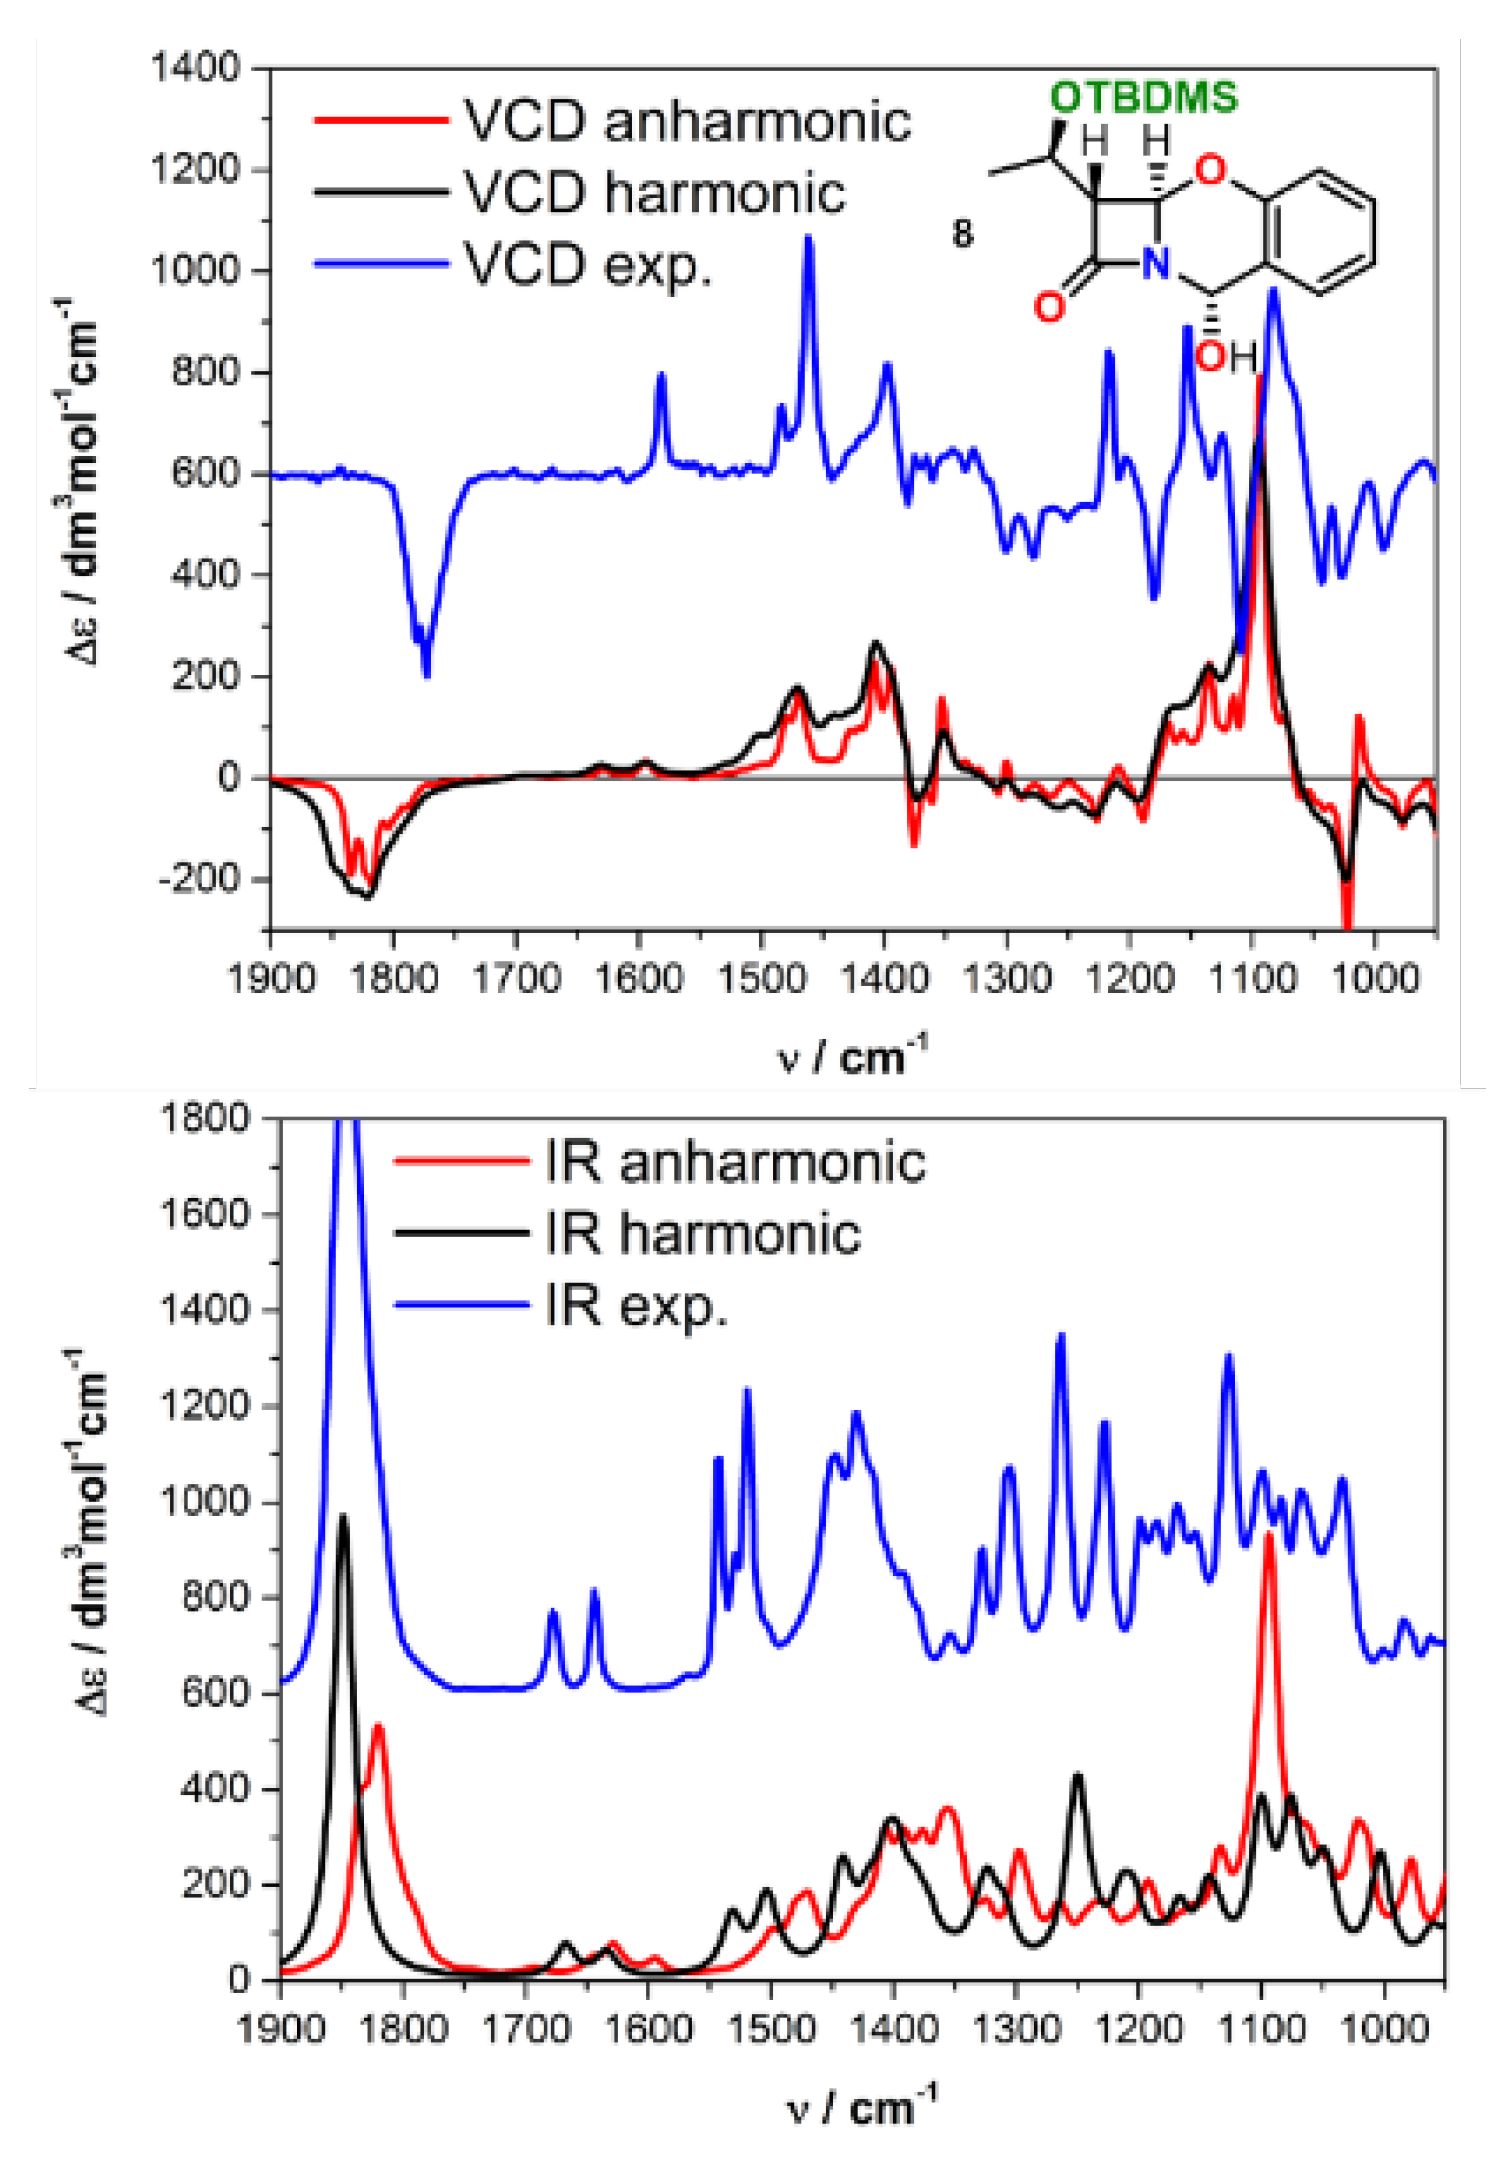
| 8 | 8a | 0.00 | 68.05 | 0.959 | 0.602 | 228 | 230 | 248 |
| 8b | 0.65 | 22.82 | ||||||
| 8c | 1.67 | 4.05 | ||||||
| 8d | 1.92 | 2.65 | ||||||
| 8e | 1.97 | 2.43 | ||||||
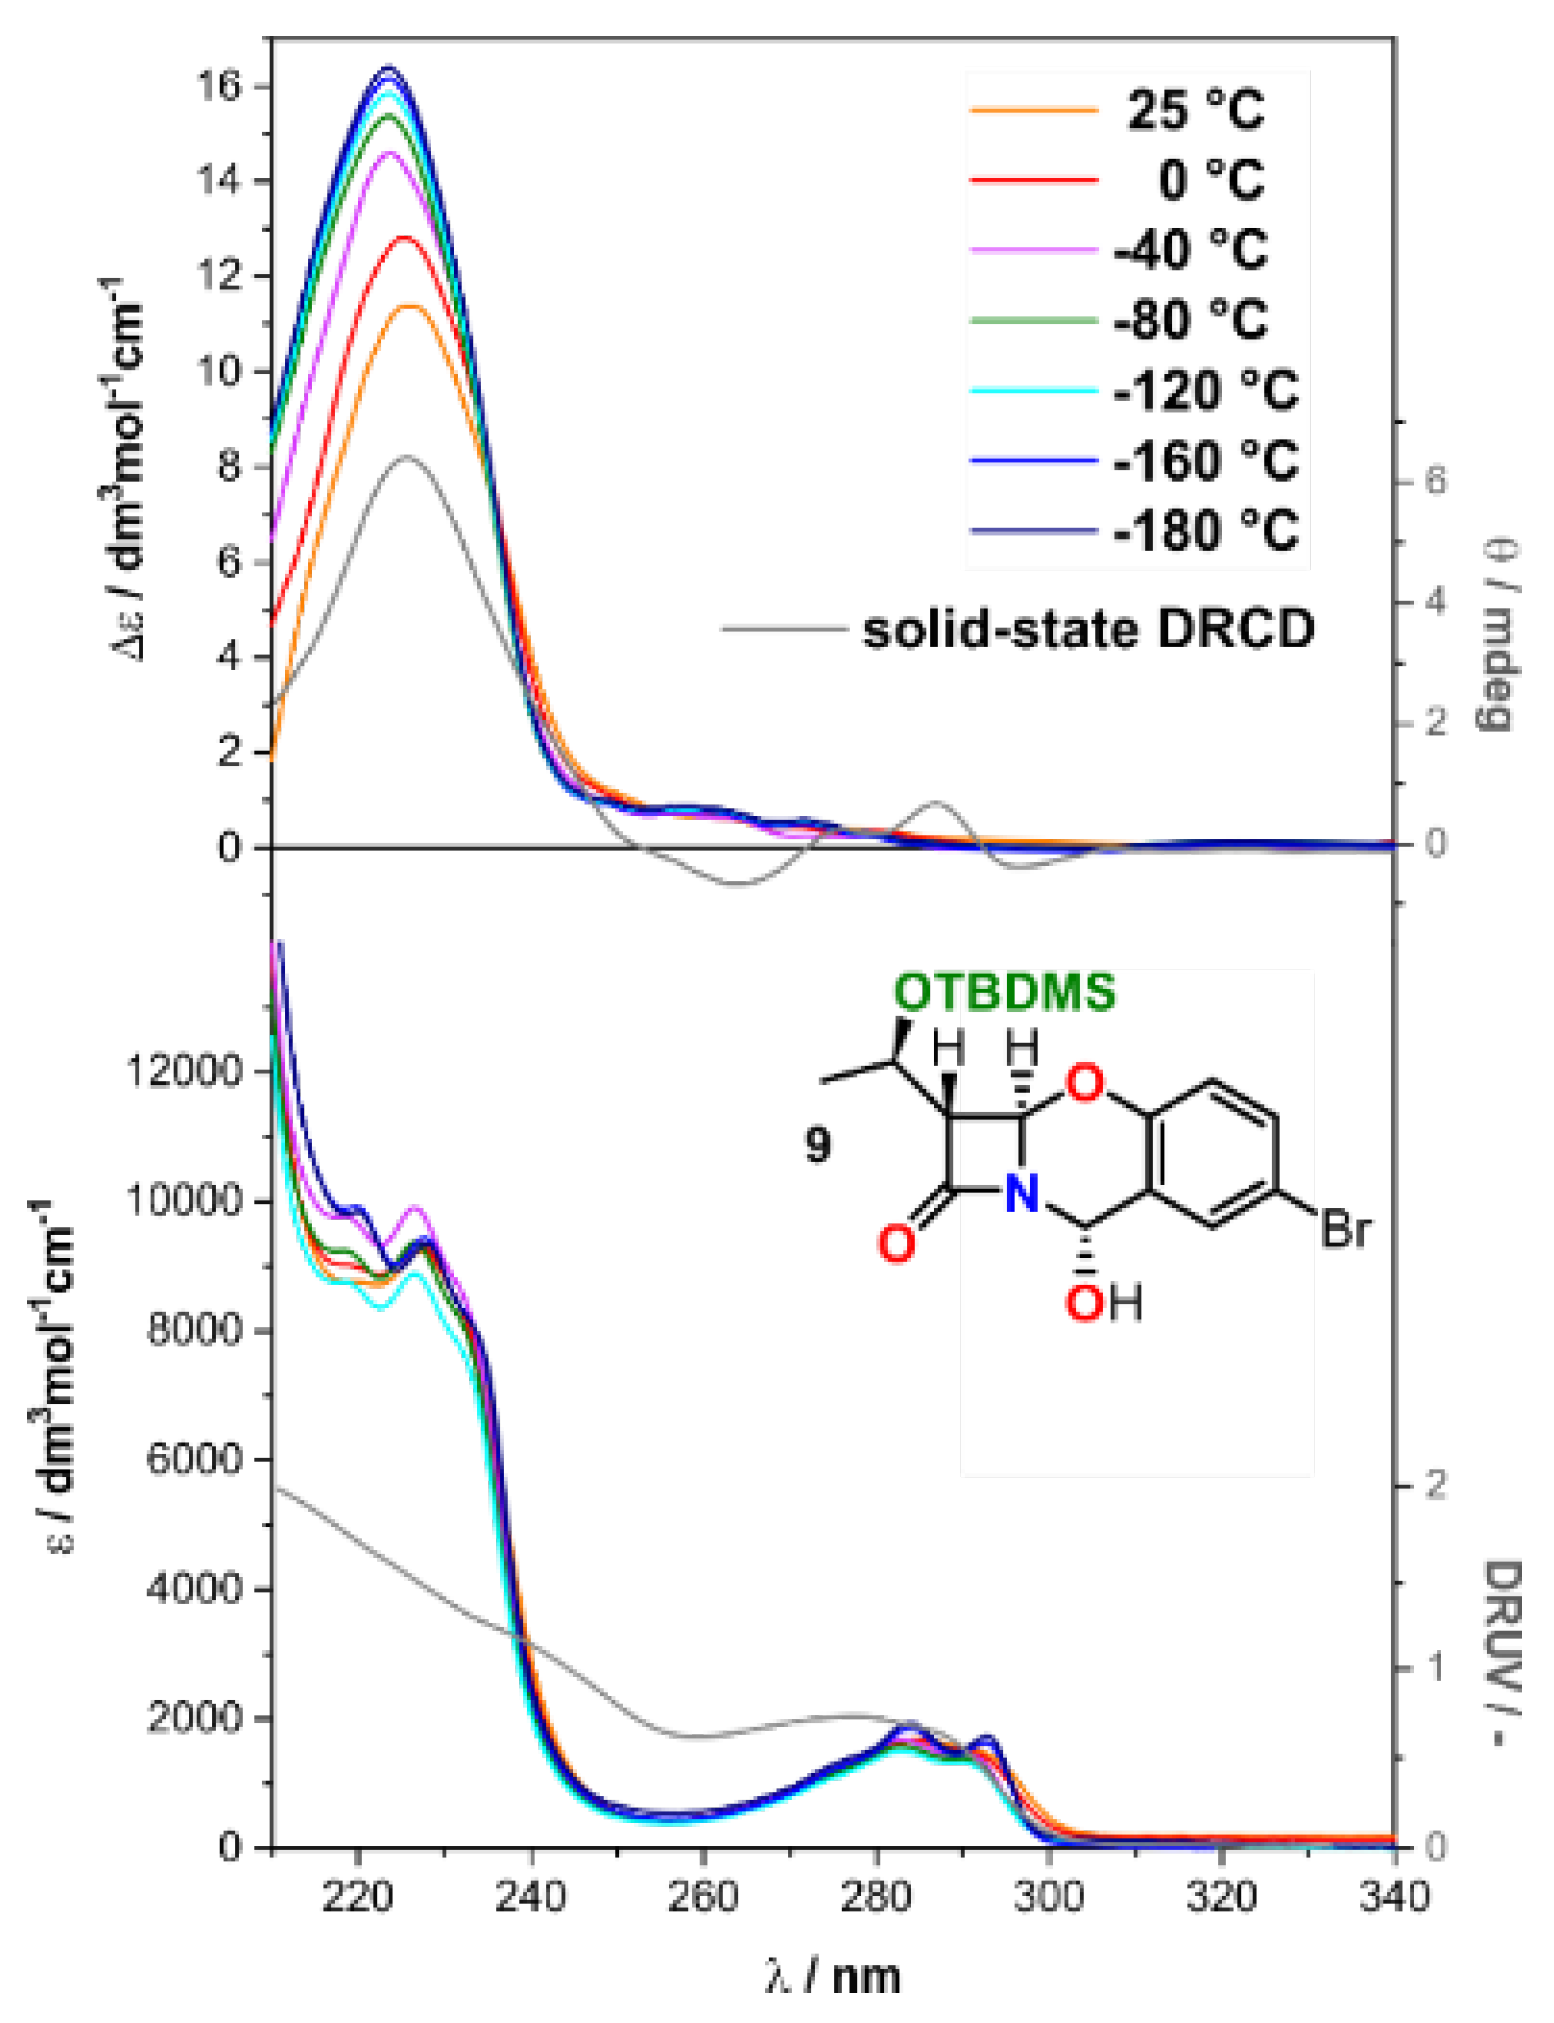
| 9 | 9a | 0.00 | 58.10 | 0.989 | 0.706 | 259 | 200 | 337 |
| 9b | 0.32 | 34.08 | ||||||
| 9c | 1.52 | 4.46 | ||||||
| 9d | 1.69 | 3.36 | ||||||
Publisher’s Note: MDPI stays neutral with regard to jurisdictional claims in published maps and institutional affiliations. |
© 2021 by the authors. Licensee MDPI, Basel, Switzerland. This article is an open access article distributed under the terms and conditions of the Creative Commons Attribution (CC BY) license (https://creativecommons.org/licenses/by/4.0/).
Share and Cite
Górecki, M.; Frelek, J. A Holistic Approach to Determining Stereochemistry of Potential Pharmaceuticals by Circular Dichroism with β-Lactams as Test Cases. Int. J. Mol. Sci. 2022, 23, 273. https://0-doi-org.brum.beds.ac.uk/10.3390/ijms23010273
Górecki M, Frelek J. A Holistic Approach to Determining Stereochemistry of Potential Pharmaceuticals by Circular Dichroism with β-Lactams as Test Cases. International Journal of Molecular Sciences. 2022; 23(1):273. https://0-doi-org.brum.beds.ac.uk/10.3390/ijms23010273
Chicago/Turabian StyleGórecki, Marcin, and Jadwiga Frelek. 2022. "A Holistic Approach to Determining Stereochemistry of Potential Pharmaceuticals by Circular Dichroism with β-Lactams as Test Cases" International Journal of Molecular Sciences 23, no. 1: 273. https://0-doi-org.brum.beds.ac.uk/10.3390/ijms23010273