
Decreased Tissue Omega-6/Omega-3 Fatty Acid Ratio Prevents Chemotherapy-Induced Gastrointestinal Toxicity Associated with Alterations of Gut Microbiome

 , ,
, , 
Abstract
:1. Introduction
2. Results
2.1. Decreased Tissue n-6/n-3 PUFA Ratio Reduces CPT-11-Induced Gut-Toxicity
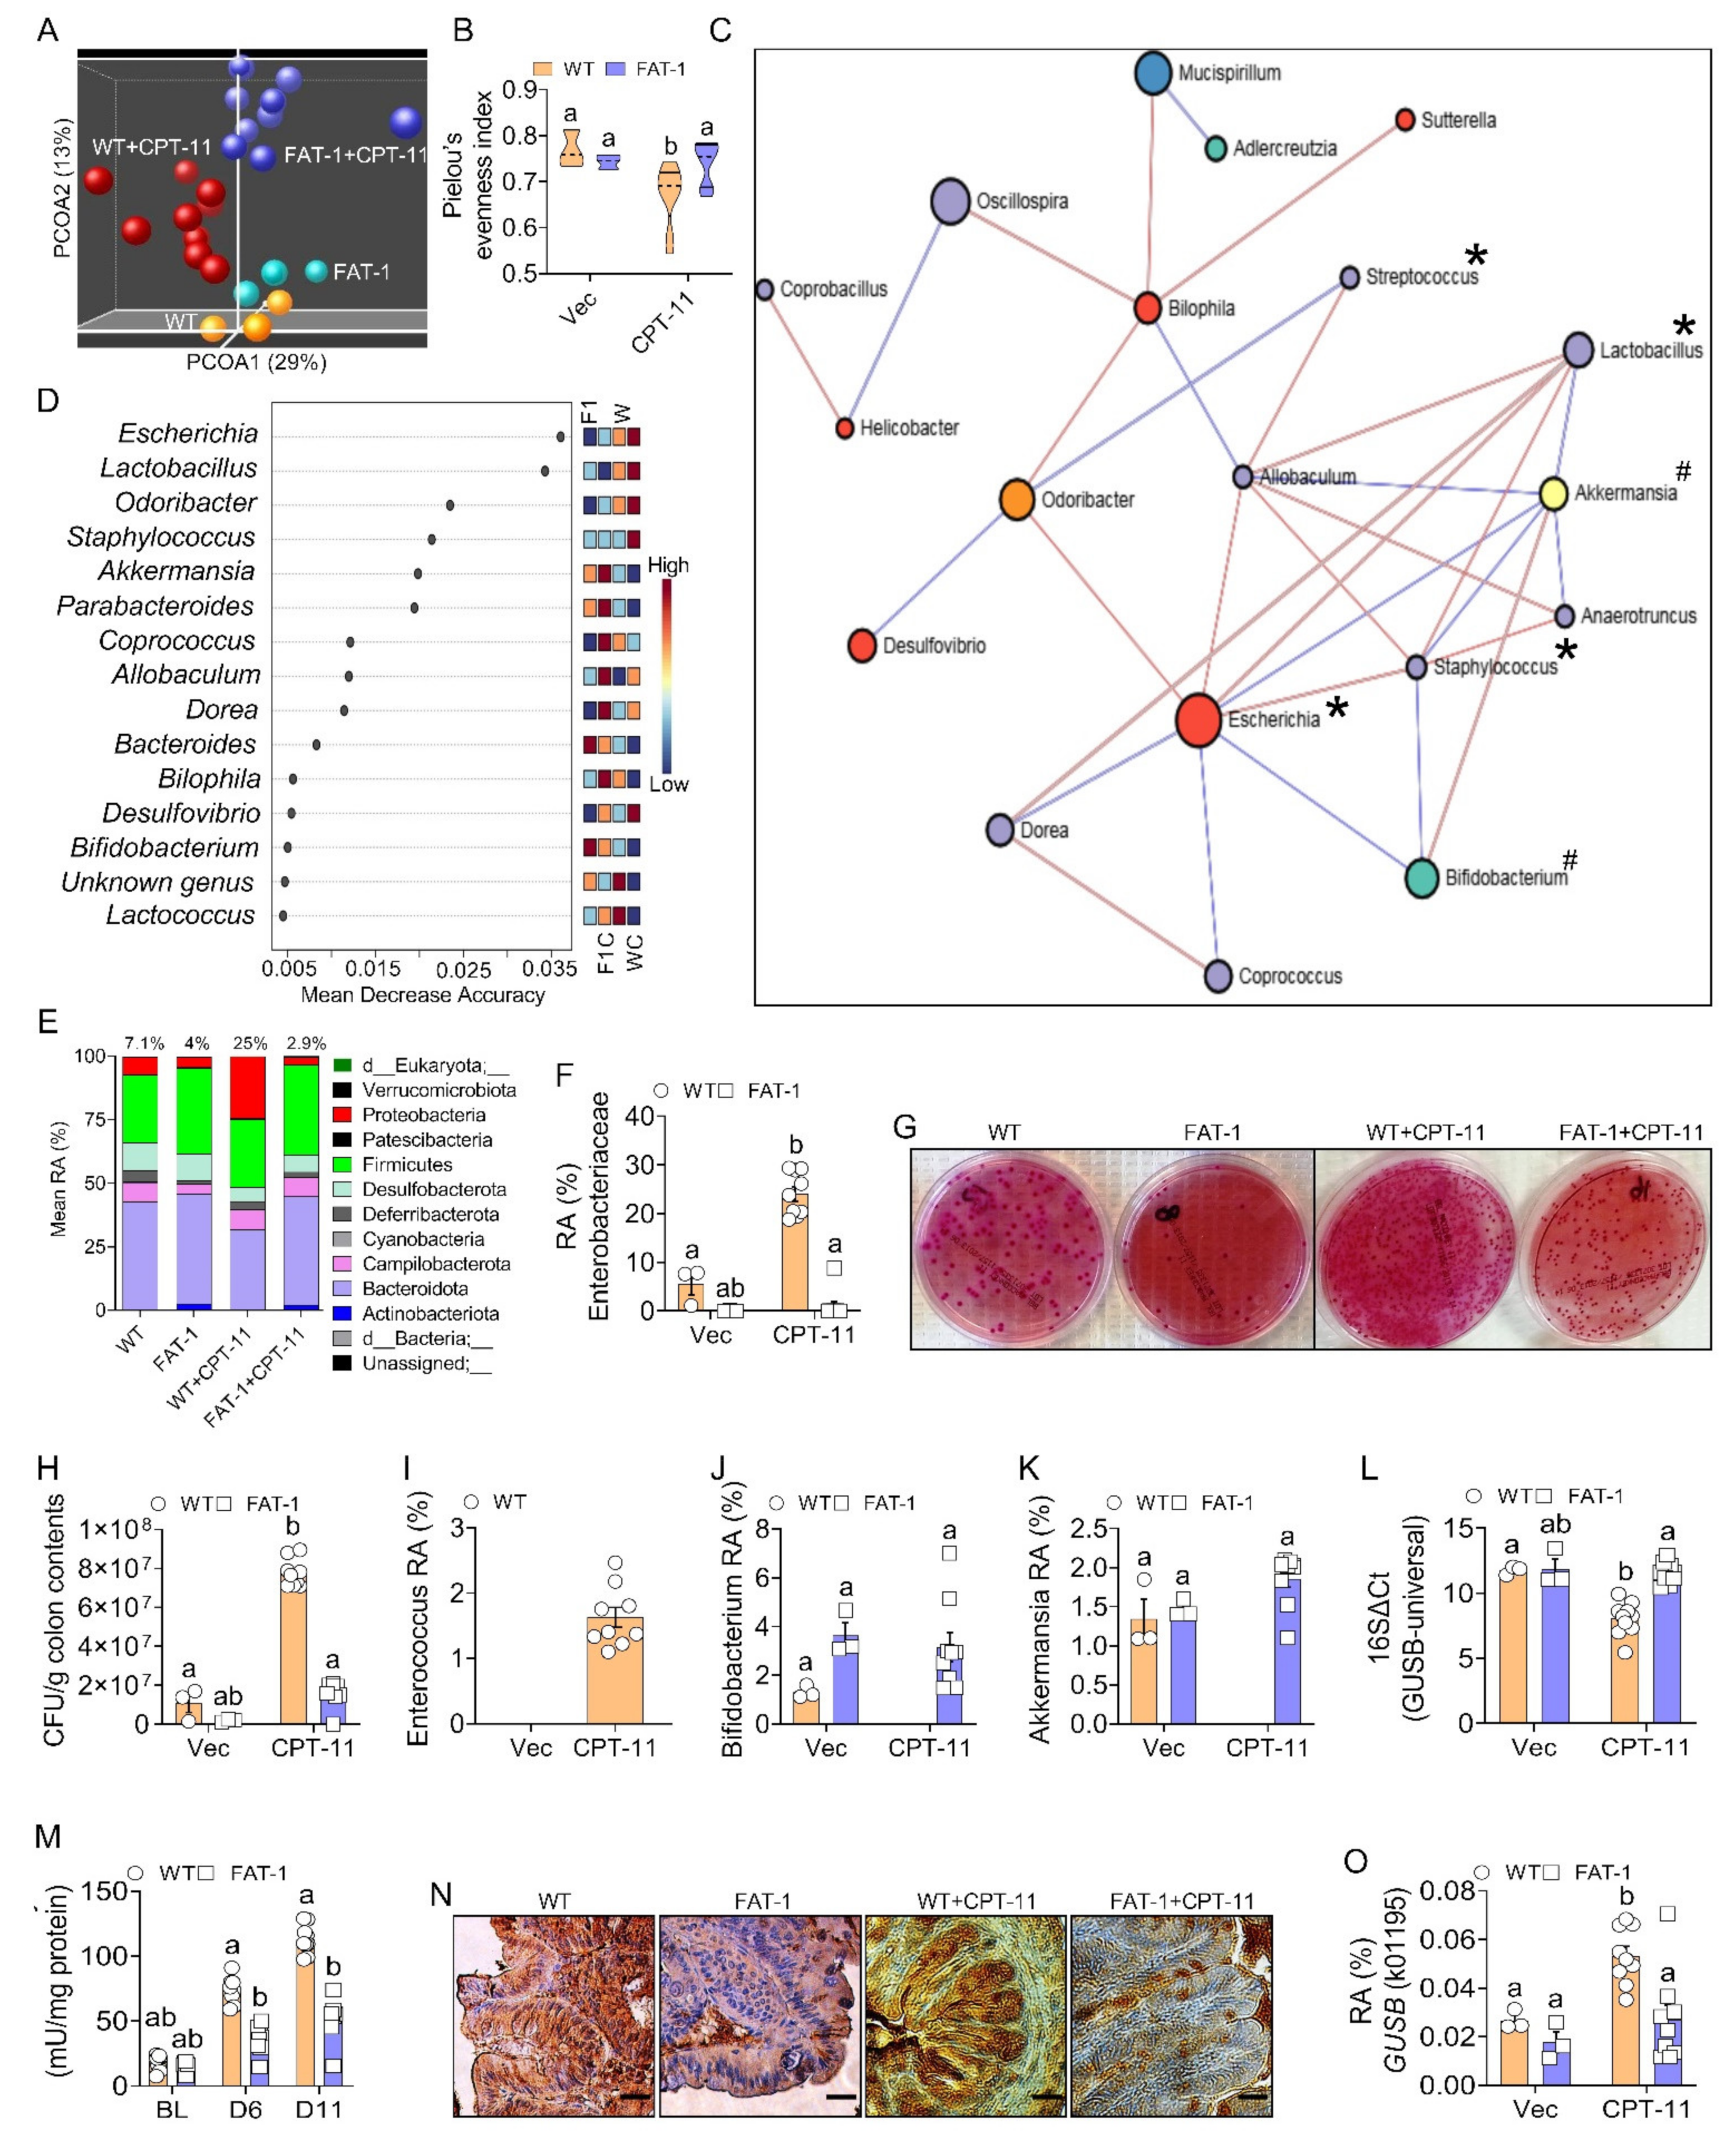
2.2. Decreased Tissue n-6/n-3 Ratio Reduces CPT-11-Induced Gut Microbiome Alterations
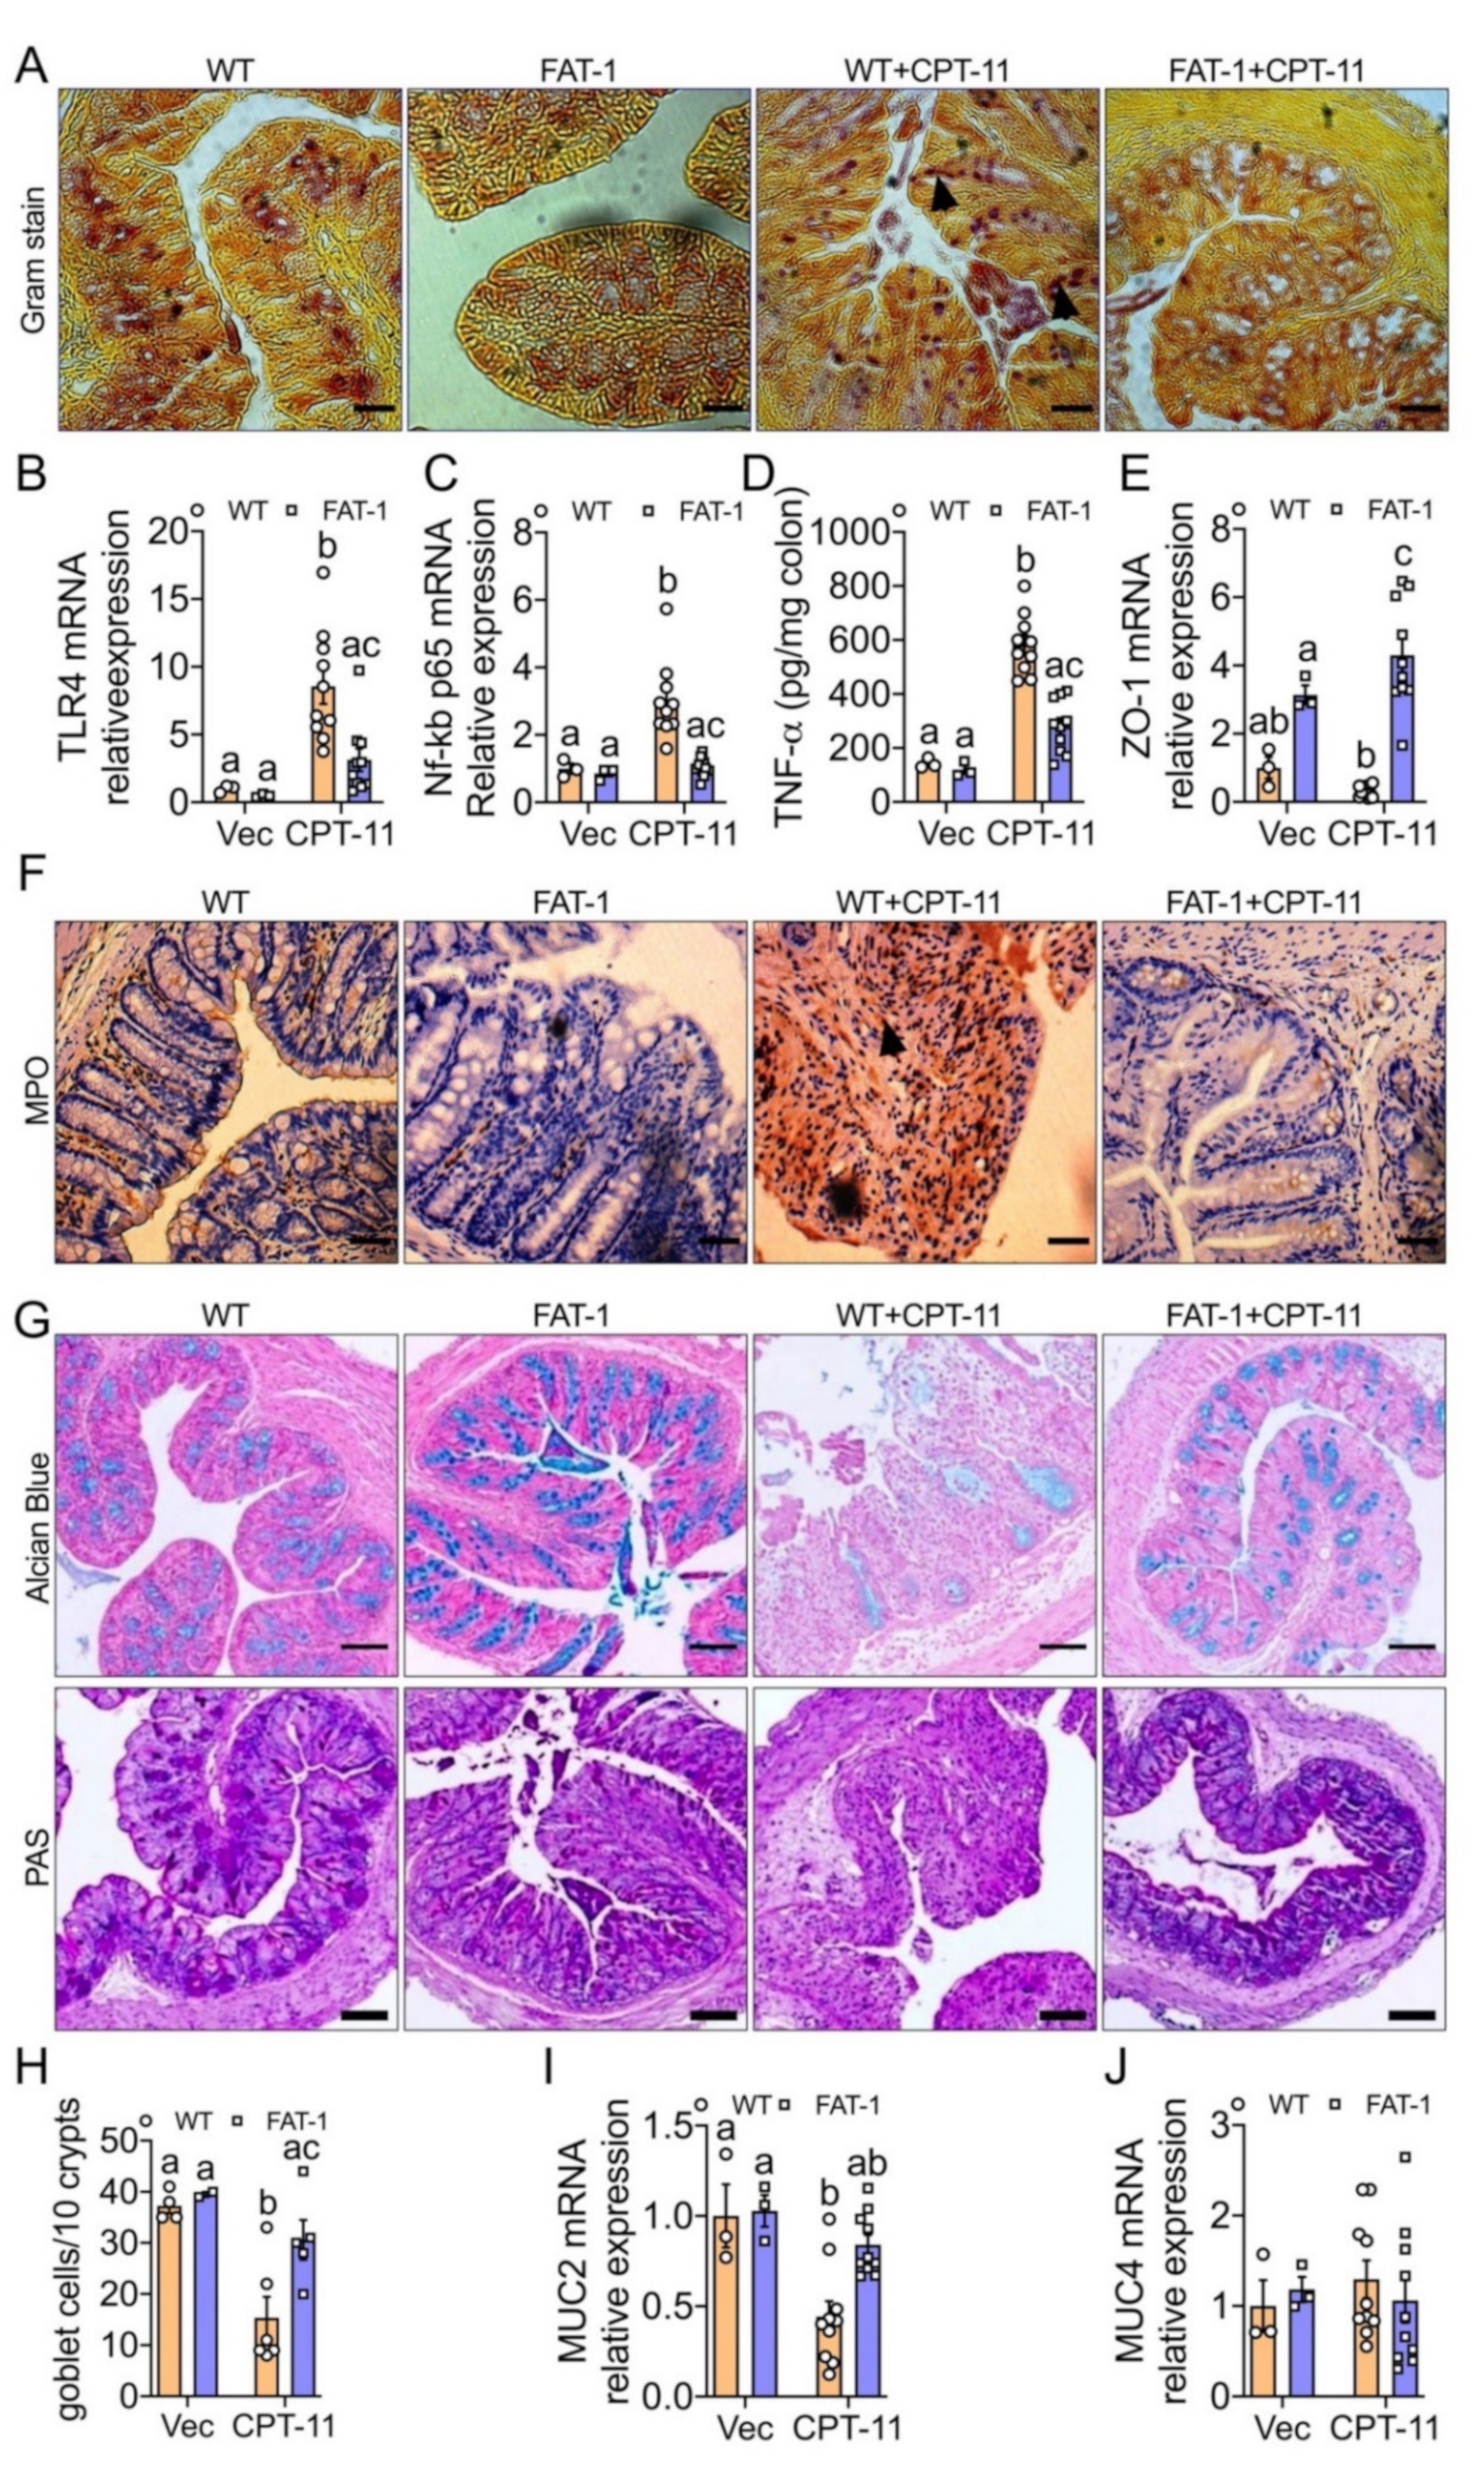
2.3. Decreased n-6/n-3 Ratio Prevents CPT-11-Induced Intestinal Mucosal Barrier Dysfunction
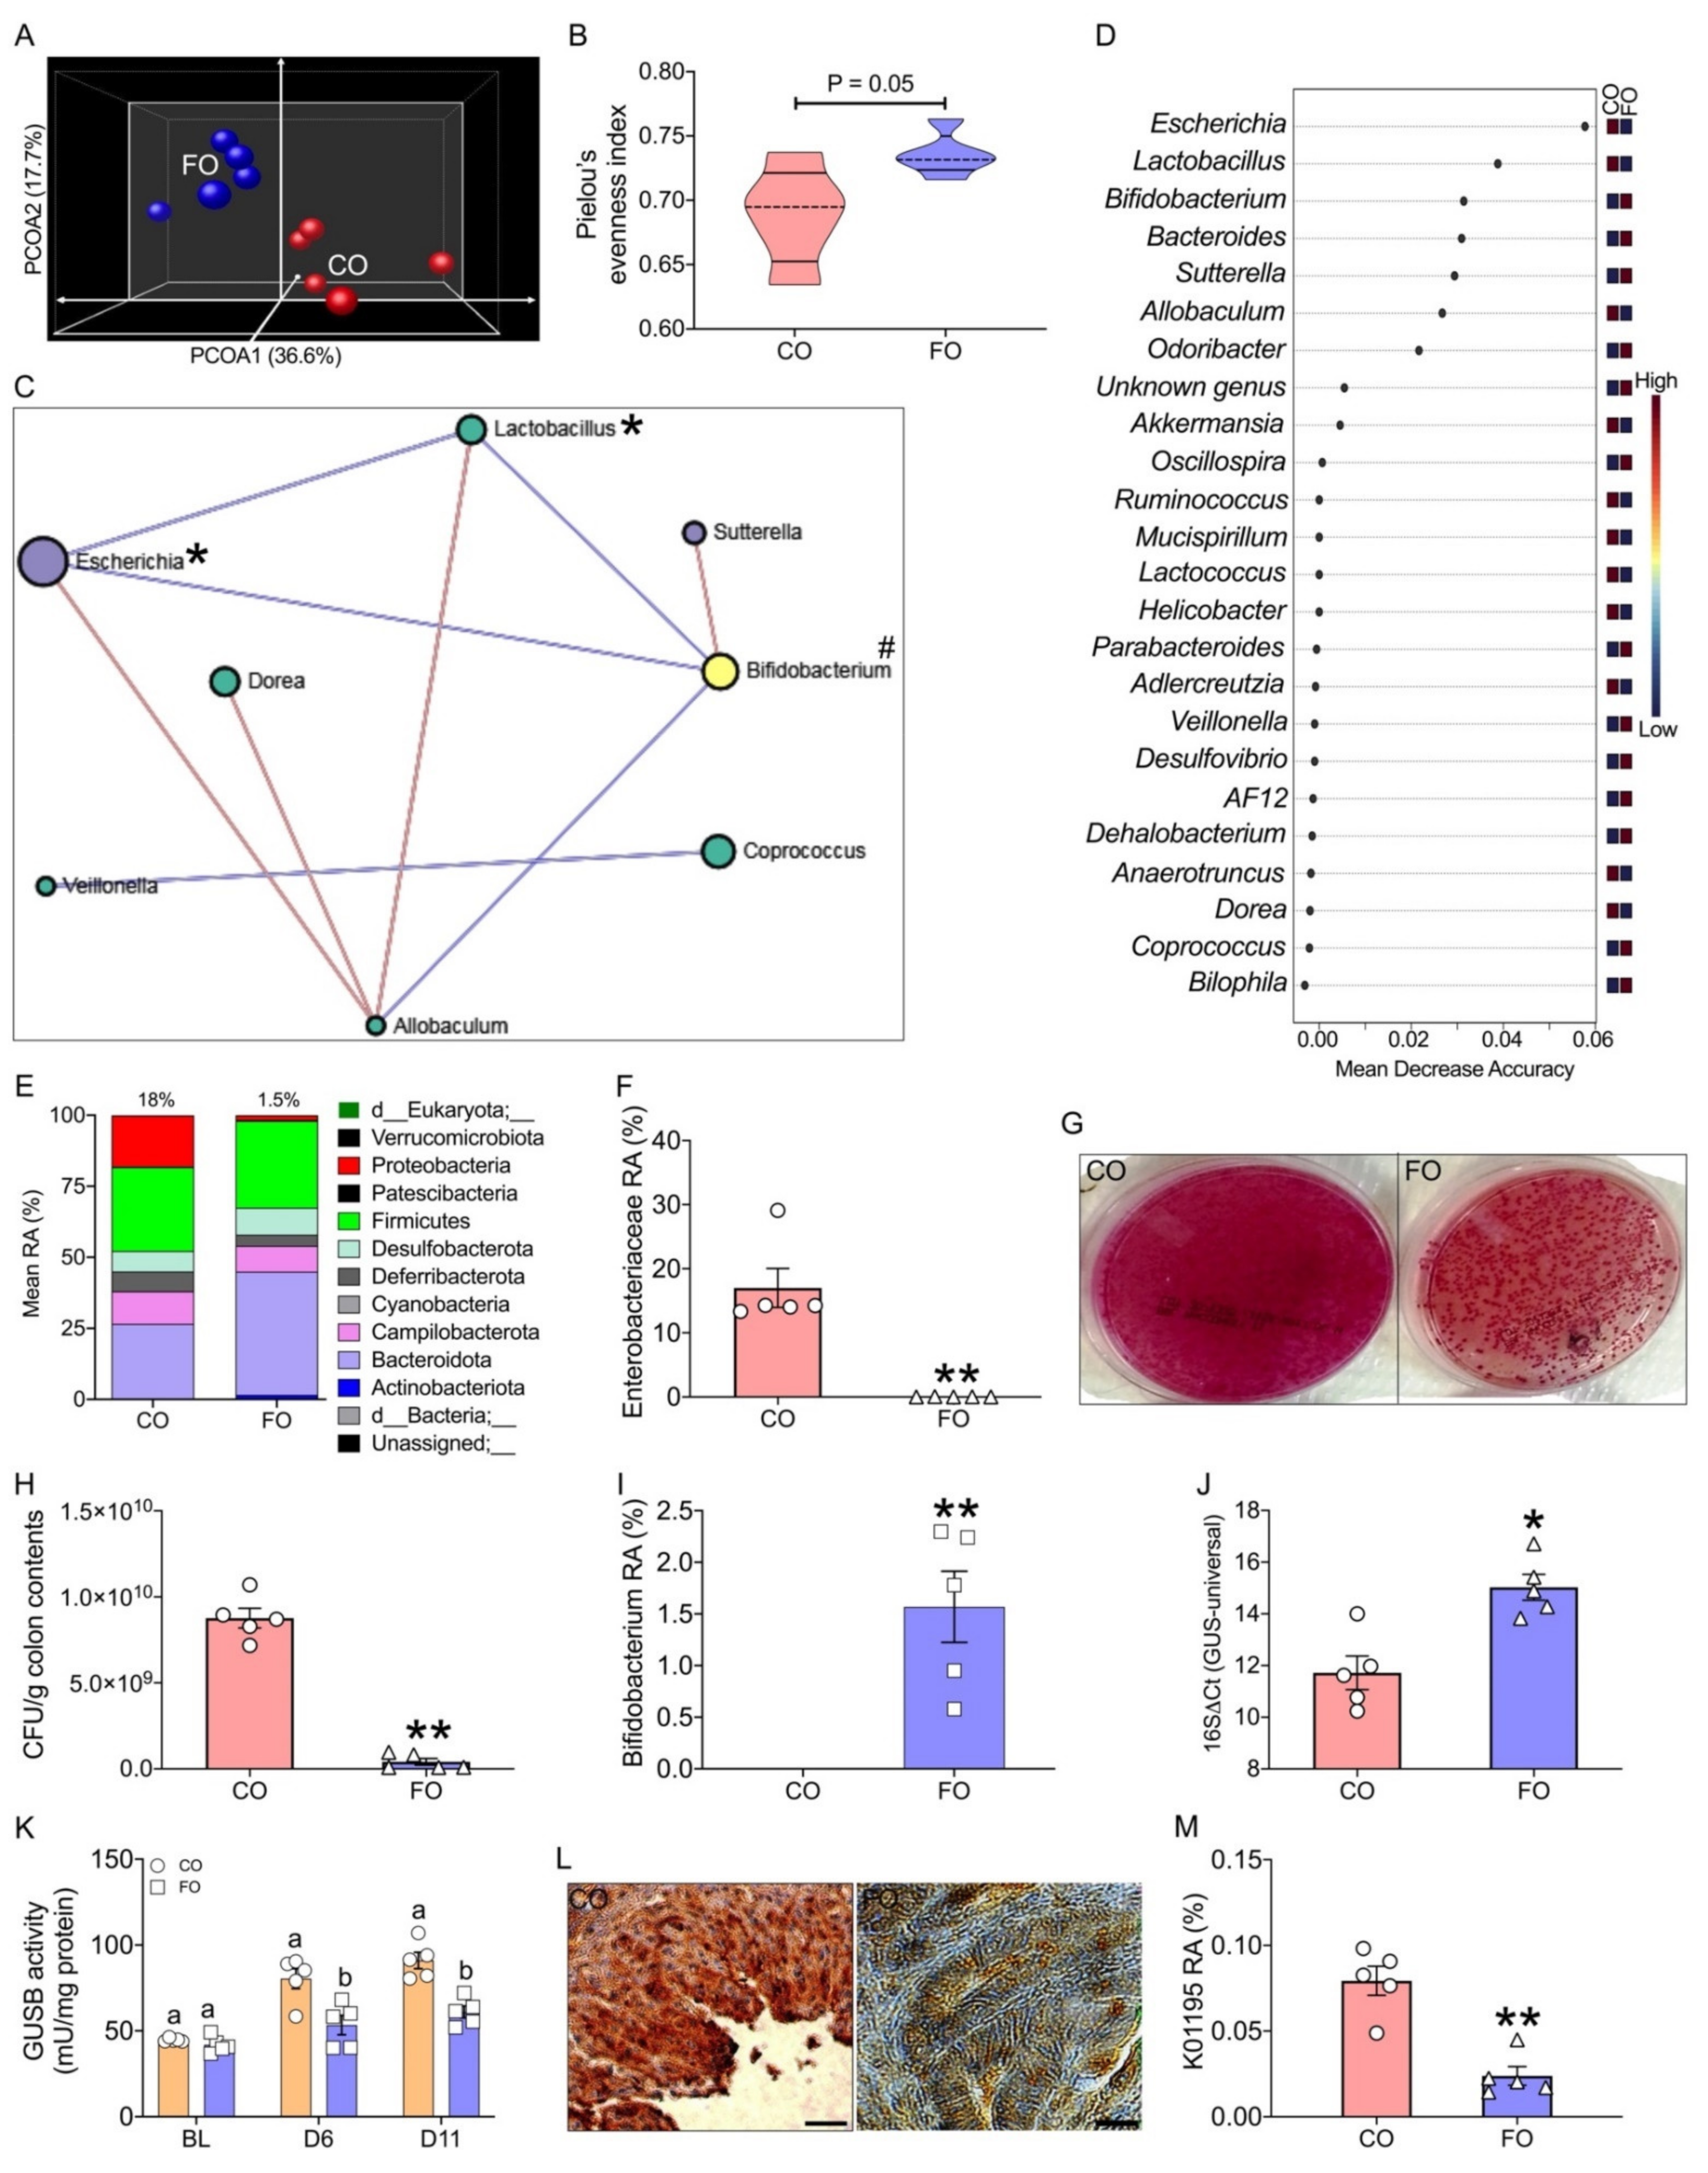
2.4. Omega-3 PUFA Supplementation Reduces CPT-11-Induced Gut-Toxicity
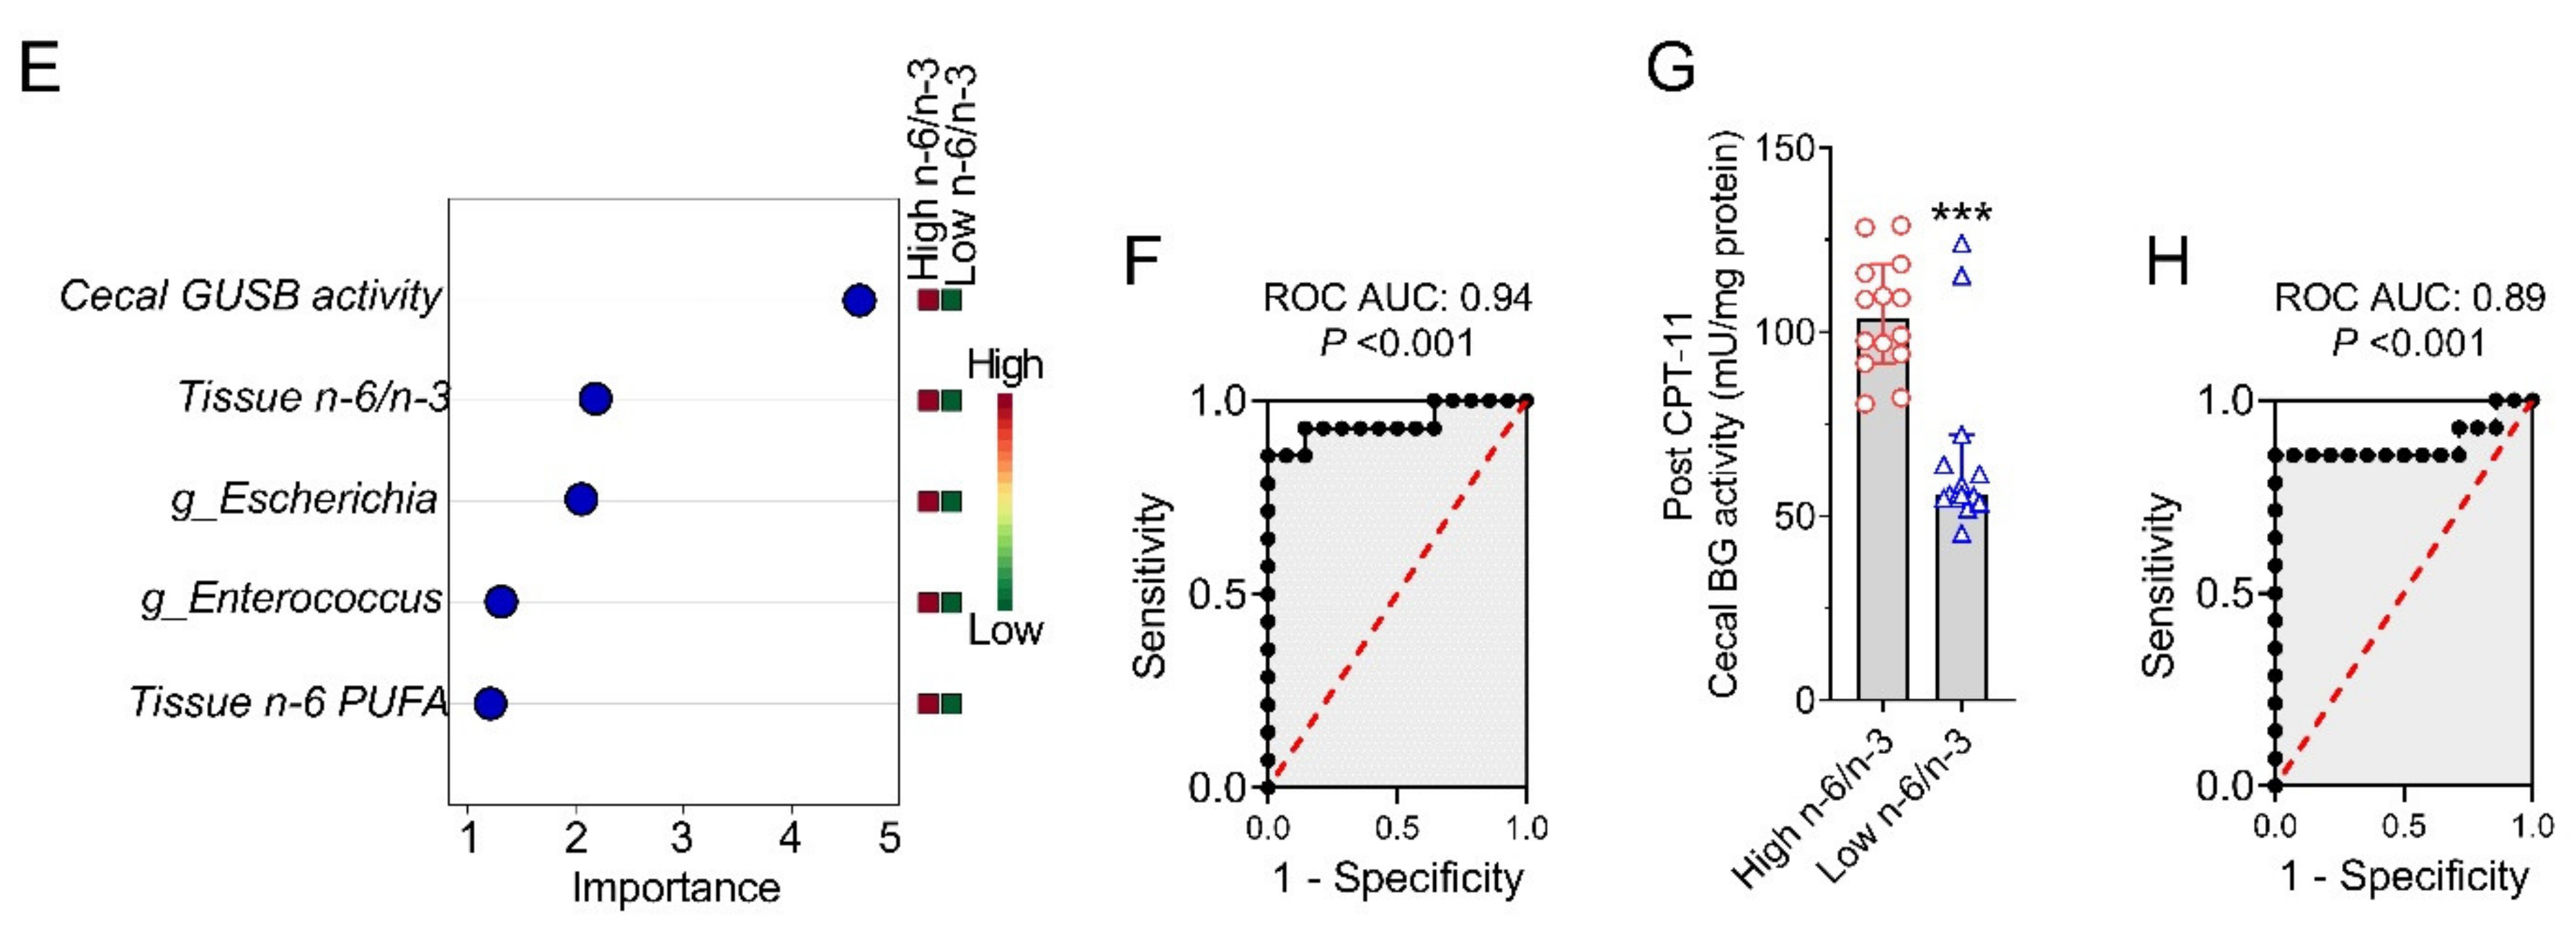
2.5. Host–Gut Microbiome Interactions Driven by Tissue n-6/n-3 PUFA Ratio Might Be Involved in CPT-11-Induced GIT
3. Discussion
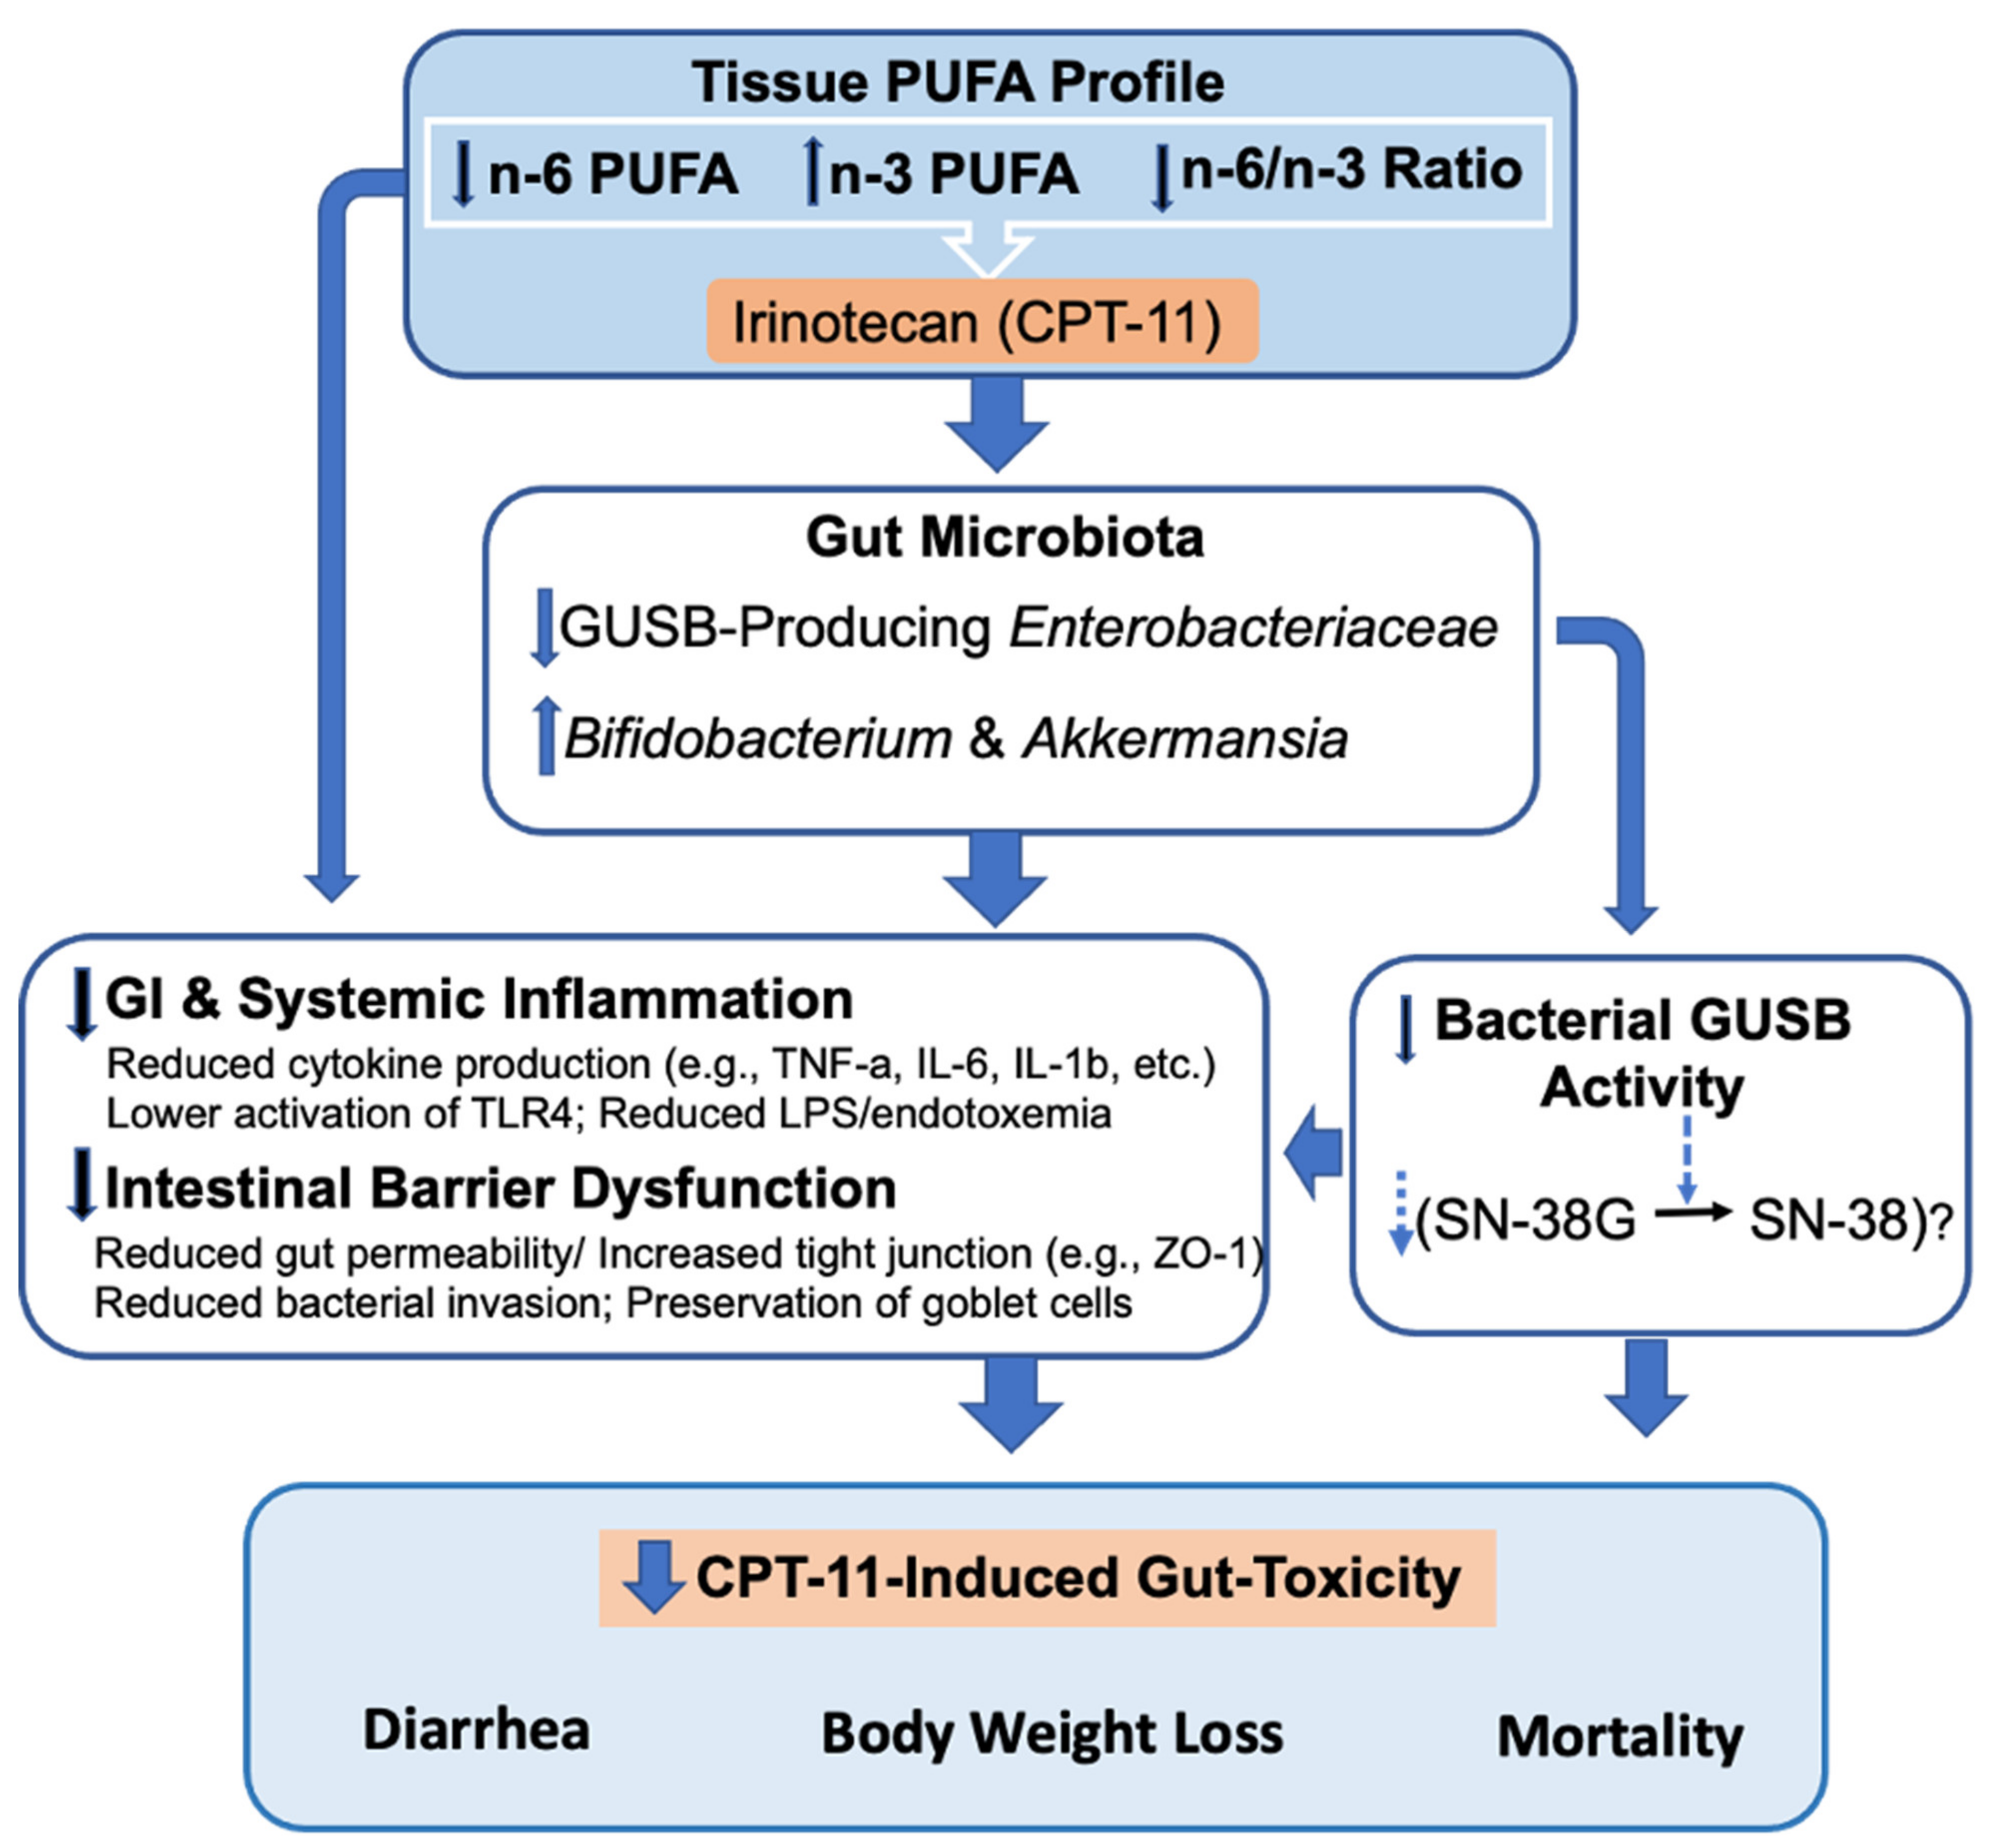
4. Conclusions
5. Materials and Methods
5.1. Animals
5.2. Animal Experiments
5.2.1. Studying the Role of Decreased Tissue n-6/n-3 PUFA Ratio in Preventing CPT-11-Induced Gut Toxicities
5.2.2. Determination of CPT-11-Induced Lethality
5.2.3. Studying the Preventive Effects of Fish Oil Supplemented Diet against the CPT-11-Induced Gut Toxicities
5.3. Histopathological Analysis
5.4. Extraction and Purification of DNA from Cecal Contents
5.5. S rRNA Gene Amplicon Sequencing
5.6. Bioinformatics
5.7. Microbial Functional Prediction with PICRUSt2
5.8. Multivariate Receiver Operator Characteristic (ROC) Curve-Based Biomarker Analyses
5.9. RV Coefficient
5.10. Cox Proportional-Hazards Analysis
5.11. Co-Occurrence Network Inference
5.12. β-Glucuronidase (GUSB) Activity Assay
5.13. Host–Microbiome Interaction Analysis
5.14. Relative Quantification of Bacterial Species Carrying GUSB Genes in Cecal Microbiota
5.15. Determination of Cytokine Levels in the Colon
5.16. Determination of the Fatty Acid Composition of Mouse Tissues and Diets
5.17. Gene Expression Analysis by RT-qPCR
5.18. Measurement of LPS Concentration
5.19. Immunohistochemistry (IHC)
5.20. Bacterial Culture
5.21. Statistics and Reproducibility
Supplementary Materials
Author Contributions
Funding
Institutional Review Board Statement
Informed Consent Statement
Data Availability Statement
Acknowledgments
Conflicts of Interest
References
- Stein, A.; Voigt, W.; Jordan, K. Chemotherapy-induced diarrhea: Pathophysiology, frequency and guideline-based management. Ther. Adv. Med. Oncol. 2010, 2, 51–63. [Google Scholar] [CrossRef] [PubMed] [Green Version]
- Swami, U.; Goel, S.; Mani, S. Therapeutic targeting of CPT-11 induced diarrhea: A case for prophylaxis. Curr. Drug Targets 2013, 14, 777–797. [Google Scholar] [CrossRef] [PubMed] [Green Version]
- Rivory, L.P.; Bowles, M.R.; Robert, J.; Pond, S.M. Conversion of irinotecan (CPT-11) to its active metabolite, 7-ethyl-10-hydroxycamptothecin (SN-38), by human liver carboxylesterase. Biochem. Pharmacol. 1996, 52, 1103–1111. [Google Scholar] [CrossRef]
- Jinno, H.; Tanaka-Kagawa, T.; Hanioka, N.; Saeki, M.; Ishida, S.; Nishimura, T.; Ando, M.; Saito, Y.; Ozawa, S.; Sawada, J. Glucuronidation of 7-ethyl-10-hydroxycamptothecin (SN-38), an active metabolite of irinotecan (CPT-11), by human UGT1A1 variants, G71R, P229Q, and Y486D. Drug Metab. Dispos. 2003, 31, 108–113. [Google Scholar] [CrossRef] [Green Version]
- Mathijssen, R.H.; van Alphen, R.J.; Verweij, J.; Loos, W.J.; Nooter, K.; Stoter, G.; Sparreboom, A. Clinical pharmacokinetics and metabolism of irinotecan (CPT-11). Clin. Cancer Res. 2001, 7, 2182–2194. [Google Scholar]
- Takasuna, K.; Hagiwara, T.; Hirohashi, M.; Kato, M.; Nomura, M.; Nagai, E.; Yokoi, T.; Kamataki, T. Involvement of beta-glucuronidase in intestinal microflora in the intestinal toxicity of the antitumor camptothecin derivative irinotecan hydrochloride (CPT-11) in rats. Cancer Res. 1996, 56, 3752–3757. [Google Scholar]
- Stringer, A.M.; Gibson, R.J.; Bowen, J.M.; Logan, R.M.; Ashton, K.; Yeoh, A.S.; Al-Dasooqi, N.; Keefe, D.M. Irinotecan-induced mucositis manifesting as diarrhoea corresponds with an amended intestinal flora and mucin profile. Int. J. Exp. Pathol. 2009, 90, 489–499. [Google Scholar] [CrossRef]
- Stringer, A.M.; Gibson, R.J.; Logan, R.M.; Bowen, J.M.; Yeoh, A.S.; Laurence, J.; Keefe, D.M. Irinotecan-induced mucositis is associated with changes in intestinal mucins. Cancer Chemother. Pharmacol. 2009, 64, 123–132. [Google Scholar] [CrossRef]
- Alexander, J.L.; Wilson, I.D.; Teare, J.; Marchesi, J.R.; Nicholson, J.K.; Kinross, J.M. Gut microbiota modulation of chemotherapy efficacy and toxicity. Nat. Rev. Gastroenterol. Hepatol. 2017, 14, 356–365. [Google Scholar] [CrossRef]
- Forsgard, R.A.; Marrachelli, V.G.; Korpela, K.; Frias, R.; Collado, M.C.; Korpela, R.; Monleon, D.; Spillmann, T.; Osterlund, P. Chemotherapy-induced gastrointestinal toxicity is associated with changes in serum and urine metabolome and fecal microbiota in male Sprague-Dawley rats. Cancer Chemother. Pharmacol. 2017, 80, 317–332. [Google Scholar] [CrossRef] [Green Version]
- Brandi, G.; Dabard, J.; Raibaud, P.; Di Battista, M.; Bridonneau, C.; Pisi, A.M.; Morselli Labate, A.M.; Pantaleo, M.A.; De Vivo, A.; Biasco, G. Intestinal microflora and digestive toxicity of irinotecan in mice. Clin. Cancer Res. 2006, 12, 1299–1307. [Google Scholar] [CrossRef] [PubMed] [Green Version]
- Slatter, J.G.; Schaaf, L.J.; Sams, J.P.; Feenstra, K.L.; Johnson, M.G.; Bombardt, P.A.; Cathcart, K.S.; Verburg, M.T.; Pearson, L.K.; Compton, L.D.; et al. Pharmacokinetics, metabolism, and excretion of irinotecan (CPT-11) following I.V. infusion of [(14)C]CPT-11 in cancer patients. Drug Metab. Dispos. 2000, 28, 423–433. [Google Scholar] [PubMed]
- Guthrie, L.; Gupta, S.; Daily, J.; Kelly, L. Human microbiome signatures of differential colorectal cancer drug metabolism. NPJ Biofilms Microbiomes 2017, 3, 27. [Google Scholar] [CrossRef] [PubMed]
- Takasuna, K.; Hagiwara, T.; Watanabe, K.; Onose, S.; Yoshida, S.; Kumazawa, E.; Nagai, E.; Kamataki, T. Optimal antidiarrhea treatment for antitumor agent irinotecan hydrochloride (CPT-11)-induced delayed diarrhea. Cancer Chemother. Pharmacol. 2006, 58, 494–503. [Google Scholar] [CrossRef]
- Tryland, I.; Fiksdal, L. Enzyme characteristics of beta-D-galactosidase- and beta-D-glucuronidase-positive bacteria and their interference in rapid methods for detection of waterborne coliforms and Escherichia coli. Appl. Environ. Microbiol. 1998, 64, 1018–1023. [Google Scholar] [CrossRef] [Green Version]
- Stringer, A.M.; Gibson, R.J.; Logan, R.M.; Bowen, J.M.; Yeoh, A.S.; Keefe, D.M. Faecal microflora and beta-glucuronidase expression are altered in an irinotecan-induced diarrhea model in rats. Cancer Biol. Ther. 2008, 7, 1919–1925. [Google Scholar] [CrossRef] [Green Version]
- Stringer, A.M.; Gibson, R.J.; Logan, R.M.; Bowen, J.M.; Yeoh, A.S.; Burns, J.; Keefe, D.M. Chemotherapy-induced diarrhea is associated with changes in the luminal environment in the DA rat. Exp. Biol. Med. 2007, 232, 96–106. [Google Scholar]
- Kaliannan, K.; Wang, B.; Li, X.Y.; Kim, K.J.; Kang, J.X. A host-microbiome interaction mediates the opposing effects of omega-6 and omega-3 fatty acids on metabolic endotoxemia. Sci. Rep. 2015, 5, 11276. [Google Scholar] [CrossRef] [Green Version]
- Kaliannan, K.; Li, X.Y.; Wang, B.; Pan, Q.; Chen, C.Y.; Hao, L.; Xie, S.; Kang, J.X. Multi-omic analysis in transgenic mice implicates omega-6/omega-3 fatty acid imbalance as a risk factor for chronic disease. Commun. Biol. 2019, 2, 276. [Google Scholar] [CrossRef] [Green Version]
- Wardill, H.R.; Gibson, R.J.; Van Sebille, Y.Z.; Secombe, K.R.; Coller, J.K.; White, I.A.; Manavis, J.; Hutchinson, M.R.; Staikopoulos, V.; Logan, R.M.; et al. Irinotecan-Induced Gastrointestinal Dysfunction and Pain Are Mediated by Common TLR4-Dependent Mechanisms. Mol. Cancer Ther. 2016, 15, 1376–1386. [Google Scholar] [CrossRef] [Green Version]
- Van Cutsem, E.; Lenz, H.J.; Kohne, C.H.; Heinemann, V.; Tejpar, S.; Melezinek, I.; Beier, F.; Stroh, C.; Rougier, P.; van Krieken, J.H.; et al. Fluorouracil, leucovorin, and irinotecan plus cetuximab treatment and RAS mutations in colorectal cancer. J. Clin. Oncol. 2015, 33, 692–700. [Google Scholar] [CrossRef] [PubMed] [Green Version]
- Wallace, B.D.; Wang, H.; Lane, K.T.; Scott, J.E.; Orans, J.; Koo, J.S.; Venkatesh, M.; Jobin, C.; Yeh, L.A.; Mani, S.; et al. Alleviating cancer drug toxicity by inhibiting a bacterial enzyme. Science 2010, 330, 831–835. [Google Scholar] [CrossRef] [PubMed] [Green Version]
- Hudert, C.A.; Weylandt, K.H.; Lu, Y.; Wang, J.; Hong, S.; Dignass, A.; Serhan, C.N.; Kang, J.X. Transgenic mice rich in endogenous omega-3 fatty acids are protected from colitis. Proc. Natl. Acad. Sci. USA 2006, 103, 11276–11281. [Google Scholar] [CrossRef] [PubMed] [Green Version]
- Bidu, C.; Escoula, Q.; Bellenger, S.; Spor, A.; Galan, M.; Geissler, A.; Bouchot, A.; Dardevet, D.; Morio, B.; Cani, P.D.; et al. The Transplantation of omega3 PUFA-Altered Gut Microbiota of fat-1 Mice to Wild-Type Littermates Prevents Obesity and Associated Metabolic Disorders. Diabetes 2018, 67, 1512–1523. [Google Scholar] [CrossRef] [PubMed] [Green Version]
- Kang, J.X.; Wang, J.; Wu, L.; Kang, Z.B. Transgenic mice: Fat-1 mice convert n-6 to n-3 fatty acids. Nature 2004, 427, 504. [Google Scholar] [CrossRef]
- Chen, S.; Yueh, M.F.; Bigo, C.; Barbier, O.; Wang, K.; Karin, M.; Nguyen, N.; Tukey, R.H. Intestinal glucuronidation protects against chemotherapy-induced toxicity by irinotecan (CPT-11). Proc. Natl. Acad. Sci. USA 2013, 110, 19143–19148. [Google Scholar] [CrossRef] [Green Version]
- Friedman, J.; Alm, E.J. Inferring correlation networks from genomic survey data. PLoS Comput. Biol. 2012, 8, e1002687. [Google Scholar] [CrossRef] [Green Version]
- Schroeder, B.O.; Birchenough, G.M.H.; Stahlman, M.; Arike, L.; Johansson, M.E.V.; Hansson, G.C.; Backhed, F. Bifidobacteria or Fiber Protects against Diet-Induced Microbiota-Mediated Colonic Mucus Deterioration. Cell Host Microbe 2018, 23, 27–40.e27. [Google Scholar] [CrossRef] [Green Version]
- Giannoudaki, E.; Hernandez-Santana, Y.E.; Mulfaul, K.; Doyle, S.L.; Hams, E.; Fallon, P.G.; Mat, A.; O’Shea, D.; Kopf, M.; Hogan, A.E.; et al. Interleukin-36 cytokines alter the intestinal microbiome and can protect against obesity and metabolic dysfunction. Nat. Commun. 2019, 10, 4003. [Google Scholar] [CrossRef] [Green Version]
- Carroll, I.M.; Andrus, J.M.; Bruno-Barcena, J.M.; Klaenhammer, T.R.; Hassan, H.M.; Threadgill, D.S. Anti-inflammatory properties of Lactobacillus gasseri expressing manganese superoxide dismutase using the interleukin 10-deficient mouse model of colitis. Am. J. Physiol. Gastrointest. Liver Physiol. 2007, 293, G729–G738. [Google Scholar] [CrossRef] [Green Version]
- Kang, J.X. Fat-1 transgenic mice: A new model for omega-3 research. Prostaglandins Leukot. Essent. Fat. Acids 2007, 77, 263–267. [Google Scholar] [CrossRef] [PubMed] [Green Version]
- Higuchi, T.; Yoshimura, M.; Oka, S.; Tanaka, K.; Naito, T.; Yuhara, S.; Warabi, E.; Mizuno, S.; Ono, M.; Takahashi, S.; et al. Modulation of methotrexate-induced intestinal mucosal injury by dietary factors. Hum. Exp. Toxicol. 2019, 39, 500–513. [Google Scholar] [CrossRef]
- Maini Rekdal, V.; Bess, E.N.; Bisanz, J.E.; Turnbaugh, P.J.; Balskus, E.P. Discovery and inhibition of an interspecies gut bacterial pathway for Levodopa metabolism. Science 2019, 364, eaau6323. [Google Scholar] [CrossRef] [PubMed] [Green Version]
- Koppel, N.; Maini Rekdal, V.; Balskus, E.P. Chemical transformation of xenobiotics by the human gut microbiota. Science 2017, 356, 6344. [Google Scholar] [CrossRef]
- Chamseddine, A.N.; Ducreux, M.; Armand, J.P.; Paoletti, X.; Satar, T.; Paci, A.; Mir, O. Intestinal bacterial beta-glucuronidase as a possible predictive biomarker of irinotecan-induced diarrhea severity. Pharmacol. Ther. 2019, 199, 1–15. [Google Scholar] [CrossRef] [PubMed]
- Vanlancker, E.; Vanhoecke, B.; Stringer, A.; Van de Wiele, T. 5-Fluorouracil and irinotecan (SN-38) have limited impact on colon microbial functionality and composition in vitro. PeerJ 2017, 5, e4017. [Google Scholar] [CrossRef]
- Nogueira, L.T.; Costa, D.V.; Gomes, A.S.; Martins, C.S.; Silva, A.M.; Coelho-Aguiar, J.M.; Castelucci, P.; Lima-Junior, R.C.; Leitao, R.F.; Moura-Neto, V.; et al. The involvement of mast cells in the irinotecan-induced enteric neurons loss and reactive gliosis. J. Neuroinflamm. 2017, 14, 79. [Google Scholar] [CrossRef] [Green Version]
- Fernandes, C.; Wanderley, C.W.S.; Silva, C.M.S.; Muniz, H.A.; Teixeira, M.A.; Souza, N.R.P.; Candido, A.G.F.; Falcao, R.B.; Souza, M.; Almeida, P.R.C.; et al. Role of regulatory T cells in irinotecan-induced intestinal mucositis. Eur. J. Pharm. Sci. 2018, 115, 158–166. [Google Scholar] [CrossRef]
- Lian, Q.; Xu, J.; Yan, S.; Huang, M.; Ding, H.; Sun, X.; Bi, A.; Ding, J.; Sun, B.; Geng, M. Chemotherapy-induced intestinal inflammatory responses are mediated by exosome secretion of double-strand DNA via AIM2 inflammasome activation. Cell Res. 2017, 27, 784–800. [Google Scholar] [CrossRef]
- Stringer, A.M. Interaction between host cells and microbes in chemotherapy-induced mucositis. Nutrients 2013, 5, 1488–1499. [Google Scholar] [CrossRef] [Green Version]
- Dabek, M.; McCrae, S.I.; Stevens, V.J.; Duncan, S.H.; Louis, P. Distribution of beta-glucosidase and beta-glucuronidase activity and of beta-glucuronidase gene gus in human colonic bacteria. FEMS Microbiol. Ecol. 2008, 66, 487–495. [Google Scholar] [CrossRef] [PubMed] [Green Version]
- McIntosh, F.M.; Maison, N.; Holtrop, G.; Young, P.; Stevens, V.J.; Ince, J.; Johnstone, A.M.; Lobley, G.E.; Flint, H.J.; Louis, P. Phylogenetic distribution of genes encoding beta-glucuronidase activity in human colonic bacteria and the impact of diet on faecal glycosidase activities. Environ. Microbiol. 2012, 14, 1876–1887. [Google Scholar] [CrossRef] [PubMed]
- Malo, M.S.; Alam, S.N.; Mostafa, G.; Zeller, S.J.; Johnson, P.V.; Mohammad, N.; Chen, K.T.; Moss, A.K.; Ramasamy, S.; Faruqui, A.; et al. Intestinal alkaline phosphatase preserves the normal homeostasis of gut microbiota. Gut 2010, 59, 1476–1484. [Google Scholar] [CrossRef] [PubMed]
- Malo, M.S.; Biswas, S.; Abedrapo, M.A.; Yeh, L.; Chen, A.; Hodin, R.A. The pro-inflammatory cytokines, IL-1beta and TNF-alpha, inhibit intestinal alkaline phosphatase gene expression. DNA Cell Biol. 2006, 25, 684–695. [Google Scholar] [CrossRef]
- Yue, B.; Gao, R.; Wang, Z.; Dou, W. Microbiota-Host-Irinotecan Axis: A New Insight Toward Irinotecan Chemotherapy. Front. Cell. Infect. Microbiol. 2021, 11, 710945. [Google Scholar] [CrossRef]
- Bhatt, A.P.; Pellock, S.J.; Biernat, K.A.; Walton, W.G.; Wallace, B.D.; Creekmore, B.C.; Letertre, M.M.; Swann, J.R.; Wilson, I.D.; Roques, J.R.; et al. Targeted inhibition of gut bacterial beta-glucuronidase activity enhances anticancer drug efficacy. Proc. Natl. Acad. Sci. USA 2020, 117, 7374–7381. [Google Scholar] [CrossRef] [Green Version]
- Little, M.S.; Pellock, S.J.; Walton, W.G.; Tripathy, A.; Redinbo, M.R. Structural basis for the regulation of beta-glucuronidase expression by human gut Enterobacteriaceae. Proc. Natl. Acad. Sci. USA 2018, 115, E152–E161. [Google Scholar] [CrossRef] [Green Version]
- Kaliannan, K.; Wang, B.; Li, X.Y.; Bhan, A.K.; Kang, J.X. Omega-3 fatty acids prevent early-life antibiotic exposure-induced gut microbiota dysbiosis and later-life obesity. Int. J. Obes. 2016, 40, 1039–1042. [Google Scholar] [CrossRef]
- Ghosh, S.; DeCoffe, D.; Brown, K.; Rajendiran, E.; Estaki, M.; Dai, C.; Yip, A.; Gibson, D.L. Fish oil attenuates omega-6 polyunsaturated fatty acid-induced dysbiosis and infectious colitis but impairs LPS dephosphorylation activity causing sepsis. PLoS ONE 2013, 8, e55468. [Google Scholar] [CrossRef]
- Monk, J.M.; Jia, Q.; Callaway, E.; Weeks, B.; Alaniz, R.C.; McMurray, D.N.; Chapkin, R.S. Th17 cell accumulation is decreased during chronic experimental colitis by (n-3) PUFA in Fat-1 mice. J. Nutr. 2012, 142, 117–124. [Google Scholar] [CrossRef]
- Jia, Q.; Lupton, J.R.; Smith, R.; Weeks, B.R.; Callaway, E.; Davidson, L.A.; Kim, W.; Fan, Y.Y.; Yang, P.; Newman, R.A.; et al. Reduced colitis-associated colon cancer in Fat-1 (n-3 fatty acid desaturase) transgenic mice. Cancer Res. 2008, 68, 3985–3991. [Google Scholar] [CrossRef] [PubMed] [Green Version]
- Monk, J.M.; Turk, H.F.; Fan, Y.Y.; Callaway, E.; Weeks, B.; Yang, P.; McMurray, D.N.; Chapkin, R.S. Antagonizing arachidonic acid-derived eicosanoids reduces inflammatory Th17 and Th1 cell-mediated inflammation and colitis severity. Mediat. Inflamm. 2014, 2014, 917149. [Google Scholar] [CrossRef] [PubMed]
- Gravaghi, C.; La Perle, K.M.; Ogrodwski, P.; Kang, J.X.; Quimby, F.; Lipkin, M.; Lamprecht, S.A. Cox-2 expression, PGE(2) and cytokines production are inhibited by endogenously synthesized n-3 PUFAs in inflamed colon of fat-1 mice. J. Nutr. Biochem. 2011, 22, 360–365. [Google Scholar] [CrossRef] [PubMed]
- Campbell, E.L.; MacManus, C.F.; Kominsky, D.J.; Keely, S.; Glover, L.E.; Bowers, B.E.; Scully, M.; Bruyninckx, W.J.; Colgan, S.P. Resolvin E1-induced intestinal alkaline phosphatase promotes resolution of inflammation through LPS detoxification. Proc. Natl. Acad. Sci. USA 2010, 107, 14298–14303. [Google Scholar] [CrossRef] [Green Version]
- Langille, M.G.; Zaneveld, J.; Caporaso, J.G.; McDonald, D.; Knights, D.; Reyes, J.A.; Clemente, J.C.; Burkepile, D.E.; Vega Thurber, R.L.; Knight, R.; et al. Predictive functional profiling of microbial communities using 16S rRNA marker gene sequences. Nat. Biotechnol. 2013, 31, 814–821. [Google Scholar] [CrossRef]
- Kanehisa, M.; Goto, S. KEGG: Kyoto encyclopedia of genes and genomes. Nucleic Acids Res. 2000, 28, 27–30. [Google Scholar] [CrossRef]
- Wong, D.V.; Lima-Junior, R.C.; Carvalho, C.B.; Borges, V.F.; Wanderley, C.W.; Bem, A.X.; Leite, C.A.; Teixeira, M.A.; Batista, G.L.; Silva, R.L.; et al. The Adaptor Protein Myd88 Is a Key Signaling Molecule in the Pathogenesis of Irinotecan-Induced Intestinal Mucositis. PLoS ONE 2015, 10, e0139985. [Google Scholar] [CrossRef]
- Logan, R.M.; Gibson, R.J.; Bowen, J.M.; Stringer, A.M.; Sonis, S.T.; Keefe, D.M. Characterisation of mucosal changes in the alimentary tract following administration of irinotecan: Implications for the pathobiology of mucositis. Cancer Chemother. Pharmacol. 2008, 62, 33–41. [Google Scholar] [CrossRef]
- Pedroso, S.; Vieira, A.T.; Bastos, R.W.; Oliveira, J.S.; Cartelle, C.T.; Arantes, R.M.E.; Soares, P.M.G.; Generoso, S.V.; Cardoso, V.N.; Teixeira, M.M.; et al. Evaluation of mucositis induced by irinotecan after microbial colonization in germ-free mice. Microbiology 2015, 161, 1950–1960. [Google Scholar] [CrossRef]
- Thorpe, D.; Sultani, M.; Stringer, A. Irinotecan induces enterocyte cell death and changes to muc2 and muc4 composition during mucositis in a tumour-bearing DA rat model. Cancer Chemother. Pharmacol. 2019, 83, 893–904. [Google Scholar] [CrossRef]
- Allen, A.; Hutton, D.A.; Pearson, J.P. The MUC2 gene product: A human intestinal mucin. Int. J. Biochem. Cell Biol. 1998, 30, 797–801. [Google Scholar] [CrossRef]
- Morampudi, V.; Dalwadi, U.; Bhinder, G.; Sham, H.P.; Gill, S.K.; Chan, J.; Bergstrom, K.S.; Huang, T.; Ma, C.; Jacobson, K.; et al. The goblet cell-derived mediator RELM-beta drives spontaneous colitis in Muc2-deficient mice by promoting commensal microbial dysbiosis. Mucosal. Immunol. 2016, 9, 1218–1233. [Google Scholar] [CrossRef] [PubMed] [Green Version]
- Wardill, H.R.; Bowen, J.M.; Van Sebille, Y.Z.; Secombe, K.R.; Coller, J.K.; Ball, I.A.; Logan, R.M.; Gibson, R.J. TLR4-Dependent Claudin-1 Internalization and Secretagogue-Mediated Chloride Secretion Regulate Irinotecan-Induced Diarrhea. Mol. Cancer Ther. 2016, 15, 2767–2779. [Google Scholar] [CrossRef] [PubMed] [Green Version]
- Wardill, H.R.; Bowen, J.M.; Al-Dasooqi, N.; Sultani, M.; Bateman, E.; Stansborough, R.; Shirren, J.; Gibson, R.J. Irinotecan disrupts tight junction proteins within the gut: Implications for chemotherapy-induced gut toxicity. Cancer Biol. Ther. 2014, 15, 236–244. [Google Scholar] [CrossRef] [Green Version]
- Lam, W.; Bussom, S.; Guan, F.; Jiang, Z.; Zhang, W.; Gullen, E.A.; Liu, S.H.; Cheng, Y.C. The four-herb Chinese medicine PHY906 reduces chemotherapy-induced gastrointestinal toxicity. Sci. Transl. Med. 2010, 2, 45ra59. [Google Scholar] [CrossRef]
- Thorpe, D.; Butler, R.; Sultani, M.; Vanhoecke, B.; Stringer, A. Irinotecan-Induced Mucositis Is Associated with Goblet Cell Dysregulation and Neural Cell Damage in a Tumour Bearing DA Rat Model. Pathol. Oncol. Res. 2020, 26, 955–965. [Google Scholar] [CrossRef]
- Wang, Y.; Sun, L.; Chen, S.; Guo, S.; Yue, T.; Hou, Q.; Feng, M.; Xu, H.; Liu, Y.; Wang, P.; et al. The administration of Escherichia coli Nissle 1917 ameliorates irinotecan-induced intestinal barrier dysfunction and gut microbial dysbiosis in mice. Life Sci. 2019, 231, 116529. [Google Scholar] [CrossRef]
- Robertson, R.C.; Kaliannan, K.; Strain, C.R.; Ross, R.P.; Stanton, C.; Kang, J.X. Maternal omega-3 fatty acids regulate offspring obesity through persistent modulation of gut microbiota. Microbiome 2018, 6, 95. [Google Scholar] [CrossRef]
- Wallace, B.D.; Roberts, A.B.; Pollet, R.M.; Ingle, J.D.; Biernat, K.A.; Pellock, S.J.; Venkatesh, M.K.; Guthrie, L.; O’Neal, S.K.; Robinson, S.J.; et al. Structure and Inhibition of Microbiome beta-Glucuronidases Essential to the Alleviation of Cancer Drug Toxicity. Chem. Biol. 2015, 22, 1238–1249. [Google Scholar] [CrossRef] [Green Version]
- Taylor, M.R.; Flannigan, K.L.; Rahim, H.; Mohamud, A.; Lewis, I.A.; Hirota, S.A.; Greenway, S.C. Vancomycin relieves mycophenolate mofetil-induced gastrointestinal toxicity by eliminating gut bacterial beta-glucuronidase activity. Sci. Adv. 2019, 5, eaax2358. [Google Scholar] [CrossRef] [Green Version]
- Ohdo, S.; Makinosumi, T.; Ishizaki, T.; Yukawa, E.; Higuchi, S.; Nakano, S.; Ogawa, N. Cell cycle-dependent chronotoxicity of irinotecan hydrochloride in mice. J. Pharmacol. Exp. Ther. 1997, 283, 1383–1388. [Google Scholar] [PubMed]
- Cheng, K.W.; Tseng, C.H.; Yang, C.N.; Tzeng, C.C.; Cheng, T.C.; Leu, Y.L.; Chuang, Y.C.; Wang, J.Y.; Lu, Y.C.; Chen, Y.L.; et al. Specific Inhibition of Bacterial beta-Glucuronidase by Pyrazolo[4,3-c]quinoline Derivatives via a pH-Dependent Manner To Suppress Chemotherapy-Induced Intestinal Toxicity. J. Med. Chem. 2017, 60, 9222–9238. [Google Scholar] [CrossRef] [PubMed]
- McClemens, J.; Kim, J.J.; Wang, H.; Mao, Y.K.; Collins, M.; Kunze, W.; Bienenstock, J.; Forsythe, P.; Khan, W.I. Lactobacillus rhamnosus ingestion promotes innate host defense in an enteric parasitic infection. Clin. Vaccine Immunol. 2013, 20, 818–826. [Google Scholar] [CrossRef] [Green Version]
- Nonose, R.; Spadari, A.P.; Priolli, D.G.; Maximo, F.R.; Pereira, J.A.; Martinez, C.A. Tissue quantification of neutral and acid mucins in the mucosa of the colon with and without fecal stream in rats. Acta Cir. Bras. 2009, 24, 267–275. [Google Scholar] [CrossRef] [Green Version]
- Pinget, G.; Tan, J.; Janac, B.; Kaakoush, N.O.; Angelatos, A.S.; O’Sullivan, J.; Koay, Y.C.; Sierro, F.; Davis, J.; Divakarla, S.K.; et al. Impact of the Food Additive Titanium Dioxide (E171) on Gut Microbiota-Host Interaction. Front. Nutr. 2019, 6, 57. [Google Scholar] [CrossRef] [Green Version]
- Khailova, L.; Frank, D.N.; Dominguez, J.A.; Wischmeyer, P.E. Probiotic administration reduces mortality and improves intestinal epithelial homeostasis in experimental sepsis. Anesthesiology 2013, 119, 166–177. [Google Scholar] [CrossRef] [PubMed] [Green Version]
- Magoc, T.; Salzberg, S.L. FLASH: Fast length adjustment of short reads to improve genome assemblies. Bioinformatics 2011, 27, 2957–2963. [Google Scholar] [CrossRef]
- Bolyen, E.; Rideout, J.R.; Dillon, M.R.; Bokulich, N.A.; Abnet, C.C.; Al-Ghalith, G.A.; Alexander, H.; Alm, E.J.; Arumugam, M.; Asnicar, F.; et al. Reproducible, interactive, scalable and extensible microbiome data science using QIIME 2. Nat. Biotechnol. 2019, 37, 852–857. [Google Scholar] [CrossRef]
- Callahan, B.J.; McMurdie, P.J.; Rosen, M.J.; Han, A.W.; Johnson, A.J.; Holmes, S.P. DADA2: High-resolution sample inference from Illumina amplicon data. Nat. Methods 2016, 13, 581–583. [Google Scholar] [CrossRef] [Green Version]
- Bokulich, N.A.; Kaehler, B.D.; Rideout, J.R.; Dillon, M.; Bolyen, E.; Knight, R.; Huttley, G.A.; Gregory Caporaso, J. Optimizing taxonomic classification of marker-gene amplicon sequences with QIIME 2′s q2-feature-classifier plugin. Microbiome 2018, 6, 90. [Google Scholar] [CrossRef]
- Pielou, E.C. The measurement of diversity in different types of biological collections. J. Theor. Biol. 1966, 13, 131–144. [Google Scholar] [CrossRef]
- Lozupone, C.; Knight, R. UniFrac: A new phylogenetic method for comparing microbial communities. Appl. Environ. Microbiol. 2005, 71, 8228–8235. [Google Scholar] [CrossRef] [PubMed] [Green Version]
- Kaliannan, K.; Robertson, R.C.; Murphy, K.; Stanton, C.; Kang, C.; Wang, B.; Hao, L.; Bhan, A.K.; Kang, J.X. Estrogen-mediated gut microbiome alterations influence sexual dimorphism in metabolic syndrome in mice. Microbiome 2018, 6, 205. [Google Scholar] [CrossRef] [PubMed]
- Mandal, S.; Van Treuren, W.; White, R.A.; Eggesbo, M.; Knight, R.; Peddada, S.D. Analysis of composition of microbiomes: A novel method for studying microbial composition. Microb. Ecol. Health Dis. 2015, 26, 27663. [Google Scholar] [CrossRef] [Green Version]
- McMurdie, P.J.; Holmes, S. Waste not, want not: Why rarefying microbiome data is inadmissible. PLoS Comput. Biol. 2014, 10, e1003531. [Google Scholar] [CrossRef] [PubMed] [Green Version]
- Chong, J.; Liu, P.; Zhou, G.; Xia, J. Using MicrobiomeAnalyst for comprehensive statistical, functional, and meta-analysis of microbiome data. Nat. Protoc. 2020, 15, 799–821. [Google Scholar] [CrossRef]
- Liaw, A.; Wiener, M. Classification and Regression by RandomForest. Forest 2001, 23, 18–22. [Google Scholar]
- Douglas, G.M.; Maffei, V.J.; Zaneveld, J.R.; Yurgel, S.N.; Brown, J.R.; Taylor, C.M.; Huttenhower, C.; Langille, M.G.I. PICRUSt2 for prediction of metagenome functions. Nat. Biotechnol. 2020, 38, 685–688. [Google Scholar] [CrossRef]
- Louca, S.; Doebeli, M. Efficient comparative phylogenetics on large trees. Bioinformatics 2018, 34, 1053–1055. [Google Scholar] [CrossRef]
- Ye, Y.; Doak, T.G. A parsimony approach to biological pathway reconstruction/inference for genomes and metagenomes. PLoS Comput. Biol. 2009, 5, e1000465. [Google Scholar] [CrossRef] [Green Version]
- Xia, J.; Broadhurst, D.I.; Wilson, M.; Wishart, D.S. Translational biomarker discovery in clinical metabolomics: An introductory tutorial. Metabolomics 2013, 9, 280–299. [Google Scholar] [CrossRef] [PubMed] [Green Version]
- Smilde, A.K.; van der Werf, M.J.; Bijlsma, S.; van der Werff-van der Vat, B.J.; Jellema, R.H. Fusion of mass spectrometry-based metabolomics data. Anal. Chem. 2005, 77, 6729–6736. [Google Scholar] [CrossRef] [PubMed]
- Zhou, Y.; Jackson, D.; Bacharier, L.B.; Mauger, D.; Boushey, H.; Castro, M.; Durack, J.; Huang, Y.; Lemanske, R.F., Jr.; Storch, G.A.; et al. The upper-airway microbiota and loss of asthma control among asthmatic children. Nat. Commun. 2019, 10, 5714. [Google Scholar] [CrossRef] [Green Version]
- Kelder, T.; Stroeve, J.H.; Bijlsma, S.; Radonjic, M.; Roeselers, G. Correlation network analysis reveals relationships between diet-induced changes in human gut microbiota and metabolic health. Nutr. Diabetes 2014, 4, e122. [Google Scholar] [CrossRef] [PubMed] [Green Version]
- Lin, X.B.; Farhangfar, A.; Valcheva, R.; Sawyer, M.B.; Dieleman, L.; Schieber, A.; Ganzle, M.G.; Baracos, V. The role of intestinal microbiota in development of irinotecan toxicity and in toxicity reduction through dietary fibres in rats. PLoS ONE 2014, 9, e83644. [Google Scholar] [CrossRef] [PubMed] [Green Version]
- Elian, S.D.; Souza, E.L.; Vieira, A.T.; Teixeira, M.M.; Arantes, R.M.; Nicoli, J.R.; Martins, F.S. Bifidobacterium longum subsp. infantis BB-02 attenuates acute murine experimental model of inflammatory bowel disease. Benef. Microbes 2015, 6, 277–286. [Google Scholar] [CrossRef] [PubMed]
- Kang, J.X.; Wang, J. A simplified method for analysis of polyunsaturated fatty acids. BMC Biochem. 2005, 6, 5. [Google Scholar] [CrossRef] [Green Version]
- Das, S.; Rachagani, S.; Sheinin, Y.; Smith, L.M.; Gurumurthy, C.B.; Roy, H.K.; Batra, S.K. Mice deficient in Muc4 are resistant to experimental colitis and colitis-associated colorectal cancer. Oncogene 2016, 35, 2645–2654. [Google Scholar] [CrossRef] [Green Version]
- Wang, W.; Cassidy, J. Constitutive nuclear factor-kappa B mRNA, protein overexpression and enhanced DNA-binding activity in thymidylate synthase inhibitor-resistant tumour cells. Br. J. Cancer 2003, 88, 624–629. [Google Scholar] [CrossRef]


Publisher’s Note: MDPI stays neutral with regard to jurisdictional claims in published maps and institutional affiliations. |
© 2022 by the authors. Licensee MDPI, Basel, Switzerland. This article is an open access article distributed under the terms and conditions of the Creative Commons Attribution (CC BY) license (https://creativecommons.org/licenses/by/4.0/).
Share and Cite
Kaliannan, K.; Donnell, S.O.; Murphy, K.; Stanton, C.; Kang, C.; Wang, B.; Li, X.-Y.; Bhan, A.K.; Kang, J.X. Decreased Tissue Omega-6/Omega-3 Fatty Acid Ratio Prevents Chemotherapy-Induced Gastrointestinal Toxicity Associated with Alterations of Gut Microbiome. Int. J. Mol. Sci. 2022, 23, 5332. https://0-doi-org.brum.beds.ac.uk/10.3390/ijms23105332
Kaliannan K, Donnell SO, Murphy K, Stanton C, Kang C, Wang B, Li X-Y, Bhan AK, Kang JX. Decreased Tissue Omega-6/Omega-3 Fatty Acid Ratio Prevents Chemotherapy-Induced Gastrointestinal Toxicity Associated with Alterations of Gut Microbiome. International Journal of Molecular Sciences. 2022; 23(10):5332. https://0-doi-org.brum.beds.ac.uk/10.3390/ijms23105332
Chicago/Turabian StyleKaliannan, Kanakaraju, Shane O. Donnell, Kiera Murphy, Catherine Stanton, Chao Kang, Bin Wang, Xiang-Yong Li, Atul K. Bhan, and Jing X. Kang. 2022. "Decreased Tissue Omega-6/Omega-3 Fatty Acid Ratio Prevents Chemotherapy-Induced Gastrointestinal Toxicity Associated with Alterations of Gut Microbiome" International Journal of Molecular Sciences 23, no. 10: 5332. https://0-doi-org.brum.beds.ac.uk/10.3390/ijms23105332