Article

Aurivillius Oxides Nanosheets-Based Photocatalysts for Efficient Oxidation of Malachite Green Dye

1
Department of Chemical and Geological Sciences, University of Cagliari, S.P. 8 km 0.700, 09042 Monserrato, Italy
2
Consorzio Interuniversitario per lo Sviluppo dei Sistemi a Grande Interfase (CSGI), Via della Lastruccia 3, 50019 Sesto Fiorentino, Italy
3
Department of Biomedical Sciences, University of Cagliari, S.P. 8 km 0.700, 09042 Monserrato, Italy
*
Author to whom correspondence should be addressed.
These authors contributed equally to this work.
Int. J. Mol. Sci. 2022, 23(10), 5422; https://0-doi-org.brum.beds.ac.uk/10.3390/ijms23105422
Submission received: 30 March 2022 / Revised: 28 April 2022 / Accepted: 9 May 2022 / Published: 12 May 2022
(This article belongs to the Collection Feature Papers in 'Physical Chemistry and Chemical Physics')

Abstract

:
Aurivillius oxides ferroelectric layered materials are formed by bismuth oxide and pseu-do-perovskite layers. They have a good ionic conductivity, which is beneficial for various photo-catalyzed reactions. Here, we synthesized ultra-thin nanosheets of two different Aurivillius oxides, Bi2WO6 (BWO) and Bi2MoO6 (BMO), by using a hard-template process. All materials were characterized through XRD, TEM, FTIR, TGA/DSC, DLS/ELS, DRS, UV-Vis. Band gap material (Eg) and potential of the valence band (EVB) were calculated for BWO and BMO. In contrast to previous reports on the use of multi composite materials, a new procedure for photocatalytic efficient BMO nanosheets was developed. The procedure, with an additional step only, avoids the use of composite materials, improves crystal structure, and strongly reduces impurities. BWO and BMO were used as photocatalysts for the degradation of the water pollutant dye malachite green (MG). MG removal kinetics was fitted with Langmuir—Hinshelwood model obtaining a kinetic constant k = 7.81 × 10⁻² min−1 for BWO and k = 9.27 × 10⁻² min−1 for BMO. Photocatalytic dye degradation was highly effective, reaching 89% and 91% MG removal for BWO and BMO, respectively. A control experiment, carried out in the absence of light, allowed to quantify the contribution of adsorption to MG removal process. Adsorption contributed to MG removal by a 51% for BWO and only by a 19% for BMO, suggesting a different degradation mechanism for the two photocatalysts. The advanced MG degradation process due to BMO is likely caused by the high crystallinity of the material synthetized with the new procedure. Reuse tests demonstrated that both photocatalysts are highly active and stable reaching a MG removal up to 95% at the 10th reaction cycle. These results demonstrate that BMO nanosheets, synthesized with an easy additional step, achieved the best degradation performance, and can be successfully used for environmental remediation applications.

1. Introduction

Pollution is one of the main issues that afflict modern society. Pollutants include heavy metals, inorganic, and organic compounds [1,2,3,4]. Among organic compounds, pharmaceuticals, hormones, sweeteners, cleaning products, and dyes have been largely studied for their toxicity [5]. The first step to tackle pollution is to detect and quantify the specific contaminants [6]. Due to their toxicity, heavy metals traces are critical for natural environments, hence, they have to be precisely determined [7,8]. Organic dyes are one class of substances extensively used in the textile industry, which can also be found in a huge number of products, such as plastics, toys, cosmetics, and coatings [9,10,11]. Some organic dyes are toxic and carcinogenic, and can be found in textile industry wastewaters [12,13]. It is estimated that about 15% of the total dyes produced annually in the world ends up in the environment [12]. The main strategies to solve the problem of dye contamination involve their removal through the use of either adsorbents [14], electrochemical degradation [15,16], or photocatalysts [12]. Synthetic dyes are specifically designed to be very resistant to aerobic degradation, although they are not resistant to anaerobic conditions [17]. About 70% of the total organic dye pollution is composed of azo-dyes, which are anaerobically degraded by microorganisms into aromatic amines. These substances are confirmed or suspected carcinogens, posing a relevant health risk to humans and other living creatures [9]. Among several pollutant dyes [18], malachite green (MG) is a cationic N-methylated diaminotriphenylmethane colorant used in textile, leather, and paper factories [19]. MG is considered one of the most toxic dyes especially due to irreversible damage to aquatic organisms [19,20,21].
In the best scenario, dye degradation is thermodynamically favored, but kinetically too slow [22,23,24]. Even in the case that the degradation is also thermodynamically unfavorable, a photocatalyst can be used [25]. Photocatalysts are materials capable of absorbing photon energy and “storing” it in an excited state. However, stress must be put on the fact that the efficiency of each photocatalysis step must be maximized (Scheme S1 in SI) [26]. In particular, photogenerated charge recombination is a typical drawback of heterogeneous photocatalysis systems. Various ways to limit the phenomenon have been studied, such as doping and creation of composites by coupling two or more materials. When a semiconductor is doped, small quantities of a new material are added, so that the band gap energy is modified, and a better performance is achievable. Similarly, a higher number of photocatalysts with distinct band gap energies can be coupled [27,28,29,30,31]. A simple and effective strategy to limit photogenerated charge recombination is to produce nanosized particles of the desired photocatalyst. In doing so, the average length of the photogenerated charge path, from the bulk to the surface reaction site, is greatly reduced. Consequently, the probability of recombination is significantly lower [32]. The use of semiconductor photocatalysts as composites of a wide range of materials for environmental remediation purposes has been extensively reported [33,34,35].
Perovskites are a class of mixed metal oxides, named after the naturally occurring mineral perovskite, CaTiO3. Their structure can be schematized as corner-sharing octahedra, oriented along the same axis (Scheme 1A). In contrast to the pure perovskite structure, in pseudo-perovskite materials the disposition of the octahedra is distorted. In the last years, Aurivillius phase oxides, originally discovered in 1949 [36], have gained much interest [37,38]. These are layered metal oxides, generally formulated as Bi2Am−1BmO3m+3 where A and B are transition metals, O oxygen and m a positive integer whose value depends on the specific elements involved and the phase structure. m essentially represents the number of consecutive perovskite sheets between two bismuth oxide layers. The Aurivillius structure is formed by (Bi2O2)2+ sheets swapped with one or more pseudo-perovskite layers with formula (Am−1BmO3m+1)2−. B can be Fe, Cr, Ti, Ga, Nb, V, Mo, W etc., [39]. In this work we apply Mo and W (separately) as component B (Scheme 1A) with condition m = 1 such that component A is not present. Aurivillius phases are generally known as oxides in literature [38,39,40,41] and commonly referred to as compounds containing bismuth as a cation, even though they are covalent solids (in the same way that bismuth vanadate, bismuth tungstate are covalent solids) [42]. Bismuth-containing photocatalysts are recurring in literature as standalone or base materials for composite photocatalysts [28,43]. They typically have band gaps in the energy range of visible light. Bismuth oxyhalides (BiOX, with X = halogen) for example, permit a high photogenerated charge mobility due to their electronic structure. The layered structure is very effective in boosting the photogenerated charge separation [43]. BiOX-based composites obtained by solvo-hydrothermal and co-precipitation synthesis methods often reached up to 99% of pollutant degradation efficiency in limited time frame (1–4 h). However, due to the weak strength of the halogen bond [44], bismuth oxyhalides are fairly sensitive (except BiOBr) to photoinduced corrosion.
Aurivillius phases are ferroelectric, that is, they have a permanent electric polarization between the layers, thanks to their particular structure [38,45]. Alternate layers in these materials behave as a two-dimensional capacitor. When m = 1 (only one perovskite layer between bismuth oxide layers), the polarization is maximal, greatly improving charge separation. Moreover, narrow band gaps of certain Aurivillius phases allow them to absorb visible light, while remaining generally stable against photocorrosion and leaching of metals in aqueous solution [46]. Bismuth tungstate Bi2WO6 (BWO) and its isostructural bismuth molybdate Bi2MoO6 (BMO) both exhibit high ionic conductivity and high polarization (having m = 1) [25]. For these reasons, layered bismuth molybdate and tungstate have received much attention recently, and they have been used to photocatalyze dye degradation [40,47,48].
Di and coworkers focused on the importance of oxygen defects on photocatalytic water splitting on BWO nanosheets [49]. Chankhanittha, et al. used BMO for photocatalyzed degradation of two azo dyes and two antibiotics, demonstrating the capability of these solids for removing pollutants from aqueous solutions [48]. Recently, Yin et al. constructed a nanocomposite of BWO and a metal organic framework with the aim of improving charge separation and effectively degrade rhodamine B in aqueous solution through visible light irradiation [50]. Ruan et al. prepared oxygen-vacancy rich BWO microspheres and used them to degrade six types of phenolic compounds [42]. Dutta et al. studied the influence of transition metal dopants on BMO nanorods, used as photocatalysts for methylene blue and MG degradation, reaching up to 32% MG removal with undoped bismuth molybdate [30].
Photocatalytic efficiency of layered bismuth molybdate and tungstate can be improved with the use of composite materials (heterojunction or Z-scheme) [51,52,53,54] or doping [31]. Although several doped or composite photocatalysts such as have been used for dyes and drugs degradation, their preparation requires a complex (time consuming and expensive) multiple-steps synthesis. A wide variety of works reported the use of composites for the degradation of pollutants, however their improvement in physico chemical properties and photocatalytic efficiency is rarely determined by an additional synthetic step only.
In this work, our aim is to prepare highly efficient photocatalysts using a simple synthetic route without the need of composites or the use of expensive reagents. To this purpose, basic syntheses were carried out with just one extra hydrothermal step added to a simple method from literature [45,53]. We synthesized BWO and BMO nanosheets and characterized them through X-ray diffraction (XRD), Fourier transform infrared spectroscopy (FTIR), transmission electron microscopies (TEM), thermogravimetric analysis (TGA) and light scattering (DLS/ELS). We compare the photocatalytic activity of BWO and BMO, examining the photocatalytic degradation of the polluting dye malachite green. Finally, kinetic behavior of BWO and BMO together with reuse stability was determined.

2. Materials and Methods

2.1. Chemicals

Bismuth (III) nitrate pentahydrate Bi(NO3)3·5H2O ≥ 99.99%, potassium bromide KBr FTIR grade, ≥ 99% purity, polyvinylpyrrolidone (PVP, [C6H9NO]n) (average molar mass of 40,000 g/mol), D-mannitol (C6H14O6) ≥ 98%, sodium molybdate dihydrate (Na2MoO6·2H2O), and sodium tungstate dihydrate (Na2WO6·2H2O) ACS reagents ≥ 99% purity were purchased from Sigma-Aldrich (Milan, Italy). Bi-distilled MilliQ® water was used as solvent for all reactions throughout the whole work and referred to simply as “water” for convenience. The same water was also used for any washing or dilution procedures. Ethanol (for washings only) >96% was purchased from Honeywell (Seelze, Germany). All reagents were used without further purification.

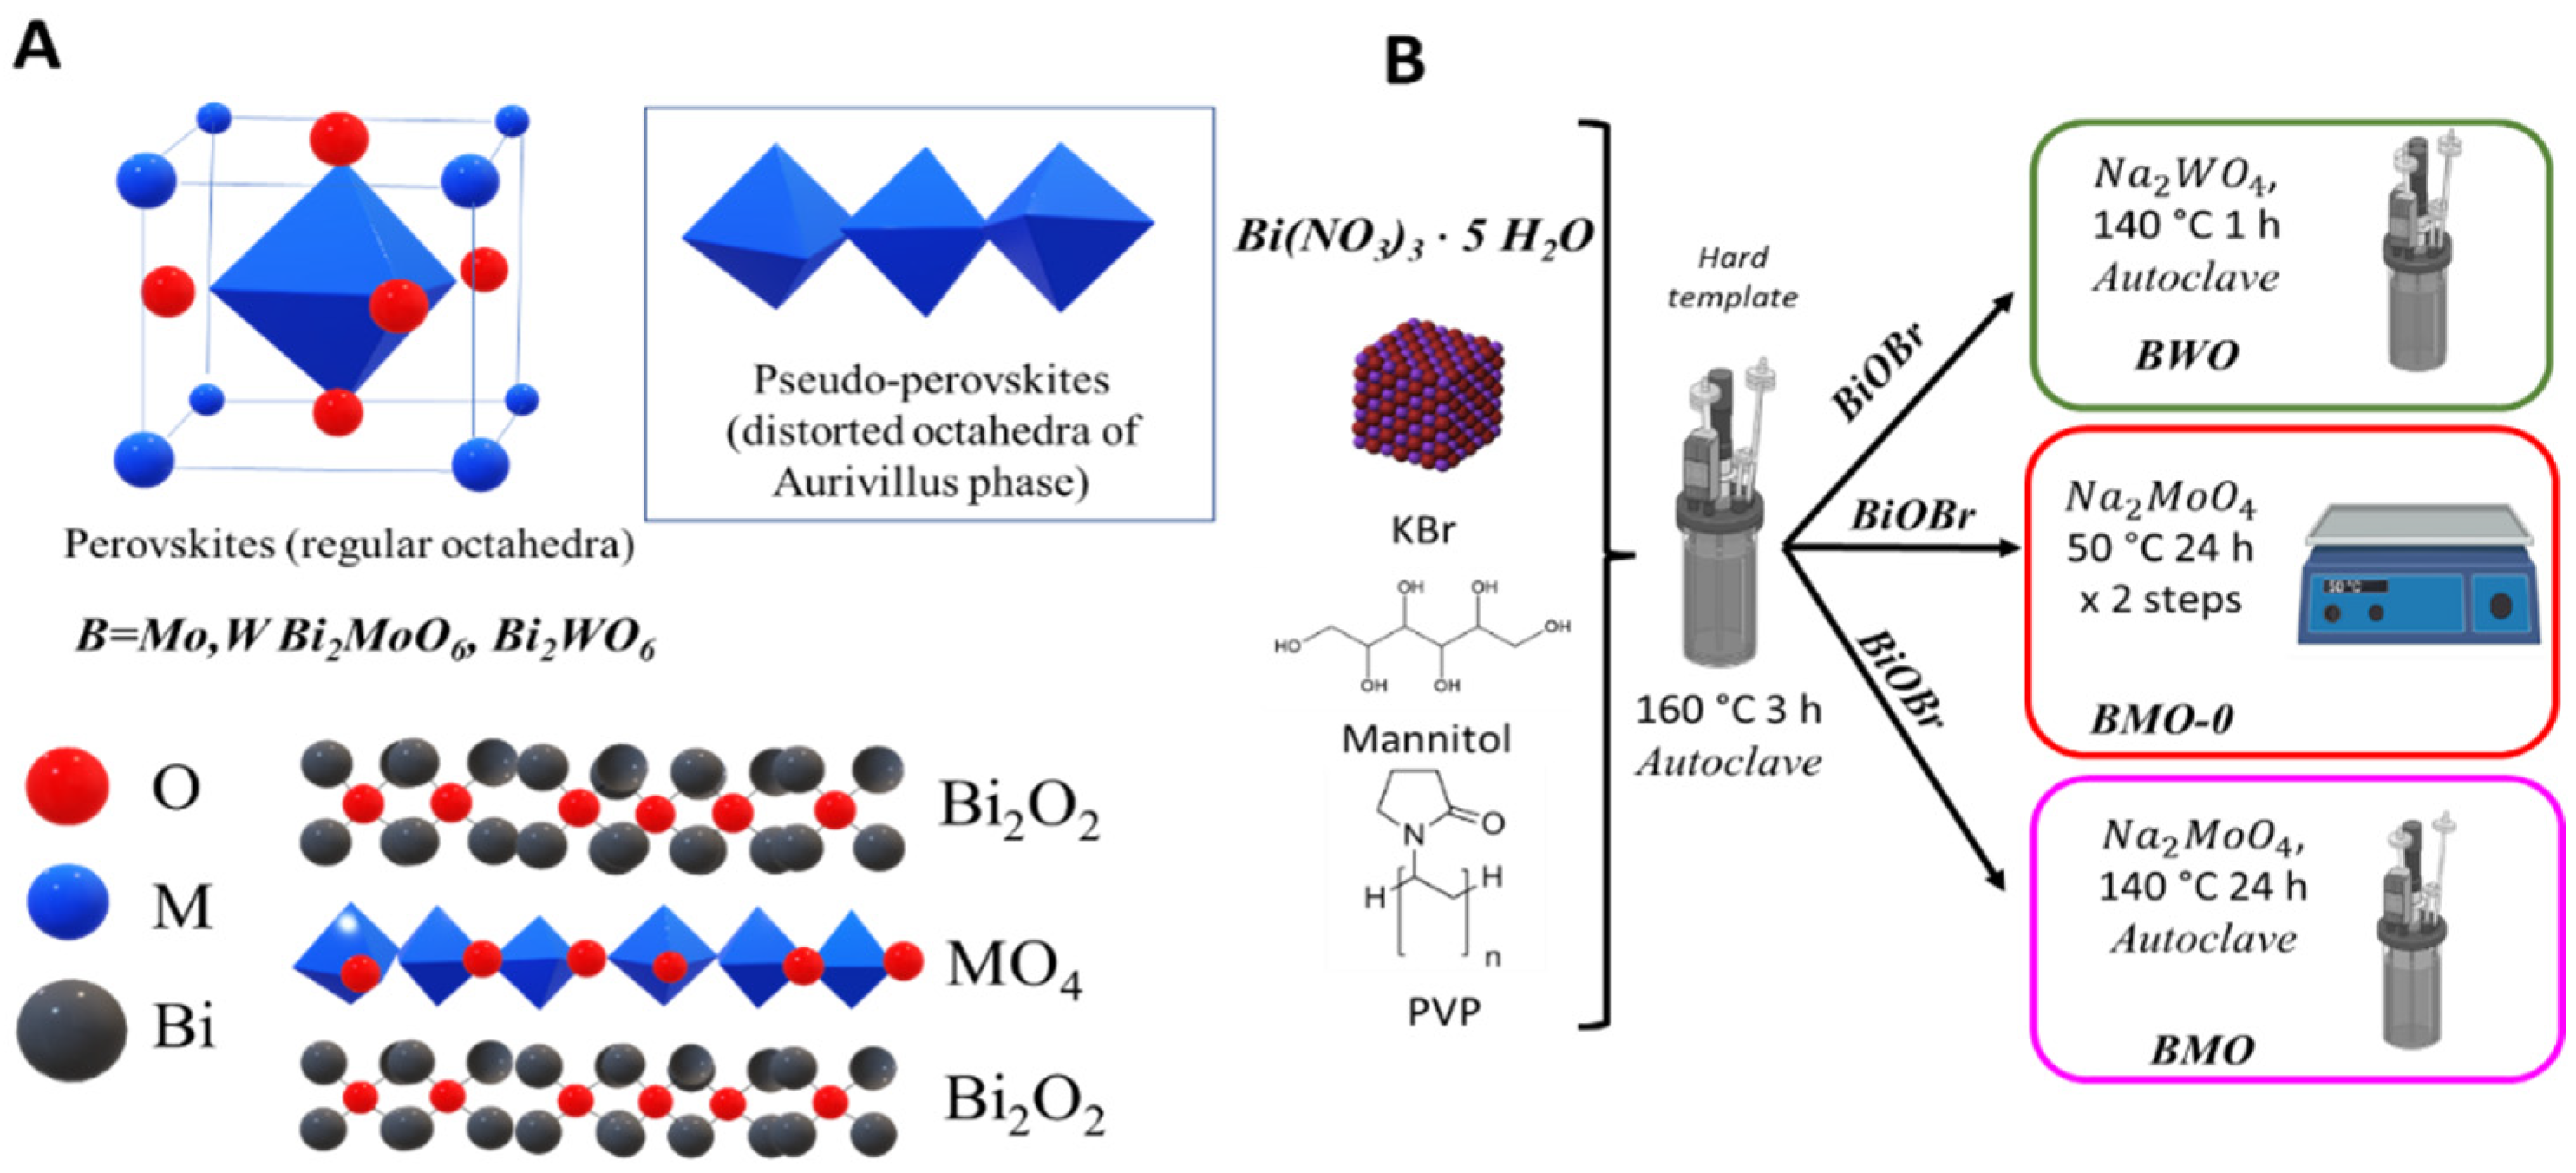
2.2. Synthesis of BiOBr Nanosheets

BiOBr nanosheets were synthesized according to the procedure of Di et al. [49,56]. Briefly, a mass of 2.402 g of mannitol was dissolved in 132 mL of milliQ water under magnetic stirring at room temperature. Then, 2.015 g of Bi2 (NO3)3∙5H2O and 1.760 g of polyvinylpyrrolidone (PVP) were added to the solution. After they were completely dissolved, 44 mL of aqueous KBr (0.1 M) solution was injected into the first one, over the course of a minimum of 2 min under stirring, which was maintained for further 30 min. The liquid was poured into a 220 mL Teflon-lined stainless-steel autoclave, which was closed and heated in an oven at 160 °C for 3 h and subsequently cooled to room temperature. The nanosheets (NS) were gathered by centrifugation (4500 rpm for 40 min) and washed three times with water and three times with ethanol. After the last separation, the material was left in a 60 °C drying oven overnight, finely ground with mortar and pestle and collected to be used in the following reactions. No buffer solutions or any other pH control strategy was used in the syntheses or the subsequent characterizations and tests.

2.3. Synthesis of BWO Nanosheets

A mass of 0.244 g of previously prepared BiOBr NSs (0.244 g) was dispersed in 64 mL of distilled water and sonicated for 40 min and kept under magnetic stirring. Then, 0.528 g of Na2WO4∙2H2O was slowly added to the dispersion, which was stirred for further 30 min. The mixture was then heated in an 80 mL Teflon-lined stainless-steel autoclave at 140 °C for 1 h [49]. The separation, washing, and drying procedures were identical to those used in the BiOBr synthesis.

2.4. Synthesis of BMO Nanosheets

In the case of BMO, various synthetic methods were used (Table S1). The first sample (BMO-0) corresponds to a synthetic strategy already reported in literature [56]. In a typical non-hydrothermal synthesis of bismuth molybdate, a dispersion of BiOBr NSs (0.305 g) in 40 mL of water was prepared by sonication for 40 min. Then, 0.484 g of Na2MoO4·2H2O was added under stirring. The mixture was heated at 50 °C and kept under stirring at this temperature and atmospheric pressure for 24 h. After centrifugation, collection, and re-dispersion of a yellow solid by sonication, another 0.968 g of Na2MoO4·2H2O was added, and the reaction was carried out for 24 h, at 50 °C, under stirring.
The newly developed synthetic method used here involved using 0.457 g of previously prepared BiOBr NS, which was dispersed in 60 mL of distilled water under sonication for 40 min. About 0.726 g of Na2MoO4∙2H2O was slowly added and kept under stirring for 30 min at room temperature. Then the solution was transferred in an 80 mL autoclave and heated at 140 °C in the oven. To investigate the influence of hydrothermal synthesis duration on the properties of the material, sample BMO-3 was heated for 3 h, while sample BMO-24 (throughout the paper BMO-24 is reported as BMO for clarity) spent 24 h in the oven. In both cases, separation, washing, and drying procedures were the same of BiOBr and BWO syntheses. The hydrothermal treatment and the overall shorter time of ion exchange in our synthesis were the key differences compared to literature (Table 1) [49,56].

2.5. Samples Characterizations

X-ray diffraction (XRD), transmission electron microscopy (TEM), thermogravimetric analysis (TGA), diffuse reflectance spectroscopy (DRS), dynamic light scattering (DLS), and electrophoretic light scattering (ELS) were used to characterize the three materials. Samples were finally tested in terms of capability of degradation of a dye pollutant in aqueous solution by means of UV-Vis spectroscopy. XRD analysis was carried out through a Bruker D8 Advance equipped with a PSD LynxEye detector. TEM images were acquired on a JEOL JEM 1400 Plus. TGA analysis was made on a Perkin-Elmer Thermogravimetric Analyzer TGA/DSC, DRS was performed on an Agilent Technologies Cary 5000 UV-Vis-NIR spectrophotometer with DRS accessory. FTIR spectra were recorded with a Brüker Tensor 27 FTIR spectrometer equipped with a diamond-ATR accessory. DLS and ELS were both executed by means of a Zetasizer Nano series by Malvern. For the photocatalytic tests, a Cary 60 UV/Vis spectrophotometer by Agilent Technologies was used.

2.6. Photocatalytic Tests

All the samples for photocatalytic tests were held in glass vials, gas-tight sealed with screw caps as soon as possible after their preparation. Rubber gaskets were used when necessary. In both BWO and BMO tests, four identical 4 mL glass vials were filled with 4 mL of a 10.4 mg/L solution of malachite green oxalate (MG), and labeled as 1, 2, 3, and 4 (Table S3). About 4 mg of BWO (BMO) was added both in 1 and 2. Samples 1 and 3 were sonicated for 20 min, then irradiated for 8 h by a 100 W, 6500 K LED floodlight, under constant magnetic stirring. Samples 2 and 4 were kept in the dark for the same amount of time. A sample of the 10.4 mg/L MG solution, as well as samples from all vials after the irradiation, was collected and characterized via UV-Vis spectroscopy immediately before and after the experiment. Centrifugation was used to separate liquid from solid in cases 1 and 2 after the experiment. The effective concentration of MG (Figure S2), as well as the effective mass of BWO or BMO, was recorded and reported in the results section, to precisely compare the effects. MG removal percentage was calculated as in Table 2 (Equation S1), where A0 is the absorbance of the initial 6.9 mg/L MG solution and A the absorbance of the proper sample.

2.7. Photocatalysts Reuse

The reuse of BWO and BMO photocatalysts was carried out in transparent centrifuge plastic tubes with sealing screw caps. Each tube was filled with 10 mL of MG aqueous solution (conc. 6.97 mg/L), 10 mg of BWO or BMO, and a small stirring bar. The photocatalysts were dispersed by ultrasonication for 20 min, then were positioned at the same distance in front of the lamp. Two identical stirring plates were used, and the position of each photocatalyst was switched at every reuse cycle. After 24 h of irradiation, the tubes were centrifuged at 4500 rpm for 15 min, leading to complete precipitation of the solid. The supernatant was quantitatively removed and immediately analyzed with UV-Vis spectrophotometry. The tubes were then filled again with MG solution, ultrasonicated and put back in front of the lamp for a new reaction cycle.

3. Results and Discussion

3.1. Physico-Chemical Characterizations

BiOBr was initially synthesized and then used as a hard template for the preparation of the two photocatalysts BWO and BMO (Scheme 1B). Three different BMO samples were synthesized, the first following a procedure from literature (BMO-0) [49], and other two involving an additional hydrothermal step in an autoclave at 140 °C for 3 h (BMO-3) and 24 h (BMO), respectively (Scheme 1B).

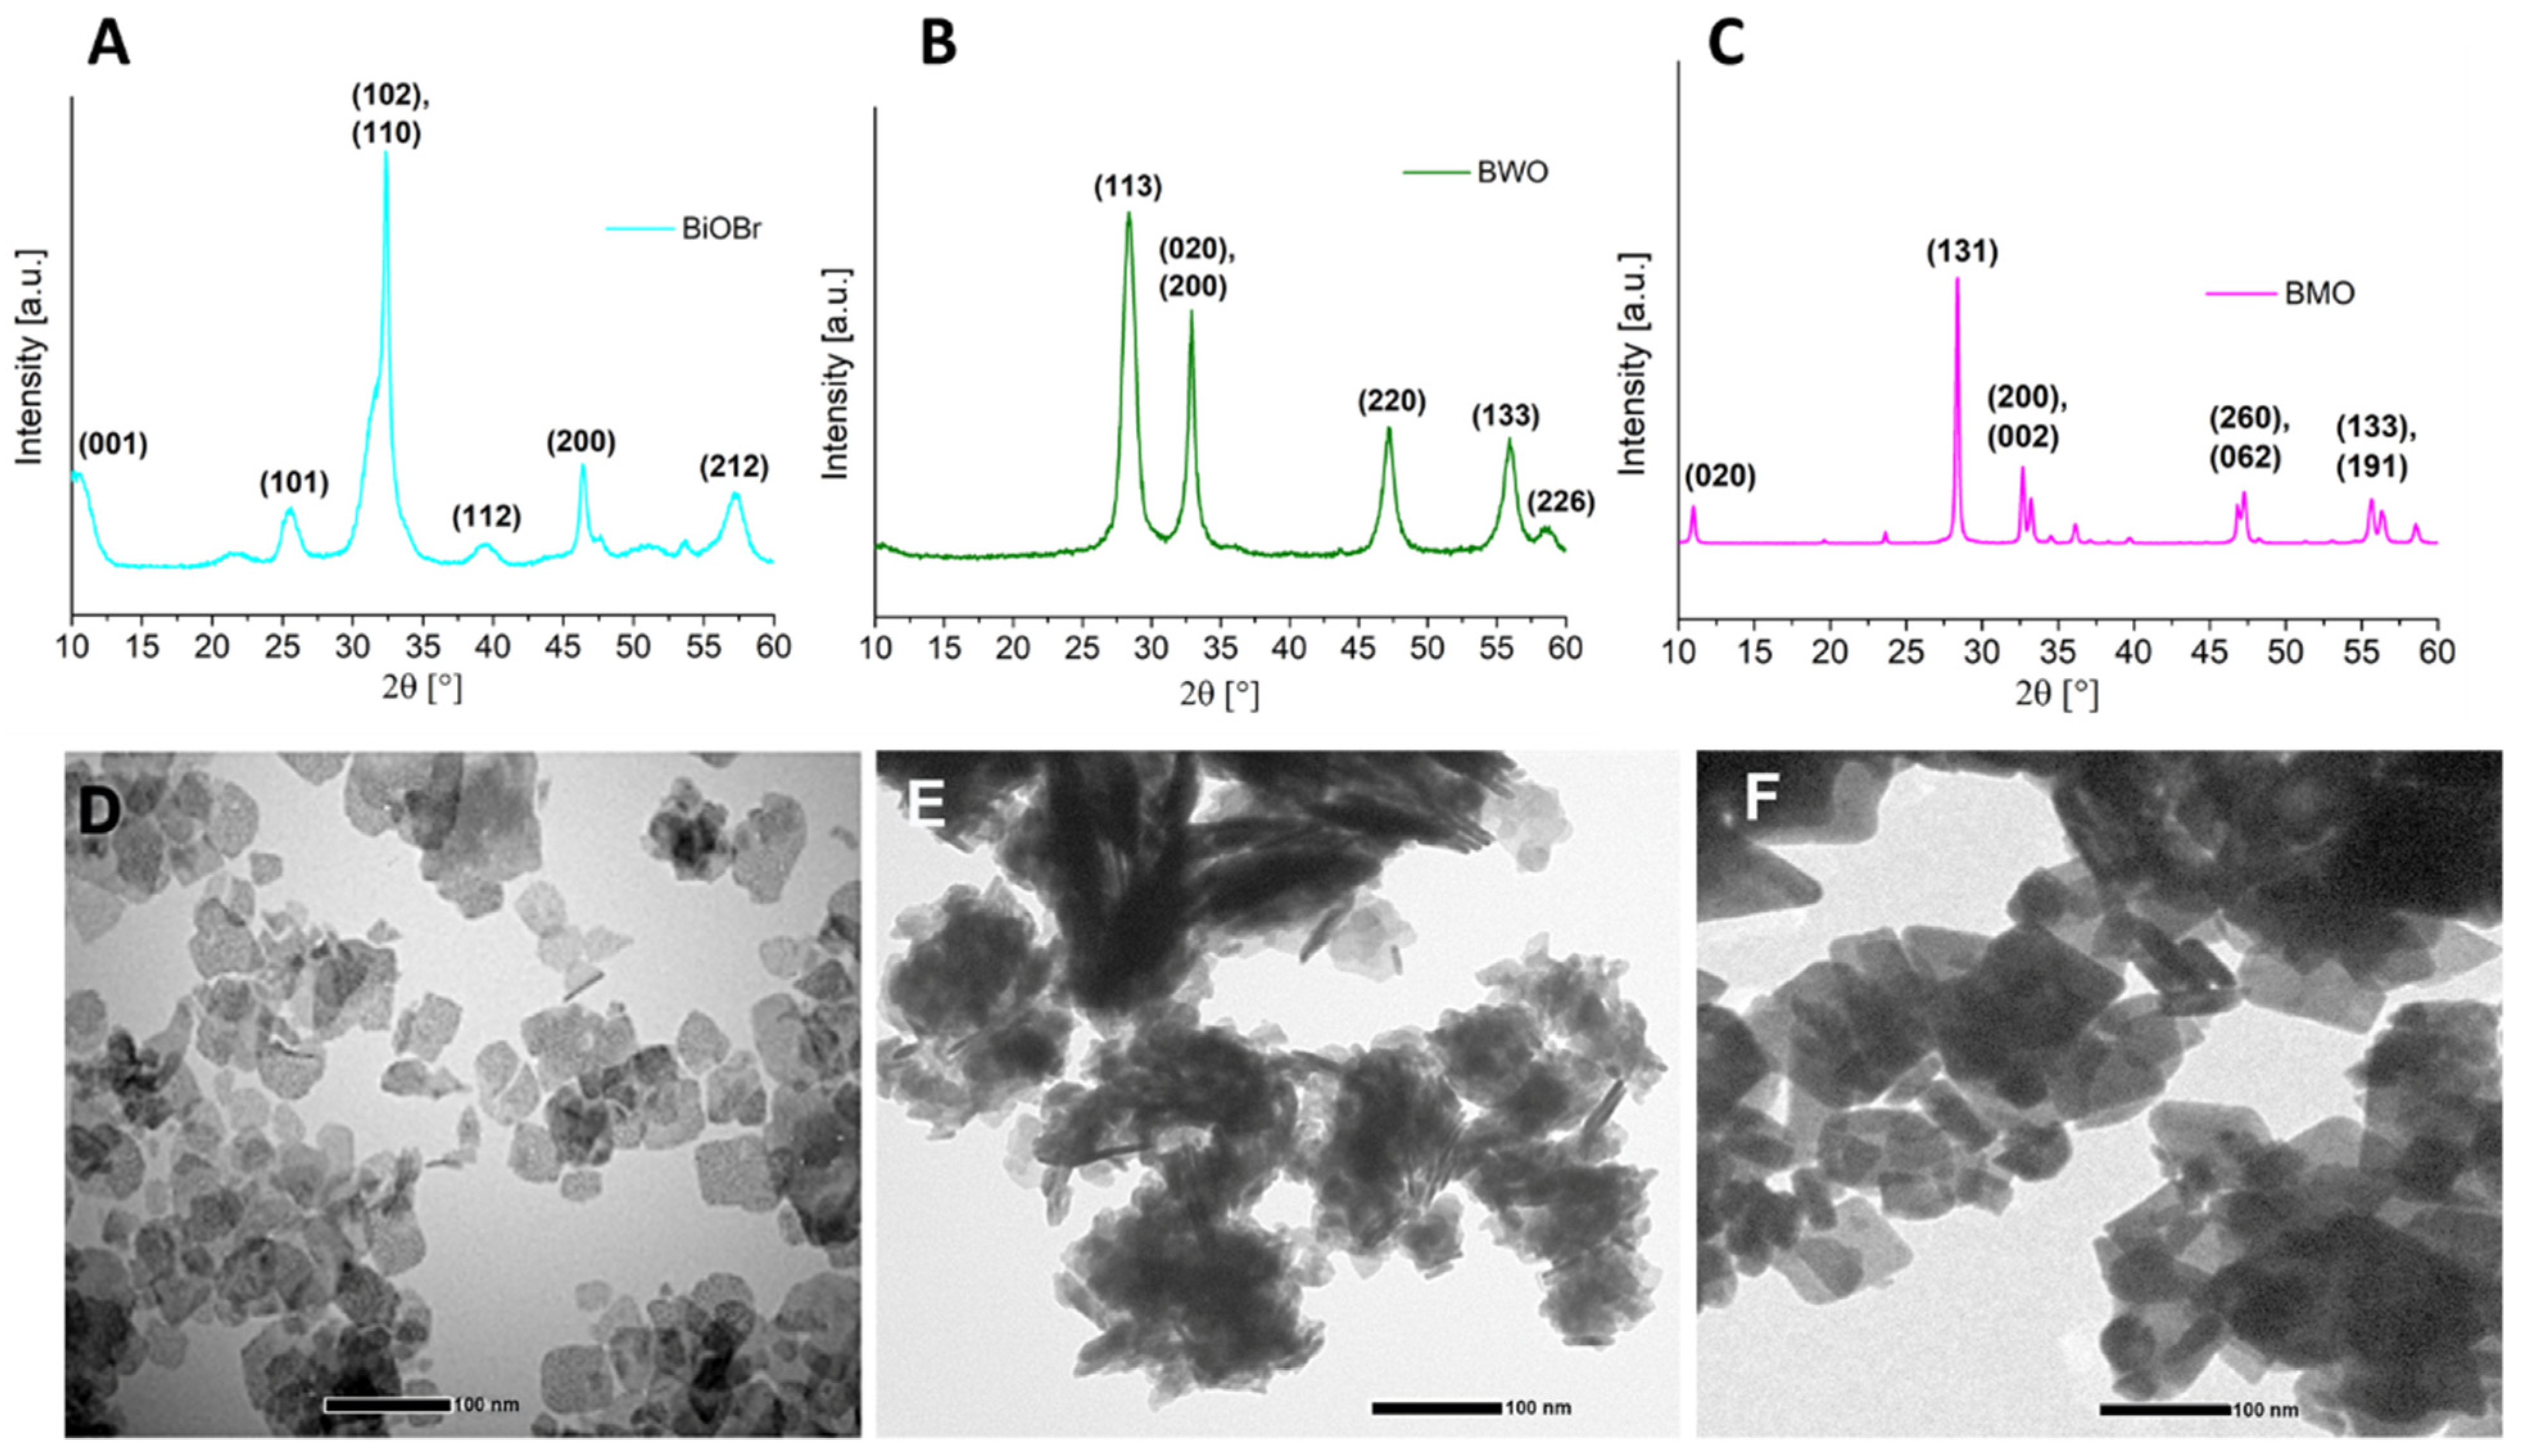
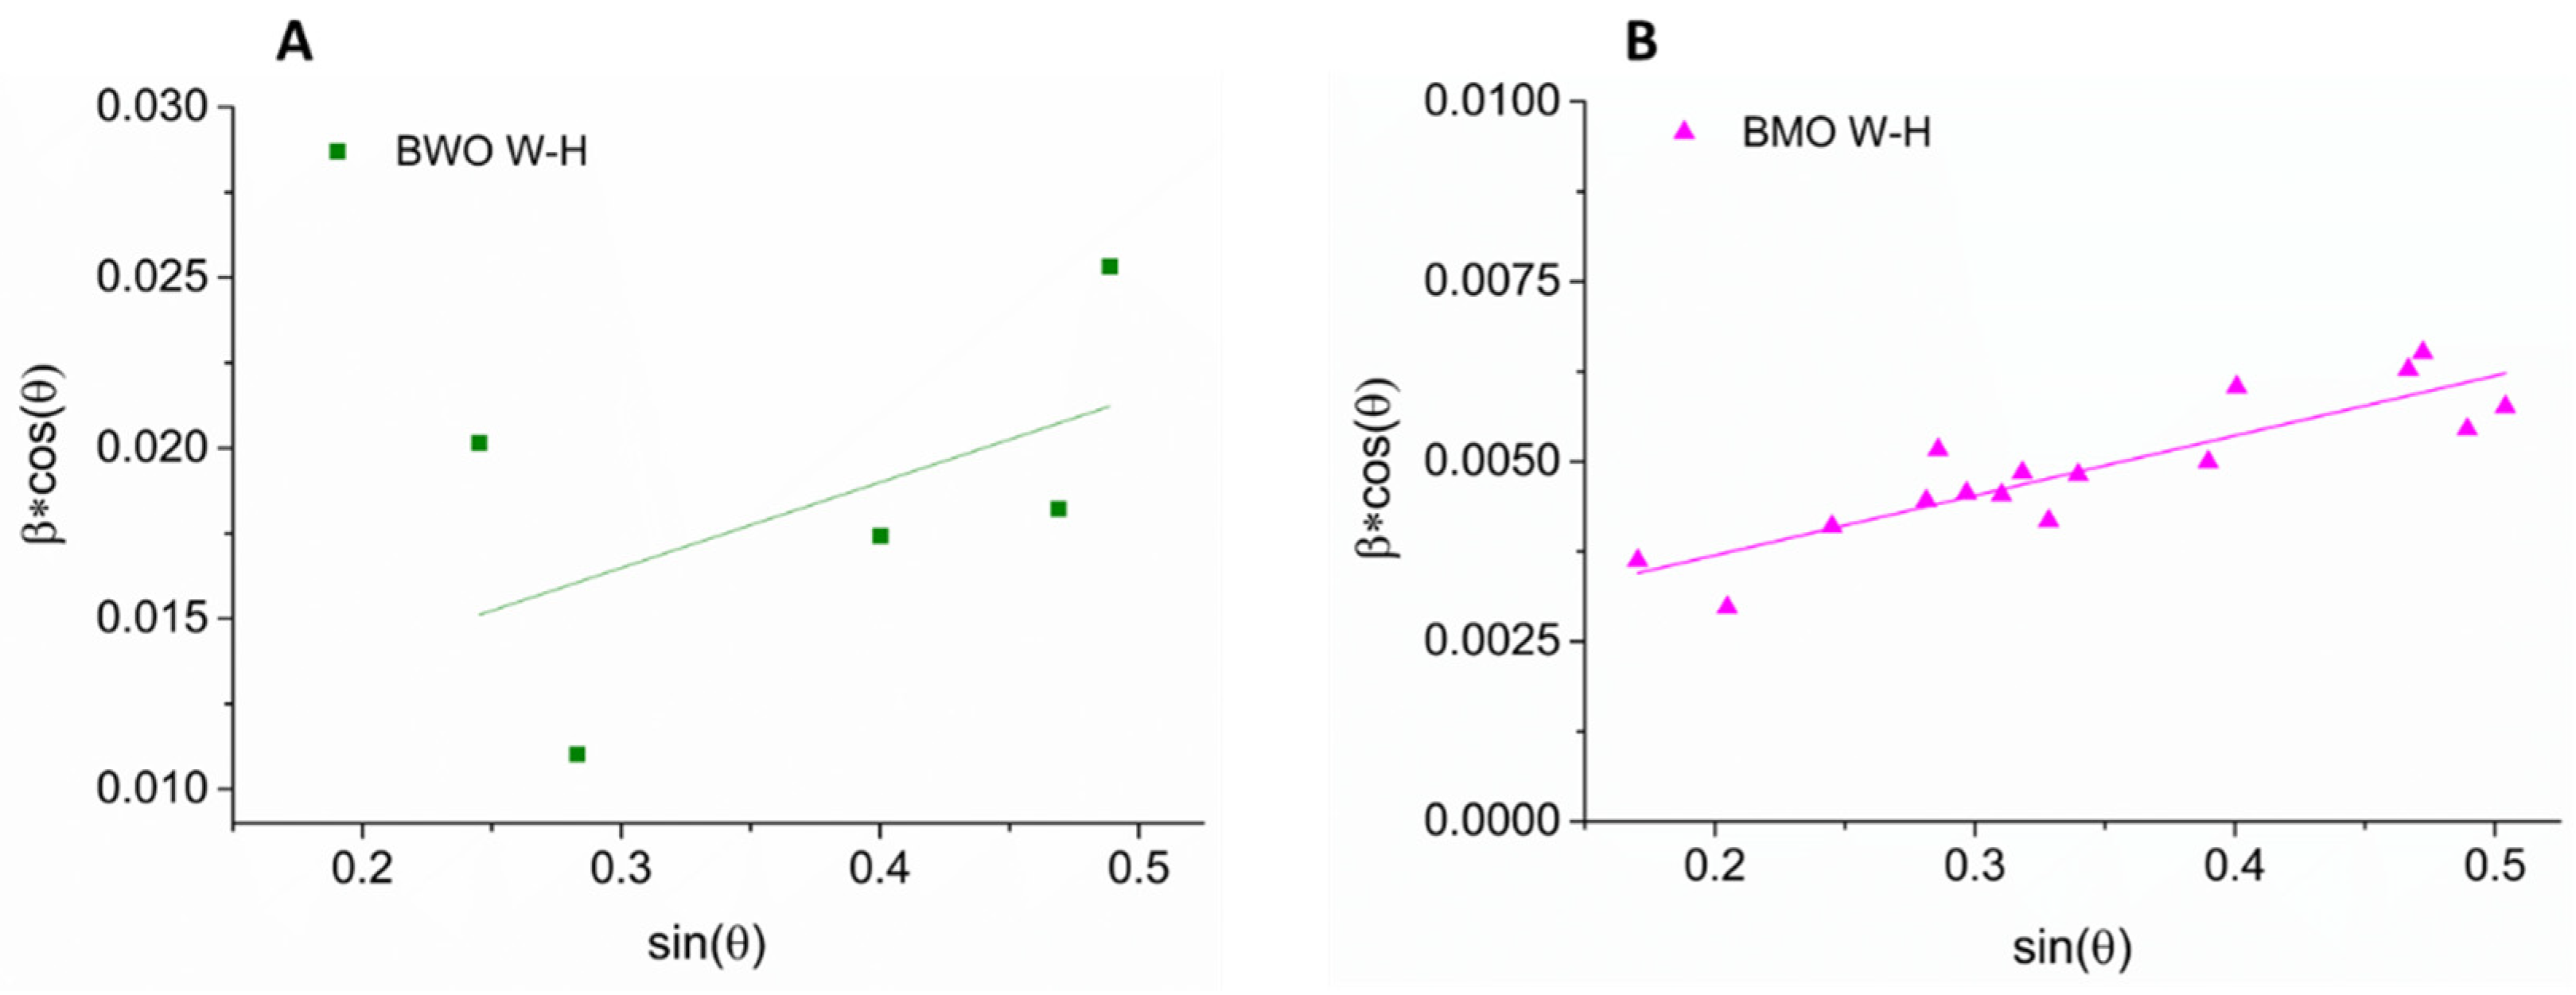
3.1.1. XRD and TEM Analysis

XRD patterns and TEM images of BiOBr, BWO, and BMO samples are shown in Figure 1. The diffractograms are consistent with those reported in the literature [49,56], and were reproducible across the different batches of synthesized materials. BMO samples show a clear increase in peak sharpness and resolution as a result of the hydrothermal treatment (Figure S1A), reaching the best resolved XRD pattern in the sample kept for 24 h in autoclave (BMO). Table 1 reports the mean dimensions of crystallites (<DXRD>) calculated through the Scherrer equation [57] with a Warren correction [58]. Table S2 highlights the positions of the peaks used for crystallite size calculation through Scherrer theory. Because many peaks tend to overlap, these positions can change for the different materials. BWO nanosheets showed a mean lateral dimension of 11 nm which was comparable with that of the BiOBr precursor (14 nm) (Figure S1). The mean crystallite size of BMO samples increased due to the hydrothermal treatment, being 11 nm, 25 nm, and 60 nm for BMO-0, BMO-3, and BMO, respectively. Crystallites size determined by Scherrer method was compared with Williamson–Hall (W-H) analysis [59].
The following form of the W-H equation was used:
β · c o s ( θ ) = ( k · λ d ) + ( η · s i n ( θ ) )
where β is the full width at half height of the peak, d the average crystallite size (nm), λ the wavelength of Cu k α radiation (1.54056 Å), θ the Bragg angle (degrees), and k is a dimensionless shape factor, typically assumed to be 0.9 [60]. η considers the internal strain broadening. Notably, when η = 0 , the Scherrer equation is obtained. The experimental XRD peaks were fitted to obtain β . Angle was expressed in θ degrees. c o s ( θ ) and s i n ( θ ) were calculated, and β · c o s ( θ ) was plotted against s i n ( θ ) . A lattice dilatation ( η > 0) is present for BWO and BMO (Figure 2) while BiOBr shows a compressive strain ( η < 0) and a poor adherence to liner fit (Figure S3). d values were slightly lower than those calculated with Scherrer equation (25 and 48 nm for BWO and BMO respectively). d was not computable for BiOBr. BMO shows the best convergence to a linear fit (Figure 2B) suggesting a higher crystallinity than BWO likely due to longer time in the autoclave.
Table 1. Mean dimensions of crystallites (<DXRD>) are calculated from full width at half maximum (FWHM) of X-ray diffraction peaks a of BiOBr and BWO.
SampleAutoclave Time (h)DXRD (nm) a
BiOBr314
BWO111
BMO-0011
BMO-3325
BMO2460
a Scherrer equation: D X R D = ( K · λ ) / ( F W H M · c o s ( θ ) ) . Pure Al2O3 powder is used as external standard. Warren correction [58] through the external standard method, F W H M s a m p l e = F W H M e x p 2 + F W H M s t d 2 where, FWHM is full width at half maximum with subscripts indicating sample signal (SAMPLE), experimentally obtained signal (EXP), and external standard signal (STD), respectively.
A TEM image of the BiOBr precursor (Figure 1D) shows nanosheets (NS) having irregular shapes which are almost transparent to the electron beam, suggesting an atomic-scale thickness. The lateral dimension of BiOBr NS is around 50–80 nm in agreement with the literature, although an even wider range, between 30 and 160 nm, is also reported [56]. The morphology of BWO NS was like that of BiOBr with a very tight range of dimensions (between 40 and 60 nm, Figure 1E). The BMO sample showed a sharper square morphology with NS generally of larger size than BiOBr and BWO samples (Figure 1F).

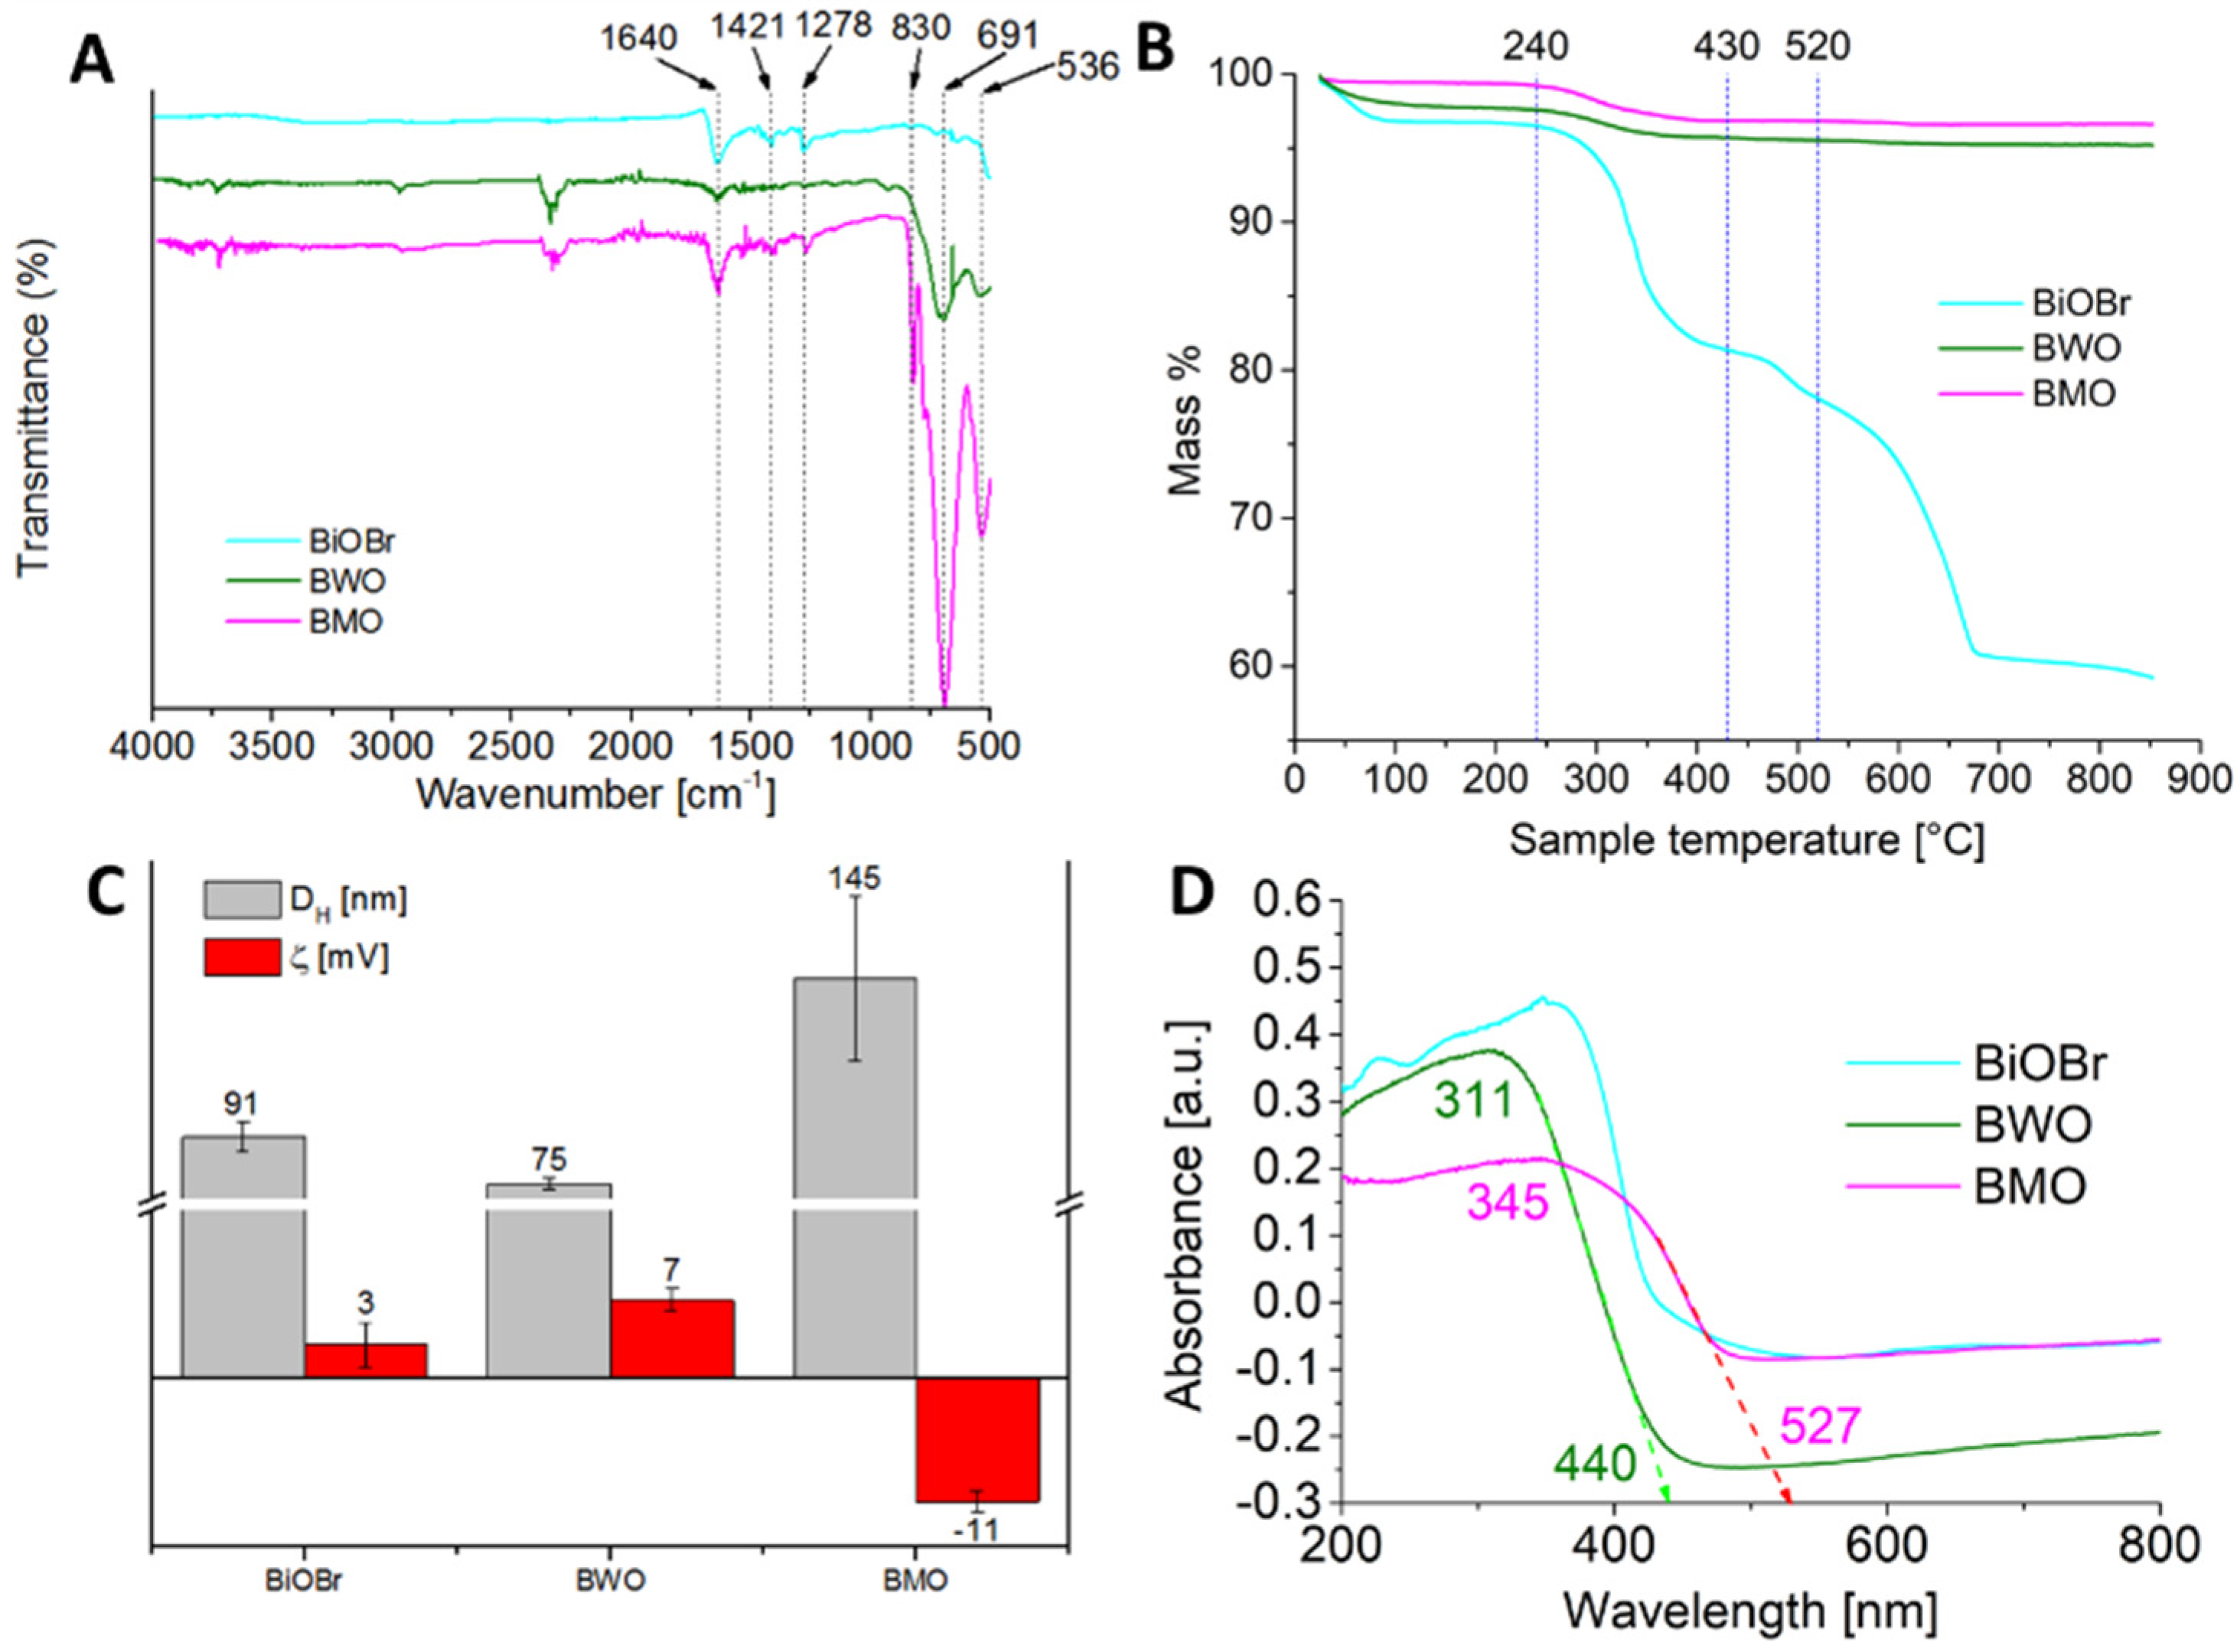
3.1.2. FTIR Spectroscopy

The FTIR spectrum of the BiOBr precursor (Figure 2A) displays characteristic bands at 536 cm−1, 691 cm−1 corresponding to Bi-O stretching vibrations, 830 cm−1 (typical of tetrahedral MO4 vibrations as in VO4), 1278 cm−1, and 1421 cm−1 corresponding to Bi-Br [61]. Figure 2A also shows the FTIR spectra of BWO and BMO. Signals in the 400–1000 cm−1 region are attributed to the pseudo-perovskite layer of the Aurivillius phases (Mo-O stretching, Mo-O-Mo bridging stretching vibrations [62]). In particular, the peak at 691 cm−1 is due to the asymmetric vibration of apical oxygens in MoO6 octahedra in the BMO sample [62]. The peaks at 830 cm−1 and 1421 cm−1 can be related to W-O stretching and W-O-W bridging vibrations in BWO [63]. The disappearance of Bi-Br bands at 1278 cm−1 and 1421 cm−1 in both the BWO and BMO spectra demonstrates that the ion exchange process, in favor of WO4 or MoO4, took place. On the contrary, bands around 536 cm−1 and 691 cm−1, after the reaction on BiOBr were more intense, especially for BMO.

3.1.3. TGA

Thermogravimetric analysis (TGA) of BiOBr, BWO, and BMO samples was then carried out (Figure 3B). Three main mass losses occur in the BiOBr TGA and DSC plots as detailed in supporting information (Figures S4A and S5C). BiOBr mass losses are 15%, 3.5%, and 17.5% in the temperature range of 240–430 °C, 430–520 °C, and 520–850 °C, respectively. The first loss can be attributed to decomposition of bismuth oxybromide into bismuth oxide and bromine. Decomposition of residual bismuth nitrate, forming NO2 and O2, is attributable to the second weight loss. The third mass loss at T > 520 °C is likely due to decomposition and phase transition of the bismuth oxides. A very small mass loss (2.5%) in the range 240–430 °C is observed for BWO/BMO. No further decomposition or phase change takes place for T > 430 °C.
In the case of BMO, an analogous small weight loss of 2.5% is observed in the same temperature range. Interestingly, the other two samples with no (BMO-0) or a short (3 h in BMO-3) hydrothermal treatment showed higher mass losses (8% and 7%, respectively) in the range 240–700 °C (Figure S1B), suggesting a higher degree of impurities likely due to residues of either BiOBr or Bi(NO3)3 (Figure S5B) [64,65].

3.1.4. DLS and ELS Analysis

DLS and ELS measurements of aqueous dispersions of BiOBr, BMO, and BWO NSs are shown in Figure 3C. DLS and ELS measurements for BMO-0 and BMO-3 are shown in Figure S4B. No buffer or salts were added. All dispersions were around 2 mg/L of concentration, had a pH of approximately 6.8 ± 0.3, and were stable for about 2–3 h. The BiOBr precursor NS had a hydrodynamic size like those of BWO. More precisely, BWO NSs are slightly smaller (75 ± 2 nm) than those of BiOBr (91 ± 5 nm). Zeta potentials are low in absolute value (+3 mV for BiOBr and +7 mV for BWO), leading to unstable colloidal dispersions. BMO showed the highest hydrodynamic radius (145 ± 28 nm) with a negative zeta potential (−11 mV). According to the Stokes–Einstein equation, the hydrodynamic size is the diameter of a hypothetical rigid sphere which diffuses with the same diffusion coefficient of actual samples. Hence, for geometrical reasons (they are nanosheets and not spheres), it is only an indicative size of BiOBr, BWO, and BMO samples once dispersed in water.

3.1.5. DRS Analysis

Figure 3D and Figure S4C show the results of diffuse reflectance spectroscopy (DRS). BiOBr and BMO have an absorbance peak at about 355 nm, although the former shows non zero absorbance in the visible region [66,67,68].
The absorption peak of BWO is blue-shifted to 312 nm, that is shifted deeper into the mid-UV. Less visible light is absorbed, as the tail rapidly decays, reaching almost zero at 480 nm [69].The presence of negative absorbance values can be linked to the intrinsically low repeatability of powdery sample positioning inside the sample holder of the instrument. The global interpretation of DRS data requires caution. When considering the complete photocatalytic system (e.g., the photocatalyst dispersed in an aqueous dye solution), absorption can either shift further into the UV or more toward the visible region of the electromagnetic spectrum. Indeed, complex phenomena of sensitization and energy transfer can, in principle, take place [29]. The absorption edge wavelength for BWO was estimated to be 440 nm, and 527 nm for BMO (Figure 3D). To better determine the band gap potential (Eg) of our materials, Tauc plots for BMO and BWO were created, by plotting ( α · h · ν ) 2 versus h · ν in eV, which represents the photon energy (Figure S6) where α represents here the absorption coefficient of the material, h is Planck’s constant and ν is the frequency of the radiation [70,71]. The equation assumes a direct allowed electronic transition. Fitting the linear part of the Tauc plot with a straight line, the intercept on the x-axis represents the band gap energy Eg. BWO gave a calculated Eg of 3.26 eV, BMO had Eg of 3.27 eV [72].
The electronegativity of elements (Bi, Mo, W, O) contained in our photocatalysts was calculated by arithmetical averaging between their electron affinity and energy of first ionization (in eV). These electronegativity values, calculated as per Mulliken theory [73], were then used to calculate the electronegativity of BWO and BMO. These values were obtained by geometrical averaging between the constituent elements, resulting in 6.21 eV and 6.13 eV for BWO and BMO, respectively. Then, Equation (2) was applied.
E V B = X E e + E g 2
where X represents the Mulliken electronegativity, calculated as explained above; EVB is the potential of the valence band, Ee is the absolute potential of the hydrogen standard electrode (SHE), which is estimated to be 4.2 eV [74], and Eg represents band gap in eV. The calculation gave 3.34 eV and 3.26 eV of EVB for BWO and BMO respectively. The difference between the valence band potential and the band gap permits estimation of ECB, conduction band potential (in eV), as in Equation (3). The conduction band potentials ECB obtained were 0.08 eV and −0.01 eV for BWO and BMO.
E C B = E V B E g
Figure S7 shows two hypothetical schematics for photocatalytic production of the hydroxyl radical.
E0 = 2.40 eV is the electrochemical potential for the redox couple H2O/OH, and E0 = −0.18 eV for the O2/O2- couple, which is related to the electrochemical synthesis of superoxide anion [75]. Because the potential of VB is more positive than E0(H2O/OH), the hydroxyl radical is produced in the system (formally, water reacts with a hole h+). The potential of the CB should be more negative than E0(O2/O2), but this is not the case, as BWO has E0(CB) = 0.08 eV and BMO has E0(CB) = −0.01 eV. This indicates that superoxide is likely not produced in appreciable amounts. The hydroxyl radicals produced upon irradiation are well-known to cause MG degradation, representing in fact a common reaction pathway. Depending on the specific degradation products, MG could react with the electrons accumulated in the CB, as already previously found [76,77].

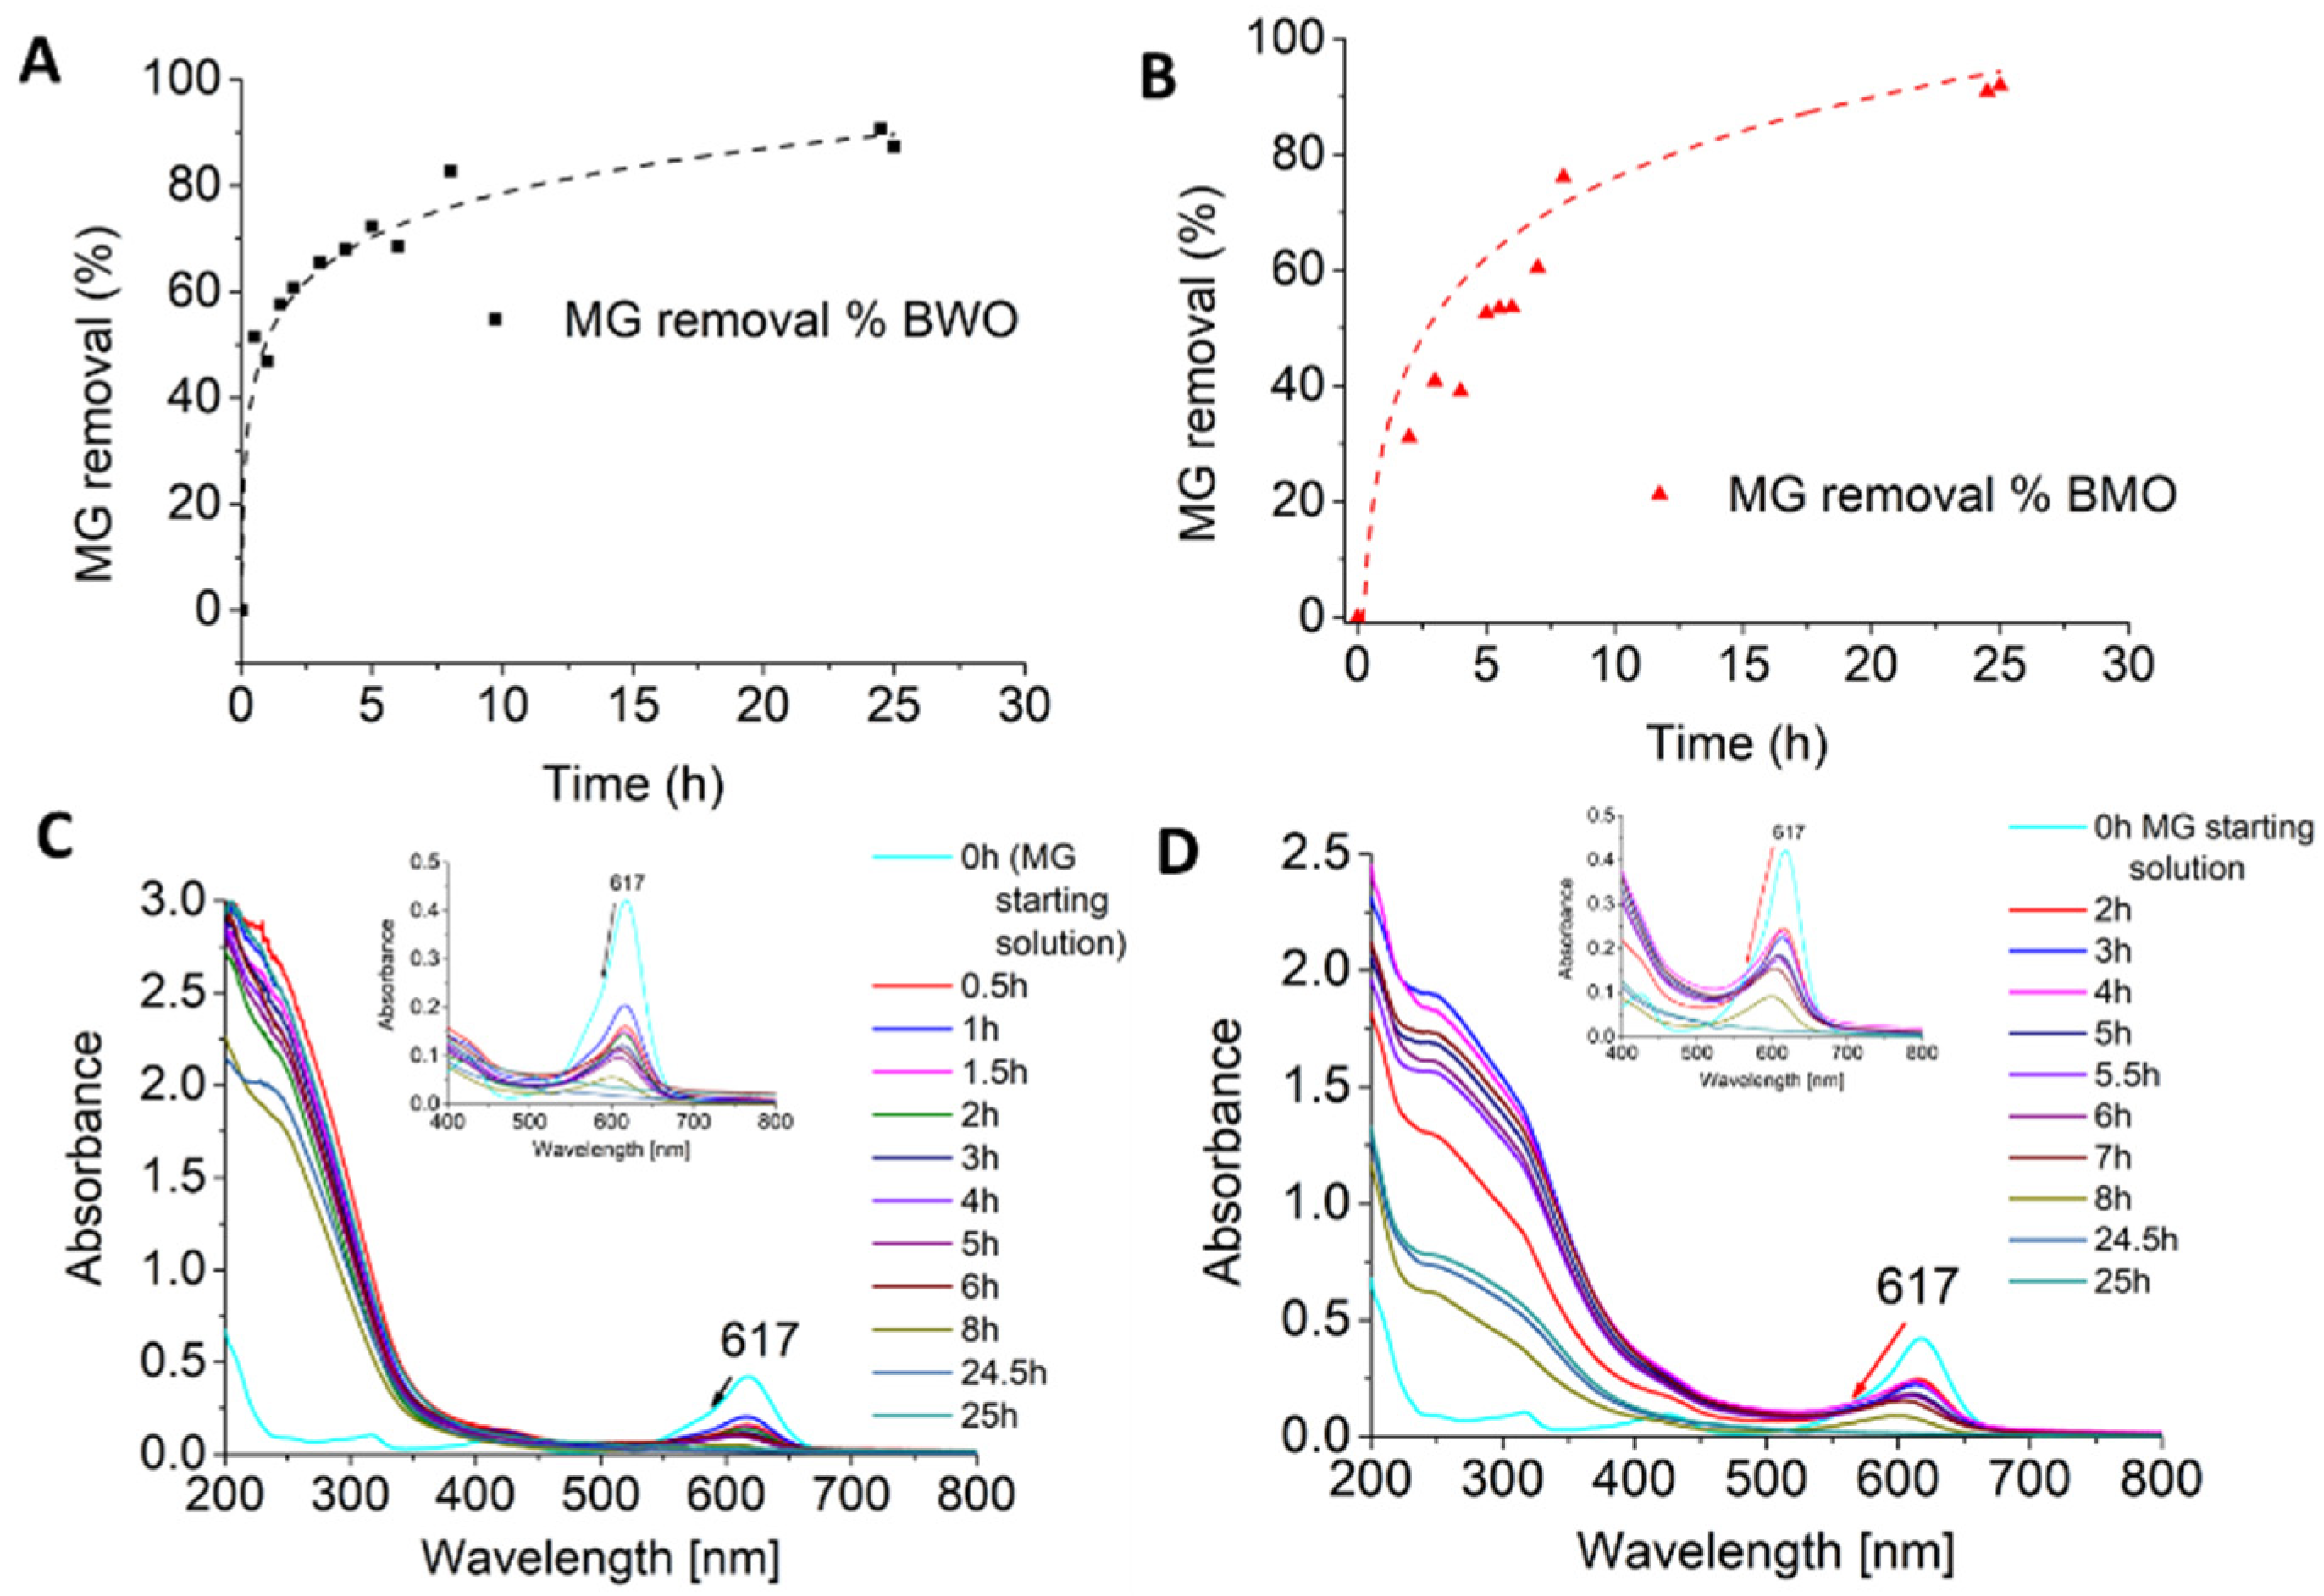
3.2. Photocatalytic Removal of Malachite Green from Aqueous Solutions

Photocatalysts need to be considered in relation with their real applications [78,79]. To test the above characterized samples for environmental remediation, photocatalytic tests on BMO and BWO were carried out to evaluate the degradation of an organic pollutant, the dye malachite green (MG). UV-Vis spectroscopy was used to quantify the photocatalyzed degradation of MG, calculated by means of Equation (S1) [80].

3.2.1. Kinetic Analysis

A kinetic study with BWO and BMO was performed to determine MG concentration in solution as a function of time (Figure 4). The points in Figure 4A,B were fitted with an arbitrary curve as visual guidance. It can be seen how BWO has a different behavior compared to BMO. The former starts with a fast removal rate, with a MG removal up to 89% after 24 h. The latter, even with a slower removal rate, reaches slightly higher overall percentage (91%) at 24 h. Both photocatalysts achieved maximum MG degradation after 24 h. BWO and BMO spectra (Figure 4C,D) show a decrease of the absorbance at 617 nm together with a peak shift toward lower wavelengths.
The blue-shift of the peak at 617 nm is particularly evident for BMO samples (Figure 4D) and suggests cleavage of the chromophore. BWO showed a bigger area under the spectra at low wavelengths (200–400 nm) when compared with BMO (well visible after 25 h of irradiation) proving a higher degree of MG degradation in the solution containing BMO [76]. MG degradation generally involves demethylation and breakdown by generating degradation products such as benzophenone derivatives [17,22,76,81]. Because of health and environmental hazards caused by chemicals such as benzophenone derivatives [82], a high degree of decomposition is always desirable. Langmuir–Hinshelwood model usually describes the kinetic expression of a two-phase heterogeneous catalytic process at the catalyst surface [83,84,85,86,87] according to Equation (4):
r = k 0 K C 1 + K C
where C is the compound concentration, k0 the reaction rate constant, and K the adsorption coefficient of the organic compound on the catalyst. When KC is <<1, Equation (4) can be simplified to a pseudo-first order kinetics model:
r = k 0 K C = k C
where k includes k0K. Kinetic data of MG for BMO and BWO were fitted according to the integrated form (with C = C0 at t = 0 and C = C at t = t) of Equation (5) (Figure S8):
l n ( C C 0 ) = k · t
where, c0 is the initial concentration of MG (mg/mL), c is the concentration of MG (mg/mL) at irradiation time t (min), and k is the kinetic constant (min−1). The kinetic constants for BWO and BMO, calculated with Equation (6), are listed in Table S4. BMO kinetic data showed a better fit (R2 = 0.95) for the model than those of BWO (R2 = 0.75). This result suggests the occurrence of a typical heterogeneous photocatalytic process for BMO [88].

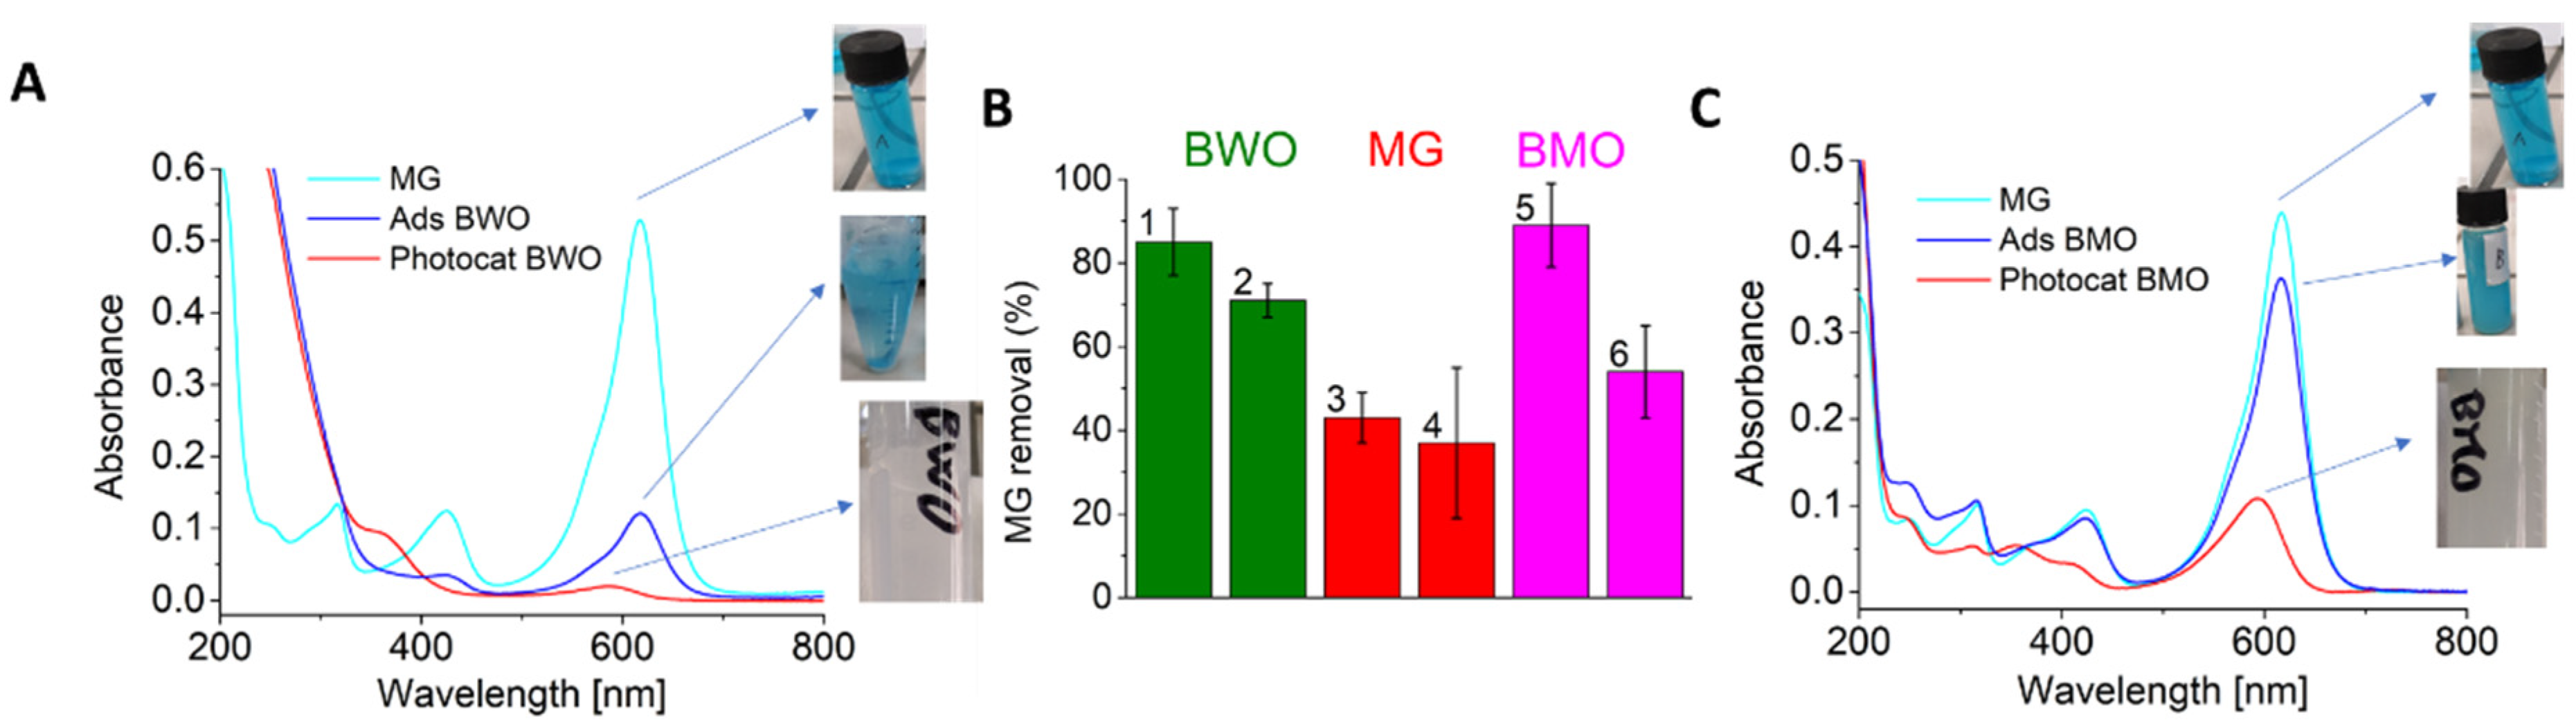
3.2.2. Photocatalytic Tests

To understand MG degradation mechanism by BWO and BMO, controlled photocatalytic tests were performed. Photocatalytic experiments were designed to fully consider all the possible phenomena that could lead to a decrease of MG concentration and to distinguish photocatalytic effects from adsorption effects. Due to the quite high value of MG dye molar extinction coefficient (ε(MG) = 1.33 × 10⁵ L mol−1cm−1), concentration was kept relatively low (6.97 mg/L) to avoid light penetration issues into the bulk solution [89,90,91,92]. Briefly, the MG aqueous solution was put in four different vials. In two of them BWO photocatalyst was added (samples 1 and 2 in Figure 5A), while no photocatalyst was added in the remaining two vials (samples 3 and 4). Samples 1 and 3 (Figure 5A) were then irradiated with visible light for 8 h, while samples 2 and 4 were kept for the same time in the dark. Sample 1, containing the dispersion of BWO in the MG solution and irradiated with visible light for 24 h, was almost fully decolored. In particular, 89 ± 5% removal of MG was obtained (Figure 5B). Sample 2, which was kept in the dark, resulted in a 51 ± 0.1% decrease of MG concentration (Figure 5A,B). This decrease is likely due to adsorption on the BWO surface rather than photocatalysis [77,93]. Moreover, sample 3 in the absence of photocatalyst shows that the uncatalyzed photodegradation of MG contributes approximately 31 ± 0.2% (Figure 5B). Finally, in the absence of both photocatalyst and light (sample 4), the aqueous dye solution resulted in a 5 ± 0.1% decrease of absorbance (Figure 5B), which suggests the spontaneous oxidation of MG. MG is known to degrade in artificial light, and even more under sunlight [22,77]. The contribution of photolysis (which takes place in sample 3) has a non-negligible effect compared to the control (sample 4). In sample 2, although dye adsorption on the NSs can be an alternative method for pollutant removal, it could also be a needed preliminary step before the photocatalytic process takes place. The higher MG removal in sample 1 compared to sample 2 is in agreement with what is reported in literature by Chen et al. [93]. In their work they found a substantial MG removal in the presence of the photocatalyst and light. In the absence of light, BWO adsorbs MG without degrading it. The simultaneous occurrence of adsorption and photocatalysis has been previously reported in various photocatalytic materials such as CeO2/CdO, guar gum/Al2O3, and Cu/ZnO [90,94,95]. The UV-Vis spectra of all the solutions involved are shown in Figure 5A, and in particular the shift of the main absorption peak of sample 1 from 617 nm to 587 nm is indicative of the transformation of the chromophore into a smaller resonant system. Possible mechanisms of MG degradation in various photocatalyzed and even bio-photocatalyzed systems have been investigated in literature [17,77,90].
A similar experimental set-up was followed for BMO photocatalyst (Figure 5B,C). Sample 3 and 4 were in common with the BWO experiment. Under 24 h visible light irradiation, BMO resulted in a MG removal of 91 ± 2%. Remarkably, Dutta et al. [30] who studied MG degradation with doped and undoped BMO nanorods photocatalysts, achieved only a 32% of MG removal with the undoped photocatalyst. In the absence of light, the same BMO sample could achieve up only to 19 ± 0.1% removal, indicating a less predominant contribution from adsorption to the overall degradation process. Analogously to BWO, for BMO (sample 5) it is also possible to observe a shift in the main absorption peak, from 617 nm to 593 nm. Again, this is considered indicative of the dye degradation [17,77,90]. BMO (with 24 h hydrothermal treatment) showed the best removal performance due to photocatalytic process achieving the highest dye degradation percentage, even with a reduced adsorption contribution. Similarly Saad et al. [89] used chitosan/Ce–ZnO composites synthesized under microwave irradiation and they achieved up to total MG degradation with a 20% of adsorption contribution. In another photocatalytic composite based on doped Co-ZnO/algae study, almost 99% of MG degradation was reached but with a very high adsorption contribution of 50% [96]. It is noteworthy that BMO-0 (no hydrothermal step) gave different photocatalytic results compared to BMO, although a high (85%) removal of MG was obtained, this is likely due to adsorption (79%) rather than photocatalysis (Table 2). The great difference in adsorption contribution between BWO and BMO can be linked to the duration of the hydrothermal steps. A 24-h high temperature residence time led to a higher crystallinity and less defectivity, which agrees with XRD data (Figure 1, Table 1). The decrease in surface defects could explain the dye’s lower affinity for BMO.

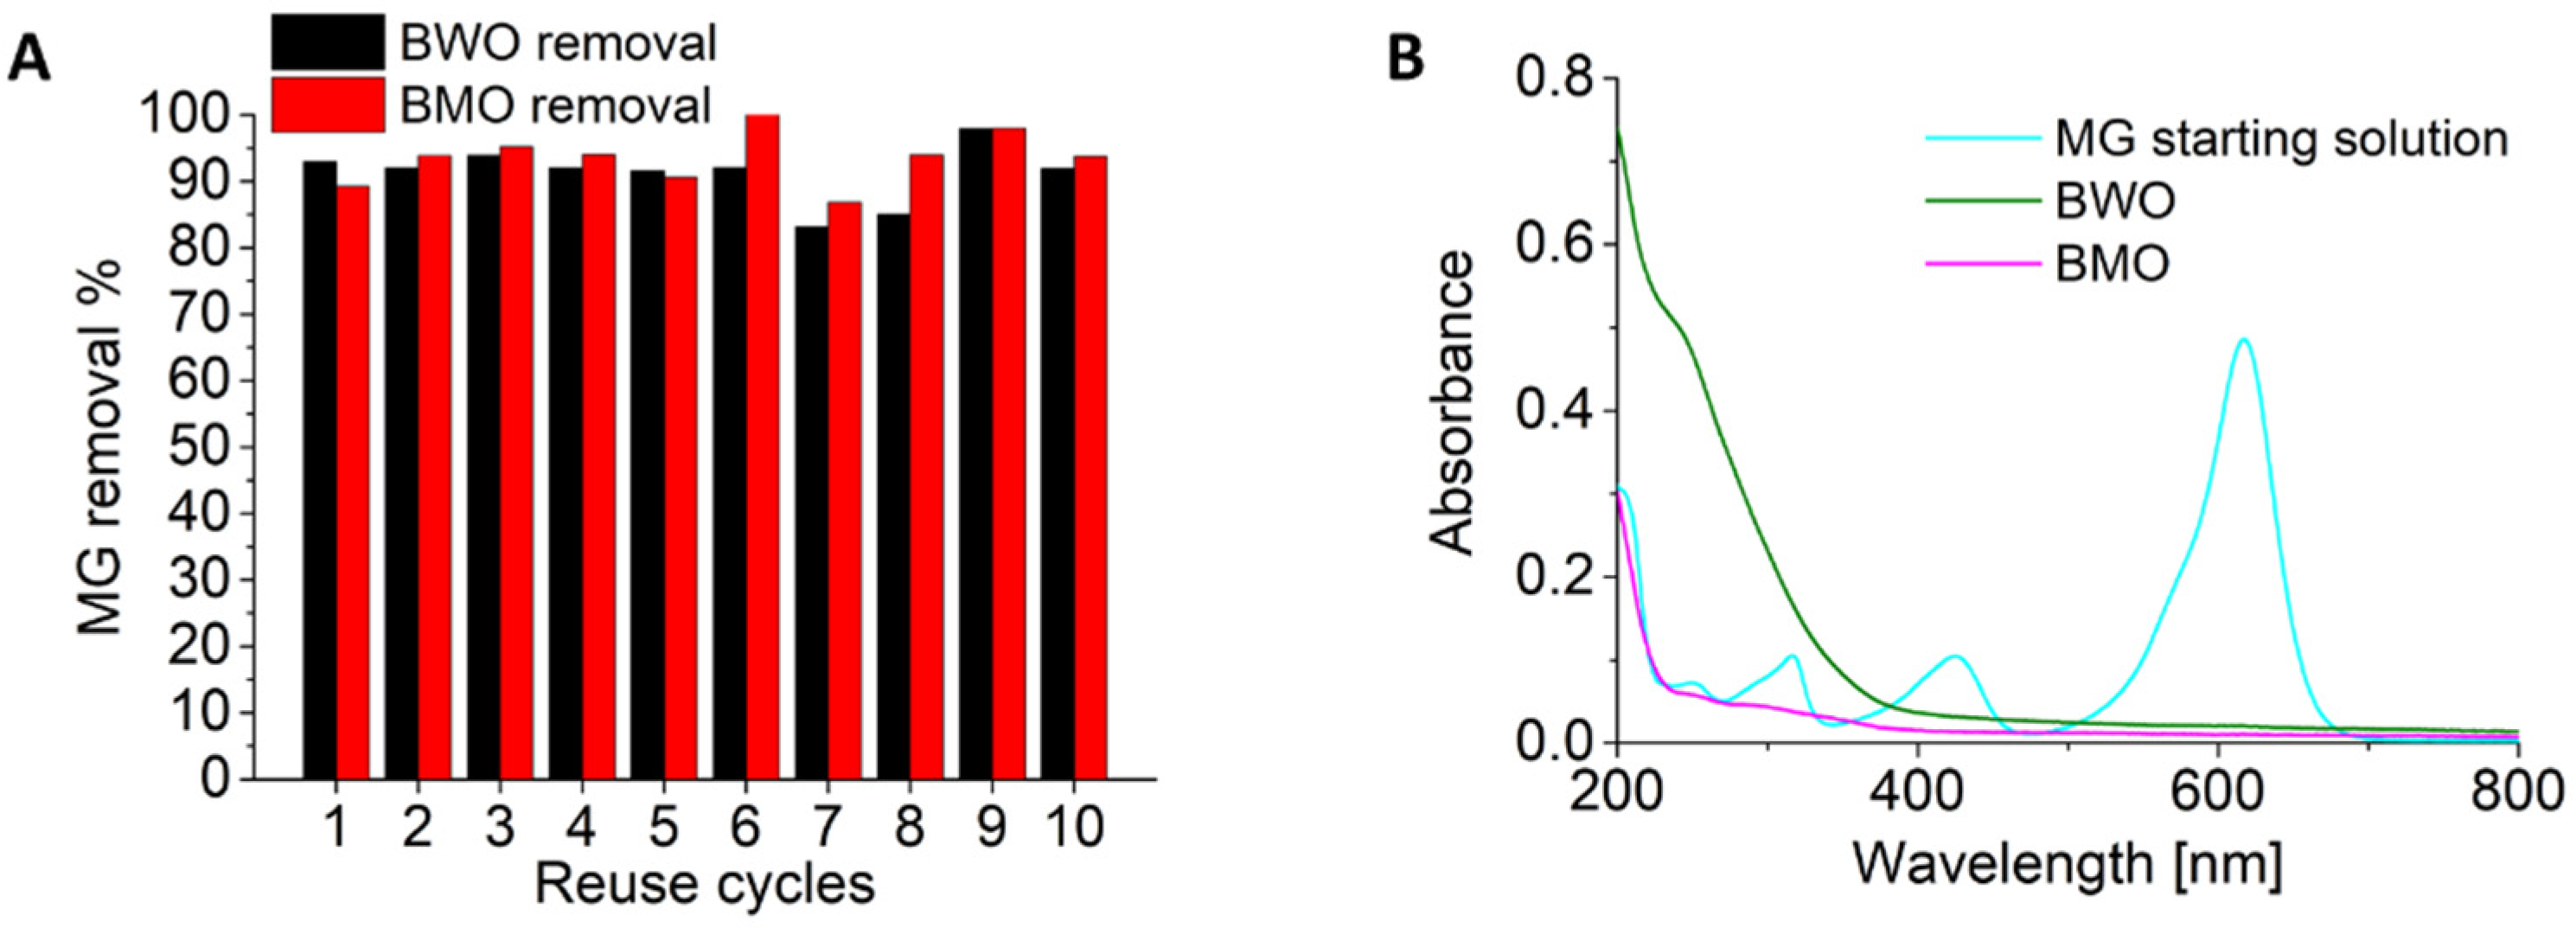
3.2.3. Reuse Measurements

To evaluate the stability of BWO and BMO over multiple cycles, a 24-h reuse experiment was performed (Figure 6). Both BWO and BMO showed extremely good recyclability and no appreciable activity loss with a remarkable MG removal percentage (up to 95%) up to 10 cycles (Figure 6A) was found. Spectra of the starting MG solution and the two supernatants of BWO and BMO photocatalysts after 24 h at cycle 8 are shown in Figure 6B. In contrast to BWO, BMO clearly showed a higher degree of MG degradation with almost no absorbance even at low wavelengths (200–400 nm) as seen in Figure 6B, consistent with kinetic spectra in Figure 4C,D. Good reuse performance for MG degradation was shown by Magdalane et al. with CeO2/CdO multilayered nanoplatelet photocatalysts. In their work they achieved up to three cycles with only a 5% activity loss when compared with the first use [90]. Reuse efficiency in MG degradation was described also by Saad et al. with chitosan-supported ZnO and Ce–ZnO nano-flowers. In their work they registered a 10% activity loss after four cycles and 16% loss after five cycles [89]. The good reuse performance, together with the high decomposition degree, emphasizes the possible use of both photocatalysts and especially of BMO for MG degradation. Compared to analogous procedures in literature, BMO NSs were synthesized from cheap reagents without the additional use of composites, maintaining a high photocatalytic performance [49,56]. The photocatalytic setup demonstrated a very interesting difference between BWO and BMO. While for BWO both photocatalysis and adsorption phenomena are at work, for BMO, dye adsorption contributes to a lower extent to the degradation process. This makes it possible to avoid a great deal of contamination, achieving excellent results as a photocatalyst rather than as an adsorbent.

4. Conclusions

Two Aurivillius oxide photocatalysts, bismuth molybdate (BMO) and bismuth tungstate (BWO) nanosheets, were synthesized starting from bismuth oxybromide (BiOBr) as the hard template [56]. All three materials were characterized to completely determine the structural and chemical features. XRD analysis showed a better resolution and sharper peaks of BMO when compared with BWO and BiOBr. Crystallite sizes estimated by XRD were around 11 nm for BiOBr and BWO, with a significant increase for BMO (up to 60 nm) likely due to the hydrothermal step. TGA analysis showed a small mass loss of 2.5% at 240–430 °C for BWO and BMO indicating a negligible presence of residual BiOBr in both samples. BMO-0 and BMO-3 with no and short hydrothermal treatment, instead, showed 7% and 8% of mass loss respectively indicating a residual contamination due to either BiOBr or Bi(NO3)3. After physico-chemical characterization, BWO and BMO nanosheets were tested for the photocatalyzed degradation of malachite green dye. MG removal kinetics data were fitted with the Langmuir—Hinshelwood model indicating the presence of photocatalytic reaction mechanism for BMO. BWO reached up to 89% of MG removal under light irradiation with a substantial contribution of surface adsorption (51%). On the other hand, BMO achieved 91% of MG removal with only 19% due to adsorption in absence of light indicating the fundamental contribution of photocatalysis rather than adsorption to the removal process. The limited occurrence of dye adsorption is likely an advantage for a photocatalyst since it could result in a surface contamination that may negatively affect the photocatalytic process. Reuse tests of photocatalysts were studied indicating very low efficiency loss up to 10 cycles. In kinetic studies and photocatalytic tests, BMO showed a higher decomposition degree than BWO, suggesting a better performance for the total degradation of organic dyes likely due to the high crystallinity degree. The new synthetic process developed for bismuth molybdate allowed obtaining a pure and efficient photocatalyst with simple synthesis and cheap reagents. Further research is desirable to determine the exact mechanisms of the dye degradation reaction and the influence of synthesis conditions such as the hydrothermal step on the photocatalyst performance.

Supplementary Materials

The following supporting information can be downloaded at: https://0-www-mdpi-com.brum.beds.ac.uk/article/10.3390/ijms23105422/s1.

Author Contributions

D.A.C.: conceptualization, methodology, formal analysis, validation, investigation, data curation, writing—original draft, writing—review and editing; C.C.: investigation, data curation, writing—original draft, writing—review and editing, visualization; M.P.: investigation, resources; D.F.P.: writing—review and editing, supervision; A.S.: data curation, writing—original draft, writing—review and editing, supervision, funding acquisition. All authors have read and agreed to the published version of the manuscript.

Funding

Financial supports from FDS (FdS, F72F20000230007) and Regione Sardegna L.R. 7 (CUP: J81G17000150002 and CRP: RASSR79857) are gratefully acknowledged. CC gratefully acknowledges MIUR (PON-AIM Azione I.2–DD n. 407-27.02.2018, AIM1890410-2).

Institutional Review Board Statement

Not applicable.

Informed Consent Statement

Not applicable.

Data Availability Statement

The data presented in this study are available in the article and in supporting information.

Acknowledgments

We acknowledge the instrumentation centre CeSAR (Centro Servizi di Ateneo per la Ricerca) of the University of Cagliari, Italy, for access to a JEM 1400 Plus TEM microscope.

Conflicts of Interest

The authors declare no conflict of interest. The funders had no role in the design of the study; in the collection, analyses, or interpretation of data; in the writing of the manuscript, or in the decision to publish the results.

References

  1. Zamora-Ledezma, C.; Negrete-Bolagay, D.; Figueroa, F.; Zamora-Ledezma, E.; Ni, M.; Alexis, F.; Guerrero, V.H. Heavy Metal Water Pollution: A Fresh Look about Hazards, Novel and Conventional Remediation Methods. Environ. Technol. Innov. 2021, 22, 101504. [Google Scholar] [CrossRef]
  2. Makowska, M.; Sowinska, A. Characteristics of Organic Pollutants in Wastewater from Individual Treatment Systems. Desalin. Water Treat. 2020, 206, 22–26. [Google Scholar] [CrossRef]
  3. Frisbie, S.H.; Mitchell, E.J.; Sarkar, B. Urgent Need to Reevaluate the Latest World Health Organization Guidelines for Toxic Inorganic Substances in Drinking Water. Environ. Health 2015, 14, 63. [Google Scholar] [CrossRef] [PubMed] [Green Version]
  4. Lachowicz, J.I.; Delpiano, G.R.; Zanda, D.; Piludu, M.; Sanjust, E.; Monduzzi, M.; Salis, A. Adsorption of Cu2+ and Zn2+ on SBA-15 Mesoporous Silica Functionalized with Triethylenetetramine Chelating Agent. J. Environ. Chem. Eng. 2019, 7, 103205. [Google Scholar] [CrossRef]
  5. Singh, J.; Yadav, P.; Pal, A.K.; Mishra, V. Water Pollutants: Origin and Status. In Sensors in Water Pollutants Monitoring: Role of Material; Springer: Singapore, 2020; pp. 5–20. [Google Scholar] [CrossRef]
  6. Nosuhi, M.; Nezamzadeh-Ejhieh, A. An Indirect Application Aspect of Zeolite Modified Electrodes for Voltammetric Determination of Iodate; Elsevier: Amsterdam, The Netherlands, 2018; Volume 810, ISBN 3153292515. [Google Scholar]
  7. Tamiji, T.; Nezamzadeh-Ejhieh, A. A Comprehensive Study on the Kinetic Aspects and Experimental Design for the Voltammetric Response of a Sn(IV)-Clinoptilolite Carbon Paste Electrode towards Hg(II). J. Electroanal. Chem. 2018, 829, 95–105. [Google Scholar] [CrossRef]
  8. Sacara, A.M.; Pitzalis, F.; Salis, A.; Turdean, G.L.; Muresan, L.M. Glassy Carbon Electrodes Modified with Ordered Mesoporous Silica for the Electrochemical Detection of Cadmium Ions. ACS Omega 2019, 4, 1410–1415. [Google Scholar] [CrossRef]
  9. Ahlström, L.-H.; Sparr Eskilsson, C.; Björklund, E. Determination of Banned Azo Dyes in Consumer Goods. TrAC Trends Anal. Chem. 2005, 24, 49–56. [Google Scholar] [CrossRef]
  10. Krishna Moorthy, A.; Govindarajan Rathi, B.; Shukla, S.P.; Kumar, K.; Shree Bharti, V. Acute Toxicity of Textile Dye Methylene Blue on Growth and Metabolism of Selected Freshwater Microalgae. Environ. Toxicol. Pharmacol. 2021, 82, 103552. [Google Scholar] [CrossRef]
  11. Deniz, F. An Economical and Effective Alternative to Commercial Activated Carbon for Treatment of Synthetic Dye Pollution in Aquatic Environment: Surfactant Modified Waste Product of Zostera Marina. Int. J. Phytoremediat. 2021, 23, 530–538. [Google Scholar] [CrossRef]
  12. Ismail, M.; Akhtar, K.; Khan, M.I.; Kamal, T.; Khan, M.A.; Asiri, M.A.; Seo, J.; Khan, S.B. Pollution, Toxicity and Carcinogenicity of Organic Dyes and Their Catalytic Bio-Remediation Pollution, Toxicity and Carcinogenicity of Organic Dyes and Their Catalytic Bio-Remediation. Curr. Pharm. Des. 2019, 25, 3645–3663. [Google Scholar] [CrossRef]
  13. Senobari, S.; Nezamzadeh-Ejhieh, A. A Comprehensive Study on the Photocatalytic Activity of Coupled Copper Oxide-Cadmium Sulfide Nanoparticles. Spectrochim. Acta Part A Mol. Biomol. Spectrosc. 2018, 196, 334–343. [Google Scholar] [CrossRef] [PubMed]
  14. Delpiano, G.R.; Tocco, D.; Medda, L.; Magner, E.; Salis, A. Adsorption of Malachite Green and Alizarin Red S Dyes Using Fe-BTC Metal Organic Framework as Adsorbent. Int. J. Mol. Sci. 2021, 22, 788. [Google Scholar] [CrossRef] [PubMed]
  15. Łuba, M.; Mikołajczyk, T.; Pierożyński, B.; Smoczyński, L.; Wojtacha, P.; Kuczyński, M. Electrochemical Degradation of Industrial Dyes in Wastewater through the Dissolution of Aluminum Sacrificial Anode of Cu/Al Macro-Corrosion Galvanic Cell. Molecules 2020, 25, 4108. [Google Scholar] [CrossRef] [PubMed]
  16. Seid, L.; Lakhdari, D.; Berkani, M.; Belgherbi, O.; Chouder, D.; Vasseghian, Y.; Lakhdari, N. High-Efficiency Electrochemical Degradation of Phenol in Aqueous Solutions Using Ni-PPy and Cu-PPy Composite Materials. J. Hazard. Mater. 2022, 423, 126986. [Google Scholar] [CrossRef] [PubMed]
  17. Chen, C.H.; Chang, C.F.; Liu, S.M. Partial Degradation Mechanisms of Malachite Green and Methyl Violet B by Shewanella Decolorationis NTOU1 under Anaerobic Conditions. J. Hazard. Mater. 2010, 177, 281–289. [Google Scholar] [CrossRef] [PubMed]
  18. Srivastava, S.; Sinha, R.; Roy, D. Toxicological Effects of Malachite Green. Aquat. Toxicol. 2004, 66, 319–329. [Google Scholar] [CrossRef]
  19. Crini, G.; Peindy, H.N.; Gimbert, F.; Robert, C. Removal of C.I. Basic Green 4 (Malachite Green) from Aqueous Solutions by Adsorption Using Cyclodextrin-Based Adsorbent: Kinetic and Equilibrium Studies. Sep. Purif. Technol. 2007, 53, 97–110. [Google Scholar] [CrossRef]
  20. Renita, A.A.; Vardhan, K.H.; Kumar, P.S.; Ngueagni, P.T.; Abilarasu, A.; Nath, S.; Kumari, P.; Saravanan, R. Effective Removal of Malachite Green Dye from Aqueous Solution in Hybrid System Utilizing Agricultural Waste as Particle Electrodes. Chemosphere 2021, 273, 129634. [Google Scholar] [CrossRef]
  21. Sacara, A.M.; Nairi, V.; Salis, A.; Turdean, G.L.; Muresan, L.M. Silica-Modified Electrodes for Electrochemical Detection of Malachite Green. Electroanalysis 2017, 29, 2602–2609. [Google Scholar] [CrossRef]
  22. Pérez-Estrada, L.A.; Agüera, A.; Hernando, M.D.; Malato, S.; Fernández-Alba, A.R. Photodegradation of Malachite Green under Natural Sunlight Irradiation: Kinetic and Toxicity of the Transformation Products. Chemosphere 2008, 70, 2068–2075. [Google Scholar] [CrossRef]
  23. Fischer, A.R.; Werner, P.; Goss, K. Photodegradation of Malachite Green and Malachite Green Carbinol under Irradiation with Different Wavelength Ranges. Chemosphere 2011, 82, 210–214. [Google Scholar] [CrossRef] [PubMed]
  24. Zulmajdi, S.L.N.; Zamri, N.I.I.; Yasin, H.M.; Kusrini, E.; Hobley, J.; Usman, A. Comparative Study on the Adsorption, Kinetics, and Thermodynamics of the Photocatalytic Degradation of Six Different Synthetic Dyes on TiO2 Nanoparticles. React. Kinet. Mech. Catal. 2020, 129, 519–534. [Google Scholar] [CrossRef]
  25. Hu, S.; Zhu, M. Ultrathin Two-Dimensional Semiconductors for Photocatalysis in Energy and Environment Applications. ChemCatChem 2019, 11, 6147–6165. [Google Scholar] [CrossRef]
  26. Zhu, S.; Wang, D. Photocatalysis: Basic Principles, Diverse Forms of Implementations and Emerging Scientific Opportunities. Adv. Energy Mater. 2017, 7, 1700841. [Google Scholar] [CrossRef] [Green Version]
  27. Huebener, R.P. Conductors, Semiconductors, Superconductors: An Introduction to Solid State Physics; Springer: Berlin/Heidelberg, Germany, 2016; ISBN 9783319240084. [Google Scholar]
  28. Omrani, N.; Nezamzadeh-Ejhieh, A. A Comprehensive Study on the Enhanced Photocatalytic Activity of Cu2O/BiVO4/WO3 Nanoparticles. J. Photochem. Photobiol. A Chem. 2020, 389, 112223. [Google Scholar] [CrossRef]
  29. Ravelli, D.; Dondi, D.; Fagnoni, M.; Albini, A. Photocatalysis. A Multi-Faceted Concept for Green Chemistry. Chem. Soc. Rev. 2009, 38, 1999–2011. [Google Scholar] [CrossRef]
  30. Dutta, D.P.; Ballal, A.; Chopade, S.; Kumar, A. A Study on the Effect of Transition Metal (Ti4+, Mn2+, Cu2+ and Zn+)-Doping on Visible Light Photocatalytic Activity of Bi2MoO6 Nanorods. J. Photochem. Photobiol. A Chem. 2017, 346, 105–112. [Google Scholar] [CrossRef]
  31. Liu, G.; Wang, L.; Yang, H.G.; Cheng, H.M.; Lu, G.Q. Titania-Based Photocatalysts—Crystal Growth, Doping and Heterostructuring. J. Mater. Chem. 2010, 20, 831–843. [Google Scholar] [CrossRef]
  32. Ghattavi, S.; Nezamzadeh-Ejhieh, A. GC-MASS Detection of Methyl Orange Degradation Intermediates by AgBr/g-C3N4: Experimental Design, Bandgap Study, and Characterization of the Catalyst. Int. J. Hydrog. Energy 2020, 45, 24636–24656. [Google Scholar] [CrossRef]
  33. Arumugam, M.; Natarajan, T.S.; Saelee, T.; Praserthdam, S.; Ashokkumar, M.; Praserthdam, P. Recent Developments on Bismuth Oxyhalides (BiOX; X = Cl, Br, I) Based Ternary Nanocomposite Photocatalysts for Environmental Applications. Chemosphere 2021, 282, 131054. [Google Scholar] [CrossRef]
  34. Arumugam, M.; Choi, M.Y. Recent Progress on Bismuth Oxyiodide (BiOI) Photocatalyst for Environmental Remediation. J. Ind. Eng. Chem. 2020, 81, 237–268. [Google Scholar] [CrossRef]
  35. Malathi, A.; Madhavan, J.; Ashokkumar, M.; Arunachalam, P. A Review on BiVO4 Photocatalyst: Activity Enhancement Methods for Solar Photocatalytic Applications. Appl. Catal. A Gen. 2018, 555, 47–74. [Google Scholar] [CrossRef]
  36. Kodama, H.; Izumi, F.; Watanabe, A. New Members of a Family of Layered Bismuth Compounds. J. Solid State Chem. 1981, 36, 349–355. [Google Scholar] [CrossRef]
  37. Do Leandro, M.K.N.S.; Moura, J.V.B.; de Freire, P.T.C.; Vega, M.L.; da Lima, C.L.; Hidalgo, Á.A.; de Araújo, A.C.J.; Freitas, P.R.; Paulo, C.L.R.; de Sousa, A.K.; et al. Characterization and Evaluation of Layered Bi2WO6 Nanosheets as a New Antibacterial Agent. Antibiotics 2021, 10, 1068. [Google Scholar] [CrossRef] [PubMed]
  38. Wang, Y.; Zhang, M.; Wu, J.; Hu, Z.; Zhang, H.; Yan, H. Ferroelectric and Photocatalytic Properties of Aurivillius Phase Ca2Bi4Ti5O18. J. Am. Ceram. Soc. 2021, 104, 322–328. [Google Scholar] [CrossRef]
  39. Kendall, K.R.; Navas, C.; Thomas, J.K.; zur Loye, H.-C. Recent Developments in Oxide Ion Conductors: Aurivillius Phases. Chem. Mater. 1996, 8, 642–649. [Google Scholar] [CrossRef]
  40. Li, H.; Li, K.; Wang, H. Hydrothermal Synthesis and Photocatalytic Properties of Bismuth Molybdate Materials. Mater. Chem. Phys. 2009, 116, 134–142. [Google Scholar] [CrossRef]
  41. Moure, A. Review and Perspectives of Aurivillius Structures as a Lead-Free Piezoelectric System. Appl. Sci. 2018, 8, 62. [Google Scholar] [CrossRef] [Green Version]
  42. Ruan, X.; Wen, X.; Liang, D.; Hu, Y. Hierarchically Peony-Analogous Bismuth Tungstate with Oxygen Vacancies for Enhanced Photocatalytic Degradation of Phenolic Compounds. J. Clean. Prod. 2021, 324, 129287. [Google Scholar] [CrossRef]
  43. Vahabirad, S.; Nezamzadeh-Ejhieh, A. Co-Precipitation Synthesis of BiOI/(BiO)2CO3: Brief Characterization and the Kinetic Study in the Photodegradation and Mineralization of Sulfasalazine. J. Solid State Chem. 2022, 310, 123018. [Google Scholar] [CrossRef]
  44. Guo, L.; Luo, J.; He, T.; Wei, S.; Li, S. Photocorrosion-Limited Maximum Efficiency of Solar Photoelectrochemical Water Splitting. Phys. Rev. Appl. 2018, 10, 064059. [Google Scholar] [CrossRef] [Green Version]
  45. Moon, S.; Choi, K.; Jung, K.; Lee Hyeon-Yong, J.D. Ferroelectric Properties of Substituted Aurivillius Phases SrBi2Nb2-XMxO9 (M=Cr, Mo). Bull. Korean Chem. Soc. 2002, 23, 1463–1482. [Google Scholar] [CrossRef] [Green Version]
  46. Fang, L.; You, L.; Liu, J. Ferroelectrics in Photocatalysis. In Ferroelectric Materials for Energy Applications; Wiley: Weinheim, Germany, 2018; pp. 265–309. [Google Scholar]
  47. Di, A.; García-lópez, E.; Marcì, G.; Palmisano, L. A Survey of Photocatalytic Materials for Environmental Remediation. J. Hazard. Mater. 2012, 211–212, 3–29. [Google Scholar] [CrossRef]
  48. Chankhanittha, T.; Somaudon, V.; Watcharakitti, J.; Piyavarakorn, V.; Nanan, S. Performance of Solvothermally Grown Bi2MoO6 Photocatalyst toward Degradation of Organic Azo Dyes and Fluoroquinolone Antibiotics. Mater. Lett. 2020, 258, 126764. [Google Scholar] [CrossRef]
  49. Di, J.; Chen, C.; Zhu, C.; Ji, M.; Xia, J.; Yan, C.; Hao, W.; Li, S.; Li, H.; Liu, Z. Bismuth Vacancy Mediated Single Unit Cell Bi2WO6 Nanosheets for Boosting Photocatalytic Oxygen Evolution. Appl. Catal. B Environ. 2018, 238, 119–125. [Google Scholar] [CrossRef]
  50. Yin, S.; Chen, Y.; Li, M.; Hu, Q.; Ding, Y.; Shao, Y.; Di, J. Construction of NH2-MIL-125(Ti)/Bi2WO6 Composites with Accelerated Charge Separation for Degradation of Organic Contaminants under Visible Light Irradiation. Green Energy Environ. 2020, 5, 203–213. [Google Scholar] [CrossRef]
  51. Bresolin, B.; Park, Y.; Bahnemann, D. Recent Progresses on Metal Halide Perovskite-Based Material as Potential Photocatalyst. Catalysts 2020, 10, 709. [Google Scholar] [CrossRef]
  52. Balachandran, S.; Swaminathan, M. Facile Fabrication of Heterostructured Bi2O3–ZnO Photocatalyst and Its Enhanced Photocatalytic Activity. J. Phys. Chem. C 2012, 116, 26306–26312. [Google Scholar] [CrossRef]
  53. Yu, Z.B.; Xie, Y.P.; Liu, G.; Lu, G.Q.; Ma, X.L.; Cheng, H.M. Self-Assembled CdS/Au/ZnO Heterostructure Induced by Surface Polar Charges for Efficient Photocatalytic Hydrogen Evolution. J. Mater. Chem. A 2013, 1, 2773–2776. [Google Scholar] [CrossRef]
  54. Jin, J.; Yu, J.; Guo, D.; Cui, C.; Ho, W. A Hierarchical Z-Scheme CdS-WO3 Photocatalyst with Enhanced CO2 Reduction Activity. Small 2015, 11, 5262–5271. [Google Scholar] [CrossRef]
  55. Zhong, C.; Kato, D.; Takeiri, F.; Fujii, K.; Yashima, M.; Nishiwaki, E.; Fujii, Y.; Koreeda, A.; Tassel, C.; Abe, R.; et al. Single Crystal Growth of Sillén–Aurivillius Perovskite Oxyhalides Bi4NbO8X (X = Cl, Br). Inorganics 2018, 6, 41. [Google Scholar] [CrossRef] [Green Version]
  56. Di, J.; Zhao, X.; Lian, C.; Ji, M.; Xia, J.; Xiong, J.; Zhou, W.; Cao, X.; She, Y.; Liu, H.; et al. Atomically-Thin Bi2MoO6 Nanosheets with Vacancy Pairs for Improved Photocatalytic CO2 Reduction. Nano Energy 2019, 61, 54–59. [Google Scholar] [CrossRef]
  57. Ingham, B.; Toney, M.F. X-Ray Diffraction for Characterizing Metallic Films. In Metallic Films for Electronic, Optical and Magnetic Applications; Elsevier: Amsterdam, The Netherlands, 2014; pp. 3–38. [Google Scholar]
  58. Warren, B.E. X Ray Diffraction; Addison-Wesley: Reading, MA, USA, 1969; ISBN 9780486663173. [Google Scholar]
  59. Raeisi-Kheirabadi, N.; Nezamzadeh-Ejhieh, A. A Z-Scheme g-C3N4/Ag3PO4 Nanocomposite: Its Photocatalytic Activity and Capability for Water Splitting. Int. J. Hydrog. Energy 2020, 45, 33381–33395. [Google Scholar] [CrossRef]
  60. Mote, V.; Purushotham, Y.; Dole, B. Williamson-Hall Analysis in Estimation of Lattice Strain in Nanometer-Sized ZnO Particles. J. Theor. Appl. Phys. 2012, 6, 2–9. [Google Scholar] [CrossRef] [Green Version]
  61. Hemmatpour, P.; Nezamzadeh-Ejhieh, A.; Ershadi, A. A Brief Study on the Eriochrome Black T Photodegradation Kinetic by CdS/BiVO4 Coupled Catalyst. Mater. Res. Bull. 2022, 151, 111830. [Google Scholar] [CrossRef]
  62. Wei, W.; Gao, J.; Jiang, Z.; Lü, X.; Xie, J. Transforming MoO3 Macrorods into Bismuth Molybdate Nanoplates via the Surfactant-Assisted Hydrothermal Method. Ceram. Int. 2015, 41, 11471–11481. [Google Scholar] [CrossRef]
  63. Xia, J.; Di, J.; Yin, S.; Xu, H.; Zhang, J.; Xu, Y.; Xu, L.; Li, H.; Ji, M. Facile Fabrication of the Visible-Light-Driven Bi2WO6/BiOBr Composite with Enhanced Photocatalytic Activity. RSC Adv. 2014, 4, 82–90. [Google Scholar] [CrossRef]
  64. Song, J.-M.; Mao, C.-J.; Niu, H.-L.; Shen, Y.-H.; Zhang, S.-Y. Hierarchical Structured Bismuth Oxychlorides: Self-Assembly from Nanoplates to Nanoflowers via a Solvothermal Route and Their Photocatalytic Properties. CrystEngComm 2010, 12, 3875. [Google Scholar] [CrossRef]
  65. Chong, M.N.; Jin, B.; Chow, C.W.K.; Saint, C. Recent Developments in Photocatalytic Water Treatment Technology: A Review. Water Res. 2010, 44, 2997–3027. [Google Scholar] [CrossRef]
  66. Mera, A.C.; Váldes, H.; Jamett, F.J.; Meléndrez, M.F. BiOBr Microspheres for Photocatalytic Degradation of an Anionic Dye. Solid State Sci. 2017, 65, 15–21. [Google Scholar] [CrossRef]
  67. Allagui, L.; Chouchene, B.; Gries, T.; Medjahdi, G.; Girot, E.; Framboisier, X.; Ben, A.; Balan, L.; Schneider, R. Core/Shell RGO/BiOBr Particles with Visible Photocatalytic Activity towards Water Pollutants. Appl. Surf. Sci. 2019, 490, 580–591. [Google Scholar] [CrossRef]
  68. Sun, M.; Ding, Z.; Wang, H.; Yu, G.; Li, B.; Li, M.; Zhen, M. Antifungal Effects of BiOBr Nanosheets Carrying Surfactant Cetyltrimethylammonium Bromide. J. Biomed. Res. 2018, 32, 380–388. [Google Scholar] [CrossRef] [PubMed]
  69. Priscilla, D.T.; Nadhiya, D.; Priya, S.; Jayabharathi, P.; Srinivasan, G. Solvothermal Synthesis and Material Characterization of Bismuth Tungstate (Bi2WO6) Micro/Nanoparticles: A Comparative Study Solvothermal Synthesis and Material Characterization. In AIP Conference Proceedings; AIP Publishing LLC: Melville, NY, USA, 2020; Volume 2265, pp. 2–6. [Google Scholar]
  70. Ghattavi, S.; Nezamzadeh-Ejhieh, A. A Visible Light Driven AgBr/g-C3N4 Photocatalyst Composite in Methyl Orange Photodegradation: Focus on Photoluminescence, Mole Ratio, Synthesis Method of g-C3N4 and Scavengers. Compos. Part B Eng. 2020, 183, 107712. [Google Scholar] [CrossRef]
  71. Omrani, N.; Nezamzadeh-Ejhieh, A. Focus on Scavengers’ Effects and GC-MASS Analysis of Photodegradation Intermediates of Sulfasalazine by Cu2O/CdS Nanocomposite. Sep. Purif. Technol. 2020, 235, 116228. [Google Scholar] [CrossRef]
  72. Rezaei, M.; Nezamzadeh-Ejhieha, A. The ZnO-NiO Nano-Composite: A Brief Characterization, Kinetic and Thermodynamic Study and Study the Arrhenius Model on the Sulfasalazine Photodegradation. Int. J. Hydrog. Energy 2020, 45, 24749–24764. [Google Scholar] [CrossRef]
  73. Abhilash, M.R.; Akshatha, G.; Srikantaswamy, S. Photocatalytic Dye Degradation and Biological Activities of the Fe2O3/Cu2O Nanocomposite. RSC Adv. 2019, 9, 8557–8568. [Google Scholar] [CrossRef] [Green Version]
  74. Hong, X.; Jiang, F.; Kalkanis, S.N.; Zhang, Z.G.; Zhang, X.; Zheng, X.; Jiang, H.; Chopp, M. Absolute Standard Hydrogen Electrode Potential Measured by Reduction of Aqueous Nanodrops in Gas Phase. Laser Med Sci. 2009, 24, 777–786. [Google Scholar] [CrossRef] [Green Version]
  75. Salmanderis, S.; Nezamzadeh-Ejhieh, A. Visible Light-Driven Ag2S–PbS Photocatalyst for Photocatalytic Degradation of Phenazopyridine in Aqueous Solution. Desalin. Water Treat. 2020, 197, 200–212. [Google Scholar] [CrossRef]
  76. Pare, B.; Sarwan, B.; Jonnalagadda, S.B. Photocatalytic Mineralization Study of Malachite Green on the Surface of Mn-Doped BiOCl Activated by Visible Light under Ambient Condition. Appl. Surf. Sci. 2011, 258, 247–253. [Google Scholar] [CrossRef]
  77. Yong, L.; Zhanqi, G.; Yuefei, J.; Xiaobin, H.; Cheng, S.; Shaogui, Y.; Lianhong, W.; Qingeng, W.; Die, F. Photodegradation of Malachite Green under Simulated and Natural Irradiation: Kinetics, Products, and Pathways. J. Hazard. Mater. 2015, 285, 127–136. [Google Scholar] [CrossRef]
  78. Kumar, R.; Raizada, P.; Khan, A.A.P.; Nguyen, V.H.; Van Le, Q.; Ghotekar, S.; Selvasembian, R.; Gandhi, V.; Singh, A.; Singh, P. Recent Progress in Emerging BiPO4-Based Photocatalysts: Synthesis, Properties, Modification Strategies, and Photocatalytic Applications. J. Mater. Sci. Technol. 2022, 108, 208–225. [Google Scholar] [CrossRef]
  79. Nasir, A.M.; Jaafar, J.; Aziz, F.; Yusof, N.; Salleh, W.N.W.; Ismail, A.F.; Aziz, M. A Review on Floating Nanocomposite Photocatalyst: Fabrication and Applications for Wastewater Treatment. J. Water Process Eng. 2020, 36, 101300. [Google Scholar] [CrossRef]
  80. Vergis, B.R.; Hari Krishna, R.; Kottam, N.; Nagabhushana, B.M.; Sharath, R.; Darukaprasad, B. Removal of Malachite Green from Aqueous Solution by Magnetic CuFe2O4 Nano-Adsorbent Synthesized by One Pot Solution Combustion Method. J. Nanostructure Chem. 2018, 8, 1–12. [Google Scholar] [CrossRef] [Green Version]
  81. Charanpahari, A.; Ghugal, S.G.; Umare, S.S.; Sasikala, R. Mineralization of Malachite Green Dye over Visible Light Responsive Bismuth Doped TiO2-ZrO2 Ferromagnetic Nanocomposites. New J. Chem. 2015, 39, 3629–3638. [Google Scholar] [CrossRef]
  82. Kim, S.; Choi, K. Occurrences, Toxicities, and Ecological Risks of Benzophenone-3, a Common Component of Organic Sunscreen Products: A Mini-Review. Environ. Int. 2014, 70, 143–157. [Google Scholar] [CrossRef]
  83. Omrani, N.; Nezamzadeh-Ejhieh, A.; Alizadeh, M. Brief Study on the Kinetic Aspect of Photodegradation of Sulfasalazine Aqueous Solution by Cuprous Oxide/Cadmium Sulfide Nanoparticles. Desalin. Water Treat. 2019, 162, 290–302. [Google Scholar] [CrossRef]
  84. Mehrali-Afjani, M.; Nezamzadeh-Ejhieh, A.; Aghaei, H. A Brief Study on the Kinetic Aspect of the Photodegradation and Mineralization of BiOI-Ag3PO4 towards Sodium Diclofenac. Chem. Phys. Lett. 2020, 759, 137873. [Google Scholar] [CrossRef]
  85. Kumar, K.V.; Porkodi, K.; Rocha, F. Langmuir-Hinshelwood Kinetics—A Theoretical Study. Catal. Commun. 2008, 9, 82–84. [Google Scholar] [CrossRef]
  86. Fu, J.; Ji, M.; Wang, Z.; Jin, L.; An, D. A New Submerged Membrane Photocatalysis Reactor (SMPR) for Fulvic Acid Removal Using a Nano-Structured Photocatalyst. J. Hazard. Mater. 2006, 131, 238–242. [Google Scholar] [CrossRef]
  87. Huang, X.; Leal, M.; Li, Q. Degradation of Natural Organic Matter by TiO2 Photocatalytic Oxidation and Its Effect on Fouling of Low-Pressure Membranes. Water Res. 2008, 42, 1142–1150. [Google Scholar] [CrossRef]
  88. Choo, K.-H. Modeling Photocatalytic Membrane Reactors. In Current Trends and Future Developments on (Bio-)Membranes; Elsevier: Amsterdam, The Netherlands, 2018; pp. 297–316. ISBN 9780128135495. [Google Scholar]
  89. Saad, A.M.; Abukhadra, M.R.; Abdel-Kader Ahmed, S.; Elzanaty, A.M.; Mady, A.H.; Betiha, M.A.; Shim, J.J.; Rabie, A.M. Photocatalytic Degradation of Malachite Green Dye Using Chitosan Supported ZnO and Ce–ZnO Nano-Flowers under Visible Light. J. Environ. Manag. 2020, 258, 110043. [Google Scholar] [CrossRef] [PubMed]
  90. Maria Magdalane, C.; Kaviyarasu, K.; Judith Vijaya, J.; Jayakumar, C.; Maaza, M.; Jeyaraj, B. Photocatalytic Degradation Effect of Malachite Green and Catalytic Hydrogenation by UV–Illuminated CeO2/CdO Multilayered Nanoplatelet Arrays: Investigation of Antifungal and Antimicrobial Activities. J. Photochem. Photobiol. B Biol. 2017, 169, 110–123. [Google Scholar] [CrossRef] [PubMed]
  91. Mohamed, A.; Ghobara, M.M.; Abdelmaksoud, M.K.; Mohamed, G.G. A Novel and Highly Efficient Photocatalytic Degradation of Malachite Green Dye via Surface Modified Polyacrylonitrile Nanofibers/Biogenic Silica Composite Nanofibers. Sep. Purif. Technol. 2019, 210, 935–942. [Google Scholar] [CrossRef]
  92. Hosseini, A.; Karimi, H.; Foroughi, J.; Sabzehmeidani, M.M.; Ghaedi, M. Heterogeneous Photoelectro-Fenton Using ZnO and TiO2 Thin Film as Photocatalyst for Photocatalytic Degradation Malachite Green. Appl. Surf. Sci. Adv. 2021, 6, 100126. [Google Scholar] [CrossRef]
  93. Chen, Y.; Zhang, Y.; Liu, C.; Lu, A.; Zhang, W. Photodegradation of Malachite Green by Nanostructured BiWO Visible Light-Induced Photocatalyst. Int. J. Photoenergy 2012, 2012, 510158. [Google Scholar] [CrossRef]
  94. Pathania, D.; Katwal, R.; Sharma, G.; Naushad, M.; Khan, M.R.; Al-Muhtaseb, A.H. Novel Guar Gum/Al2O3 Nanocomposite as an Effective Photocatalyst for the Degradation of Malachite Green Dye. Int. J. Biol. Macromol. 2016, 87, 366–374. [Google Scholar] [CrossRef]
  95. Modwi, A.; Abbo, M.A.; Hassan, E.A.; Al-Duaij, O.K.; Houas, A. Adsorption Kinetics and Photocatalytic Degradation of Malachite Green (MG) via Cu/ZnO Nanocomposites. J. Environ. Chem. Eng. 2017, 5, 5954–5960. [Google Scholar] [CrossRef]
  96. Rabie, A.M.; Abukhadra, M.R.; Rady, A.M.; Ahmed, S.A.; Labena, A.; Mohamed, H.S.H.; Betiha, M.A.; Shim, J.J. Instantaneous Photocatalytic Degradation of Malachite Green Dye under Visible Light Using Novel Green Co–ZnO/Algae Composites. Res. Chem. Intermed. 2020, 46, 1955–1973. [Google Scholar] [CrossRef]
Scheme 1. (A) Structure of Aurivillius phase oxides; comparison between pseudo-perovskites layers and real perovskites [55]. (B) Methodologies employed for BWO and BMO synthesis from literature (red and green box) and by a new synthetic strategy (magenta box). BWO (Bi2WO6); BMO (Bi2MoO6).
Ijms 23 05422 sch001
Figure 1. X-ray diffraction (XRD) of (A) BiOBr; (B) BWO and (C) BMO; transmission electron microscopy (TEM) images of (D) BiOBr, (E) BWO, and (F) BMO.
Ijms 23 05422 g001
Figure 2. Crystallites size analysis of (A) BWO and (B) BMO with Williamson–Hall method.
Ijms 23 05422 g002
Figure 3. Samples characterization with (A) FTIR spectra of BiOBr, BWO, and BMO photocatalysts, (B) TGA of BiOBr, BWO, and BMO, (C) DLS and ELS of BiOBr, BWO, and BMO (D) DRS of BiOBr, BWO, and BMO. Arrows indicate band edge wavelenghts.
Ijms 23 05422 g003
Figure 4. (A) Kinetic study for MG removal by BWO and (B) BMO. (C) Spectra of MG removal vs. time by BWO and (D) by BMO.
Ijms 23 05422 g004
Figure 5. (A) Spectra of MG degradation by BWO. (B) MG removal with BWO, without photocatalyst and with BMO (C) Spectra of MG degradation by BMO.
Ijms 23 05422 g005
Figure 6. (A) Reuse cycles of BWO and BMO photocatalysts; (B) UV-Vis spectra of MG solution before and after 10 cycles in contact with the photocatalyst.
Ijms 23 05422 g006
Table 2. Main experimental observations of photocatalytic tests.
SampleMG (mg/mL) [a]MG Removal (%) [b]Adsorption Contribution (%) [c]
BWO6.978951
BMO6.979119
BMO-06.688579
[a] MG initial concentration detected by UV-Vis spectroscopy, [b] percentage of MG removal calculated as percentage of absorbance decrease M G ( % ) = ( ( A 0 A ) / A 0 × 100 ) , [c] Surface adsorption.
Publisher’s Note: MDPI stays neutral with regard to jurisdictional claims in published maps and institutional affiliations.

