Article

Delayed Ventricular Repolarization and Sodium Channel Current Modification in a Mouse Model of Rett Syndrome

School of Physiology, Pharmacology and Neuroscience, University of Bristol, University Walk, Bristol BS8 1TD, UK
*
Authors to whom correspondence should be addressed.
Int. J. Mol. Sci. 2022, 23(10), 5735; https://0-doi-org.brum.beds.ac.uk/10.3390/ijms23105735
Submission received: 18 April 2022 / Revised: 13 May 2022 / Accepted: 17 May 2022 / Published: 20 May 2022
(This article belongs to the Section Molecular Biophysics)

Abstract

:
Rett syndrome (RTT) is a severe developmental disorder that is strongly linked to mutations in the MECP2 gene. RTT has been associated with sudden unexplained death and ECG QT interval prolongation. There are mixed reports regarding QT prolongation in mouse models of RTT, with some evidence that loss of Mecp2 function enhances cardiac late Na current, INa,Late. The present study was undertaken in order to investigate both ECG and ventricular AP characteristics in the Mecp2Null/Y male murine RTT model and to interrogate both fast INa and INa,Late in myocytes from the model. ECG recordings from 8–10-week-old Mecp2Null/Y male mice revealed prolongation of the QT and rate corrected QT (QTc) intervals and QRS widening compared to wild-type (WT) controls. Action potentials (APs) from Mecp2Null/Y myocytes exhibited longer APD75 and APD90 values, increased triangulation and instability. INa,Late was also significantly larger in Mecp2Null/Y than WT myocytes and was insensitive to the Nav1.8 inhibitor A-803467. Selective recordings of fast INa revealed a decrease in peak current amplitude without significant voltage shifts in activation or inactivation V0.5. Fast INa ‘window current’ was reduced in RTT myocytes; small but significant alterations of inactivation and reactivation time-courses were detected. Effects of two INa,Late inhibitors, ranolazine and GS-6615 (eleclazine), were investigated. Treatment with 30 µM ranolazine produced similar levels of inhibition of INa,Late in WT and Mecp2Null/Y myocytes, but produced ventricular AP prolongation not abbreviation. In contrast, 10 µM GS-6615 both inhibited INa,Late and shortened ventricular AP duration. The observed changes in INa and INa,Late can account for the corresponding ECG changes in this RTT model. GS-6615 merits further investigation as a potential treatment for QT prolongation in RTT.

1. Introduction

Rett syndrome (RTT; OMIM #312750) is a severe X-chromosome-linked developmental disorder, first identified in the 1960s [1,2]. It is characterized by arrested development (typically between 6–18 months of age), cognitive and motor skill deficits, microencephaly and seizures [3,4,5]. RTT patients also exhibit autonomic dysfunction, with altered heart rate control and respiratory difficulties (including breath holding and hyperventilation [3,5]). The sporadic “typical” or “classical” form of RTT is strongly associated with mutations to the MECP2 gene, which encodes the X-linked transcriptional regulator Methyl-Cp-binding protein 2 [4,6,7,8,9]. 95–97% of patients with typical RTT exhibit MECP2 mutations [3,10]. Patients with RTT are nearly all female; males exhibit more severe cardiac and respiratory abnormalities and the majority die within a year of birth [4]. However, whilst X-linked dominance has long been considered to be characteristic of RTT, MECP2 mutations have infrequently also been reported in males that exhibit a classical RTT phenotype; such cases are associated with somatic mosaicism or possession of an extra X chromosome [11].
The annual mortality rate in RTT is 1.2%, of which deaths approximately 26% are sudden and unexpected [12]. It is striking that a proportion of patients with typical RTT have abnormal QT intervals and T waves on the electrocardiogram [13,14,15]. Thus, Sekul and colleagues reported prolonged rate corrected QT (QTc) intervals and T wave abnormalities in 41% of girls with RTT in comparison to age-matched controls [13]. The proportion of QTc abnormalities and T wave changes increased with increasing severity of the syndrome; the authors suggested a possible link between such changes and sudden, unexpected death in RTT [13]. Ellaway et al. performed electrocardiography and 24-h Holter monitoring of 34 girls with RTT and found a prolonged QTc interval in 9 girls, and an upper borderline value in 10, compared with age-matched healthy controls [14]. Guideri et al. subsequently investigated heart rate variability and QTc intervals in patients with classic and atypical RTT [15]: 55% of girls with classic RTT exhibited QTc interval prolongation, compared to 20% with atypical RTT. More recently, Crosson et al. have reported a lower prevalence of QTc prolongation (7% of a cohort of 100 patients with MECP2 mutations) [16]. However, whilst in that study patients with a number of MECP2 mutations demonstrated no QTc prolongation, relatively high proportions of patients (25% in each case) with the R255* mutation or with large deletions exhibited QTc prolongation [16]. A recent study employing serial ECG measurements reported that 12 of 129 patients (9.3%) initially had prolonged QTc intervals at baseline, with 26 patients developing QTc prolongation during follow up (a median time of 1 year and 7 months), with those with the T158M mutation more likely to develop QTc prolongation over time [17].
Murine and primate models of MECP2-linked RTT have been reported to exhibit QTc interval prolongation [18,19,20,21]. TALEN-edited MECP2 mutant cynomolgus monkeys display both a reduction in mean heart rate and increase in QTc interval [21]. Mecp2 genetically modified mouse models have been widely used in pre-clinical research into the syndrome [4,22]. Restoration of MECP2 function in Mecp2-deficient mice is able to reverse neurological deficits in adult animals, consistent with RTT being developmental but not neurodegenerative in nature [23]. The results of experiments on 2–3 month old Mecp2Null/Y mice have shown these to exhibit increased susceptibility to ventricular arrhythmia and prolongation of the QTc interval [18]. QTc prolongation was found to be linked to an increase in the persistent, or ‘late’ sodium current, INa,Late, in recordings from Mecp2Null/Y ventricular myocytes under sodium current (INa) selective conditions [18]. The antiseizure drug phenytoin reduced INa,Late and mitigated QTc prolongation and ventricular arrhythmia susceptibility [18]. Two further subsequent studies of the murine Mecp2 model have also reported QTc prolongation [19,20]. In one of these, chronic phenytoin administration was found to completely abolish ventricular arrhythmias, but unfortunately also to worsen breathing irregularities in RTT animals [19]. However, a separate study, in which measurements were made at 6 and 8 weeks of age, has failed to observe QTc prolongation in Mecp2Null/Y mice [24]. To date, only one study has presented direct recordings of INa,Late from the Mecp2 null mouse model [18] and no published investigation has incorporated direct recordings of ventricular action potentials (AP) in order to monitor AP repolarization directly. Furthermore, there is little information available on the effects of the model on the rapid sodium current component INa and its kinetics and the few data that exist were derived under conditions optimised for measurement of INa,Late [18], which are not best suited for the accurate interrogation of fast INa. The present study was undertaken in order to investigate both ECG and ventricular AP characteristics in the Mecp2Null/Y male murine model and to interrogate both INa and INa,Late in myocytes from the model.

2. Results

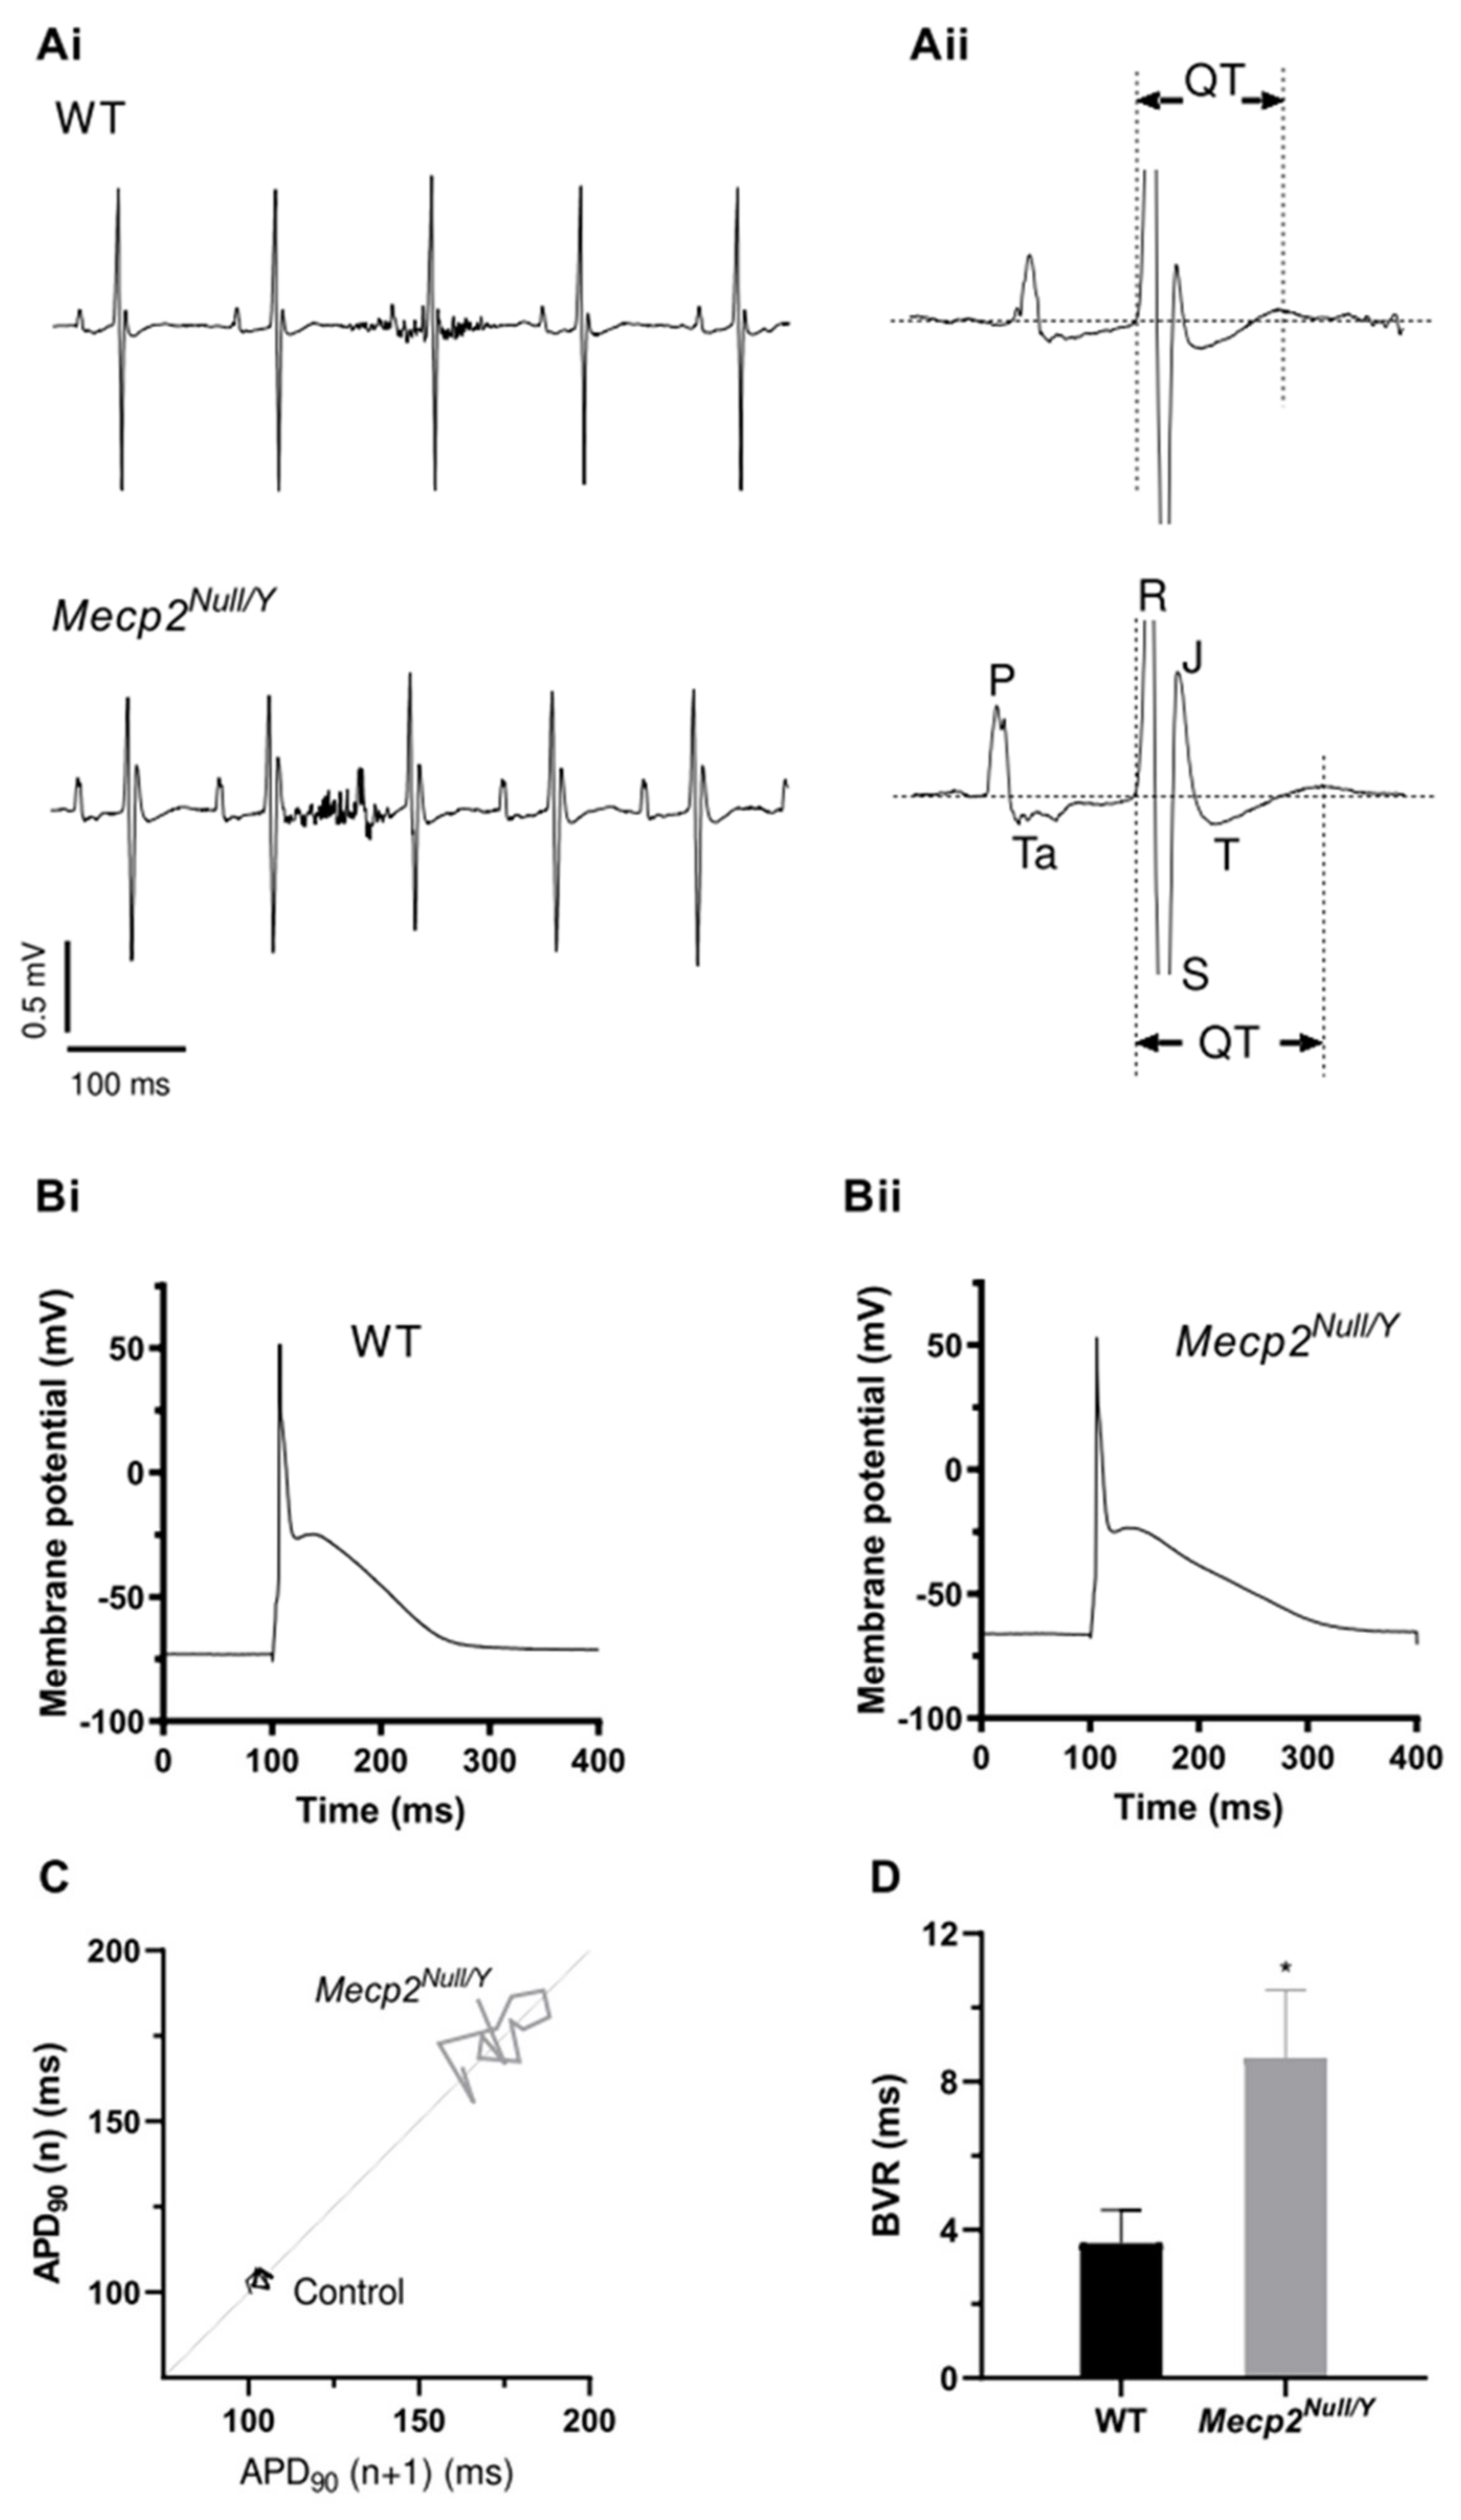
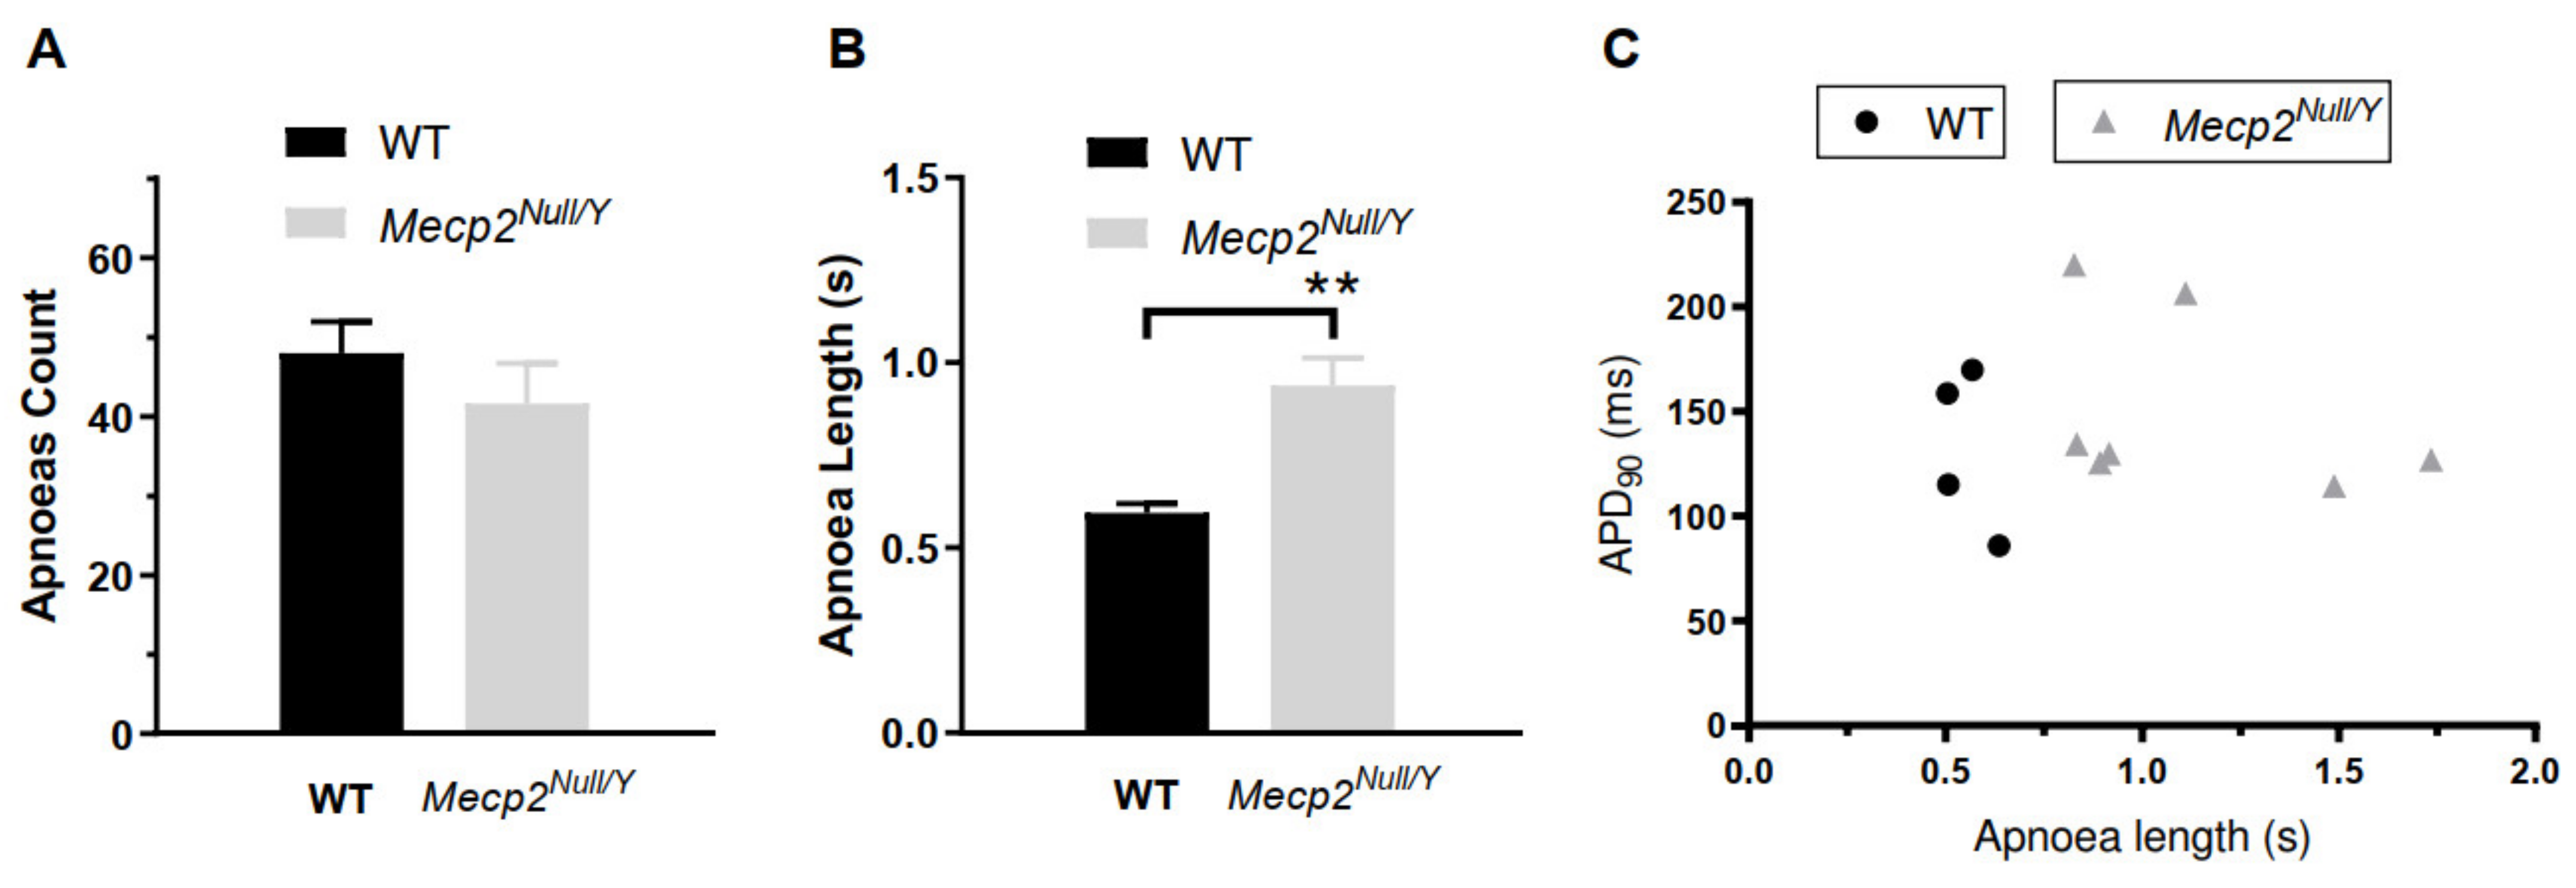
2.1. Delayed Ventricular Repolarization in Mecp2Null/Y Mice

ECG measurements were made from anaesthetised Mecp2Null/Y mice at 8–10 weeks of age and compared with those from age-matched control male mice. This time range was chosen as it lies within the 2–3 month age range selected by McCauley et al. [18], at which animals exhibit severe motor and behavioural phenotypes. Figure 1(Ai) shows representative ECG traces from WT (upper panel) and Mecp2Null/Y (lower panel) mice, with the QT interval for a single ECG complex from each strain highlighted in Figure 1(Aii). Table 1 summarizes mean ECG data from 12 WT and 12 Mecp2Null/Y mice. Heart rate and R–R interval values were similar between WT and mutant strains. However, there was a small but statistically significant increase in QRS interval duration in the RTT model strain (12.2 ± 0.5 ms vs 10.8 ± 0.2 ms in WT; p < 0.01). Uncorrected QT interval duration was also significantly greater in RTT (56.9 ± 1.8 ms) than in control (51.9 ± 0.9 ms) mice (p < 0.05). We applied two different methods of rate correction to the QT interval ([18,25,26]; see Materials and Methods), which resulted in different absolute QTc values, each of which demonstrated that the mean QTc interval of Mecp2Null/Y mice was significantly greater (by 5.3–5.6 ms) than that of WT controls (Table 1). Respiratory rate was also monitored during ECG measurement and observed to be significantly slower in RTT than control animals (Table 1). Our ECG measurements are consistent with the original findings of McCauley et al. [18] that Mecp2Null/Y mice develop prolonged QT intervals.
AP measurements were made at 1 Hz from isolated ventricular myocytes, as described in the Methods. Figure 1(Bi,Bii) show representative APs from WT and Mecp2Null/Y myocytes respectively, whilst Table 2 summarizes mean AP parameters from 27 myocytes from 9 WT animals and 29 myocytes from 13 Mecp2Null/Y mice. Resting membrane potential (RMP) was ~2.7 mV less negative in RTT myocytes (p < 0.05). The threshold amplitude of the fixed duration (3 ms) depolarizing current stimulus required to elicit APs was significantly reduced in myocytes from RTT animals. However, whilst there was a tendency for both AP overshoot potential and overall AP amplitude to be slightly lower for APs from RTT myocytes these differences did not attain statistical significance. Similarly, mean AP upstroke velocity showed a non-statistically significant trend to be higher in WT than RTT myocytes. AP repolarization parameters were quantified at 10%, 25%, 50%, 75% and 90% of complete repolarization and significant differences were observed for both APD75 and APD90 (Table 2). Mean APD90 was 166.0 ± 10.8 ms and 115.6 ± 9.5 ms in RTT and WT myocytes respectively (p < 0.01). AP triangulation was measured as the APD25 to APD90 difference, which was also shown to be significantly different between WT (113.5 ± 9.4 ms) and RTT (163.5 ± 10.8 ms; p < 0.01) myocytes. The Poincaré plot in Figure 1C shows representative beat-to-beat variability (BVR) over 15 successive APs from individual WT and Mecp2Null/Y myocytes. BVR was quantified using Equation (3) and mean values for WT and Mecp2Null/Y mice are plotted in Figure 1D: BVR was significantly larger for Mecp2Null/Y than WT myocytes, indicating increased instability of APD90 in myocytes from the RTT model.
Unrestrained whole body plethysmography was used separately from ECG measurements to monitor occurrence of respiratory apnoea as described previously [27]. In measurements from 34 WT and 23 Mecp2Null/Y animals, no significant difference was found in numbers of apnoea episodes (Figure 2A, apnoea count). The mean duration of apnoea episodes (Figure 2B, apnoea length) was, however, significantly greater in Mecp2Null/Y mice. For 11 mice (4 WT and 7 Mecp2Null/Y) for which ventricular myocytes were isolated following body plethysmography, we plotted mean APD90 values against apnoea length (Figure 2C). However, no significant correlation between these two parameters was found (R = −0.07; p = 0.84).

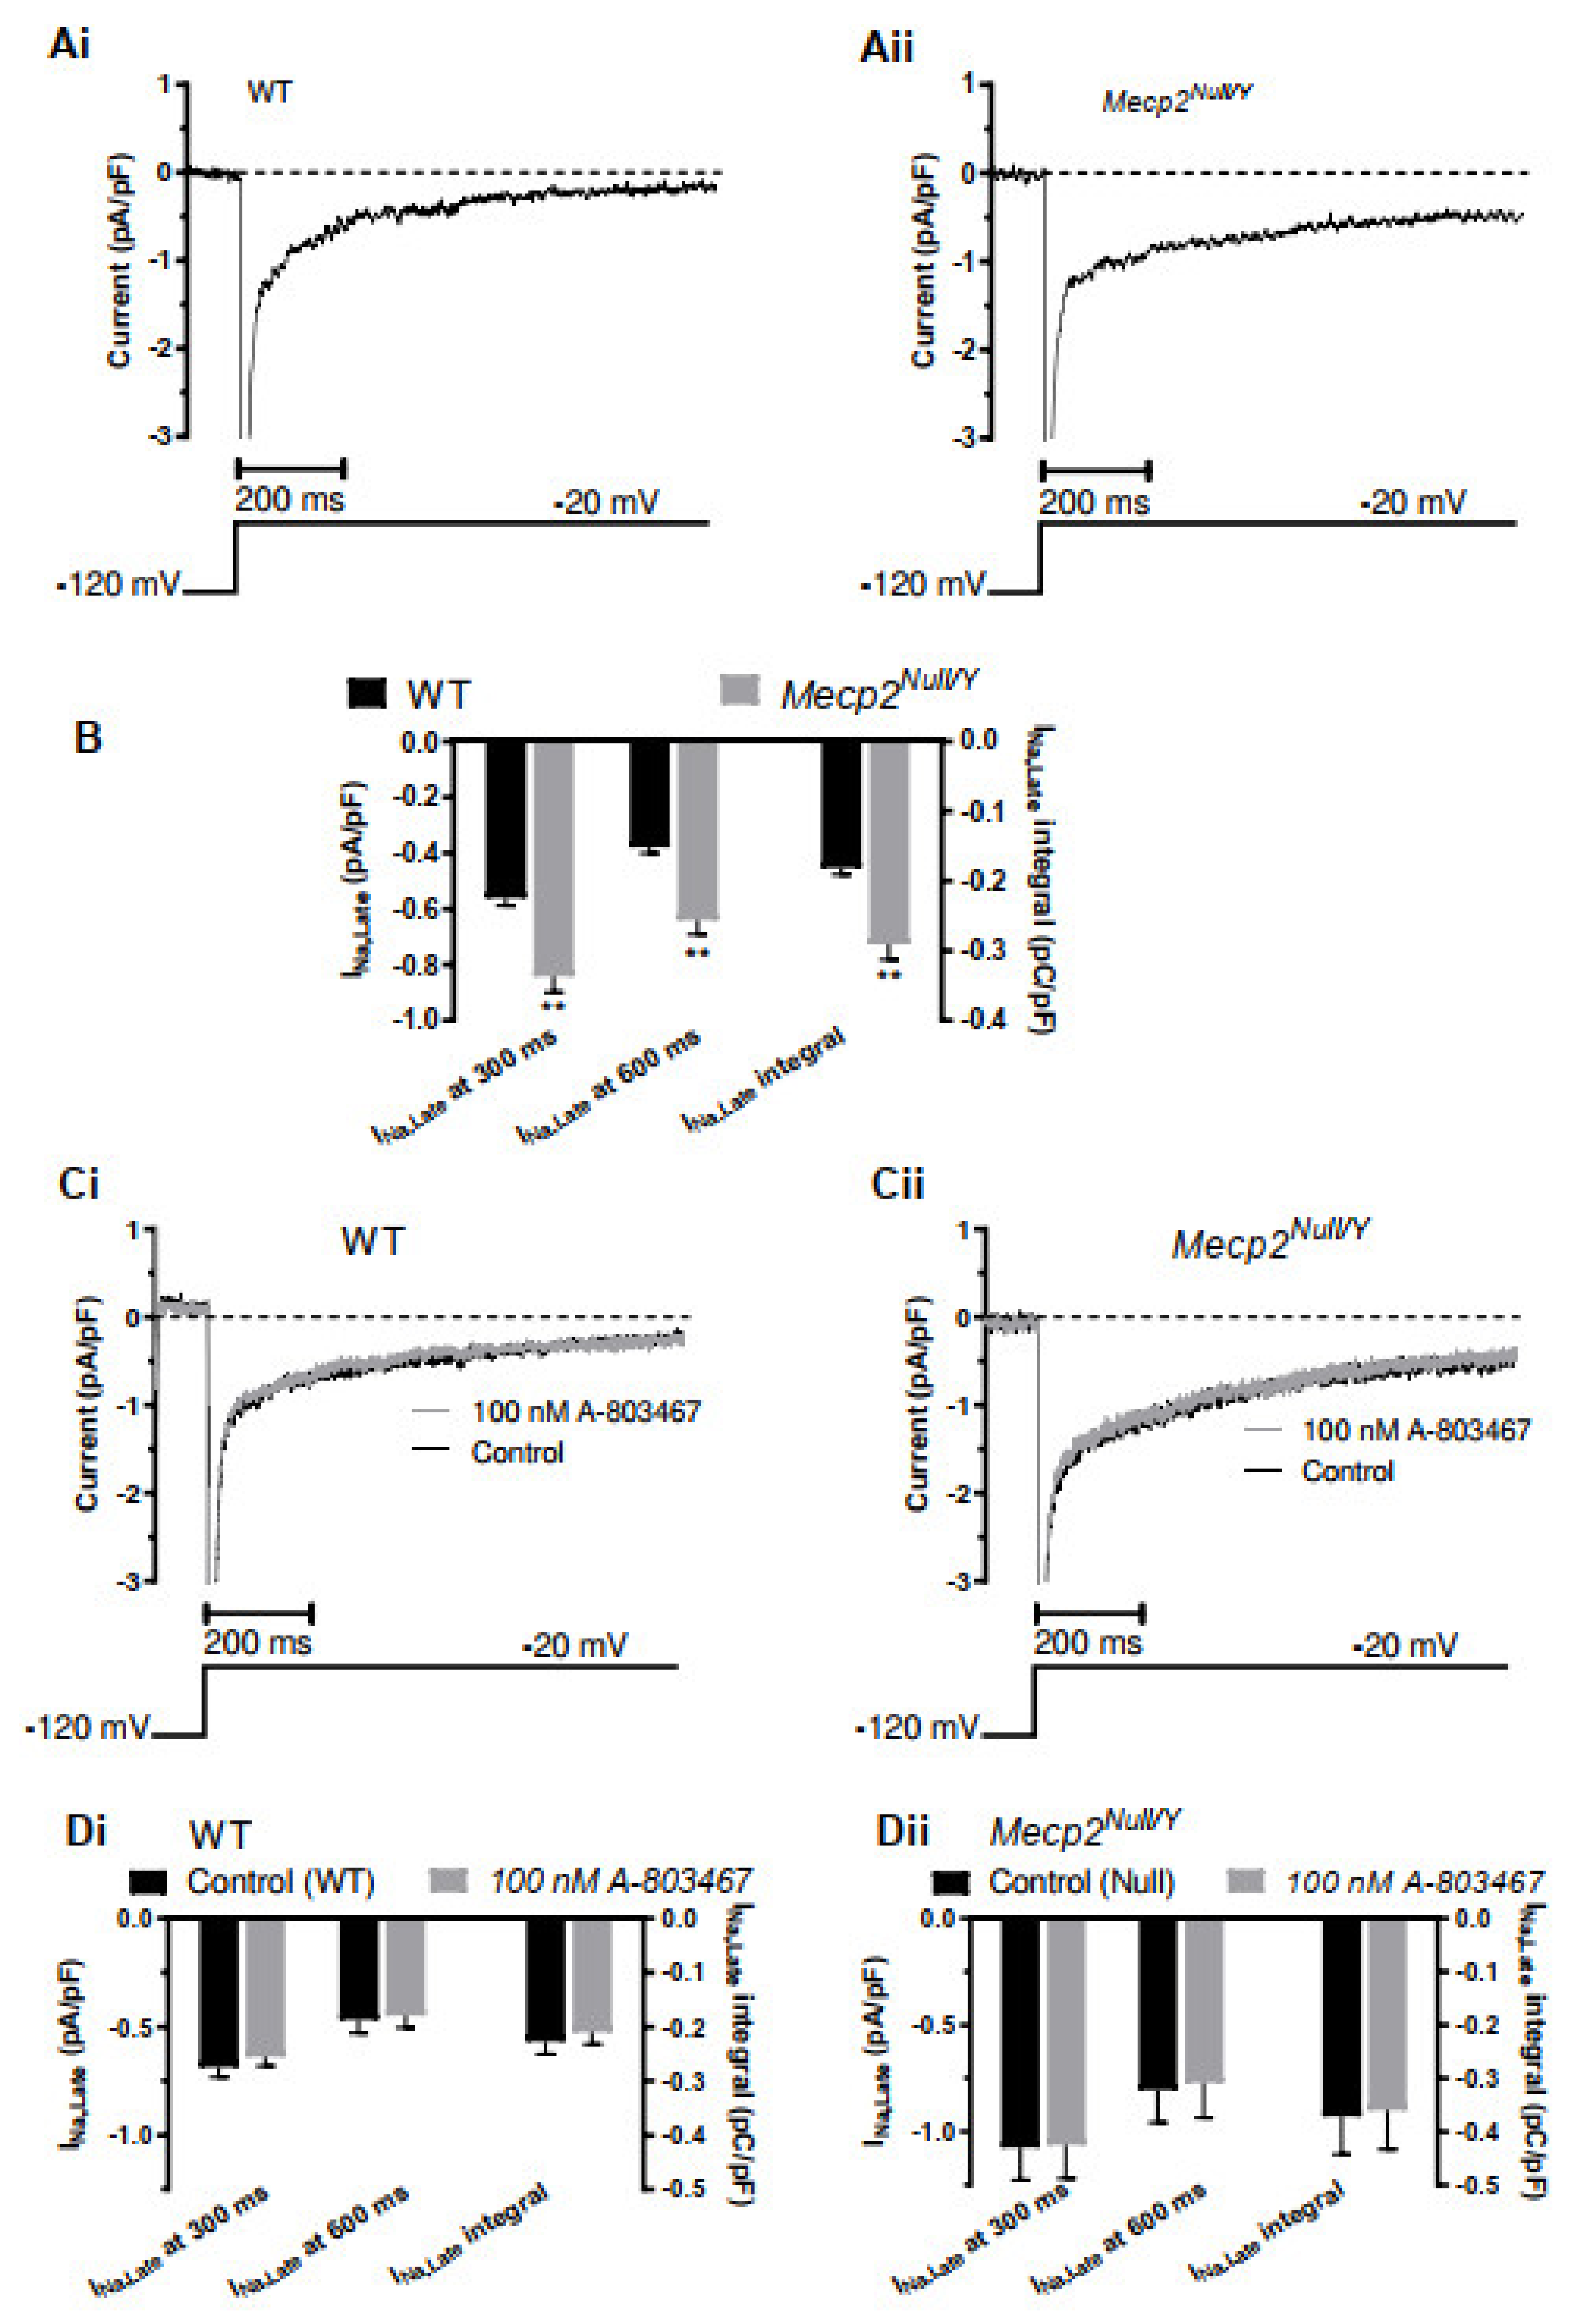
2.2. Late Sodium Current, INa,Late, Enhancement in Mecp2Null/Y Mice

INa,Late was studied using the recording solutions described in the Methods and a voltage clamp protocol comprised of a 1 s depolarization from −120 to −20 mV (applied at a frequency of 0.1 Hz). With this protocol, the initial rapid INa component gave way to a small, sustained current component during the applied voltage command. Figure 3(Ai,Aii) respectively show representative records of the Na-sensitive (NMDG-subtraction) current expanded to focus on the sustained component. It is evident that the sustained current, representing INa,Late is larger for the Mecp2Null/Y myocyte than the WT example. Three complementary approaches were used to quantify INa,Late, each of which excluded the large initial INa. First, we measured INa density (pA/pF) at 300 ms into the voltage test command; second, similar measurements were made at a later time-point of 600 ms. The third analysis method was to evaluate the current integral (pC/pF) between 350 and 800 ms into the applied voltage command. Mean data for each of these approaches are plotted in Figure 3B (for 41 cells from 20 WT mice and for 28 cells from 17 Mecp2Null/Y mice). Each of the three methods used showed a similar result: INa,Late was significantly augmented in ventricular myocytes from Mecp2Null/Y mice.
Although cardiac INa is largely attributable to channels for which the major pore-forming subunit is encoded by SCN5A [28] (scn5a in mice [29]), the neuronal Nav 1.8 isoform (encoded by SCN10A) may also be present and potentially contribute to INa,Late [30,31]. A-803467 has been shown to be potent and highly selective for Nav 1.8 over Nav 1.5 over a wide range of concentrations (30–1000 nM; [31]). Therefore, we evaluated the effects of 100 nM A-803467 on INa,Late under our recording conditions. Figure 3(Ci,Cii) show representative traces in the absence and presence of A-803467 for WT and Mecp2Null/Y myocytes respectively. Traces in the absence and presence of the drug were closely overlain in each case. Figure 3(Di,Dii) respectively show mean data for WT (eight cells from six mice) and Mecp2Null/Y (six cells from five mice) myocytes. Irrespective of the analysis method used to quantify INa,Late there was no significant effect of A-803467. As inhibition of Nav 1.8 is near complete at 30 nM [31], this observation precludes Nav 1.8 from contributing significantly to INa,Late under the conditions of this study.

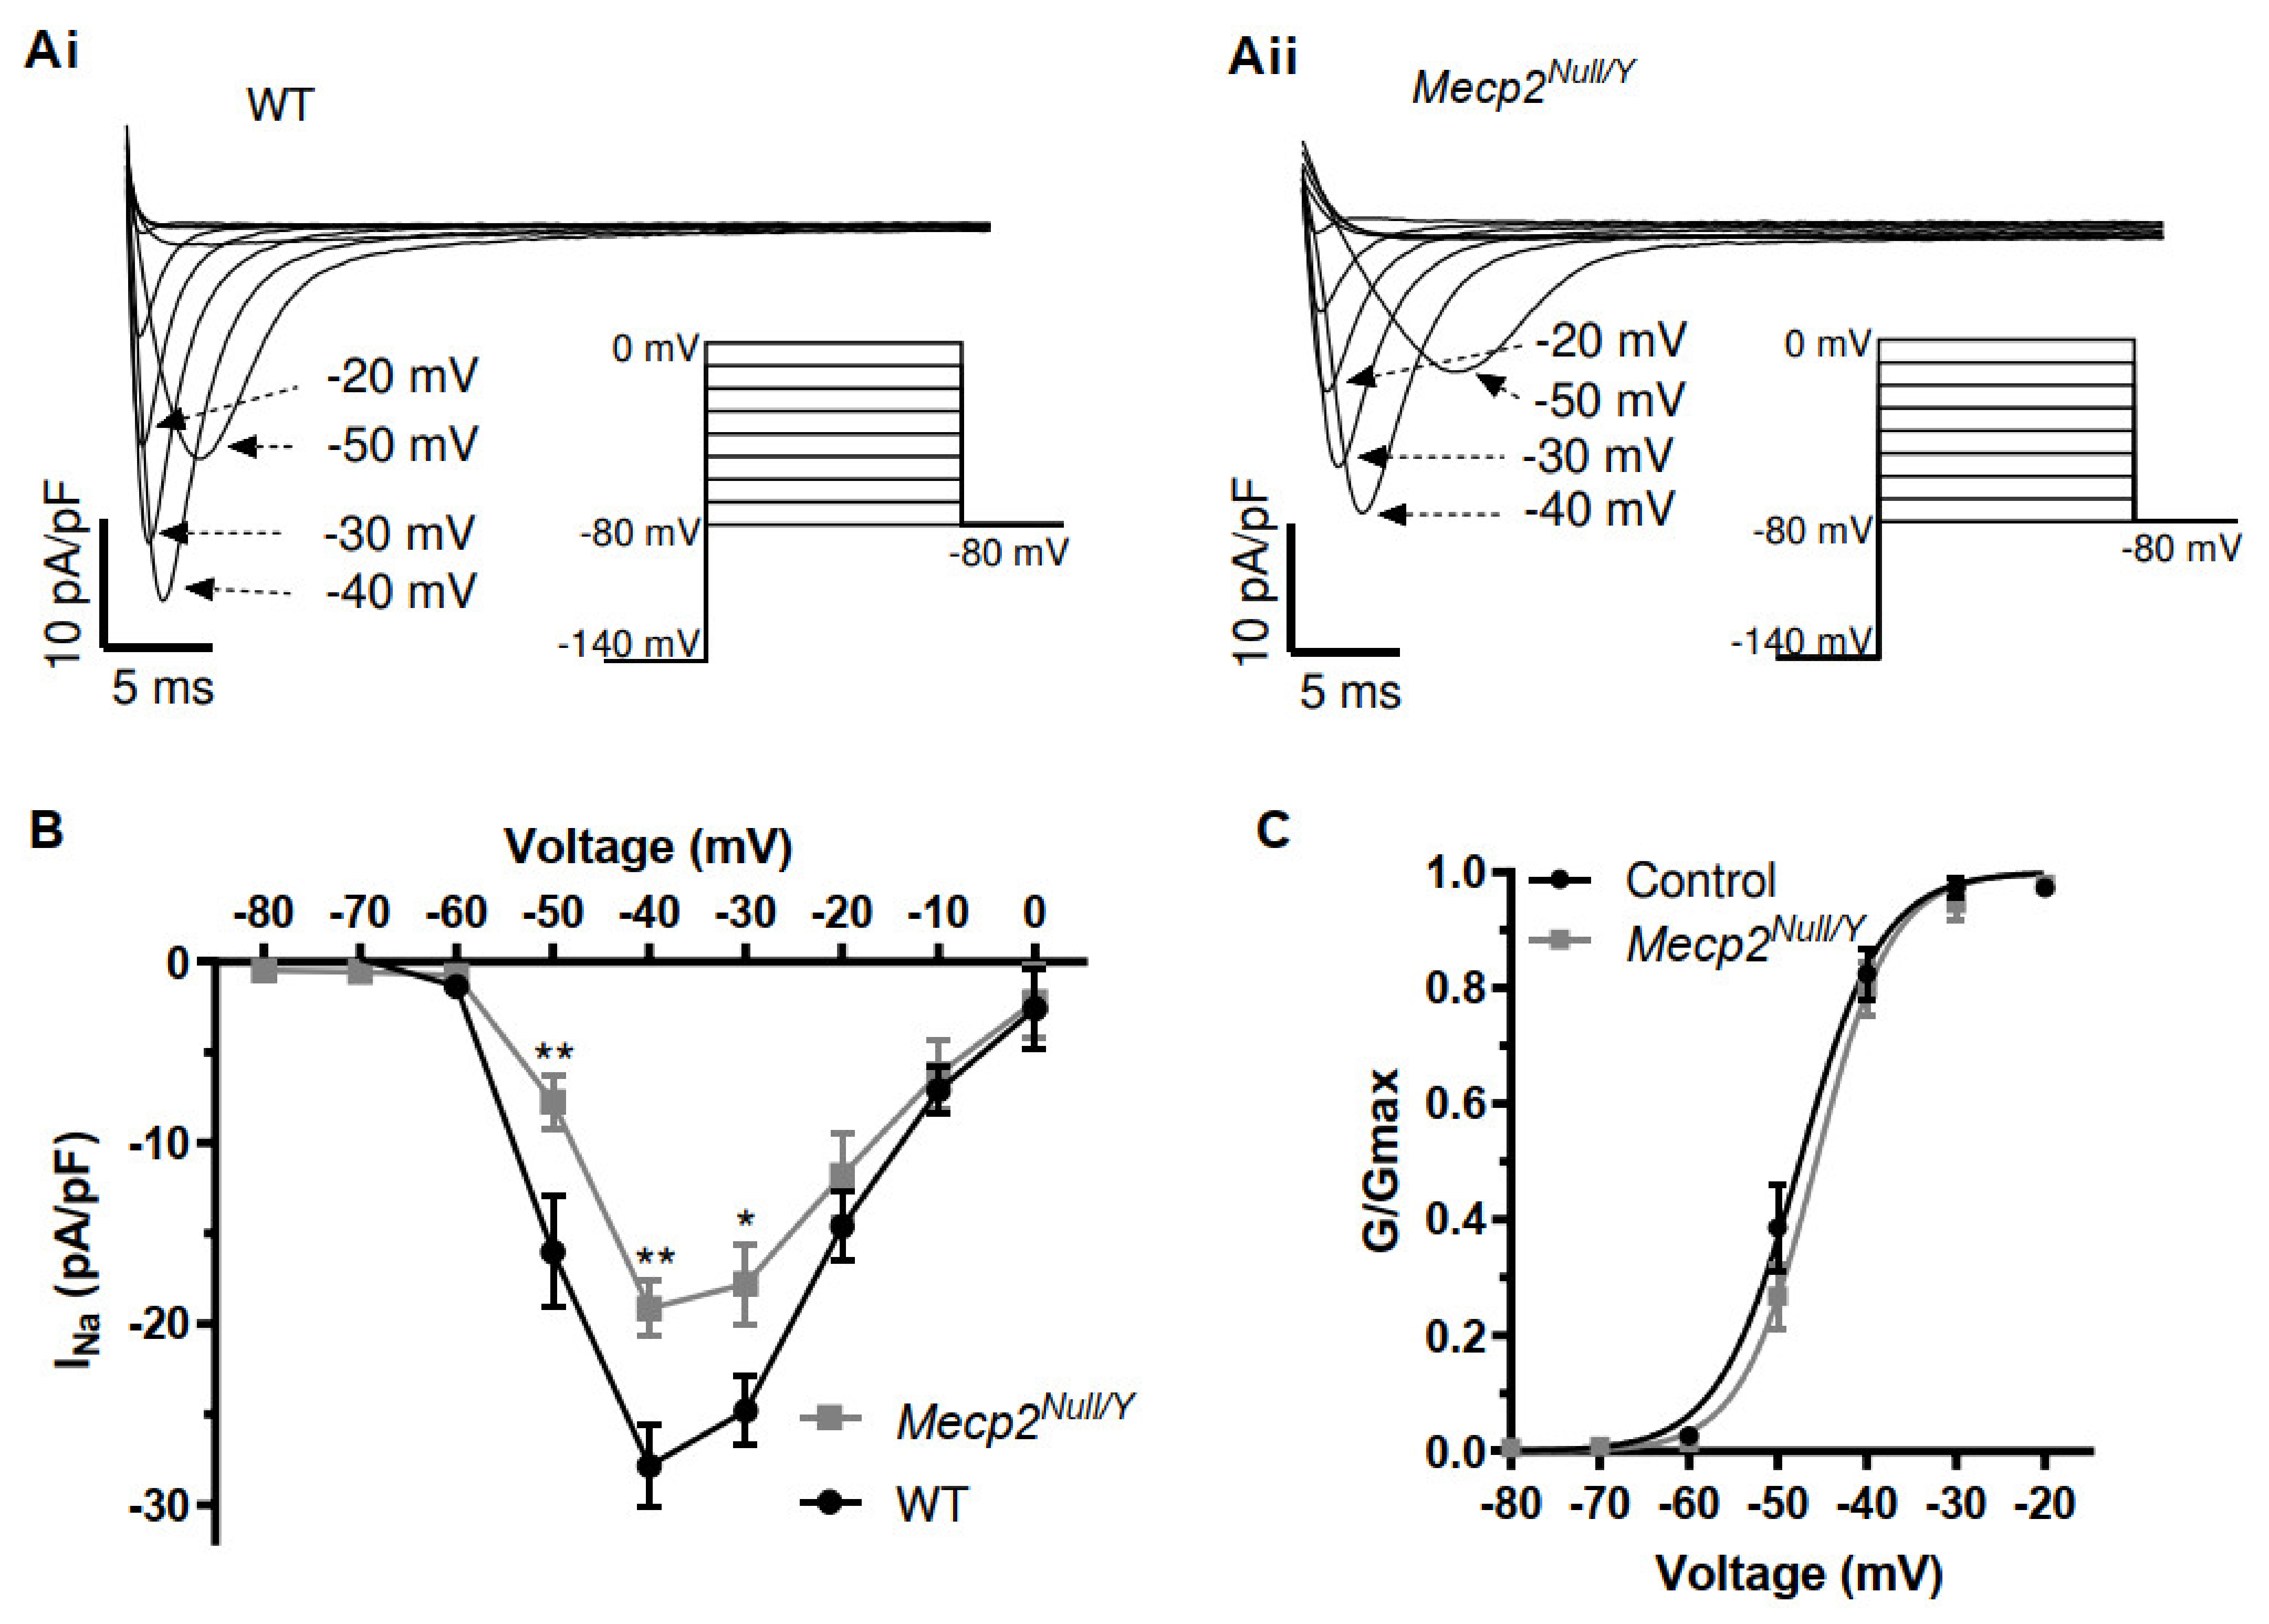
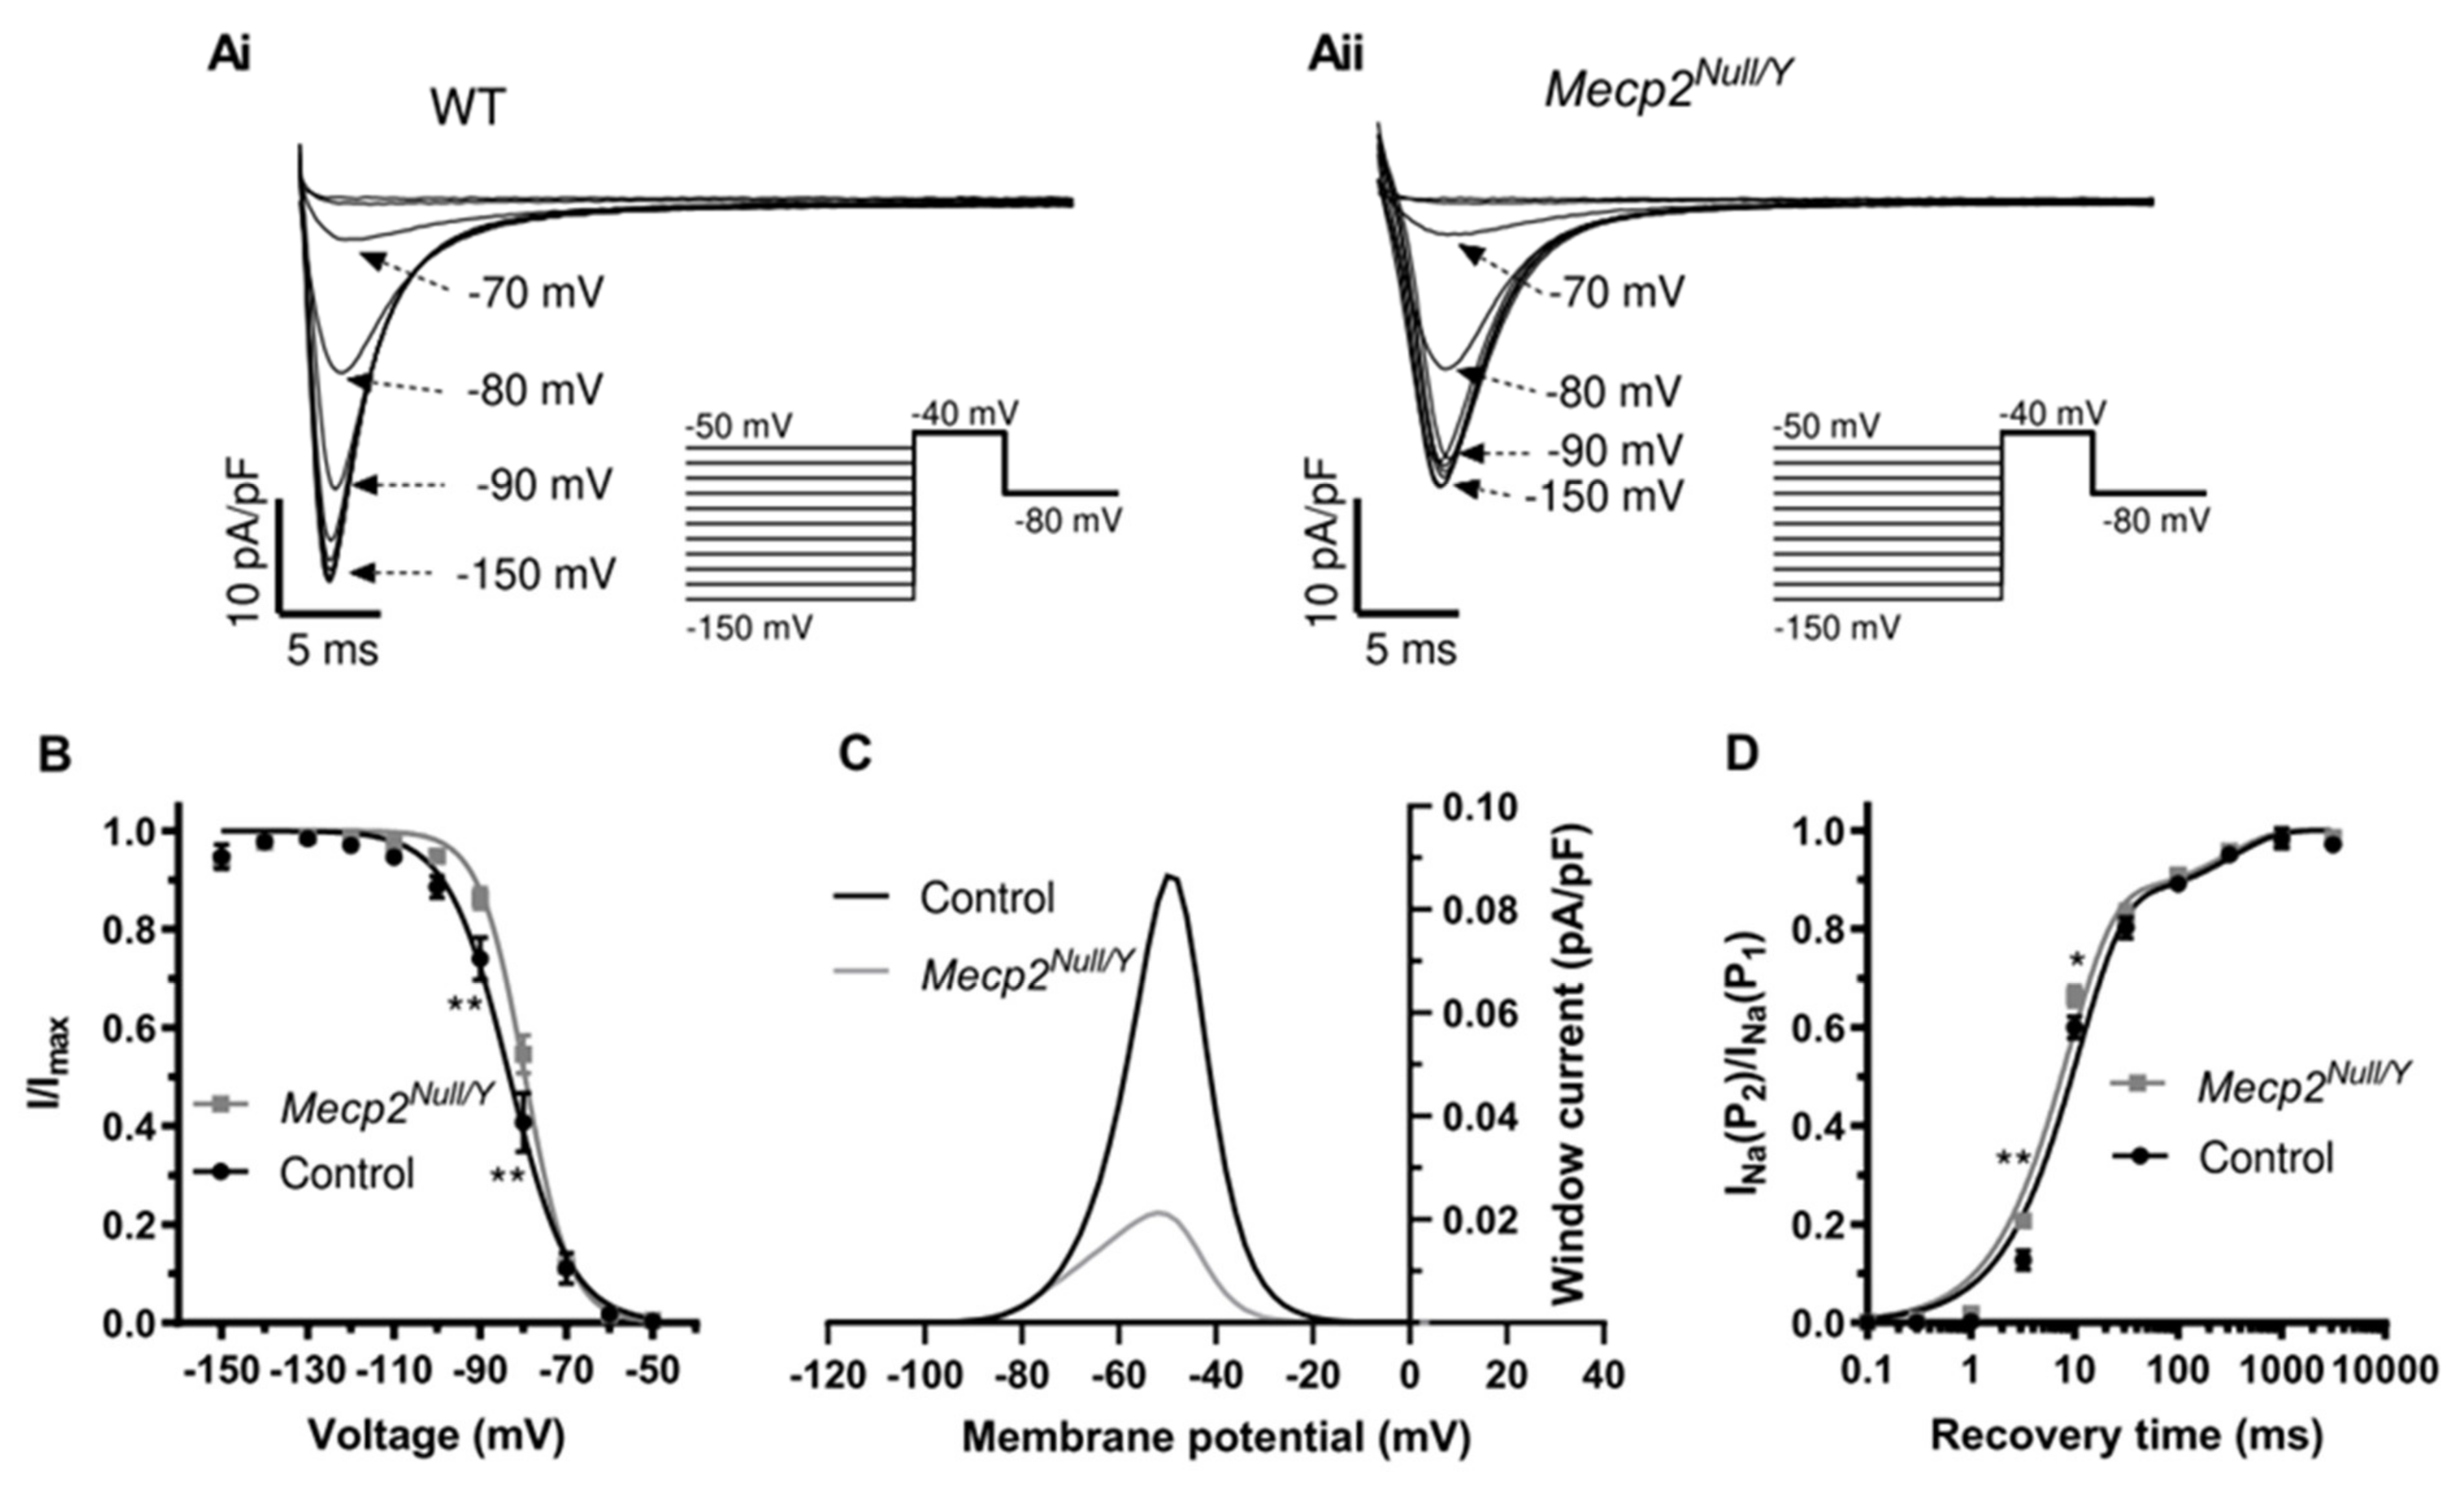
2.3. Alterations to Fast INa in Mecp2Null/Y Mice

In this study and the earlier investigation from McCauley and colleagues [18], QRS duration differed significantly between WT and Mecp2Null/Y mice. This observation and the trends towards changes in ventricular AP overshoot/upstroke raise the possibility that differences in fast INa exist between WT and Mecp2Null/Y mice. McCauley et al. suggested there is little difference in INa between the strains, but that was based on measurements from the fast current component under conditions optimised for INa,Late [18]. The speed and amplitude of INa make accurate voltage clamp of the current difficult with high [Na+]o and cardiac INa measurement is facilitated by a combination of the use of low [Na+]o to reduce INa amplitude and experimentation at room temperature (e.g., [32,33,34]). Accordingly, measurements of INa were made at room temperature with pipette and external solutions giving rise to symmetrical 5 mM [Na+] (see Methods). Figure 4(Ai,Aii) show families of INa elicited from WT and Mecp2Null/Y myocytes, by the protocol shown as insets to these panels. From a holding potential of −80 mV and following a 2 s pre-pulse to −140 mV a series of 250 ms command steps (increasing by 10 mV increments) between −80 and 0 mV were applied (pulse frequency of 0.2 Hz). As shown in Figure 4(Ai,Aii) there was a decrease in current amplitude in the Mecp2Null/Y condition. Mean current voltage (I-V) relations for INa from 11 WT myocytes (from 5 mice) and 9 Mecp2Null/Y myocytes (from 5 mice) are shown in Figure 4B. The I-V plot for Mecp2Null/Y INa exhibited statistically significantly decreased INa density between −50 and −30 mV. INa conductance values were calculated at each potential for each cell (using Equation (4), Materials and Methods) and G/Gmax data were then plotted as shown in Figure 4C and fitted with a Boltzmann equation (Equation (5), Materials and Methods) to derive activation V0.5 and k values. For WT (11 cells from 5 mice) INa, the derived V0.5 value was −47.4 ± 1.4 mV and k was 3.6 ± 0.2 mV; for Mecp2Null/Y (9 cells from 5 mice) INa V0.5 was −45.4 ± 1.0 mV and k was 3.9 ± 0.5 mV; neither INa activation parameter differed significantly between the two strains.
Fast INa inactivation time-course (τinact) was quantified through exponential fitting of the time-course of current decline of INa elicited by between −40 and −20 mV (data from experiments shown in Figure 4). At −40 mV, but not −30 or −20 mV, the τinact was significantly larger for Mecp2Null/Y than WT INa (WT and Mecp2Null/Y τinact at −40 mV of 2.6 ± 0.2 ms and 3.1 ± 0.1 ms; p < 0.05; n = 11 myocytes from 5 mice and n = 9 myocytes from 5 mice for WT and Mecp2Null/Y, respectively). Voltage dependence of INa inactivation was evaluated using a paired pulse protocol (shown schematically as insets to Figure 5(Ai,Aii). From a holding potential of −80 mV, 1.5 s conditioning pulses were applied to a range of potentials between −150 and −50 mV in 10 mV increments. Each conditioning pulse was followed by a 40 ms duration test command to −40 mV. The protocol frequency was 0.1 Hz. Figure 5(Ai,Aii) respectively show INa elicited from WT and Mecp2Null/Y myocytes during the −40 mV test command, following conditioning pulses to the membrane potential values shown. For each cell studied, the currents during the −40 mV step following the different conditioning potential were normalized to the maximal current observed during the protocol (I/Imax) and then plotted against conditioning voltage as shown in Figure 5B. Most I/Imax values were similar between WT and Mecp2Null/Y myocytes, although those at −90 and −80 mV were larger in myocytes from the RTT model. Inactivation V0.5 and k values were obtained from Boltzmann fits to the data with equation 6. For 9 WT cells (from 5 mice) mean V0.5 and k values were respectively −83.1 ± 1.7 mV and 6.5 ± 0.3 mV. For 8 Mecp2Null/Y myocytes (from 4 mice), mean V0.5 and k values were respectively −79.6 ± 0.7 mV (not significantly different from WT) and 5.1 ± 0.3 mV (p < 0.01 vs WT). The mean activation and inactivation V0.5 and k values were then used to calculate the fast INa “window current” (calculated at 2 mV as the product of activation and inactivation variables, maximal conductance and driving force), which is plotted in Figure 5C. The calculated INa window was reduced in the Mecp2Null/Y compared to the WT condition. Consequently, the increased INa,Late observed in the RTT model cannot be attributed to an increased steady state “window” for fast INa. Nor can the modest depolarization of RMP shown in Table 2 be attributed to increased steady state “window” current.
Recovery of fast INa from inactivation was determined using a paired pulse protocol in which a 1 s command from a holding potential of –120 mV was applied to −40 mV (P1; to activate and then inactivate INa) was followed at varying time-intervals (0.1, 0.3, 1, 3.2, 10, 31.6, 100, 316.2, 1000 and 3162 ms) by a second 40 ms duration command (P2) to −40 mV to monitor recovery of INa amplitude from inactivation (protocol frequency 0.1 Hz). The INa elicited by P2 was expressed as a fraction of that elicited by P1 and mean values were plotted against the inter-pulse interval. Recovery from inactivation time-course was quantified through biexponential fitting (Equation (7), Methods). Figure 5D shows mean recovery time-course data, plotted on a logarithmic time-scale (data from eight cells from four mice for each of WT and Mecp2Null/Y conditions are plotted) [34]. The fast time constant of recovery from inactivation (τfast) was 11.0 ± 0.7 ms for WT INa and 8.6 ± 0.2 ms for Mecp2Null/Y INa (p < 0.05), whilst the slow time constant of recovery from inactivation (τSlow) was 362.0 ± 53.4 ms for WT INa and 311.5 ± 50.2 ms for Mecp2Null/Y INa (no significant difference). The proportion of recovery from inactivation fitted by τfast did not differ significantly between the two strains (0.85 ± 0.02 for WT and 0.85 ± 0.03 for Mecp2Null/Y). Thus, fast INa from Mecp2Null/Y myocytes exhibited slightly faster recovery from inactivation than did WT INa due to acceleration of the rapid component of INa reactivation.

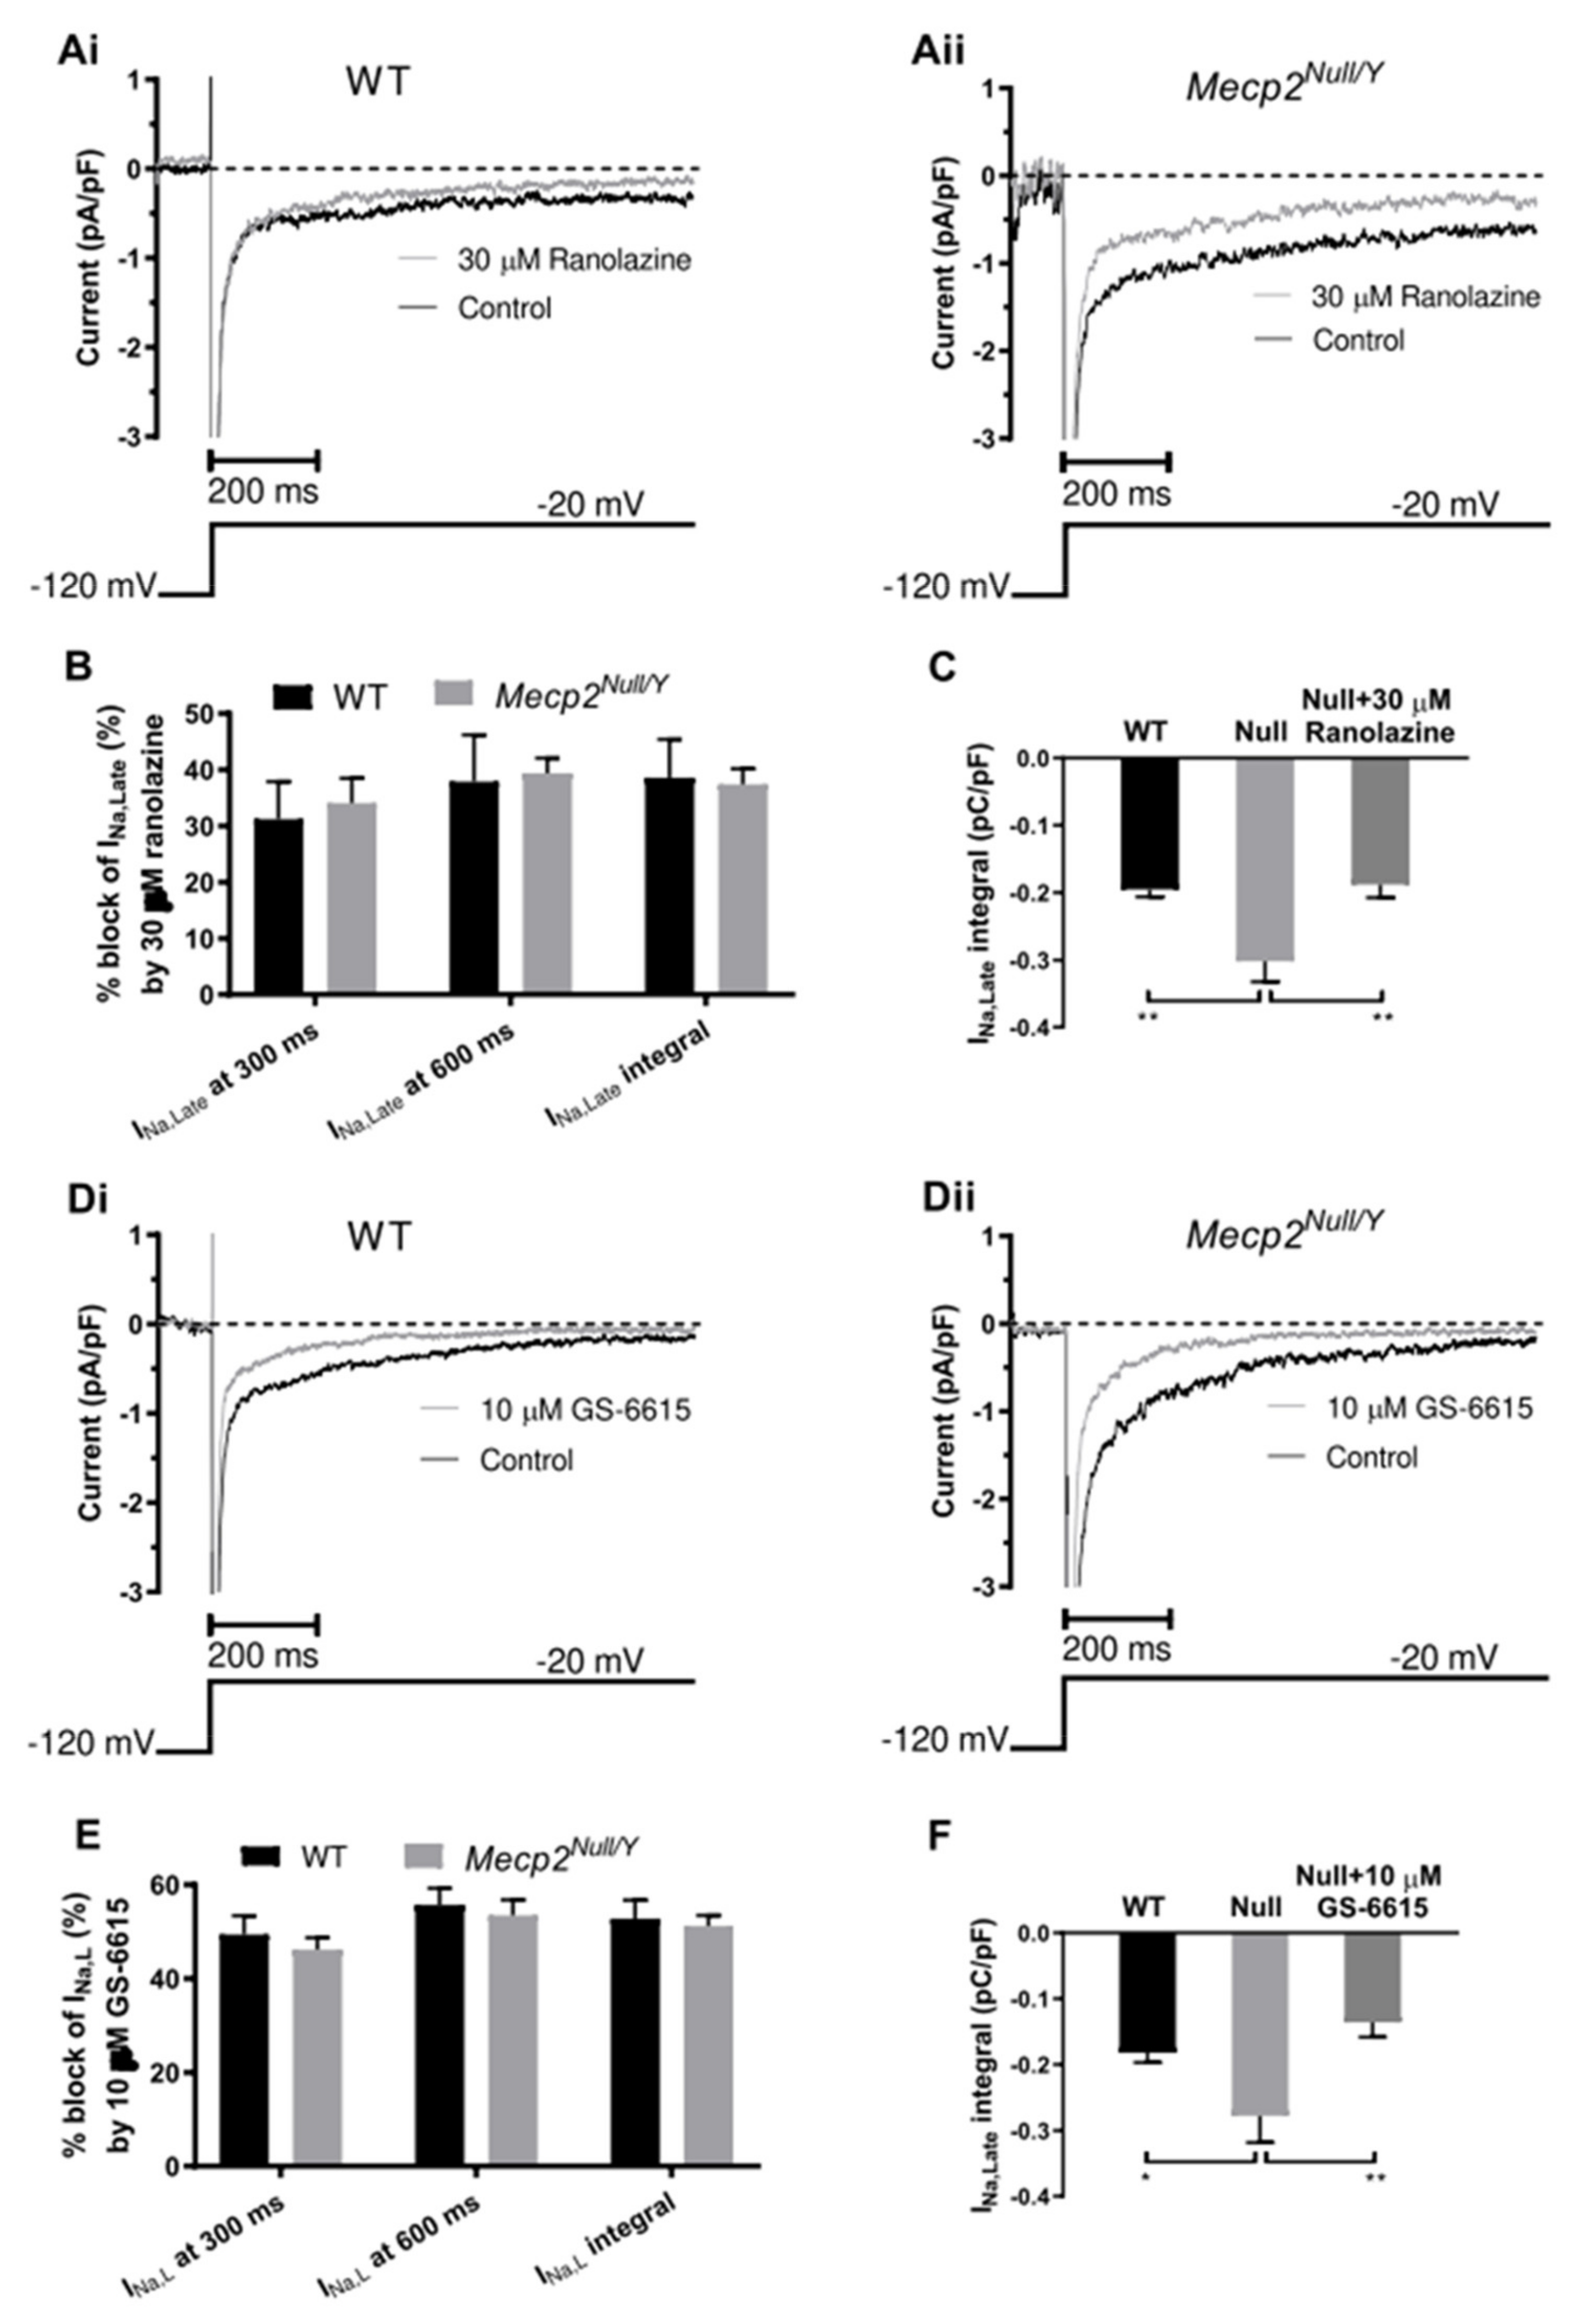
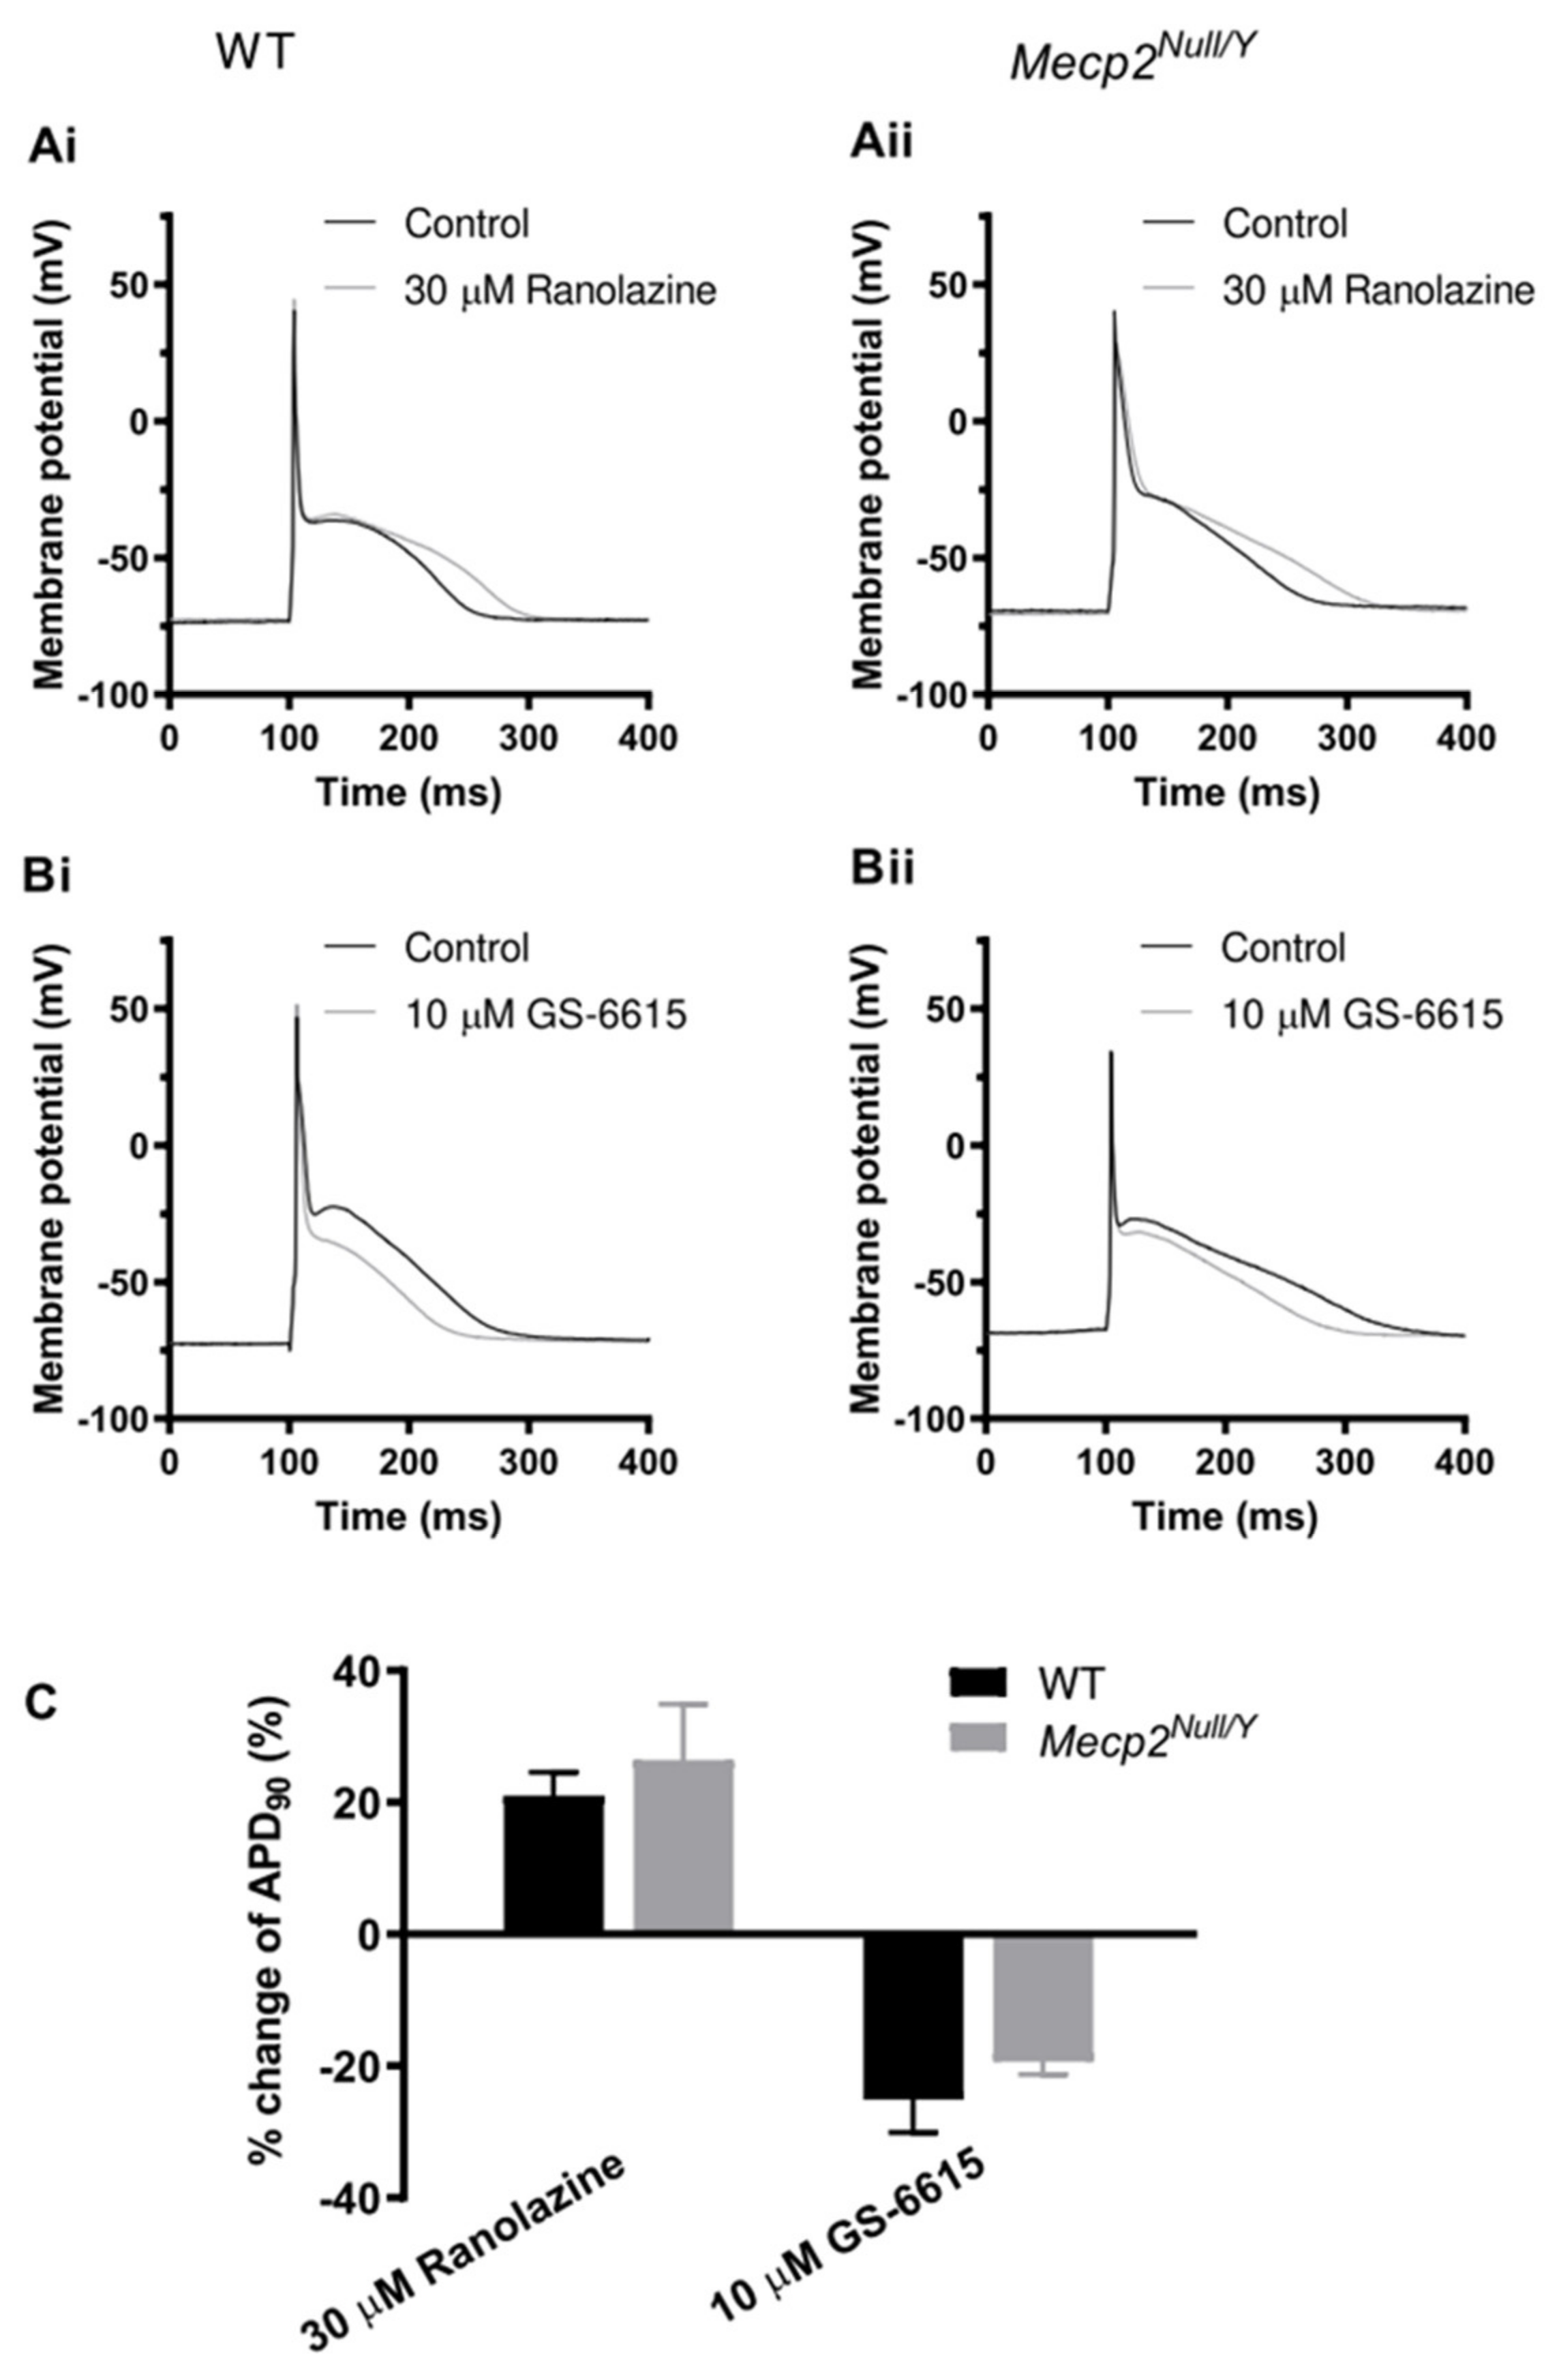
2.4. Effects of the INa,Late Inhibitors Ranolazine and Eleclazine (GS-6615)

Ranolazine (Ranexa) was developed as an anti-anginal agent but has undergone extensive investigations for repurposing as an antiarrhythmic drug [35,36,37,38,39]. It is structurally related to lidocaine and is an effective inhibitor of cardiac INa,Late [40,41].
Figure 6(Ai,Aii) respectively show exemplar traces of the effect of ranolazine (30 µM) on INa,Late from WT and Mecp2Null/Y myocytes: in each case the current was reduced following ranolazine exposure. Figure 6B shows the mean the effect of ranolazine evaluated using the three measures described in Figure 3, each plotted as percentage inhibition values (for nine WT myocytes from four mice and seven Mecp2Null/Y myocytes from four mice). Irrespective of the measurement chosen, ranolazine reduced INa,Late by a similar percentage in WT and RTT myocytes.
GS-6615 (also known as eleclazine) is a second generation selective INa,Late inhibitor with an improved structure–activity relationship profile to ranolazine [42] and effectiveness against LQT3 Na channel mutations [43]. Figure 6(Di,Dii) respectively show exemplar traces of the effect of GS-6615 (10 µM) on INa,Late from WT and Mecp2Null/Y myocytes. Similar to ranolazine, in each case the current was reduced following GS-6615 exposure. Figure 6E shows the mean effect of GS-6615 evaluated using the three measures used for ranolazine in Figure 6B, each plotted as percentage inhibition values (for 16 WT myocytes from 8 mice and 8 Mecp2Null/Y myocytes from 6 mice). Irrespective of the measurement chosen, GS-6615 reduced INa,Late by a similar percentage in WT and RTT myocytes. Figure 6C,F display mean control INa,Late integral values for WT and Mecp2Null/Y myocytes together with the Mecp2Null/Y myocyte integral from the same myocytes following treatment with ranolazine (Figure 6C) and GS-6615 (Figure 6F). Consistent with Figure 3, the Mecp2Null/Y myocyte INa,Late integral was significantly larger than that for WT myocytes; however, in the presence of ranolazine or GS-6615 this was no longer the case. Thus, application of 30 µM ranolazine or 10 µM GS-6615 to myocytes from the RTT model restored INa,Late to levels not significantly different from those in WT myocytes.
In a final series of experiments, effects of ranolazine and GS-6615 on AP duration of WT and Mecp2Null/Y ventricular myocyte were examined. Figure 7(Ai,Aii) respectively show responses to 30 µM ranolazine of APs from WT (Ai) and Mecp2Null/Y (Aii) myocytes, whilst Figure 7(Bi,Bii) respectively show effects of 10 µM GS-6615 on APs from WT (Bi) and Mecp2Null/Y (Bii) myocytes. In each case, GS-6615 led to AP abbreviation, consistent with the compound’s INa,Late inhibitory action; however, ranolazine lengthened rather than shortened AP duration, as would have been predicted from INa,Late inhibition. Figure 7C shows the mean percentage changes in APD90 produced by each agent, with statistically similar effects on WT and Mecp2Null/Y myocytes in each case, with APD90 lengthening by ranolazine and abbreviation by GS-6615 (the plots show data from seven cells from four WT mice and six cells from three Mecp2Null/Y mice for the ranolazine groups, and six cells from three WT mice and eight cells from five Mecp2Null/Y mice for GS-6615 groups). Furthermore, in Mecp2Null/Y myocytes GS-6615 reduced AP triangulation (from 156.0 ± 14.4 ms to 125.9±9.1 ms; p < 0.01). Mean BVR was also reduced by GS-6615, although this difference was not statistically significant (from 8.6 ± 2.8 ms to 5.4 ± 1.4 ms; p = 0.09).

3. Discussion

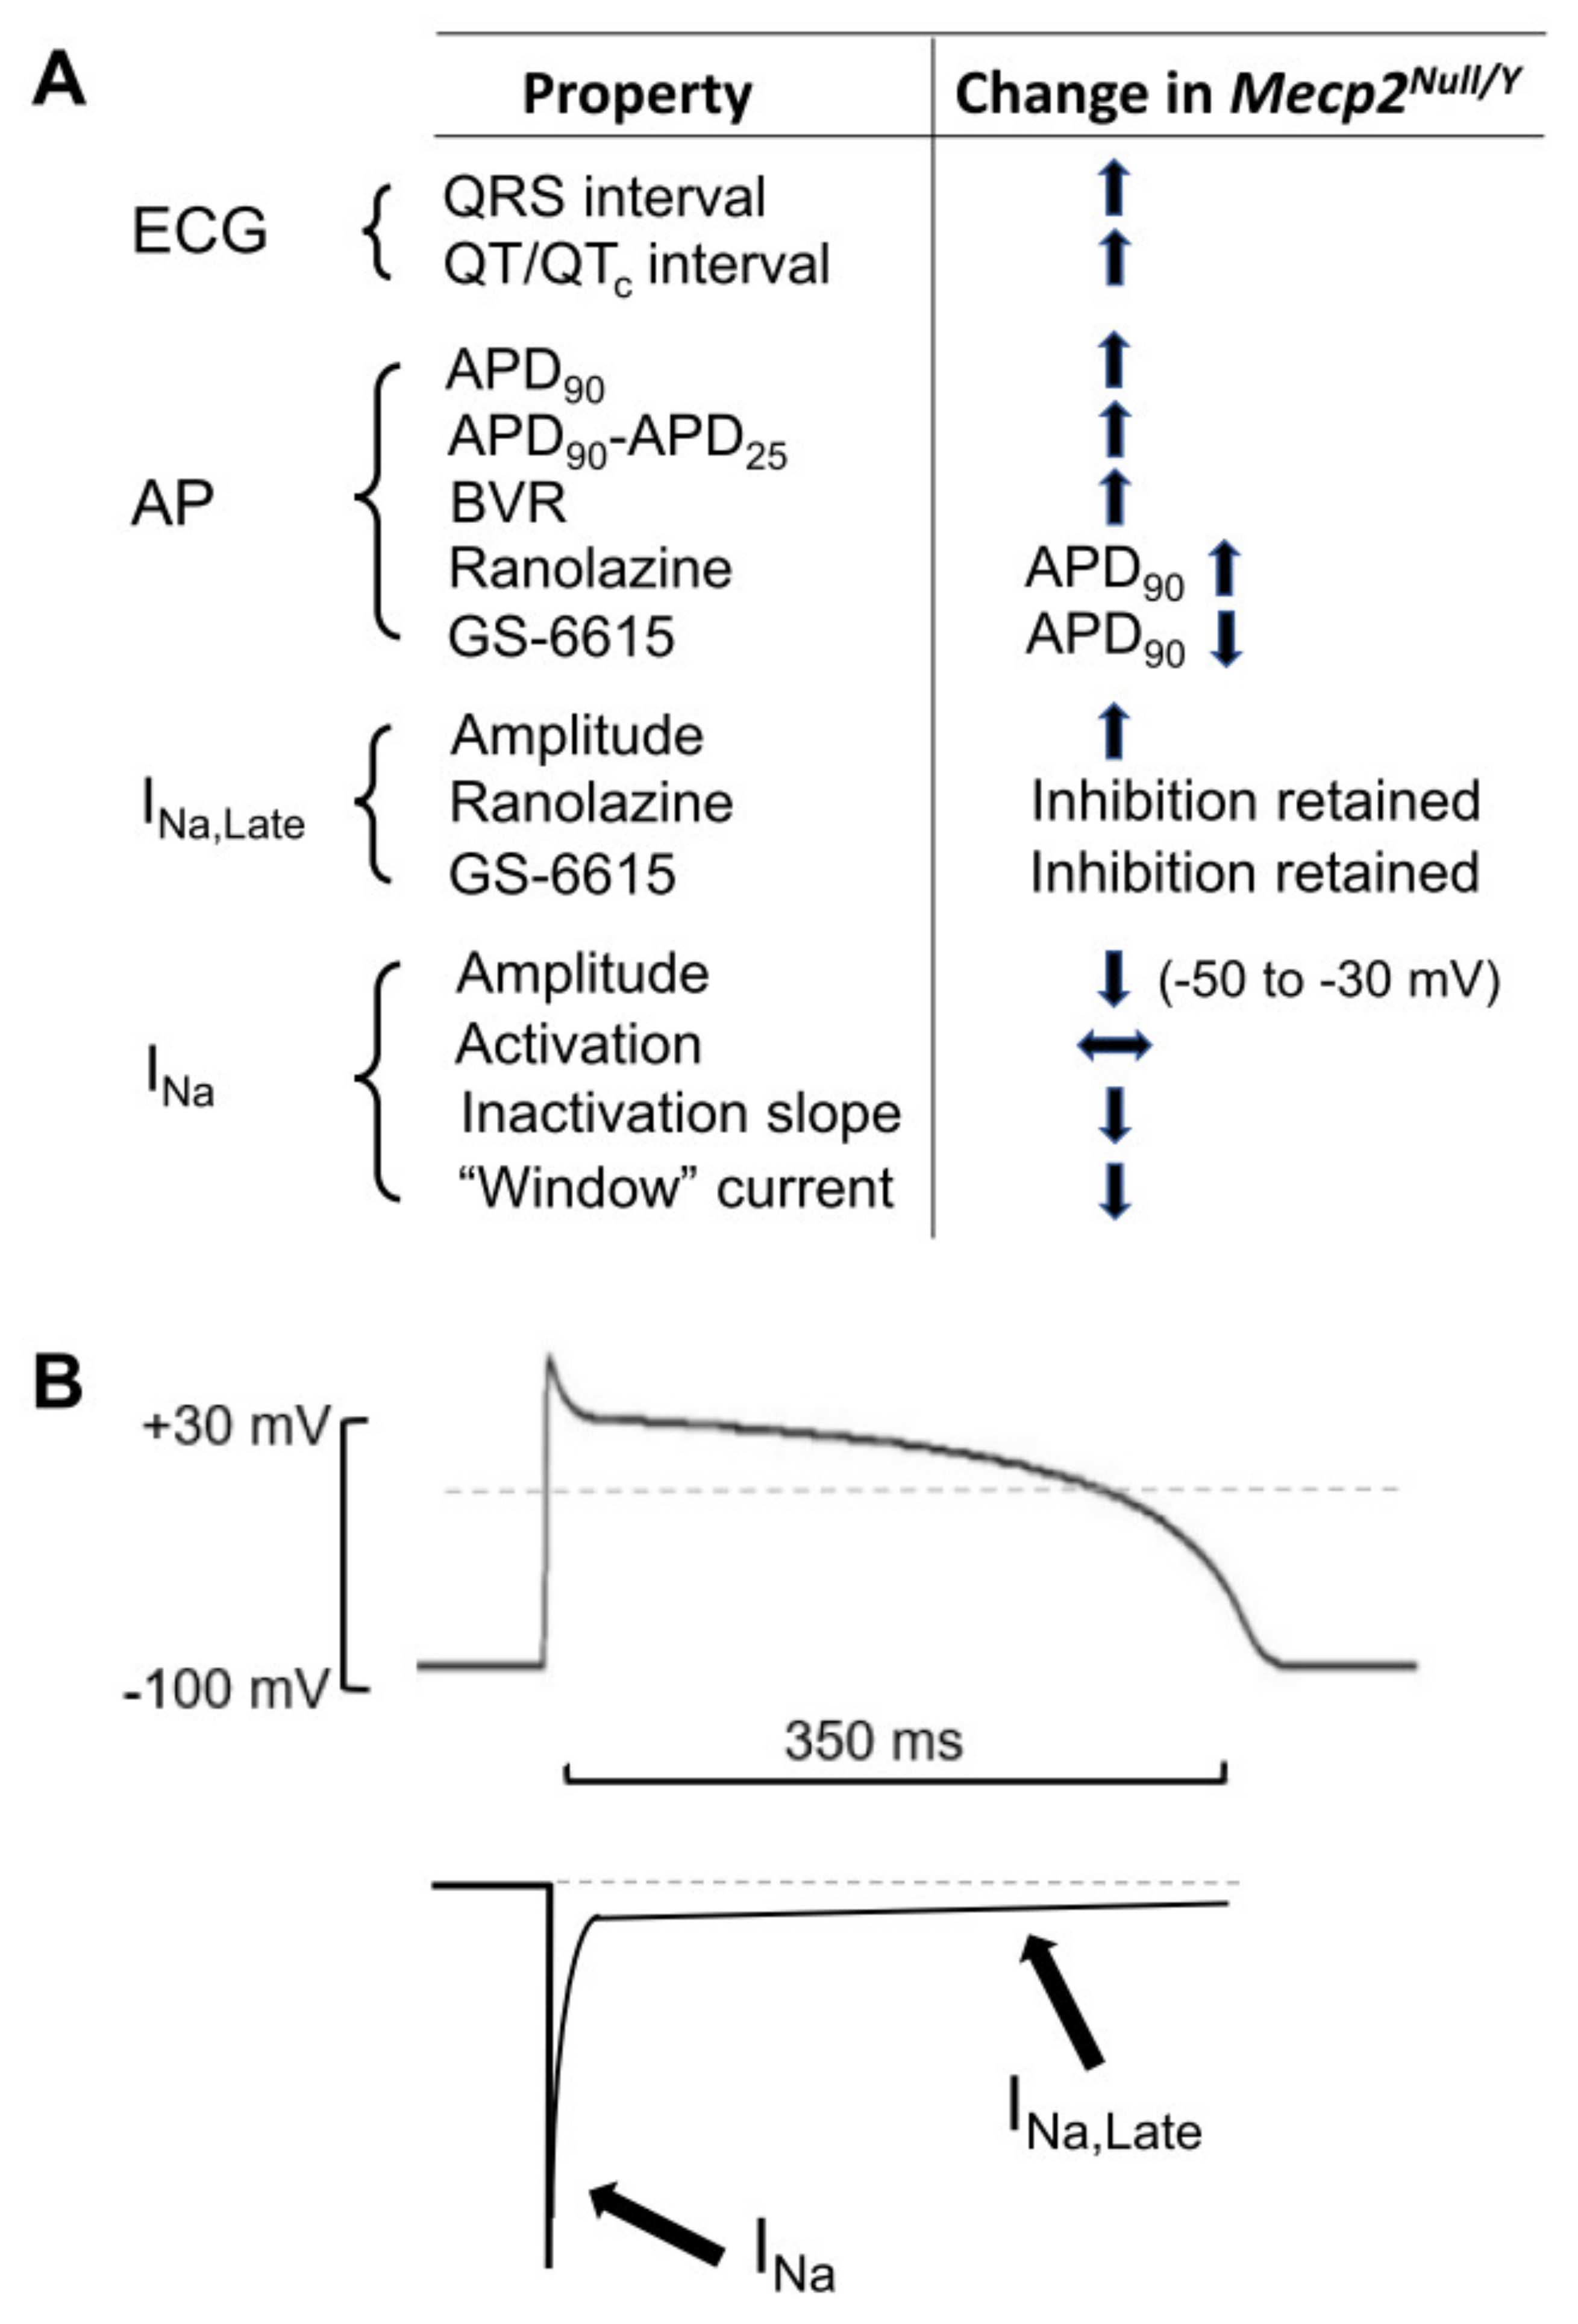
3.1. Summary of Main Findings

The principal findings of this study are summarized in diagrammatic form in Figure 8A. ECG measurements from Mecp2Null/Y animals showed statistically significant increases in QRS interval and in both uncorrected QT and rate-corrected QTc intervals, indicative of delayed ventricular repolarization in this model (Figure 8A and Table 1). Repolarization delay was also demonstrated directly through AP measurements from WT and Mecp2Null/Y ventricular myocytes. Time points up to and including APD50 were not significantly different between WT and Mecp2Null/Y myocytes, but both APD75 and APD90 were increased (Table 2). In consequence, the difference between APD25 and APD90, which provides an index of AP triangulation, was significantly increased in RTT myocytes (Table 2 and Figure 8A). Instability of APD90, measured as BVR, was also greater in Mecp2Null/Y myocytes (Figure 1D and Figure 8A). INa,Late was significantly increased in myocytes from the RTT model (Figure 3 and Figure 8A). In contrast, peak fast INa amplitude was significantly decreased in Mecp2Null/Y myocytes without significant change to voltage-dependent activation of the current (Figure 4 and Figure 8A). Comparison of voltage dependent inactivation of INa from WT and RTT myocytes showed no significant difference in inactivation V0.5, but the slope of the inactivation relation was steeper (evidenced by a significant decrease in the slope factor, k; Figure 5B). Consistent with the combination of decreased INa amplitude over some voltages and a steeper inactivation relation, simulated “window” current was smaller for the Mecp2Null/Y than WT condition (Figure 5C and Figure 8A). Minor additional changes to INa were a modest slowing of inactivation time course at −40 mV and a decrease in the fast time constant of recovery from inactivation (Section 2.3; Figure 5D). Our experiments have also shown that INa,Late from Mecp2Null/Y myocytes retains sensitivity to inhibition by ranolazine and GS-6615 (Figure 6 and Figure 8A); this was associated with AP abbreviation for GS-6615 but, unexpectedly, with AP prolongation for ranolazine (Figure 7 and Figure 8A).
Figure 8B illustrates, in schematic form, the relationship between each of fast INa and INa,Late and the ventricular AP (shown with a high plateau phase as occurs in humans). Fast INa flows during the AP upstroke, whilst INa,Late provides sustained inward current during the AP plateau phase. This schematic illustration may aid contextualization of aspects of our findings discussed below.

3.2. QT Interval and AP Prolongation

Although the prevalence of QTc interval prolongation in RTT patients varies between studies, it clear is that this ECG change does occur in some patients [13,14,15,16,17,18]. Moreover, the finding that serial ECG measurements within a single cohort have revealed increases during follow up in the number of those exhibiting prolonged QT intervals [17] indicates that a lack of QTc prolongation in a single ECG measurement may not be definitive, and therefore repeated testing over time may be prudent. The results of the present study have shown very similar ECG changes in Mecp2Null/Y animals to those found in the study of McCauley et al. [18]: QRS widening and QT/QTc interval prolongation. The lack of QTc prolongation in Mecp2Null/Y mice in the study by Hara et al. [24] is at variance with these findings, but measurements were made between 6 and 8 weeks of age and it is possible that the use of animals from earlier timepoints may have influenced the outcome. Two further studies have reported QT prolongation in RTT mice [19,20] and it is notable that this phenomenon has also been seen in a primate model [21]. An observation of QTc prolongation implies that underlying ventricular APs are also prolonged, but this is the first study to provide an explicit demonstration of delayed ventricular AP repolarization in cardiomyocytes from an experimental RTT model. The results of our experiments showed APD prolongation at measurement timepoints (APD75 and APD90) beyond APD50. The lack of significant AP prolongation at early timepoints during repolarization thus resulted in increased AP triangulation. This is significant because augmented AP triangulation is considered to represent a marker of increased proarrhythmic risk [44]. The larger APD90 BVR in Mecp2Null/Y than WT myocytes is indicative of increased AP instability, which can also act as a marker of proarrhythmic risk [44,45]. Our AP measurements also revealed two unexpected alterations that cannot be detected in ECG measurements: the threshold current required to evoke APs was lower in Mecp2Null/Y myocytes; there was also a small (<3 mV) depolarization of resting membrane potential. These alterations suggest that differences are likely to exist between WT and Mecp2Null/Y myocytes in addition to alterations in Na channel function (e.g., these two observations could be explained by a reduction in resting potassium conductance (s)). Whilst it was beyond the intended scope of this study to pursue the underlying ionic basis of those additional changes, future work to that end is warranted.

3.3. Changes to Fast INa and INa,Late

To our knowledge, this is the first study to identify changes to fast INa in the Mecp2Null/Y RTT model. A previous study included limited data on fast INa amplitude at a single test voltage, under recording conditions that were optimised for INa,Late, but not for fast INa [18] and saw no difference in current amplitude. In contrast, our experiments, performed under conditions that facilitate accurate recording of fast INa [32,33,34], revealed significant reductions in INa amplitude over the voltage range that encompassed maximal INa magnitude, without any significant alteration to voltage dependent activation V0.5 and with only a modest effect on the slope of voltage-dependent inactivation (Figure 4 and Figure 5). The reduction in INa amplitude may help explain QRS complex widening in the Mecp2Null/Y mouse ECG. The modest delay to INa inactivation time course may be supplemental to this effect.
However, changes to fast INa are unable to account for altered INa,Late in the Mecp2Null/Y RTT model. The fast sodium channel “window” current, denoted by the area of overlap between steady-state activation and inactivation relations, occurs over a range of membrane potentials within which the probability of availability and activation both exceed zero [46]. Noble and Noble have previously highlighted that whilst the INa window may contribute to a proportion of INa,Late, it cannot account for all of it; they noted that INa,Late flows at membrane voltages at which Hodgkin–Huxley models of INa would predict virtually no current [47]. The experiments in the present study have shown that the INa window was not increased (rather it was modestly decreased) in Mecp2Null/Y myocytes, and in consequence this cannot explain the increased INa,Late in myocytes from the RTT model. Fast INa and INa,Late can both be carried by Nav1.5 channels [46] and our experiments with A-803467 ruled out a role for Nav1.8 in the INa,Late recorded in this study. Previous single channel investigations of INa,Late have revealed “scattered” and “burst mode” channel openings [48,49,50] and it is notable that “scattered” and “burst mode” single channel behaviours have both been seen in recordings from recombinant Nav1.5 channels [50].
Children with RTT exhibit sympathovagal imbalance, with parasympathetic underactivity and sympathetic overactivity [51]. McCauley et al. reported that QT prolongation and INa,Late augmentation were observed both in a global Mecp2Null/Y model and in mice with selective nervous system Mecp2 knockout [18]. This suggests that the cardiac changes linked to repolarization delay are secondary to neural effects in this RTT model. It is therefore striking that ventricular AP prolongation and changes to INa and INa,Late can be measured from isolated ventricular myocytes. This indicates that, whatever the identity of the trigger(s) for these changes in the RTT model, they persist in myocytes that are not subject to acute neural modulation. In both humans and mice with RTT, it is thought that chronic intermittent desaturations and re-oxygenations caused by the respiratory abnormalities induce mitochondrial oxidative stress [52] and it is also known that INa.Late enhancement can occur in pathological states such as hypoxia and ischaemia, with reactive oxygen species (ROS) activation of CaMKII suggested to mediate current enhancement in such circumstances [46,53]. However, although the RTT mice in this study showed an altered respiration rate and the mean duration of apnoea episodes was significantly greater in Mecp2Null/Y mice, there was no correlation between APD90 values and apnoea length in our experiments. Mucerino and colleagues have reported alterations to the carnitine cycle in this mouse model of RTT, with upregulation of carnitine palmitoyl transferase 1A/B and carnitine acylcarnitine translocase in the hearts of Mecp2+/− mice [20]. Whether or not resultant changes in fatty acid metabolism could influence INa,Late is unknown at this time. Consequently, although our experiments have characterized the changes to INa and INa,Late in the Mecp2Null/Y RTT model, the underlying bases for these alterations remain to be elucidated.

3.4. Actions of Ranolazine and GS-6615

In the earlier study by McCauley and colleagues, β adrenoceptor blocker administration to this model of RTT did not reduce QTc interval or protect against arrhythmia provoked by programmed electrical stimulation (PES) [18]. By contrast, Mecp2Null/Y myocyte treatment with the anticonvulsant drug phenytoin decreased INa,Late, whilst injection of Mecp2Null/Y mice with phenytoin reduced QTc interval duration and ventricular arrhythmia susceptibility [18]. A subsequent study confirmed the beneficial effects of phenytoin Mecp2Null/Y mice (without any accompanying INa.Late experiments), but it also found that it worsened abnormal breathing patterns [19]. This compromises the suitability of phenytoin as a treatment for prolonged cardiac repolarization in RTT. Retrospective analysis of patients enrolled in the RTT Syndrome Natural History Study found 10 patients with prolonged QTc intervals that shortened after receiving antiepileptic drugs with Na+ channel inhibitory properties [19]. Our data constitute independent direct evidence of augmented INa,Late in a RTT model and taken together with this earlier work they highlight the utility of INa,Late inhibition as a potential therapeutic strategy for cases in which QTc prolongation is observed.
Both ranolazine and GS-6615 are of interest as INa,Late-targeting antiarrhythmic agents [35,36,37,38,42,43]; both drugs were observed in our experiments to inhibit INa,Late in ventricular myocytes from WT and RTT animals and to restore INa,Late in Mecp2Null/Y myocytes to control levels. The binding of both ranolazine and GS-6615 to Nav1.5 channels is sensitive to mutation of aromatic amino-acid residues that contribute to the local anaesthetic (LA) binding site on the channel [43,54]. The retained sensitivity of INa,Late from Mecp2Null/Y myocytes to both agents seen here suggests that the LA binding site is unaffected in this RTT model. The finding of prolongation rather than abbreviation of APs by ranolazine suggests that in addition to INa,Late inhibition, the drug exerted effect(s) on additional ionic current(s) that influence murine AP repolarization. An independent study has also reported murine ventricular AP prolongation with ranolazine, but did not pursue the underlying reason for this [55]. Ranolazine is known to inhibit the hERG-mediated rapid delayed rectifier K+ current, IKr [56,57,58]. However, IKr does not contribute to murine ventricular repolarization [59] and so cannot account for the observed AP prolongation. Indeed, known differences between the K+ currents that mediate human and mouse ventricular repolarization [59] make it difficult to extrapolate pharmacological murine AP prolongation to humans. It is notable, however, that LQT3 patients respond to ranolazine with QTc interval shortening [60] and so it remains possible that in humans and species with a human-like complement of repolarizing currents ranolazine could abbreviate repolarization in the RTT setting.
With its enhanced INa,Late selectivity and demonstrated effectiveness at inhibiting LQT3 mutant Na channels (e.g., [43]), GS-6615 is a potentially attractive agent for mitigating effects of delayed ventricular repolarization. Its actions are abrogated by mutations (F1760A/Y1767A) at the local anaesthetic binding site on Nav 1.5 [43]. In our experiments it both inhibited INa,Late and abbreviated ventricular AP duration. APD abbreviation was associated with a reduction in AP triangulation in Mecp2Null/Y myocytes. These findings highlight a potential for GS-6615 to be used in RTT-associated QTc prolongation. Further work is warranted to determine its ability to inhibit provocation of ventricular arrhythmias in the intact heart of this RTT model.

3.5. Limitations and Conclusions

Although most human RTT patients are female with few boys surviving beyond one year of age [4], this study was conducted on male Mecp2Null/Y mice. Female mice from this strain are heterozygous for Mecp2 deletion (Mecp2+/−) and in consequence their clinical phenotype develops rather more slowly than in males: QTc prolongation in Mecp2+/- animals was absent at 4 months, but present at 10 months in the study by McCauley and colleagues [18]. A more recent study found that at 11 months some Mecp2+/- females display QTc prolongation and others do not [20]. These features make characterization of repolarization and repolarization-linked changes INa/INa,Late much more challenging and costly in females than in males. The reported similarity between ECG changes in older Mecp2+/- and younger Mecp2Null/Y mice [18], gives confidence in the use of Mecp2Null/Y mice for studying repolarization changes in the model. Both the study of McCauley et al. and our own have identified changes to QRS interval width as well as QTc interval in the Mecp2Null/Y model. Our data on fast INa highlight changes to this in RTT myocytes that may underpin or substantially contribute to QRS changes. However, whilst the earlier study investigated arrhythmias induced by programmed electrical stimulation, neither investigation involved conduction mapping and it would thus be useful in future work to perform such mapping to establish whether alterations to INa in the model result in altered conduction. Our experiments on GS-6615 and ranolazine focused on acute application to isolated ventricular myocytes. Further work is now required at the intact heart and chronic in vivo exposure levels to establish the ability of GS-6615 to protect against QTc-linked arrhythmia susceptibility. In the case of ranolazine, further exploration in a non-murine RTT model with ventricular AP repolarization mechanisms closer to those in humans would be useful to explore further its utility in RTT. While it is important that such limitations are acknowledged, they do not diminish the principal findings of this investigation in relation to ECG and AP changes indicative of delayed repolarization in this model of RTT and the changes to INa, INa,Late and drug responses that we report. As has been highlighted elsewhere, QT/QTc interval prolongation in RTT is of interest not only due to the association of the syndrome with sudden death, but also because of the use in RTT patients of drugs linked to QTc interval prolongation (serotonin-selective reuptake inhibitors, SSRIs) and a need to monitor QTc prolongation in drug trials [61]. The present study extends information on ionic mechanisms underlying delayed repolarization in RTT. Future work is clearly now needed to elucidate the underlying mechanism for INa,Late augmentation in this RTT model and to establish the therapeutic value of the potential approaches to mitigating QTc prolongation suggested by our findings.

4. Materials and Methods

4.1. Mouse Model of RTT Used

All experiments were conducted in accord with UK Home Office legislation and were approved by the University of Bristol Animal Welfare Ethical Review Body (AWERB). Studies were performed on male Mecp2Null/Y mice with deletions of the third and fourth exons (the so-called “Bird” strain [62]), at between 8 and 10 weeks of age, and on wild-type age-matched male littermates. Mice were genotyped using a standard protocol (P Protocol 24870: Standard PCR Assay-Mecp2<tm1.1Bird> Version 6.2). https://www.jax.org/Protocol?stockNumber=003890&protocolID=24870 (accessed/link confirmed live on 17 April 2022). The following primers were used: common-AAA TTG GGT TAC ACC GCT GA; mutant reverse-CCA CCT AGC CTG CCT GTA CT; wild-type reverse-CTG TAT CCT TGG GTC AAG CTG.

4.2. Electrocardiogram (ECG) Measurement

Mice were anaesthetized by 1.5% isoflurane and ECG measurements were obtained 5 min after anaesthesia had been established. Surface lead II ECG measurements were made using subcutaneous needle electrodes, with recording using an A-M Systems (Sequim, WA, USA) differential AC amplifier model 1700 and an CED (Cambridge, UK) Micro 1401-3 AD/DA converter. Signals were high-pass filtered at 10 Hz, with a low-pass setting of 1 kHz. The following ECG parameters were analysed: RR interval (and from this heart rate); PR interval; QRS interval; QT interval (and from this, rate-corrected QT (QTc) interval); respiration rate (breathing was evident as brief periods of high frequency interference on the ECG recording). Mean values for each ECG parameter for each mouse were obtained from 5 consecutive ECG complexes, avoiding complexes upon which breathing noise was superimposed. The QT interval duration was determined as the interval between onset of the QRS complex and time point after the T-wave peak [18]. QTc interval values were obtained using two distinct rate correction methods (for Equation (1) [25,26]; for Equation (2) [18]):
QTc = QT/(RR/100)0.5
QTc = QT + 0.3173(170-RR)

4.3. Unrestrained Whole Body Plethysmography

Respiratory patterns were monitored using unrestrained whole-body plethysmography (Emka Technologies, Paris, France). Unanaesthetised individual mice were placed in a mouse chamber (396 mL) with a bias flow of 0.7–0.8 L/min. Chamber pressure, temperature and humidity were measured to allow accurate calculation of respiratory flow. Mice were allowed to adapt for the first 20 min, and data was analysed in the subsequent 20 min of recording. Analysis was automated and manually checked by an experienced researcher. Timeseries respiratory flow data was analysed using published custom written ‘algorhythms’ in Spike 2 (V8.22, Cambridge Electronic Design, Cambridge, UK) [63]. A running average of the total expiration time for each breath was taken every minute. If an expiration time was longer than 4 times this average, it was counted as an apnoea. Both apnoea count (number of episodes in 20 min) and length (duration of each episode) were recorded. Comparisons were made between Mecp2Null/Y and WT control mice.

4.4. Ventricular Myocyte Isolation

Animals were killed by cervical dislocation, and the heart was then rapidly excised and placed in ice-cold isolation solution supplemented with 0.1 mM CaCl2 and 10 U/mL heparin. The isolation solution contained (in mM) 130 NaCl, 5.4 KCl, 0.4 NaH2PO4, 4.2 HEPES, 10 glucose, 1.4 MgCl2, 20 taurine, and 10 creatine (pH 7.4 with NaOH) [64]. The heart was Langendorff perfused at 37 oC at constant pressure of gravity (~80–100 cm H2O) with isolation solution for 3 min followed by enzyme solution (isolation solution plus 0.1 mM CaCl2, 0.07 mg/mL protease (Sigma, Type XIV), and 0.7 mg/mL collagenase (Worthington, Type 1)) for 15 min. The ventricles were removed and shaken in enzyme solution for 5 min before being filtered and centrifuged. Cells were resuspended in isolation solution plus 0.1 mM CaCl2 and stored at room temperature for using within 10 h.

4.5. Cellular Electrophysiology

Ventricular myocytes were placed in an experimental chamber mounted on an inverted microscope (Nikon Eclipse TE2000-U) and were superfused with a Tyrode’s solution containing (in mM): 140 NaCl, 4 KCl, 1.5 CaCl2, 1 MgCl2, 10 glucose, 5 HEPES (pH 7.4 with NaOH). During experimental recordings, solutions were applied to the cell under investigation using a home-built device that was able to exchange local superfusate within 1 s [65]. Patch pipettes were made from borosilicate glass (A-M Systems Inc, Sequim, WA, USA) pulled and fire polished to resistances of 2–3 MΩ (PP-830 and MF83, Narishige, Tokyo, Japan). For whole cell current recording, series resistance values were typically compensated by >70%. Protocols were generated and data recorded online with pClamp 10 and a Digidata 1440A interface (Molecular Devices, San Jose, CA, USA). The digitization rate was 10 kHz. Further details of specific electrophysiological experiments are given below.

4.6. Action Potential (AP) Measurement

APs were elicited from single ventricular myocytes placed in the recording chamber of an inverted microscope by brief (3 ms) depolarizing current injection in whole cell patch clamp recordings (membrane potential recording mode) using a stimulus application frequency of 1 Hz. The threshold amplitude for these current pulses is given in Results Table 2. For these experiments, ventricular myocyte preparations were superfused with an external solution containing (in mM): 140 NaCl, 4 KCl, 1.5 CaCl2, 1 MgCl2, 10 glucose, 5 HEPES (pH 7.4 with NaOH). The pipette solution for these experiments contained (in mM): 110 KCl, 10 NaCl, 0.4 MgCl2, 10 HEPES, 5 glucose, 5 K2ATP, 0.5 GTP-Tris (pH 7.1 with KOH). AP recordings were made at 35–37 °C. Beat-to-beat variability of AP repolarization (BVR) was quantified at 90% of AP repolarization (APD90) for 10–15 consecutive action potentials, as:
BVR = ∑(|APD90(n + 1) − APD90(n)|)/(n beats × √2)

4.7. INa,Late Measurement

For INa,Late recordings, pipettes were filled with a solution containing (in mM): 130 CsCl, 10 NaCl, 10 HEPES, 10 EGTA (pH 7.4 with CsOH). Control superfusate contained (in mM): 130 NaCl, 10 CsCl, 1 MgCl2, 10 HEPES, 10 Glucose, 1 4-AP (pH 7.4 with NaOH). To obtain INa,Late as Na+o sensitive current, external Na+ was replaced with equimolar N-methyl-D-glucamine (NMDG; pH 7.4 with HCl). INa,Late was elicited by a voltage protocol comprised of a 1 s voltage command to -20 mV from a holding potential of –120 mV (pulse frequency of 0.1 Hz) and measurements were made at room temperature (cf [18]).

4.8. INa Measurement

Fast INa recordings were made using symmetrical (5 mM) [Na+] [66]. The external solution contained (in mM): 140 CsCl, 5 NaCl, 10 Glucose, 10 HEPES, 1 CoCl2, 1 MgCl2, 1 CaCl2 (pH 7.3 with CsOH). The pipette solution for these experiments contained (in mM): 110 CsF, 20 CsCl, 5 NaCl, 5 HEPES, 5 EGTA, 1 MgCl2, 5 Mg-ATP, pH 7.2 with CsOH [66]. Fast INa measurements were made at room temperature. The specific voltage protocols used to characterize INa are described in the Results section. The data were analysed used the equations below.
In order to quantify the voltage dependence of activation, INa amplitude data obtained from current voltage (I–V) protocols (see Figure 4, Results) were used to obtain conductance (G) values:
G = INa/(Vm − Erev)
where Vm is the command voltage potential and Erev is the reversal potential extrapolated from the ascending limb of the INa I–V relation.
Activation relations for INa were obtained by plotting G/Gmax (where Gmax is the maximum value of G obtained during the I–V protocol) against Vm values across the range from −80 mV to −20 mV. The resultant plots were then fitted with a Boltzmann equation of the form:
G/Gmax = 1/[1 + exp((V0.5 − Vm)/k)]
where V0.5 = half-maximal activation voltage and k = slope factor for the fitted relation.
To quantify voltage-dependent inactivation of INa, the following equation was used:
I/IMax = 1 − (1/[1 + exp((V0.5 − Vm)/k)])
where I = measured INa magnitude during a command to −40 mV following a test pulse to voltage Vm (Figure 5, Results). Imax = maximal INa observed during the −40 mV command during the protocol, V0.5 = half-maximal inactivation voltage and k = slope factor for the fitted relationship, between −150 and −50 mV.
The INa window was obtained by using the experimentally derived activation and inactivation V0.5 and k values and equations 4 and 5 to calculate activation and inactivation variables at 2 mV intervals between −120 mV and +20 mV. The product of activation and inactivation variables was then multiplied by the experimentally obtained Gmax and driving force at each test voltage. The resulting plots represented the INa window under WT and RTT conditions.
In order to evaluate recovery of INa from inactivation, a paired pulse protocol was used in which two depolarizing commands from −120 mV to −40 mV were applied. The first (1 s duration) pulse (P1) activated then inactivated INa. The second voltage command (to −40 mV for 40 ms; P2) was separated from the first by interpulse intervals of differing durations (0.1, 0.3, 1, 3.2, 10, 31.6, 100, 316.2, 1000, 3162 ms). The data were fitted with the following equation:
INa(P2/P1) (t) = 1 − (Afexp(−t/τfast) + Asexp(−t/τslow))
where INa(P2/P1) is the ratio of INa elicited by P2 applied after a time interval ‘t’ following P1. Af represents the proportion of recovery fitted by a fast time constant τfast and As represents the proportion of recovery fitted by a fast time constant τslow.

4.9. Data Analysis and Statistics

Data are presented as mean ± SEM. The numbers of myocytes and animals from which particular datasets were derived are given in the relevant Results text and figure legends. Statistical analysis and fits to datasets were performed using Microsoft Excel (Microsoft Corporation, USA), Prism 8.4.3 (Graphpad Software Inc., San Diego, CA, USA) Origin 7.0 (OriginLab, Northampton, MA, USA), and Clampfit of pClamp 10.7 (Molecular Devices, San Jose, CA, USA). Statistical comparisons were made using paired t-test, unpaired t-test, one-way or two-way ANOVA followed by a Tukey/Bonferroni post-test, with equal or unequal variances as appropriate. p < 0.05 was taken as statistically significant.

4.10. Drugs

Ranolazine dihydrochloride was obtained from Sequoia Research products Ltd., and 30 mM stock solution was made in distilled water. GS-6615 (also known as eleclazine) was obtained from SYNthesis Med Chem, and 10 mM stock solution was made in DMSO. A-803467 was obtained from Sigma-Aldrich, and 1 mM stock solution was made in DMSO. All stock solutions were stored at −20 °C. Stock solutions were diluted with the external solutions to obtain the final concentrations as given in the Results.

Author Contributions

Conceptualization: J.C.H. and A.P.A.; Funding acquisition: J.C.H., A.P.A. and A.F.J.; Supervision: J.C.H., A.P.A. and A.F.J.; Experimental Design: J.C.H., A.P.A., A.F.J. and H.C.; Data acquisition and analysis: H.C. and I.C.; Manuscript drafting: J.C.H., A.P.A., H.C., A.F.J. and I.C. All authors have read and agreed to the published version of the manuscript.

Funding

This research was funded by the British Heart Foundation PG/16/55/32277.

Data Availability Statement

Data are available on reasonable request to the corresponding authors.

Conflicts of Interest

The authors declare no conflict of interest.

References

  1. Rett, A. On a remarkable syndrome of cerebral atrophy associated with hyperammonaemia in childhood. Wien. Med. Wochenschr. 2016, 166, 322–324. [Google Scholar] [CrossRef] [PubMed] [Green Version]
  2. Rett, A. [Hyperammonaemia and cerebral atrophy in childhood]. Folia Hered. Pathol. 1969, 18, 115–123. [Google Scholar]
  3. Neul, J.L.; Kaufmann, W.E.; Glaze, D.G.; Christodoulou, J.; Clarke, A.J.; Bahi-Buisson, N.; Leonard, H.; Bailey, M.E.S.; Schanen, N.C.; Zappella, M.; et al. Rett syndrome: Revised diagnostic criteria and nomenclature. Ann. Neurol. 2010, 68, 944–950. [Google Scholar] [CrossRef] [PubMed] [Green Version]
  4. Liyanage, V.R.; Rastegar, M. Rett syndrome and MeCP2. Neuromolecular. Med. 2014, 16, 231–264. [Google Scholar] [CrossRef] [Green Version]
  5. Ramirez, J.-M.; Ward, C.S.; Neul, J.L. Breathing challenges in Rett Syndrome: Lessons learned from humans and animal models. Respir. Physiol. Neurobiol. 2013, 189, 280–287. [Google Scholar] [CrossRef] [Green Version]
  6. Amir, R.E.; Van, V.I.; Wan, M.; Tran, C.Q.; Francke, U.; Zoghbi, H.Y. Rett syndrome is caused by mutations in X-linked MECP2, encoding methyl-CpG-binding protein 2. Nat. Genet. 1999, 23, 185–188. [Google Scholar] [CrossRef]
  7. Kim, S.J.; Cook, E.H., Jr. Novel de novo nonsense mutation of MECP2 in a patient with Rett syndrome. Hum. Mutat. 2000, 15, 382–383. [Google Scholar] [CrossRef]
  8. Huppke, P.; Laccone, F.; Kramer, N.; Engel, W.; Hanefeld, F. Rett syndrome: Analysis of MECP2 and clinical characterization of 31 patients. Hum. Mol. Genet. 2000, 22, 1369–1375. [Google Scholar] [CrossRef]
  9. Bienvenu, T.; Carrié, A.; de Roux, N.; Vinet, M.-C.; Jonveaux, P.; Couvert, P.; Villard, L.; Arzimanoglou, A.; Beldjord, C.; Fontes, M.; et al. MECP2 mutations account for most cases of typical forms of Rett syndrome. Hum. Mol. Genet. 2000, 9, 1377–1384. [Google Scholar] [CrossRef]
  10. Neul, J.L.; Fang, P.; Barrish, J.; Lane, J.; Caeg, E.B.; Smith, E.O.; Zoghbi, H.; Percy, A.; Glaze, D.G. Specific mutations in methyl-CpG-binding protein 2 confer different severity in Rett syndrome. Neurology 2008, 70, 1313–1321. [Google Scholar] [CrossRef] [Green Version]
  11. Moog, U.; Smeets, E.E.; van Roozendaal, K.E.; Schoenmakers, S.; Herbergs, J.; Schoonbrood-Lenssen, A.M.; Schrander-Stumpel, C.T. Neurodevelopmental disorders in males related to the gene causing Rett syndrome in females (MECP2). Eur. J. Paediatr. Neurol. 2003, 7, 5–12. [Google Scholar] [CrossRef]
  12. Kerr, A.M.; Armstrong, D.D.; Prescott, R.J.; Doyle, D.; Kearney, D.L. Rett syndrome: Analysis of deaths in the British survey. Eur. Child Adolesc. Psychiatry 1997, 6, 71–74. [Google Scholar] [PubMed]
  13. Sekul, E.A.; Moak, J.P.; Schultz, R.J.; Glaze, D.G.; Dunn, J.K.; Percy, A.K. Electrocardiographic findings in Rett syndrome: An explanation for sudden death? J. Pediatr. 1994, 125, 80–82. [Google Scholar] [CrossRef]
  14. Ellaway, C.J.; Sholler, G.; Leonard, H.; Christodoulou, J. Prolonged QT interval in Rett syndrome. Arch. Dis. Child 1999, 80, 470–472. [Google Scholar] [CrossRef] [Green Version]
  15. Guideri, F.; Acampa, M.; DiPerri, T.; Zappella, M.; Hayek, Y. Progressive cardiac dysautonomia observed in patients affected by classic Rett syndrome and not in the preserved speech variant. J. Child Neurol. 2001, 16, 370–373. [Google Scholar] [CrossRef] [PubMed]
  16. Crosson, J.; Srivastava, S.; Bibat, G.M.; Gupta, S.; Kantipuly, A.; Smith-Hicks, C.; Myers, S.M.; Sanyal, A.; Yenokyan, G.; Brenner, J.; et al. Evaluation of QTc in Rett syndrome: Correlation with age, severity, and genotype. Am. J. Med. Genet. Part A 2017, 173, 1495–1501. [Google Scholar] [CrossRef]
  17. Clark, B.C.; Kopp, A.; Morey, W.; Djukic, A. Serial follow-up of corrected QT interval in Rett syndrome. Dev. Med. Child Neurol. 2020, 62, 833–836. [Google Scholar] [CrossRef]
  18. McCauley, M.D.; Wang, T.; Mike, E.; Herrera, J.; Beavers, D.L.; Huang, T.-W.; Ward, C.S.; Skinner, S.; Percy, A.K.; Glaze, D.G.; et al. Pathogenesis of Lethal Cardiac Arrhythmias in Mecp2 Mutant Mice: Implication for Therapy in Rett Syndrome. Sci. Transl. Med. 2011, 3, 113ra125. [Google Scholar] [CrossRef] [Green Version]
  19. Herrera, J.A.; Ward, C.S.; Pitcher, M.R.; Percy, A.K.; Skinner, S.; Kaufmann, W.E.; Glaze, D.G.; Wehrens, X.H.T.; Neul, J.L. Treatment of cardiac arrhythmias in a mouse model of Rett syndrome with Na+-channel-blocking antiepileptic drugs. Dis. Model. Mech. 2015, 8, 363–371. [Google Scholar]
  20. Mucerino, S.; Di Salle, A.; Alessio, N.; Margarucci, S.; Nicolai, R.; Melone, M.A.B.; Galderisi, U.; Peluso, G. Alterations in the carnitine cycle in a mouse model of Rett syndrome. Sci. Rep. 2017, 7, 41824. [Google Scholar] [CrossRef] [Green Version]
  21. Chen, Y.; Yu, J.; Niu, Y.; Qin, D.; Liu, H.; Li, G.; Hu, Y.; Wang, J.; Lu, Y.; Kang, Y.; et al. Modeling Rett Syndrome Using TALEN-Edited MECP2 Mutant Cynomolgus Monkeys. Cell 2017, 169, 945–955.e10. [Google Scholar] [CrossRef] [PubMed] [Green Version]
  22. Chapleau, C.A.; Lane, J.; Larimore, J.; Li, W.; Pozzo-Miller, L.; Percy, A.K. Recent progress in Rett syndrome and MECP2 dysfunction: Assessment of potential treatment options. Futur. Neurol. 2013, 8, 21–28. [Google Scholar] [CrossRef] [PubMed] [Green Version]
  23. Guy, J.; Gan, J.; Selfridge, J.; Cobb, S.; Bird, A. Reversal of Neurological Defects in a Mouse Model of Rett Syndrome. Science 2007, 315, 1143–1147. [Google Scholar] [CrossRef] [PubMed] [Green Version]
  24. Hara, M.; Takahashi, T.; Mitsumasu, C.; Igata, S.; Takano, M.; Minami, T.; Yasukawa, H.; Okayama, H.; Nakamura, K.; Okabe, Y.; et al. Disturbance of cardiac gene expression and cardiomyocyte structure predisposes Mecp2-null mice to arrhythmias. Sci. Rep. 2015, 5, 11204. [Google Scholar] [CrossRef] [PubMed] [Green Version]
  25. Mitchell, G.F.; Jeron, A.; Koren, G. Measurement of heart rate and Q-T interval in the conscious mouse. Am. J. Physiol. 1998, 274, H747–H751. [Google Scholar] [CrossRef]
  26. Speerschneider, T.; Thomsen, M.B. Physiology and analysis of the electrocardiographic T wave in mice. Acta Physiol. 2013, 209, 262–271. [Google Scholar] [CrossRef] [PubMed]
  27. Abdala, A.P.; Lioy, D.T.; Garg, S.K.; Knopp, S.J.; Paton, J.F.R.; Bissonnette, J.M. Effect of Sarizotan, a 5-HT1aand D2-Like Receptor Agonist, on Respiration in Three Mouse Models of Rett Syndrome. Am. J. Respir. Cell Mol. Biol. 2014, 50, 1031–1039. [Google Scholar] [CrossRef] [Green Version]
  28. Varró, A.; Tomek, J.; Nagy, N.; Virág, L.; Passini, E.; Rodriguez, B.; Baczkó, I. Cardiac transmembrane ion channels and action potentials: Cellular physiology and arrhythmogenic behavior. Physiol. Rev. 2021, 101, 1083–1176. [Google Scholar] [CrossRef]
  29. Derangeon, M.; Montnach, J.; Baró, I.; Charpentier, F. Mouse Models of SCN5A-Related Cardiac Arrhythmias. Front. Physiol. 2012, 3, 210. [Google Scholar] [CrossRef] [Green Version]
  30. Zaza, A. [The late sodium current: Pathophysiology and pharmacology of a new therapeu-tic target]. G. Ital. Cardiol. 2011, 10, 3S–11S. [Google Scholar]
  31. Yang, T.; Atack, T.C.; Stroud, D.M.; Zhang, W.; Hall, L.; Roden, D.M. Blocking Scn10a Channels in Heart Reduces Late Sodium Current and Is Antiarrhythmic. Circ. Res. 2012, 111, 322–332. [Google Scholar] [CrossRef] [PubMed] [Green Version]
  32. Yuill, K.H.; Convery, M.K.; Dooley, P.C.; Doggrell, S.A.; Hancox, J.C. Effects of BDF 9198 on action potentials and ionic currents from guinea-pig isolated ventricular myocytes. J. Cereb. Blood Flow Metab. 2000, 130, 1753–1766. [Google Scholar] [CrossRef] [PubMed] [Green Version]
  33. Spencer, C.I.; Yuill, K.H.; Borg, J.J.; Hancox, J.C.; Kozlowski, R.Z. Actions of pyrethroid insecticides on sodium currents, action potentials and contractile rhythm in isolated mammalian ventricular myocytes and perfused hearts. J. Pharmacol. Exp. Ther. 2001, 298, 1067–1082. [Google Scholar] [PubMed]
  34. Caves, R.E.; Carpenter, A.; Choisy, S.C.; Clennell, B.; Cheng, H.; McNiff, C.; Mann, B.; Milnes, J.T.; Hancox, J.C.; James, A.F. Inhibition of voltage-gated Na+ currents by eleclazine in rat atrial and ventricular myocytes. Heart Rhythm O2 2020, 1, 206–214. [Google Scholar] [CrossRef]
  35. Hancox, J.C.; Doggrell, S.A. Perspective: Does ranolazine have potential for the treatment of atrial fibrillation? Expert Opin. Investig. Drugs 2010, 19, 1465–1474. [Google Scholar] [CrossRef]
  36. Dhalla, A.K.; Wang, W.-Q.; Dow, J.; Shryock, J.C.; Belardinelli, L.; Bhandari, A.; Kloner, R.A. Ranolazine, an antianginal agent, markedly reduces ventricular arrhythmias induced by ischemia and ischemia-reperfusion. Am. J. Physiol. Circ. Physiol. 2009, 297, H1923–H1929. [Google Scholar] [CrossRef] [Green Version]
  37. Murdock, D.K.; Kersten, M.; Kaliebe, J.; Larrain, G. The Use Of Oral Ranolazine To Convert New Or Paroxysmal Atrial Fibrillation: A Review Of Experience With Implications For Possible “Pill In The Pocket” Approach To Atrial Fibrillation. Indian Pacing Electrophysiol. J. 2009, 9, 260–267. [Google Scholar]
  38. Sicouri, S.; Glass, A.; Belardinelli, L.; Antzelevitch, C. Antiarrhythmic effects of ranolazine in canine pulmonary vein sleeve preparations. Heart Rhythm 2008, 5, 1019–1026. [Google Scholar] [CrossRef] [Green Version]
  39. Caves, R.E.; Cheng, H.; Choisy, S.C.; Gadeberg, H.C.; Bryant, S.M.; Hancox, J.C.; James, A.F. Atrial-ventricular differences in rabbit cardiac voltage-gated Na + currents: Basis for atrial-selective block by ranolazine. Heart Rhythm 2017, 14, 1657–1664. [Google Scholar] [CrossRef]
  40. Rajamani, S.; El-Bizri, N.; Shryock, J.C.; Makielski, J.C.; Belardinelli, L. Use-dependent block of cardiac late Na+ current by ranolazine. Heart Rhythm 2009, 6, 1625–1631. [Google Scholar] [CrossRef] [Green Version]
  41. Wu, L.; Rajamani, S.; Li, H.; January, C.T.; Shryock, J.C.; Belardinelli, L. Reduction of repolarization reserve unmasks the proarrhythmic role of endogenous late Na+ current in the heart. Am. J. Physiol. Circ. Physiol. 2009, 297, H1048–H1057. [Google Scholar] [CrossRef] [PubMed] [Green Version]
  42. Zablocki, J.A.; Elzein, E.; Li, X.; Koltun, D.O.; Parkhill, E.Q.; Kobayashi, T.; Martinez, R.; Corkey, B.; Jiang, H.; Perry, T.; et al. Discovery of Dihydrobenzoxazepinone (GS-6615) Late Sodium Current Inhibitor (Late INai), a Phase II Agent with Demonstrated Preclinical Anti-Ischemic and Antiarrhythmic Properties. J. Med. Chem. 2016, 59, 9005–9017. [Google Scholar] [CrossRef] [PubMed]
  43. El-Bizri, N.; Xie, C.; Liu, L.; Limberis, J.; Krause, M.; Hirakawa, R.; Nguyen, S.; Tabuena, D.R.; Belardinelli, L.; Kahlig, K.M. Eleclazine exhibits enhanced selectivity for long QT syndrome type 3–associated late Na + current. Heart Rhythm 2018, 15, 277–286. [Google Scholar] [CrossRef] [PubMed]
  44. Hondeghem, L.M.; Carlsson, L.; Duker, G. Instability and Triangulation of the Action Potential Predict Serious Proarrhythmia, but Action Potential Duration Prolongation Is Antiarrhythmic. Circulation 2001, 103, 2004–2013. [Google Scholar] [CrossRef] [PubMed] [Green Version]
  45. Hondeghem, L.M. Relative Contributions of TRIaD and QT to Proarrhythmia. J. Cardiovasc. Electrophysiol. 2007, 18, 655–657. [Google Scholar] [CrossRef]
  46. Zaza, A.; Rocchetti, M. The Late Na+ Current-Origin and Pathophysiological Relevance. Cardiovasc. Drugs Ther. 2013, 27, 61–68. [Google Scholar] [CrossRef] [PubMed] [Green Version]
  47. Noble, D.; Noble, P. Late sodium current in the pathophysiology of cardiovascular disease: Consequences of sodium-calcium overload. Heart 2006, 92, iv1–iv5. [Google Scholar] [CrossRef]
  48. Kiyosue, T.; Arita, M. Late sodium current and its contribution to action potential configuration in guinea pig ventricular myocytes. Circ. Res. 1989, 6, 389–397. [Google Scholar] [CrossRef] [Green Version]
  49. Patlak, J.B.; Ortiz, M. Slow currents through single sodium channels of the adult rat heart. J. Gen. Physiol. 1985, 86, 89–104. [Google Scholar] [CrossRef] [Green Version]
  50. Maltsev, V.; Undrovinas, A.I. A multi-modal composition of the late Na+ current in human ventricular cardiomyocytes. Cardiovasc. Res. 2006, 69, 116–127. [Google Scholar] [CrossRef] [Green Version]
  51. Kumar, A.; Jaryal, A.; Gulati, S.; Chakrabarty, B.; Singh, A.; Deepak, K.; Pandey, R.; Gupta, N.; Sapra, S.; Kabra, M.; et al. Cardiovascular autonomic dysfunction in children and adolescents with Rett Syndrome. Pediatr. Neurol. 2017, 70, 61–66. [Google Scholar] [CrossRef] [PubMed]
  52. De Felice, C.; Signorini, C.; Leoncini, S.; Pecorelli, A.; Durand, T.; Valacchi, G.; Ciccoli, L.; Hayek, J. The role of oxidative stress in Rett syndrome: An overview. Ann. N. Y. Acad. Sci. 2012, 1259, 121–135. [Google Scholar] [CrossRef] [PubMed]
  53. Zaza, A.; Belardinelli, L.; Shryock, J.C. Pathophysiology and pharmacology of the cardiac “late sodium current”. Pharmacol. Ther. 2008, 119, 326–339. [Google Scholar] [CrossRef] [PubMed]
  54. Fredj, S.; Sampson, K.J.; Liu, H.; Kass, R.S. Molecular basis of ranolazine block of LQT-3 mutant sodium channels: Evidence for site of action. J. Cereb. Blood Flow Metab. 2006, 148, 16–24. [Google Scholar] [CrossRef]
  55. Lowe, J.S.; Stroud, D.M.; Yang, T.; Hall, L.; Atack, T.C.; Roden, D.M. Increased late sodium current contributes to long QT-related arrhythmia susceptibility in female mice. Cardiovasc. Res. 2012, 95, 300–307. [Google Scholar] [CrossRef] [Green Version]
  56. Antzelevitch, C.; Belardinelli, L.; Wu, L.; Fraser, H.; Zygmunt, A.C.; Burashnikov, A.; Di Diego, J.M.; Fish, J.M.; Cordeiro, J.M.; Goodrow, R.J., Jr.; et al. Electrophysiologic properties and antiarrhythmic actions of a novel antianginal agent. J. Cardiovasc. Pharmacol. Ther. 2004, 9 (Suppl. 1), S65–S83. [Google Scholar] [CrossRef]
  57. Rajamani, S.; Shryock, J.C.; Belardinelli, L. Rapid kinetic interactions of ranolazine with HERG K+ current. J. Cardiovasc. Pharmacol. 2008, 51, 581–589. [Google Scholar] [CrossRef]
  58. Du, C.; Zhang, Y.; EL Harchi, A.; Dempsey, C.; Hancox, J.C. Ranolazine inhibition of hERG potassium channels: Drug–pore interactions and reduced potency against inactivation mutants. J. Mol. Cell. Cardiol. 2014, 74, 220–230. [Google Scholar] [CrossRef] [Green Version]
  59. Nerbonne, J.M.; Nichols, C.G.; Schwarz, T.L.; Escande, D. Genetic manipulation of cardiac K(+) channel function in mice: What have we learned, and where do we go from here? Circ. Res. 2001, 89, 944–956. [Google Scholar] [CrossRef] [Green Version]
  60. Yang, Y.; Lv, T.; Li, S.; Zhang, P. Sodium channel blockers in the management of long QT syndrome types 3 and 2: A system review and meta-analysis. J. Cardiovasc. Electrophysiol. 2021, 32, 3057–3067. [Google Scholar] [CrossRef]
  61. Kaufmann, W.E. Long QT interval in Rett syndrome: Expanding the knowledge of a poorly understood phenomenon. Dev. Med. Child Neurol. 2020, 62, 775. [Google Scholar] [CrossRef] [PubMed] [Green Version]
  62. Guy, J.; Hendrich, B.; Holmes, M.; Martin, J.E.; Bird, A. A mouse Mecp2-null mutation causes neurological symptoms that mimic Rett syndrome. Nat. Genet. 2001, 27, 322–326. [Google Scholar] [CrossRef] [PubMed]
  63. Abdala Sheikh, A.P. Algorhythms for the Analysis of Unrestrained Whole-Body Plethysmography in Mice. Figshare. Software. 2022. Available online: https://0-doi-org.brum.beds.ac.uk/10.6084/m9.figshare.19518877.v2 (accessed on 17 April 2022).
  64. Gadeberg, H.C.; Kong, C.H.T.; Bryant, S.M.; James, A.F.; Orchard, C.H. Sarcolemmal distribution of ICa and INCX and Ca2+ auto-regulation in mouse ventricular myocytes. Am. J. Physiol. Heart Circ. Physiol. 2017, 313, H190–H199. [Google Scholar] [CrossRef] [PubMed] [Green Version]
  65. Levi, A.J.; Hancox, J.C.; Howarth, F.C.; Croker, J.; Vinnicombe, J. A method for making rapid changes of superfusate whilst main-taining temperature at 37oC. Pflugers Arch. 1996, 432, 930–937. [Google Scholar] [CrossRef] [PubMed]
  66. Chen, K.-H.; Xu, X.-H.; Sun, H.-Y.; Du, X.-L.; Liu, H.; Yang, L.; Xiao, G.-S.; Wang, Y.; Jin, M.-W.; Li, G.-R. Distinctive property and pharmacology of voltage-gated sodium current in rat atrial vs ventricular myocytes. Heart Rhythm 2015, 13, 762–770. [Google Scholar] [CrossRef] [PubMed]
Figure 1. ECG and AP measurements from WT and Mecp2Null/Y animals. (A) Upper and lower panels of (Ai) show respectively ECG records from WT and Mecp2Null/Y mice. The periods of high frequency noise in each trace represent breathing interference. In (Aii) an individual expanded ECG cycle is shown for each of WT (upper) and Mecp2Null/Y (lower) conditions, with labelling of different parts of the ECG complex and the QT intervals shown. (B) shows representative recordings of APs (elicited at 1 Hz) from WT (Bi) and Mecp2Null/Y (Bii) isolated ventricular myocytes. (C) Poincaré plots of APD90 from 15 consecutive APs illustrating increased beat-to-beat variability of repolarization (BVR) in Mecp2Null/Y compared to WT myocytes. (D) Mean data showing BVR increase in Mecp2Null/Y myocytes (n = 23 cells from 12 mice) compared to WT myocytes (n = 23 cells from 9 mice). BVR of APD90 was calculated by using equation 3. * denotes p < 0.05, unpaired t test, unequal variances assumed.
Ijms 23 05735 g001
Figure 2. Apnoeas in WT and Mecp2Null/Y animals. (A) shows mean apnoea count from 34 WT and 23 Mecp2Null/Y animals. These did not differ significantly. An apnoea was counted when the expiration time was longer than four times the average of the expiration time of minute running average. Apnoea was counted for 20 min. (B) shows mean apnoea length (duration of each episode) for the same 34 WT and 23 Mecp2Null/Y animals. ** represents p < 0.01; unpaired t-test. (C) shows a plot of mean ventricular AP duration from 11 mice (4 WT and 7 Mecp2Null/Y) against apnoea length observed for the same animals. There was no significant correlation between the two parameters (R = −0.07 and p = 0.84).
Ijms 23 05735 g002
Figure 3. INa,Late in ventricular myocytes from WT and Mecp2Null/Y animals. (A) shows records of sodium-sensitive (NMDG subtraction) current elicited by depolarization from −120 mV to −20 mV, expanded to focus on the persistent, late current component INa,Late. (Ai) shows an example from a WT ventricular myocyte and (Aii) shows a corresponding example from a Mecp2Null/Y myocyte. Voltage protocol is illustrated under current records. (B) Bar chart showing comparison between WT and Mecp2Null/Y INa,Late. Three different measures were taken: INa,Late density at 300 ms following the start of the applied voltage command; INa,Late density at 600 ms following the start of the applied voltage command; INa,Late integral between 350 and 800 ms following the start of the applied voltage command. Data were obtained from 41 myocytes from 20 WT mice and 28 cells from 17 Mecp2Null/Y mice. ** denotes p < 0.01 from comparison with unpaired t test assuming unequal variances. (C) shows records of sodium-sensitive current elicited by depolarization from −120 mV to −20 mV (protocol shown under currents), expanded to focus on the persistent, late current component INa,Late to illustrate the effect of the Nav1.8 inhibitor A-803467. (Ci) shows control and 100 nM A-803467 traces from a WT ventricular myocyte and (Cii) shows corresponding records from a similar experiment on a Mecp2Null/Y myocyte. In each case the control and 100 nM A-803467 traces were closely superimposable. (D) mean data for WT (Di) and Mecp2Null/Y myocytes (Dii) showing effects of 100 nM A-803467 on each of the 3 measures of INa introduced in panel B. Data were derived from 8 cells from 6 WT mice and 6 cells from 5 Mecp2Null/Y mice. None of the measures of INa,Late showed any significant effect of 100 nM A-803467 (paired t-test).
Ijms 23 05735 g003
Figure 4. I–V relation and voltage dependent activation of INa. (A) Families of INa from a WT ventricular myocyte (Ai), and a Mecp2Null/Y myocyte (Aii). Voltage protocol is shown as insets under current traces. Traces at selected potentials (indicated next to traces) are shown for clarity of display. (B) Current–voltage (I–V) relations for peak INa for WT (n = 11 from 5 mice) and Mecp2Null/Y myocyte (n = 9 from 5 mice). (C) Voltage dependent activation plots for WT and Mecp2Null/Y myocytes (same experiments as ‘B’). Data were fitted with Equation (5) to yield V0.5 and k values for WT of −47.4 ± 1.4 mV and 3.6 ± 0.2 mV and for Mecp2Null/Y of −45.4 ± 1.0 mV and 3.9 ± 0.5 mV. In (B) ** denotes p < 0.01 and * denotes p < 0.05, 2-way repeated measures ANOVA with Bonferroni post-test.
Ijms 23 05735 g004
Figure 5. Inactivation properties of INa and ‘window’ current. (A) Families of INa from a WT ventricular myocyte (Ai), and a Mecp2Null/Y myocyte (Aii). Voltage protocol is shown as insets under current traces. Traces elicited during the −40 mV command following the conditioning commands to the voltages indicated next to the current traces. Selected records during the protocol are shown for clarity of display. (B) Voltage dependence of INa inactivation plot in which I/Imax represents currents normalized to the maximal INa amplitude recorded during the −40 mV step, plotted against conditioning voltage. WT data were derived from 9 cells from 5 mice and Mecp2Null/Y data were derived from 8 cells from 4 mice. Data were fitted with equation 6 to yield inactivation V0.5 and k values for WT of −83.1 ± 1.7 mV and 6.5 ± 0.3 mV and for Mecp2Null/Y of −79.6 ± 0.7 mV and 5.1 ± 0.3 mV. ** p < 0.01, 2-way repeated measures ANOVA with Bonferroni post-test. (C) ‘Window’ INa calculated at 2 mV intervals, utilizing the product of the mean activation and inactivation variables, Gmax and driving force at each test potential (see Methods). Window current was decreased for Mecp2Null/Y compared to WT INa. The negative sign was removed in order to visualize the window in the positive direction. (D) Recovery from inactivation (or ‘reactivation’) of INa obtained using paired pulse protocol described in the Methods/Results text. INa elicited by a second command at varying inter-pulse intervals was normalized to that elicited by the first pulse and plotted against inter-pulse interval. Mean data from 8 cells from 4 mice for each of WT and Mecp2Null/Y are plotted. τfast was 11.0 ± 0.7 ms for WT INa and 8.6 ± 0.2 ms for Mecp2Null/Y INa (p < 0.05, unpaired t test, unequal variances assumed); τSlow was 362.0 ± 53.4 ms for WT INa and 311.5 ± 50.2 ms for Mecp2Null/Y. The fraction of fast reactivation was 0.85 ± 0.02 for WT and 0.85 ± 0.03 for Mecp2Null/Y. * p < 0.05, ** p < 0.01, 2-way repeated measures ANOVA with Bonferroni post-test.
Ijms 23 05735 g005
Figure 6. Effects of ranolazine and GS-6615 on WT and Mecp2Null/Y INa,Late. (A) shows records of INa,Late elicited by depolarization from −120 mV to −20 mV in the absence and presence of 30 µM ranolazine. (Ai) shows traces from a WT ventricular myocyte and (Aii) shows a corresponding example from a Mecp2Null/Y myocyte. (B) Bar chart showing mean data for WT and Mecp2Null/Y myocytes showing effects of 30 µM ranolazine on each of the 3 measures of INa,Late used in Figure 3, expressed as % inhibition of INa,Late. Data were derived from 9 cells from 4 WT mice and 7 cells from 4 Mecp2Null/Y mice. The extent of inhibition of INa,Late was similar between WT and Mecp2Null/Y myocytes. (C) Bar charts showing INa,Late integrals from WT myocytes, Mecp2Null/Y myocytes and Mecp2Null/Y myocytes in the presence of ranolazine. Data from 9 cells from 4 WT mice and 7 cells from 4 Mecp2Null/Y mice are shown. Application of 30 µM ranolazine restored the INa,Late integral from Mecp2Null/Y myocytes to a similar value to that found in WT myocytes. (D) shows records of INa,Late elicited by depolarization from −120 mV to −20 mV in the absence and presence of 10 µM GS-6615. (Di) shows traces from a WT ventricular myocyte and (Dii) shows a corresponding example from a Mecp2Null/Y myocyte. (E) Bar chart showing mean data for WT and Mecp2Null/Y myocytes showing effects of 10 µM GS-6615 on each of the 3 measures of INa,Late used in (B), expressed as % inhibition of INa,Late. Data were derived from 16 cells from 8 WT mice and 8 cells from 6 Mecp2Null/Y mice. The extent of inhibition of INa,Late by GS-6615 was similar between WT and Mecp2Null/Y myocytes.(F) Bar charts showing INa,Late integrals from WT myocytes, Mecp2Null/Y myocytes and Mecp2Null/Y myocytes in the presence of GS-6615. Data from 16 cells from 8 WT mice and 8 cells from 6 Mecp2Null/Y mice are shown. Application of 10 µM GS-6615 restored the INa,Late integral from Mecp2Null/Y myocytes to a value not significantly different from that found in WT myocytes.** denotes p < 0.01 and * denotes p < 0.05 from one-way ANOVA and Bonferroni post-test.
Ijms 23 05735 g006
Figure 7. Effect of ranolazine and GS-6615 on ventricular APs. (A) Panels Ai and Aii respectively show example APs in control and 30 µM ranolazine for WT (Ai) and Mecp2Null/Y (Aii) ventricular myocytes (AP frequency of 1 Hz). (B) Panels Bi and Bii respectively show example APs in control and 10 µM GS-6615 for WT (Bi) and Mecp2Null/Y (Bii) ventricular myocytes (AP frequency of 1 Hz). (C) shows mean data indicating the mean % change in AP duration at 90% repolarization (APD90) for each of WT and Mecp2Null/Y conditions. Plots show data from 7 cells from 4 WT mice and 6 cells from 3 Mecp2Null/Y mice for the ranolazine groups, and 6 cells from 3 WT mice and 8 cells from 5 Mecp2Null/Y mice for GS-6615 groups. There was no significant difference between the magnitude of response between WT and Mecp2Null/Y myocytes for either drug: ranolazine prolonged APD90 and GS-6615 abbreviated APD90.
Ijms 23 05735 g007
Figure 8. Summary of major findings of this study. (A) A schematic showing the changes to the main electrophysiological features studied in this investigation (ECG, action potentials (AP), INa,Late and INa) in the Mecp2Null/Y RTT model. The left-hand column itemizes properties studied; the right-hand column shows the direction of alteration in the RTT model compared to WT controls. Upward and downward arrows represent increase and decrease, respectively. The horizontal arrow indicates no change (to INa activation). For the two drugs studied “inhibition retained” highlights the observation that Mecp2Null/Y INa,Late retained the ability to be inhibited by ranolazine and GS-6615. (B) Schematic diagram showing relationship between each of INa and INa,Late and the ventricular AP (for an AP with a high plateau phase, as occurs in humans). Fast INa flows during the AP upstroke; INa,Late is a sustained low amplitude sodium current that flows during the AP plateau phase.
Ijms 23 05735 g008
Table 1. ECG characteristics and respiration rate.
ParameterWTMecp2Null/Yt-Test p Value
RR (ms)130.7 ± 2.4125.8 ± 5.30.4132
HR (bpm)460.8 ± 8.6485.8 ± 19.30.2569
PR (ms)38.4 ± 0.836.4 ± 1.00.1271
QRS (ms)10.8 ± 0.212.2 ± 0.5 0.0094
QT (ms)51.9 ± 0.956.9 ± 1.80.0233
QTc (ms; Equation (1))45.5 ± 0.950.8 ± 1.00.0006
QTc (ms; Equation (2))64.4 ± 1.171.0 ± 1.10.0005
Respiratory rate (bpm)136.7 ± 4.7104.3 ± 8.20.0029
Mean ± SEM ECG parameters and respiration rate for 12 wild-type (WT) and 12 Mecp2Null/Y mice. Statistical comparisons were made using unpaired t-test, assuming unequal or equal variances as appropriate.
Table 2. Ventricular action potential (AP) parameters.
ParameterWTMecp2Null/Y
Resting potential (mV)72.2 ± 0.8−69.5 ± 0.9 *
Overshoot (mV)48.0 ± 2.045.4 ± 2.2
Amplitude (mV)120.2 ± 2.4115.0 ± 2.8
Vmax (V s−1)139.8 ± 6.1128.1 ± 7.7
APD10 (ms)0.6 ± 0.10.8 ± 0.2
APD25 (ms)2.1 ± 0.42.5 ± 0.3
APD50 (ms)6.7 ± 1.18.1 ± 0.9
APD75 (ms)71.1 ± 8.299.6 ± 7.9 *
APD90 (ms)115.6 ± 9.5166.0 ± 10.8 **
APD90-APD25 (ms)113.5 ± 9.4163.5 ± 10.8 **
Threshold stimulus (pA) 907.4 ± 40.9597.4 ± 29.3 **
Mean ± SEM values for AP parameters for APs recorded from isolated ventricular myocytes: 27 cells from 9 WT mice and 29 cells from 13 Mecp2Null/Y mice. APs were elicited by 3 ms duration depolarizing current pulses. Threshold values are included in the table. * denotes p < 0.05 and ** denotes p < 0.01 from unpaired t-test, assuming equal or unequal variances as appropriate.
Publisher’s Note: MDPI stays neutral with regard to jurisdictional claims in published maps and institutional affiliations.

