
Progression and Dissemination of Pulmonary Mycobacterium Avium Infection in a Susceptible Immunocompetent Mouse Model

 , and
, and 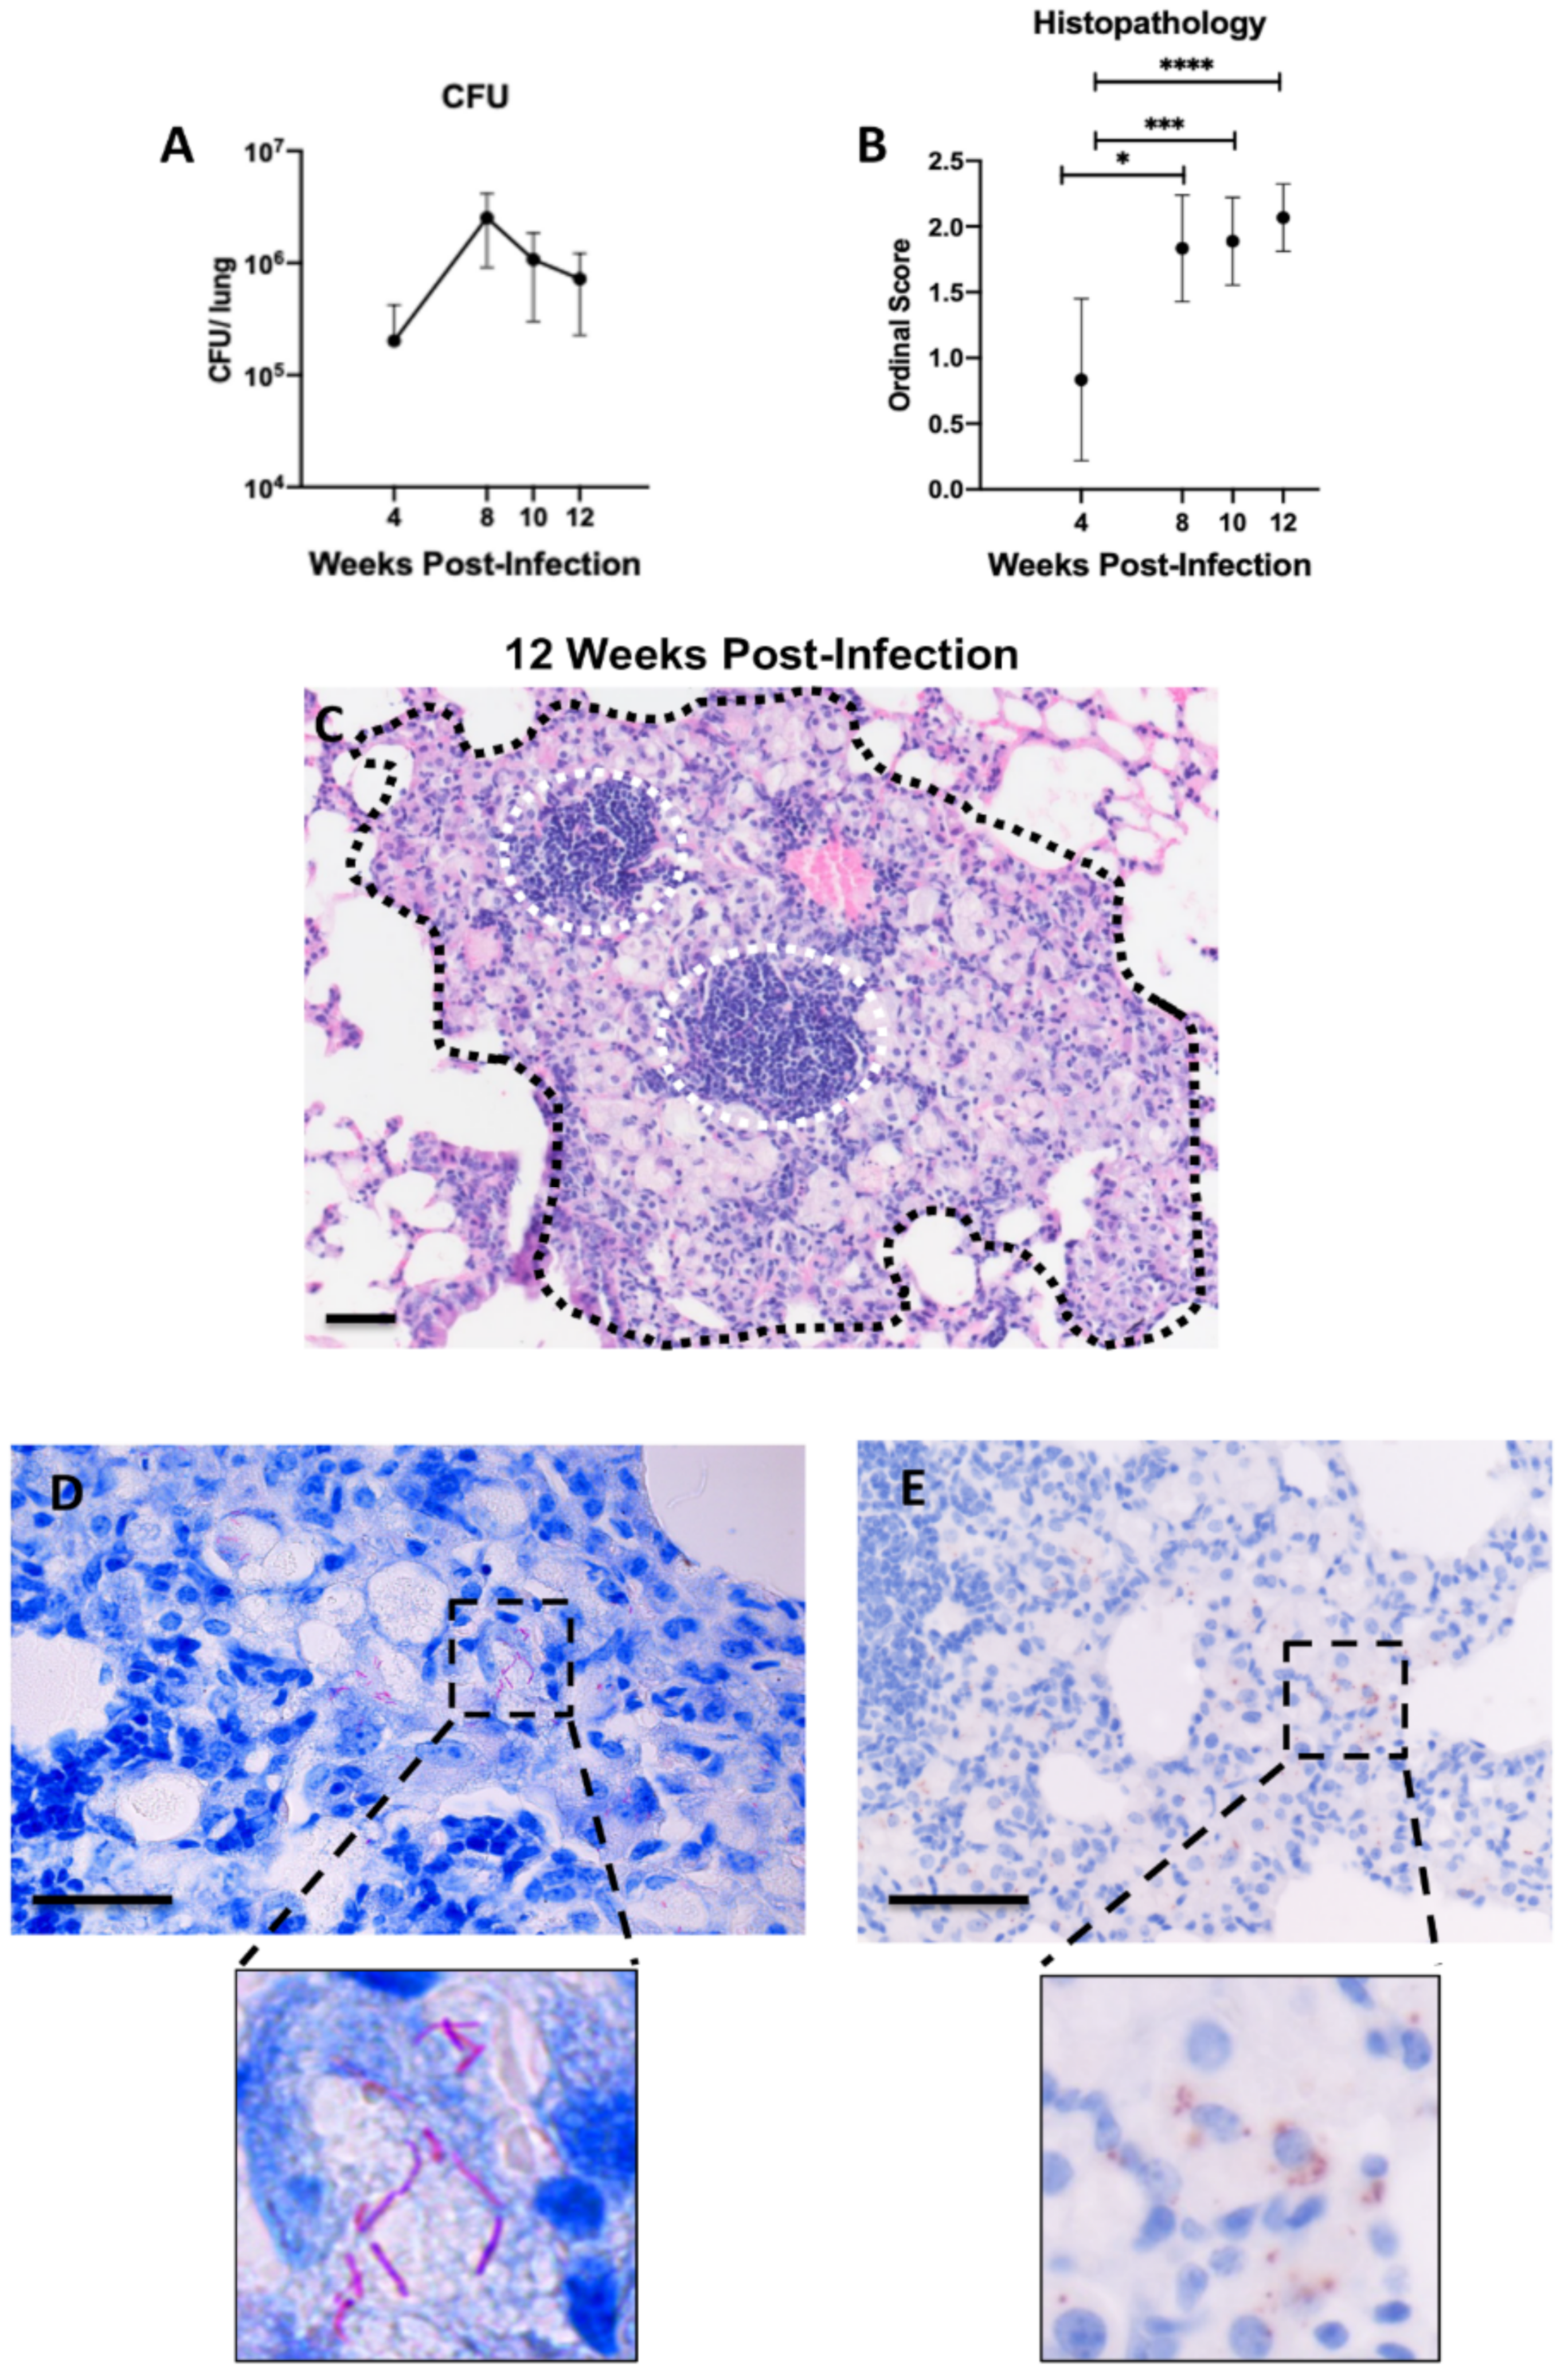
Abstract
:1. Introduction
2. Results
2.1. Histopathological Features of Lung Lesions Due to Intranasal Inoculation in B6.Sst1S Mice
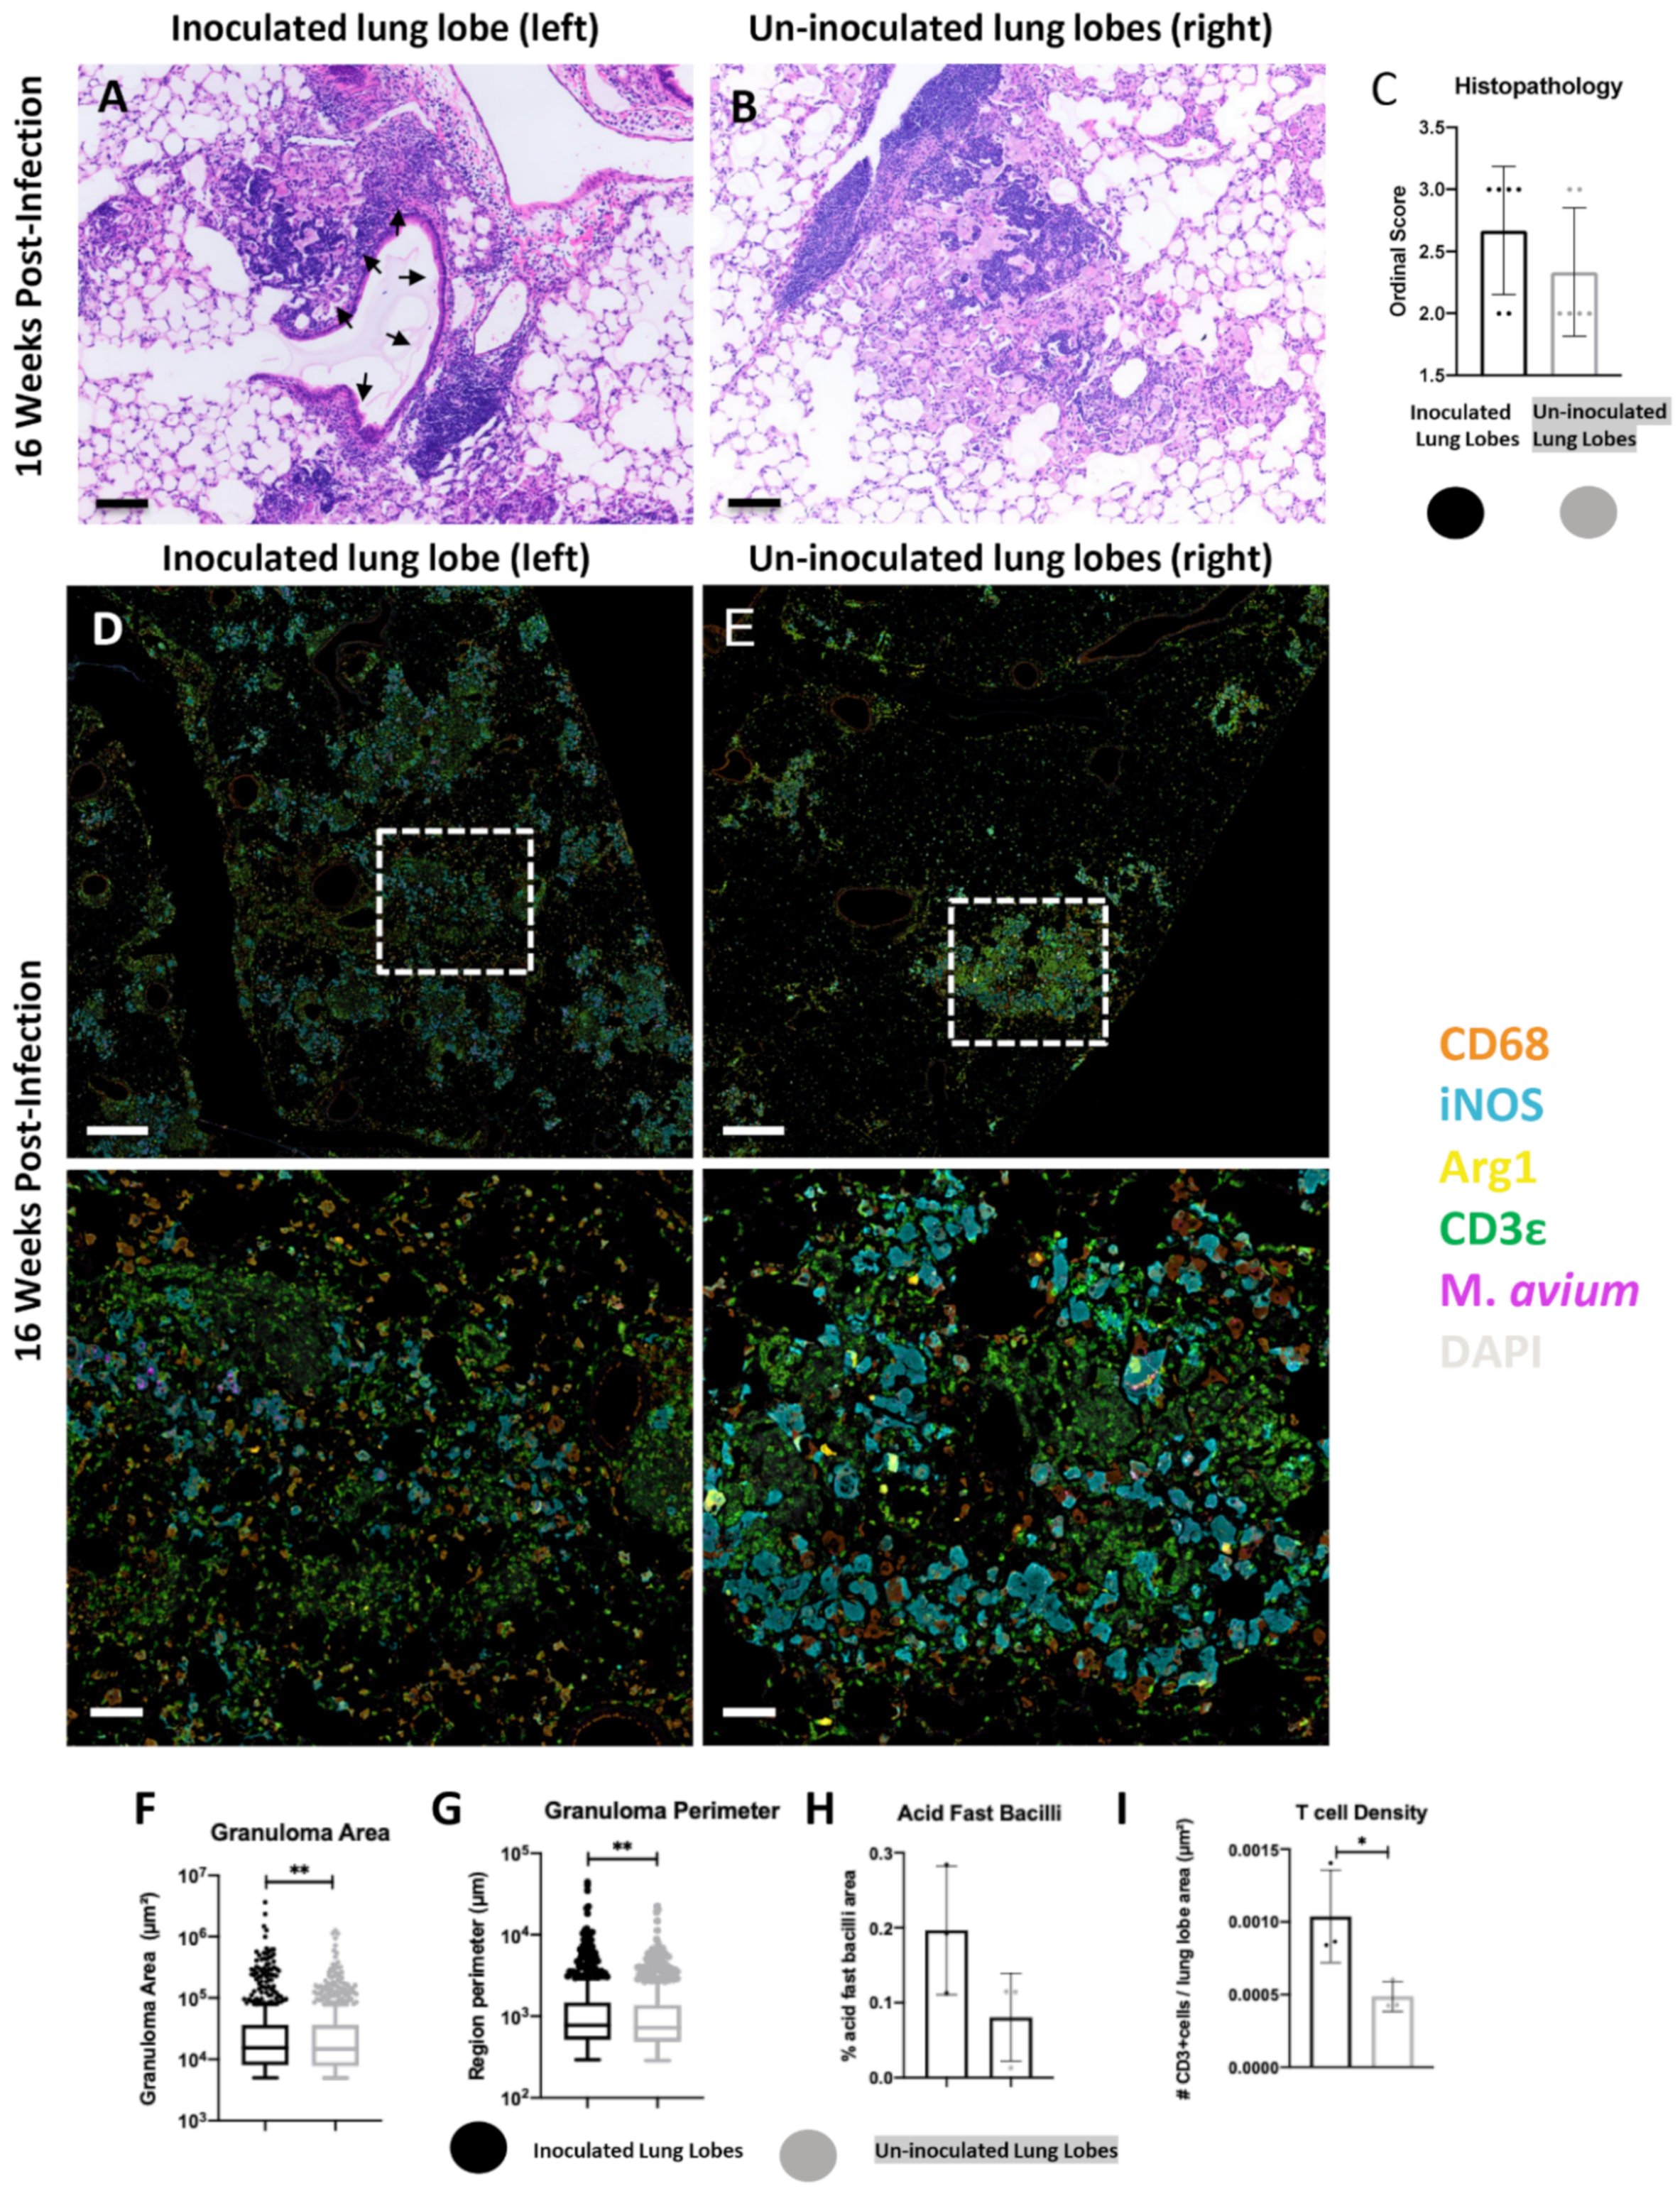
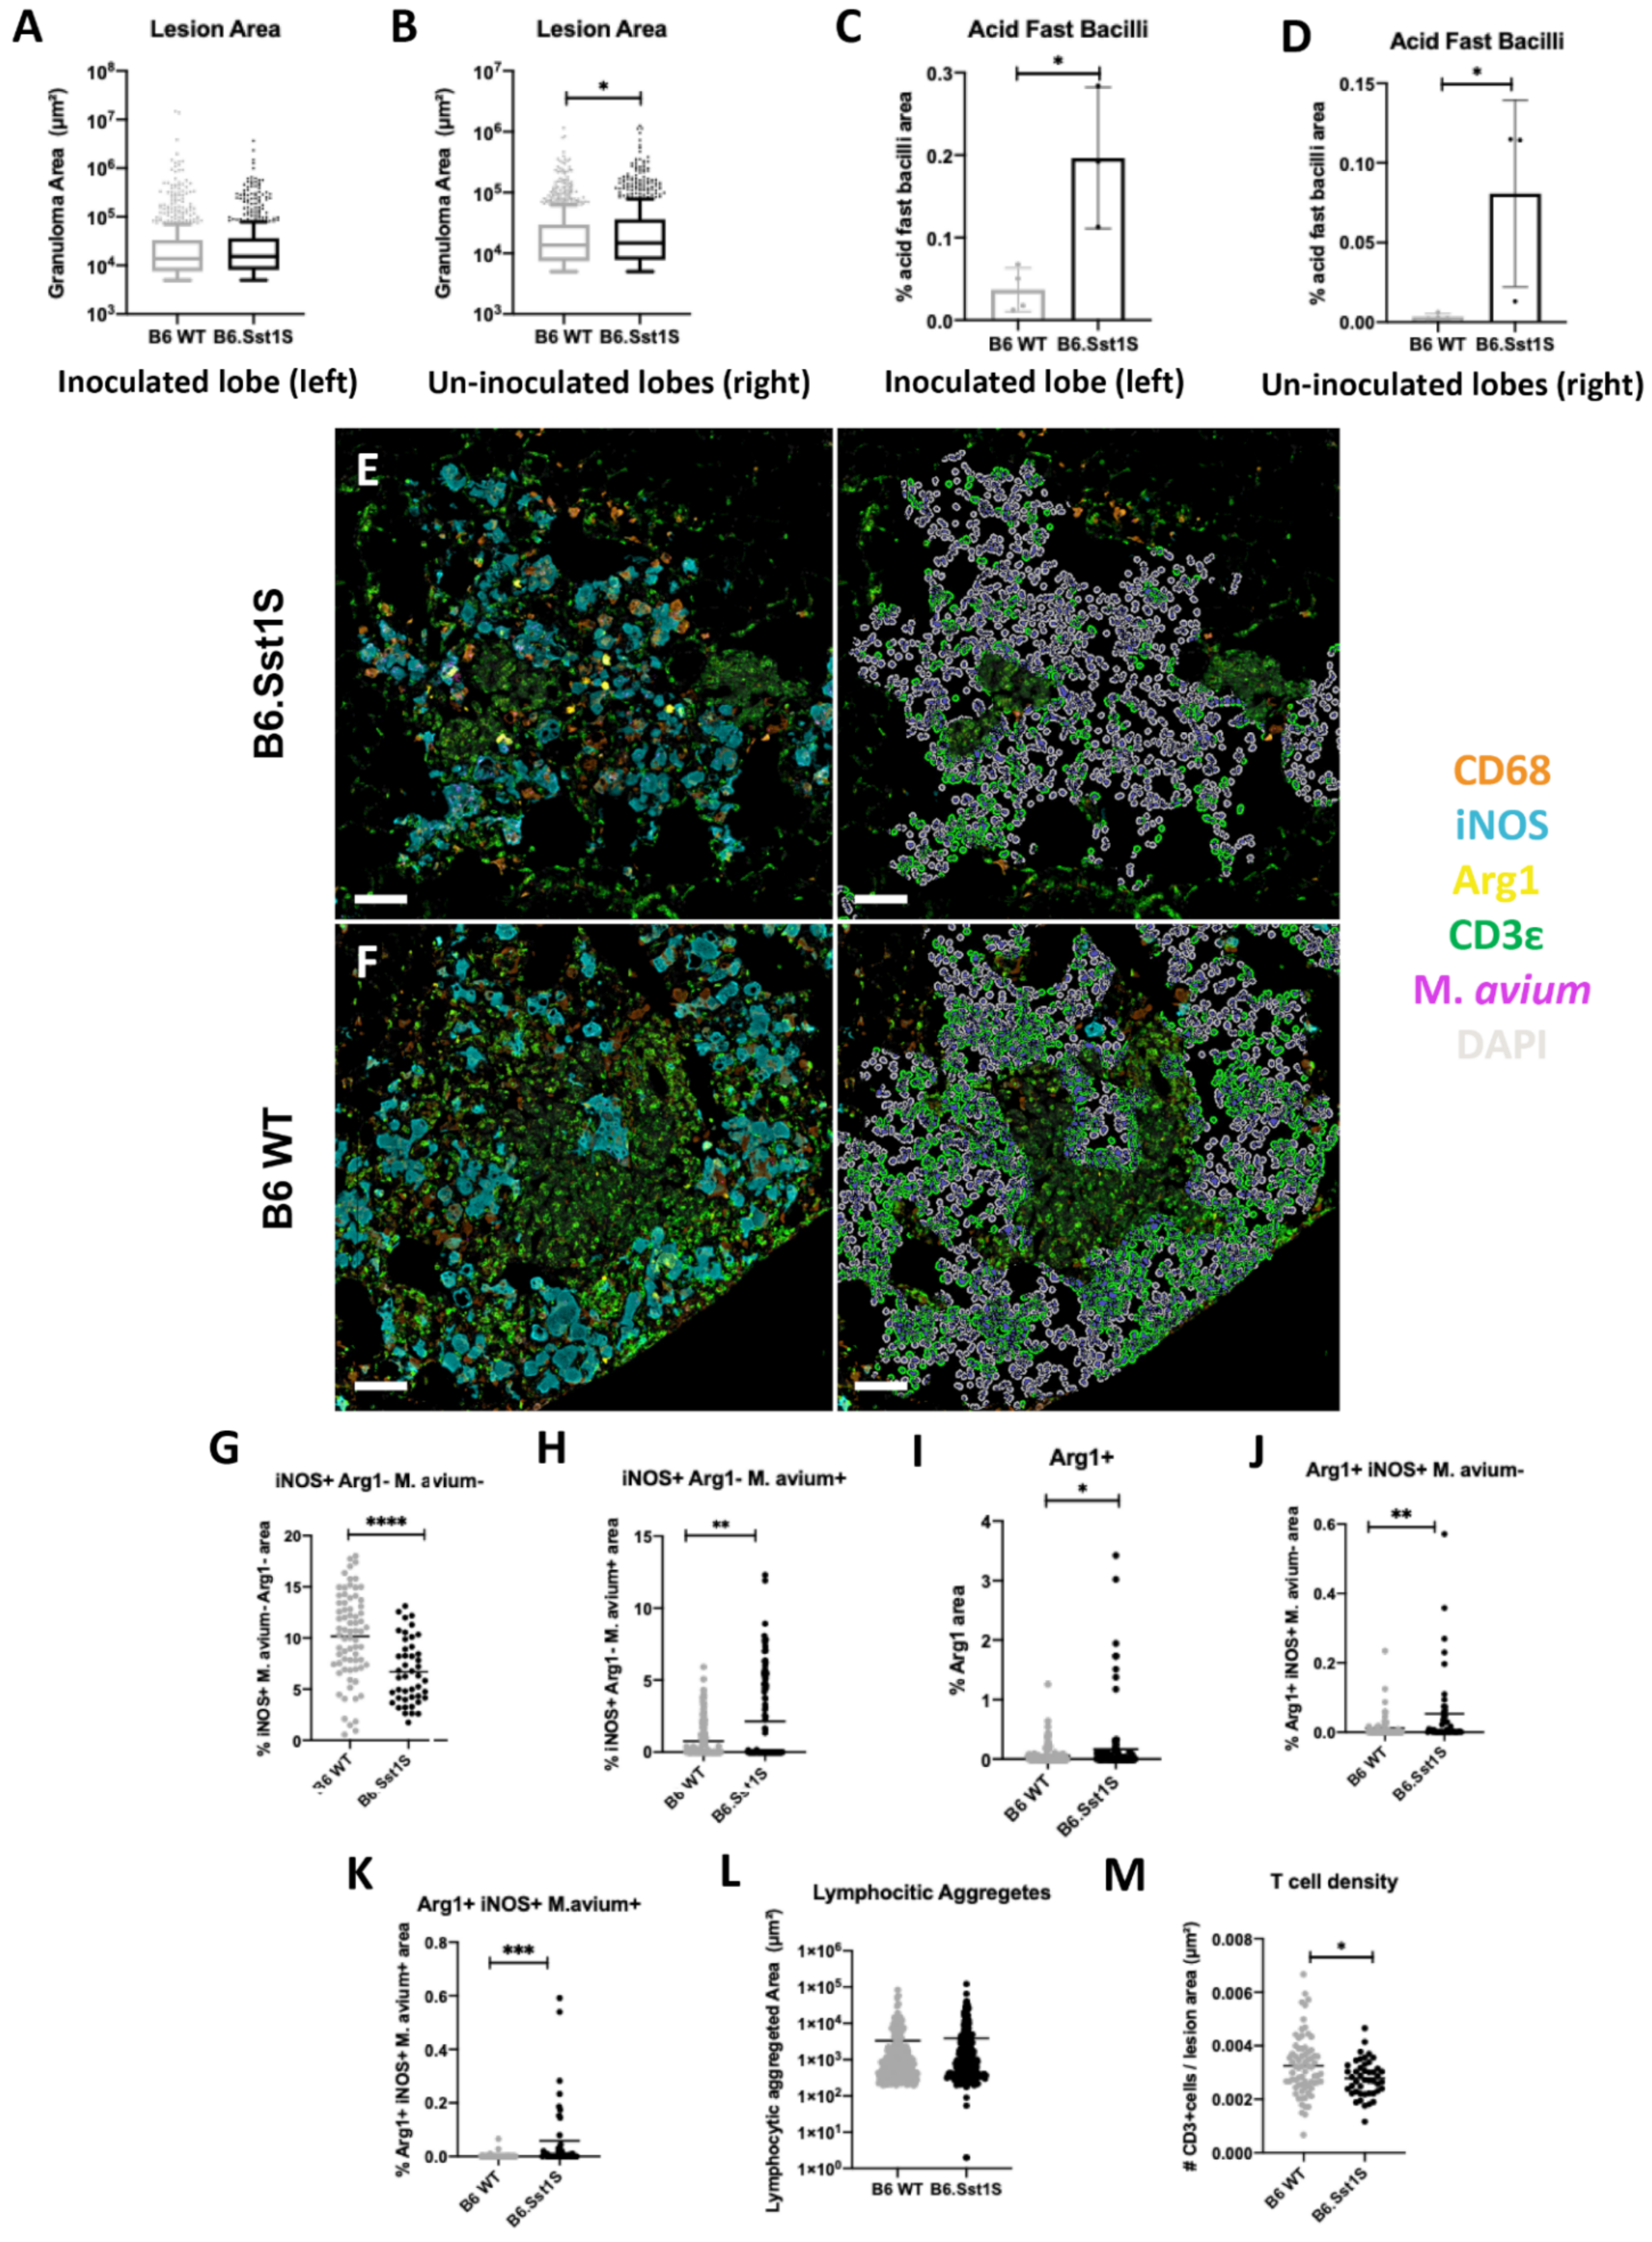
2.2. Histopathological Features of Lung Lesions in Inoculated (Left) and Un-Inoculated Lung Lobes (Right) Due to Unilateral Intrabronchial Inoculation
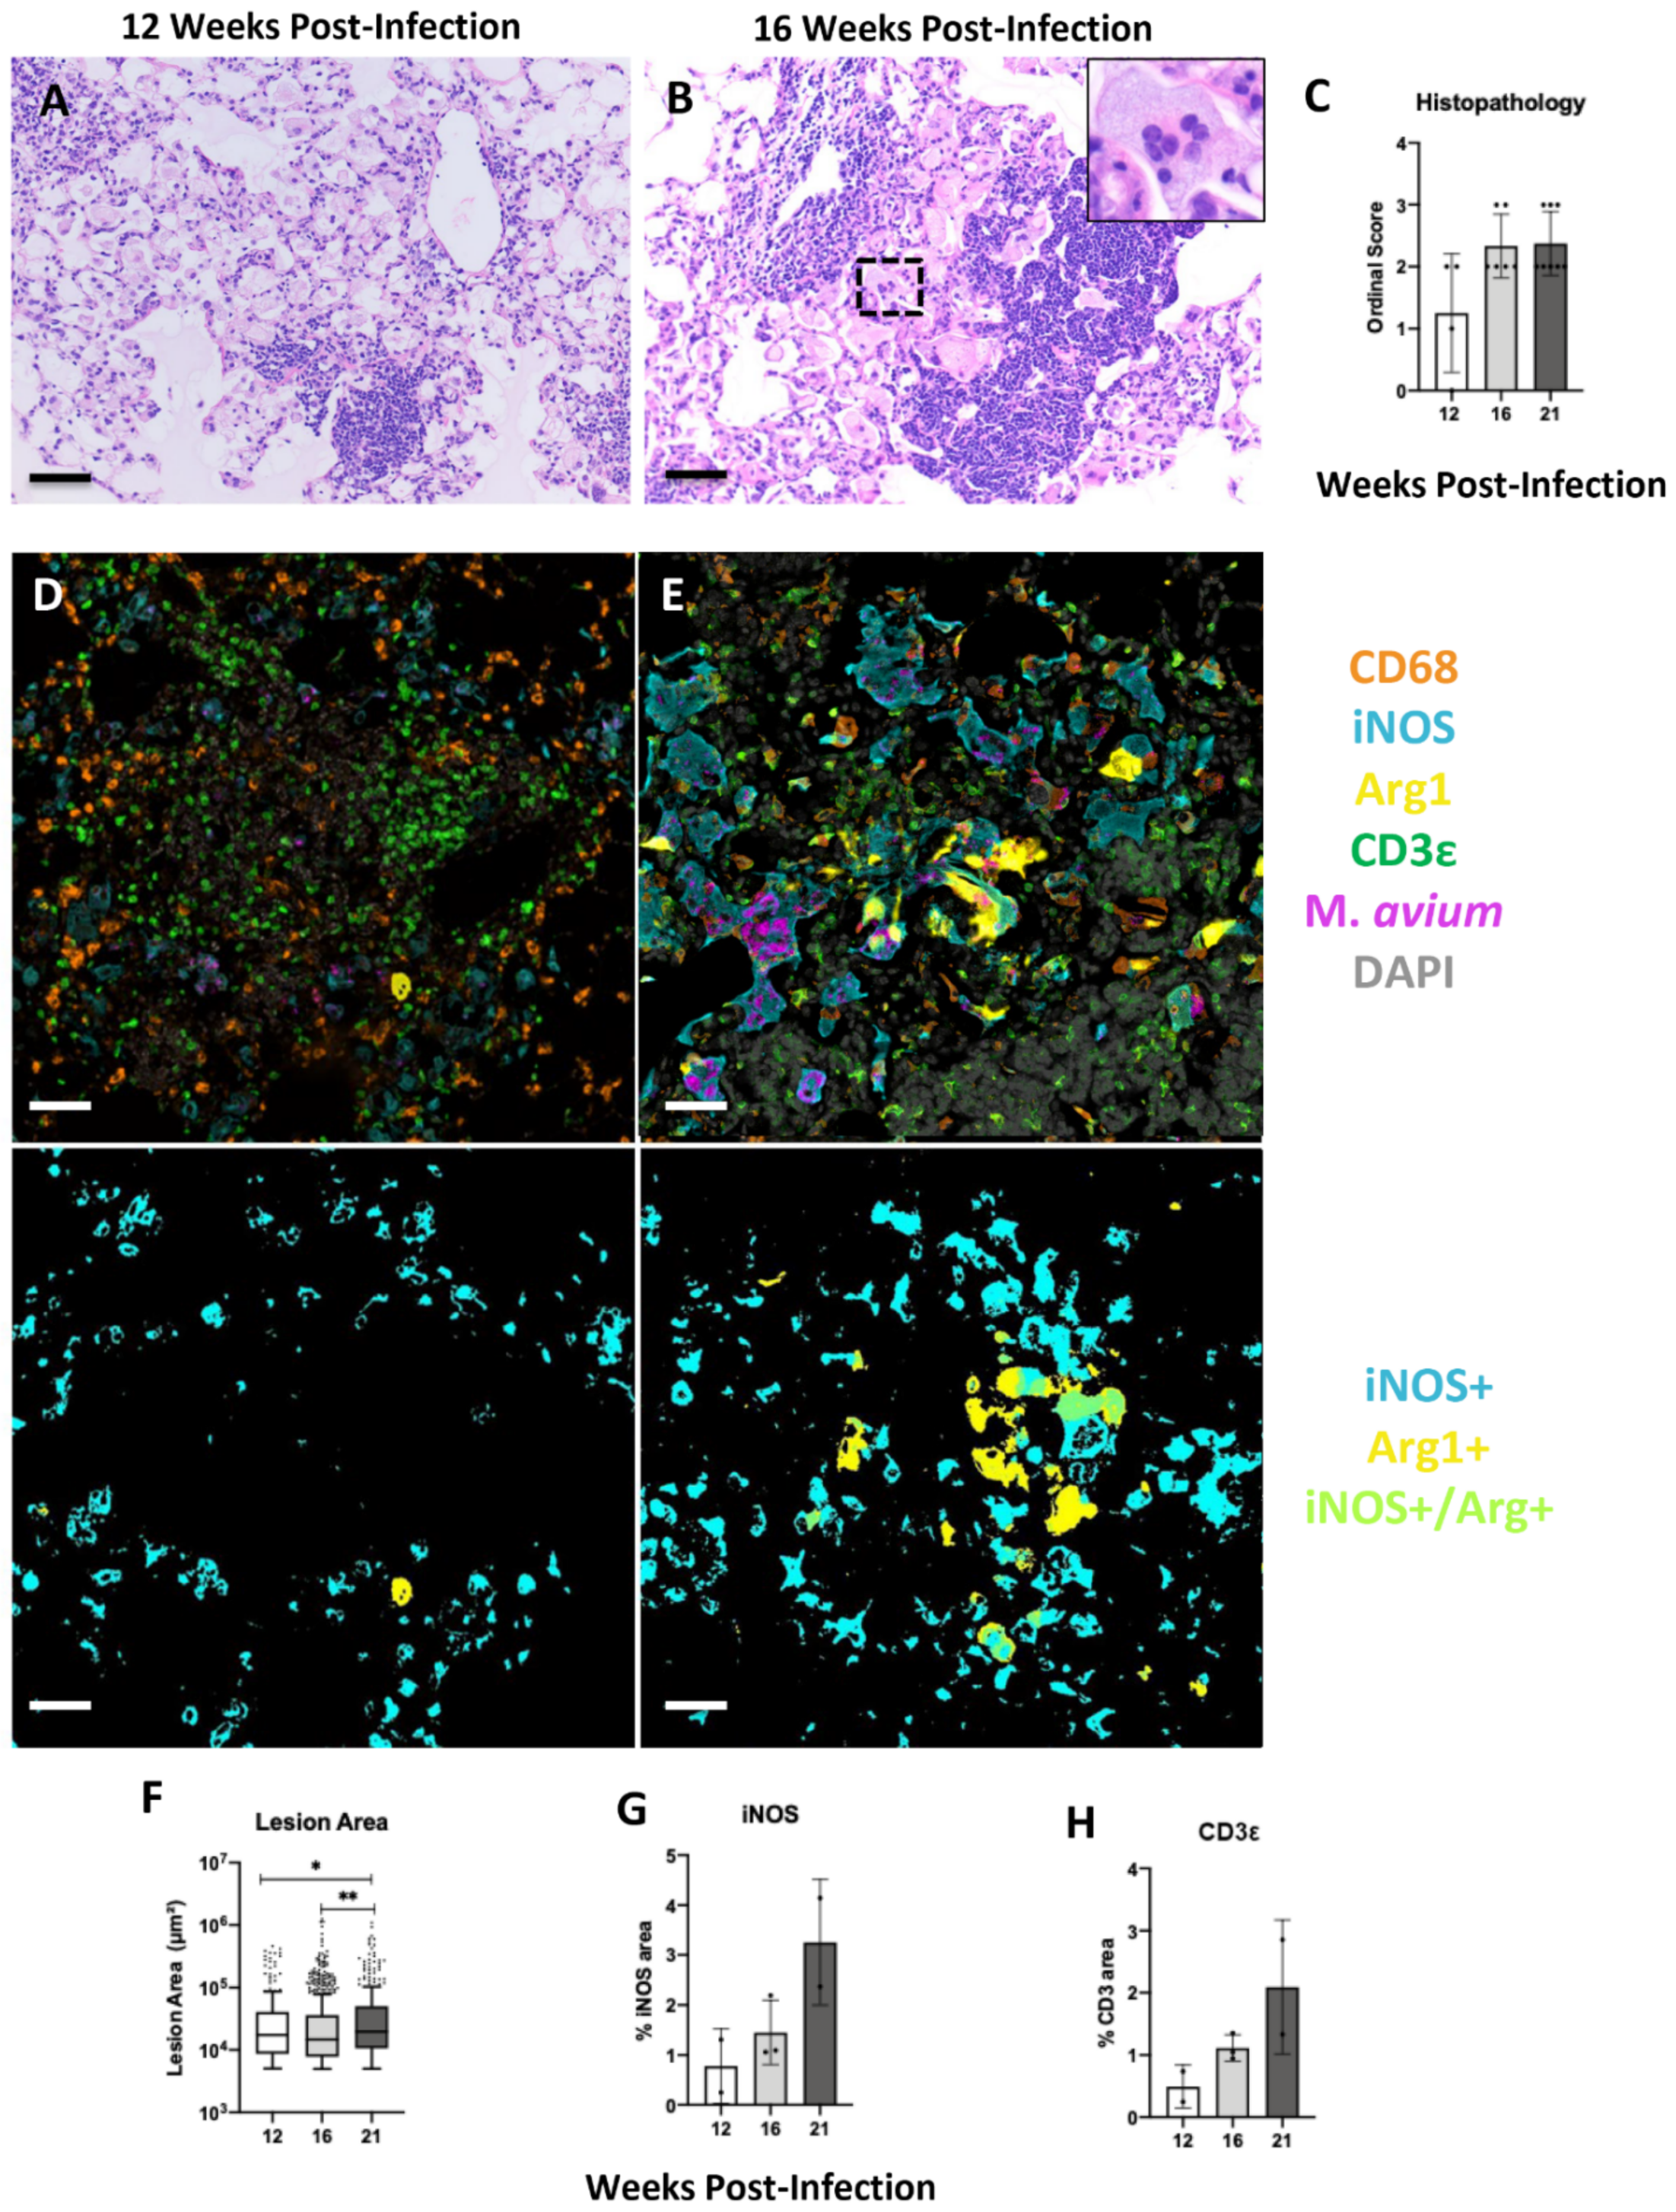
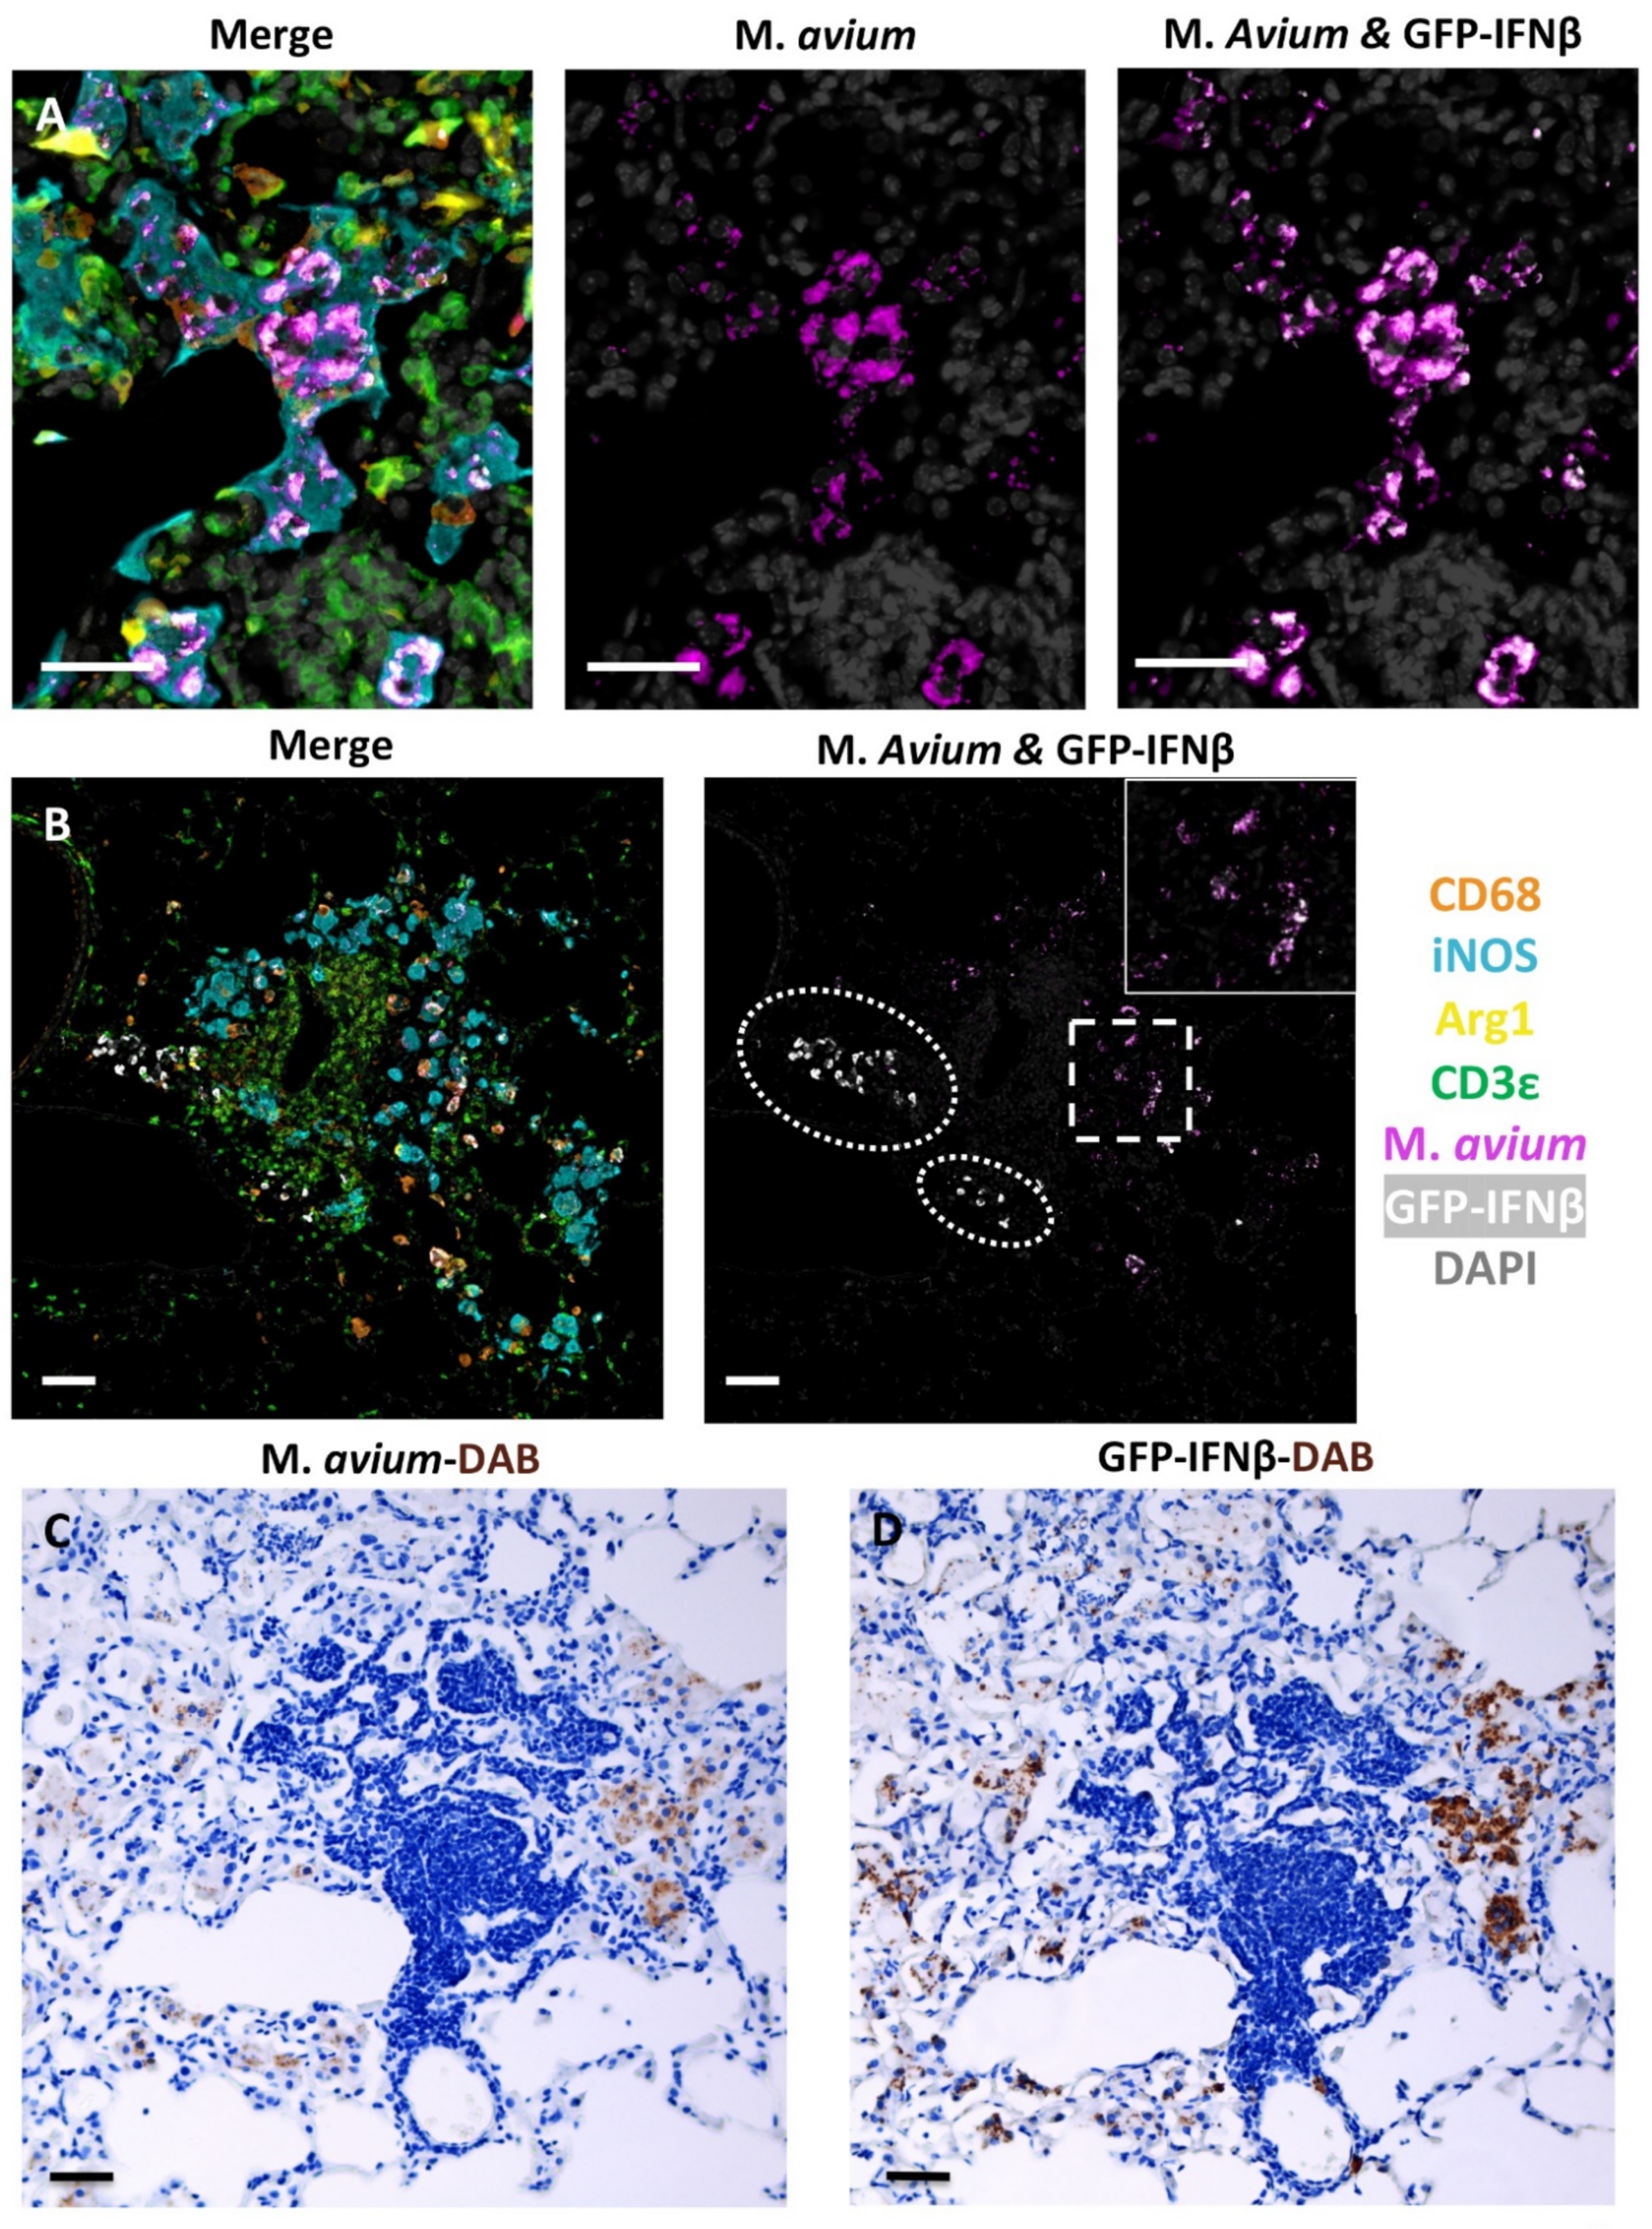
2.3. Progression of Secondary Lesions in the Un-Inoculated Lobes (Right) after Left Intrabronchial Inoculation
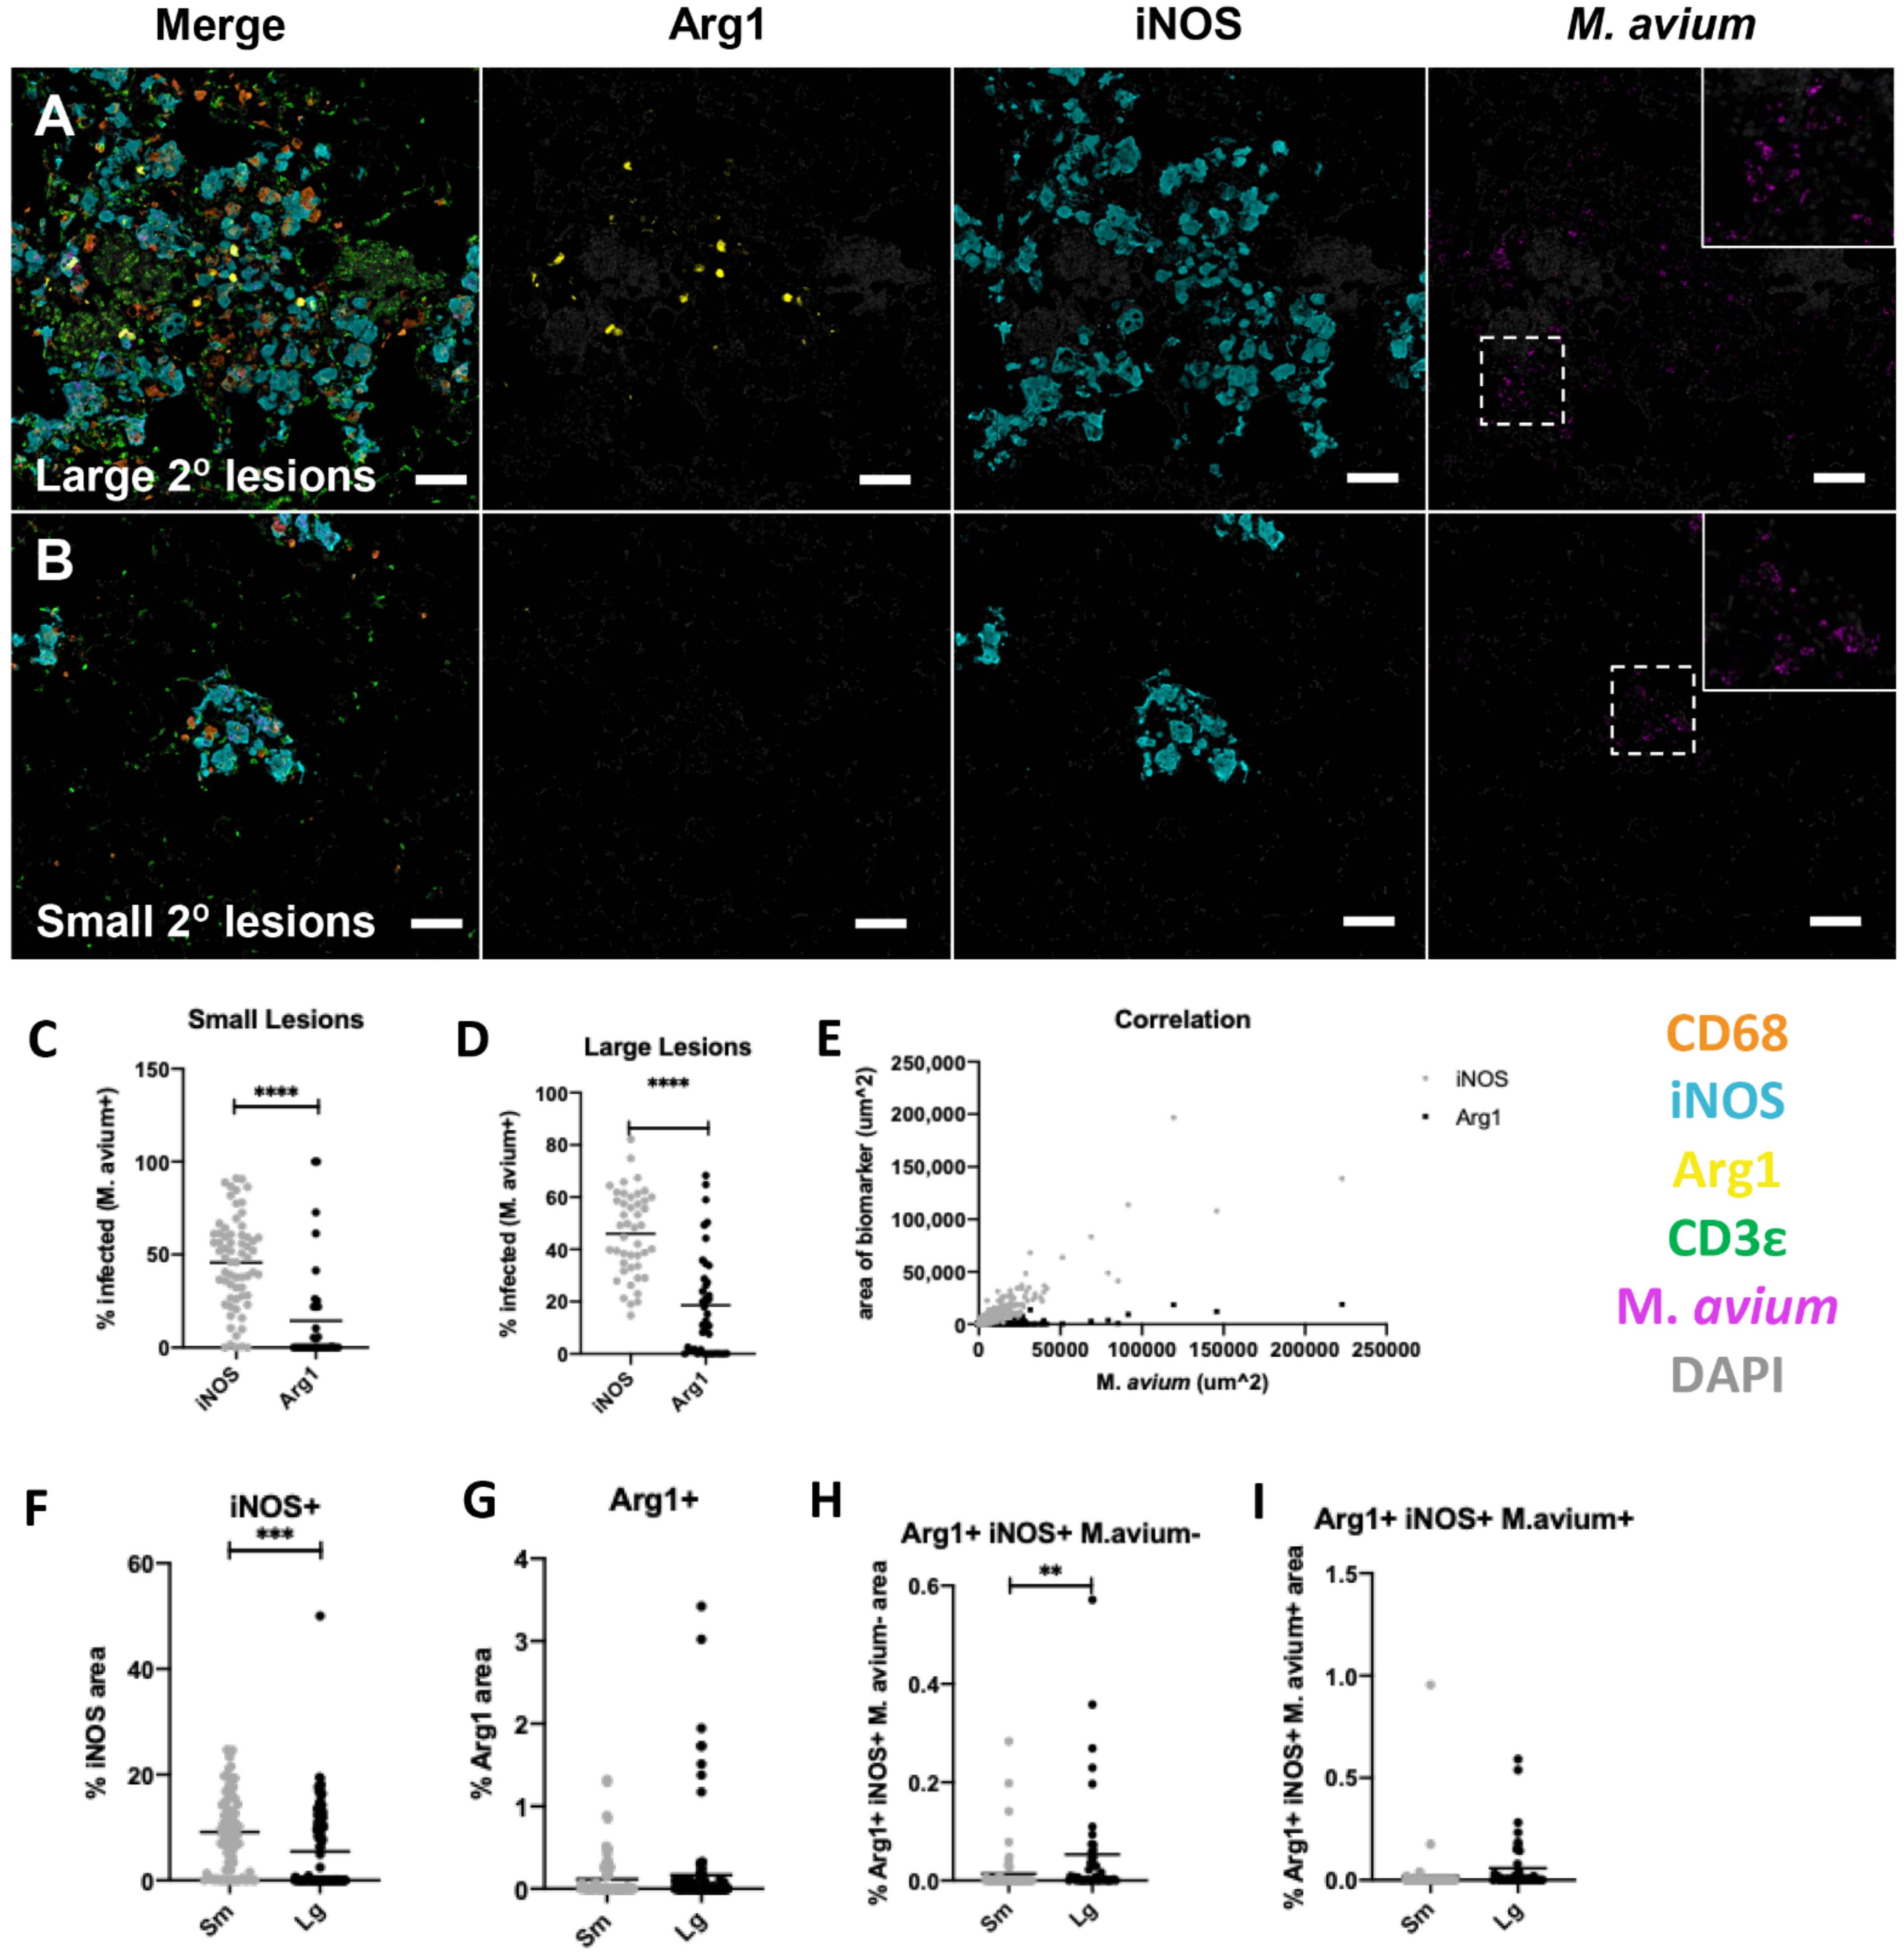
2.4. The sst1-Mediated Susceptibility to M. avium Infection
3. Discussion
Study Limitations
4. Materials and Methods
4.1. Mice and Mycobacterium avium Infection
4.2. Tissue Inactivation, Processing, and Histopathologic Interpretation
4.3. Fluorescent Multiplex Immunohistochemistry (fmIHC)
4.4. Slide Scanning and Image Analysis
4.5. Mycobacterial Staining and Quantification of Loads in Lung Sections
4.6. Statistical Analysis
Supplementary Materials
Author Contributions
Funding
Institutional Review Board Statement
Informed Consent Statement
Data Availability Statement
Acknowledgments
Conflicts of Interest
References
- Prevots, D.R.; Marras, T.K. Epidemiology of human pulmonary infection with nontuberculous mycobacteria: A review. Clin. Chest. Med. 2015, 36, 13–34. [Google Scholar] [CrossRef] [PubMed] [Green Version]
- Ratnatunga, C.N.; Lutzky, V.P.; Kupz, A.; Doolan, D.L.; Reid, D.W.; Field, M.; Bell, S.C.; Thomson, R.M.; Miles, J.J. The Rise of Non-Tuberculosis Mycobacterial Lung Disease. Front. Immunol. 2020, 11, 303. [Google Scholar] [CrossRef] [PubMed] [Green Version]
- Hoefsloot, W.; van Ingen, J.; Andrejak, C.; Angeby, K.; Bauriaud, R.; Bemer, P.; Beylis, N.; Boeree, M.J.; Cacho, J.; Chihota, V.; et al. The geographic diversity of nontuberculous mycobacteria isolated from pulmonary samples: An NTM-NET collaborative study. Eur. Respir. J. 2013, 42, 1604–1613. [Google Scholar] [CrossRef] [PubMed]
- Baldwin, S.L.; Larsen, S.E.; Ordway, D.; Cassell, G.; Coler, R.N. The complexities and challenges of preventing and treating nontuberculous mycobacterial diseases. PLoS Negl. Trop. Dis. 2019, 13, e0007083. [Google Scholar] [CrossRef] [PubMed]
- Karakousis, P.C.; Moore, R.D.; Chaisson, R.E. Mycobacterium avium complex in patients with HIV infection in the era of highly active antiretroviral therapy. Lancet. Infect. Dis. 2004, 4, 557–565. [Google Scholar] [CrossRef]
- Griffith, D.E.; Aksamit, T.; Brown-Elliott, B.A.; Catanzaro, A.; Daley, C.; Gordin, F.; Holland, S.M.; Horsburgh, R.; Huitt, G.; Iademarco, M.F.; et al. An official ATS/IDSA statement: Diagnosis, treatment, and prevention of nontuberculous mycobacterial diseases. Am. J. Respir. Crit. Care Med. 2007, 175, 367–416. [Google Scholar] [CrossRef]
- Florido, M.; Cooper, A.M.; Appelberg, R. Immunological basis of the development of necrotic lesions following Mycobacterium avium infection. Immunology 2002, 106, 590–601. [Google Scholar] [CrossRef]
- Lousada, S.; Florido, M.; Appelberg, R. Regulation of granuloma fibrosis by nitric oxide during Mycobacterium avium experimental infection. Int. J. Exp. Pathol. 2006, 87, 307–315. [Google Scholar] [CrossRef]
- Saunders, B.M.; Dane, A.; Briscoe, H.; Britton, W.J. Characterization of immune responses during infection with Mycobacterium avium strains 100, 101 and the recently sequenced 104. Immunol. Cell Biol. 2002, 80, 544–549. [Google Scholar] [CrossRef]
- Chin, K.L.; Sarmiento, M.E.; Alvarez-Cabrera, N.; Norazmi, M.N.; Acosta, A. Pulmonary non-tuberculous mycobacterial infections: Current state and future management. Eur. J. Clin. Microbiol. Infect. Dis. 2020, 39, 799–826. [Google Scholar] [CrossRef]
- Hwang, J.A.; Kim, S.; Jo, K.-W.; Shim, T.S. Natural history of Mycobacterium avium complex lung disease in untreated patients with stable course. Eur. Respir. J. 2017, 49, 3. [Google Scholar] [CrossRef] [PubMed] [Green Version]
- Diel, R.; Lipman, M.; Hoefsloot, W. High mortality in patients with Mycobacterium avium complex lung disease: A systematic review. BMC Infect. Dis. 2018, 18, 206. [Google Scholar] [CrossRef] [PubMed]
- Fujita, J.; Ohtsuki, Y.; Shigeto, E.; Suemitsu, I.; Yamadori, I.; Bandoh, S.; Shiode, M.; Nishimura, K.; Hirayama, T.; Matsushima, T.; et al. Pathological findings of bronchiectases caused by Mycobacterium avium intracellulare complex. Respir Med. 2003, 97, 933–938. [Google Scholar] [CrossRef] [Green Version]
- Fujita, J.; Ohtsuki, Y.; Suemitsu, I.; Yamadori, I.; Shigeto, E.; Shiode, M.; Nishimura, K.; Hirayama, T.; Matsushima, T.; Ishida, T. Immunohistochemical distribution of epithelioid cell, myofibroblast, and transforming growth factor-beta1 in the granuloma caused by Mycobacterium avium intracellulare complex pulmonary infection. Microbiol. Immunol. 2002, 46, 67–74. [Google Scholar] [CrossRef]
- Hesse, M.; Modolell, M.; La Flamme, A.C.; Schito, M.; Fuentes, J.M.; Cheever, A.W.; Pearce, E.J.; Wynn, T.A. Differential regulation of nitric oxide synthase-2 and arginase-1 by type 1/type 2 cytokines in vivo: Granulomatous pathology is shaped by the pattern of L-arginine metabolism. J. Immunol. 2001, 167, 6533–6544. [Google Scholar] [CrossRef] [Green Version]
- Mattila, J.T.; Ojo, O.O.; Kepka-Lenhart, D.; Marino, S.; Kim, J.H.; Eum, S.Y.; Via, L.E.; Barry, C.E.; Klein, E.; Kirschner, D.E.; et al. Microenvironments in tuberculous granulomas are delineated by distinct populations of macrophage subsets and expression of nitric oxide synthase and arginase isoforms. J. Immunol. 2013, 191, 773–784. [Google Scholar] [CrossRef] [Green Version]
- El Kasmi, K.C.; Qualls, J.E.; Pesce, J.T.; Smith, A.M.; Thompson, R.W.; Henao-Tamayo, M.; Basaraba, R.J.; Konig, T.; Schleicher, U.; Koo, M.S.; et al. Toll-like receptor-induced arginase 1 in macrophages thwarts effective immunity against intracellular pathogens. Nat. Immunol. 2008, 9, 1399–1406. [Google Scholar] [CrossRef] [Green Version]
- Cronan, M.R.; Hughes, E.J.; Brewer, W.J.; Viswanathan, G.; Hunt, E.G.; Singh, B.; Mehra, S.; Oehlers, S.H.; Gregory, S.G.; Kaushal, D.; et al. A non-canonical type 2 immune response coordinates tuberculous granuloma formation and epithelialization. Cell 2021, 184, 1757–1774.e14. [Google Scholar] [CrossRef]
- Kramnik, I.; Beamer, G. Mouse models of human TB pathology: Roles in the analysis of necrosis and the development of host-directed therapies. Semin. Immunopathol. 2016, 38, 221–237. [Google Scholar] [CrossRef] [Green Version]
- Blanc, L.; Lenaerts, A.; Dartois, V.; Prideaux, B. Visualization of Mycobacterial Biomarkers and Tuberculosis Drugs in Infected Tissue by MALDI-MS Imaging. Anal. Chem. 2018, 90, 6275–6282. [Google Scholar] [CrossRef] [Green Version]
- Prideaux, B.; Lenaerts, A.; Dartois, V. Imaging and spatially resolved quantification of drug distribution in tissues by mass spectrometry. Curr. Opin. Chem. Biol. 2018, 44, 93–100. [Google Scholar] [CrossRef] [PubMed]
- Verma, D.; Stapleton, M.; Gadwa, J.; Vongtongsalee, K.; Schenkel, A.R.; Chan, E.D.; Ordway, D. Mycobacterium avium Infection in a C3HeB/FeJ Mouse Model. Front. Microbiol. 2019, 10, 693. [Google Scholar] [CrossRef] [PubMed] [Green Version]
- Andréjak, C.; Almeida, D.V.; Tyagi, S.; Converse, P.J.; Ammerman, N.C.; Grosset, J.H. Characterization of mouse models of Mycobacterium avium complex infection and evaluation of drug combinations. Antimicrob. Agents Chemother. 2015, 59, 2129–2135. [Google Scholar] [CrossRef] [PubMed] [Green Version]
- Appelberg, R. Pathogenesis of Mycobacterium avium infection: Typical responses to an atypical mycobacterium? Immunol. Res. 2006, 35, 179–190. [Google Scholar] [CrossRef]
- Kondratieva, E.V.; Evstifeev, V.V.; Kondratieva, T.K.; Petrovskaya, S.N.; Pichugin, A.V.; Rubakova, E.I.; Averbakh, M.M., Jr.; Apt, A.S. I/St Mice Hypersusceptible to Mycobacterium tuberculosis Are Resistant to M. avium. Infect. Immun. 2007, 75, 4762–4768. [Google Scholar] [CrossRef] [PubMed] [Green Version]
- Wessling-Resnick, M. Nramp1 and Other Transporters Involved in Metal Withholding during Infection. J. Biol. Chem. 2015, 290, 18984–18990. [Google Scholar] [CrossRef] [Green Version]
- Bellamy, R.; Ruwende, C.; Corrah, T.; McAdam, K.P.; Whittle, H.C.; Hill, A.V. Variations in the NRAMP1 gene and susceptibility to tuberculosis in West Africans. N. Engl. J. Med. 1998, 338, 640–644. [Google Scholar] [CrossRef]
- Stienstra, Y.; van der Werf, T.S.; Oosterom, E.; Nolte, I.M.; van der Graaf, W.T.; Etuaful, S.; Raghunathan, P.L.; Whitney, E.A.; Ampadu, E.O.; Asamoa, K.; et al. Susceptibility to Buruli ulcer is associated with the SLC11A1 (NRAMP1) D543N polymorphism. Genes Immun. 2006, 7, 185–189. [Google Scholar] [CrossRef] [Green Version]
- Kramnik, I.; Dietrich, W.F.; Demant, P.; Bloom, B.R. Genetic control of resistance to experimental infection with virulent Mycobacterium tuberculosis. Proc. Natl. Acad. Sci. USA 2000, 97, 8560–8565. [Google Scholar] [CrossRef] [Green Version]
- Pan, H.; Yan, B.S.; Rojas, M.; Shebzukhov, Y.V.; Zhou, H.; Kobzik, L.; Higgins, D.E.; Daly, M.J.; Bloom, B.R.; Kramnik, I. Ipr1 gene mediates innate immunity to tuberculosis. Nature 2005, 434, 767–772. [Google Scholar] [CrossRef]
- Pichugin, A.V.; Yan, B.S.; Sloutsky, A.; Kobzik, L.; Kramnik, I. Dominant role of the sst1 locus in pathogenesis of necrotizing lung granulomas during chronic tuberculosis infection and reactivation in genetically resistant hosts. Am. J. Pathol. 2009, 174, 2190–2201. [Google Scholar] [CrossRef] [Green Version]
- Sissons, J.; Yan, B.S.; Pichugin, A.V.; Kirby, A.; Daly, M.J.; Kramnik, I. Multigenic control of tuberculosis resistance: Analysis of a QTL on mouse chromosome 7 and its synergism with sst1. Genes Immun. 2009, 10, 37–46. [Google Scholar] [CrossRef] [PubMed] [Green Version]
- Yan, B.S.; Kirby, A.; Shebzukhov, Y.V.; Daly, M.J.; Kramnik, I. Genetic architecture of tuberculosis resistance in a mouse model of infection. Genes Immun. 2006, 7, 201–210. [Google Scholar] [CrossRef] [PubMed] [Green Version]
- Bhattacharya, B.; Xiao, S.; Chatterjee, S.; Urbanowski, M.; Ordonez, A.; Ihms, E.A.; Agrahari, G.; Lun, S.; Berland, R.; Pichugin, A.; et al. The integrated stress response mediates necrosis in murine Mycobacterium tuberculosis granulomas. J. Clin. Investig. 2021, 131, 3. [Google Scholar] [CrossRef] [PubMed]
- Brownhill, E.; Yabaji, S.M.; Zhernovkov, V.; Rukhlenko, O.S.; Seidel, K.; Bhattacharya, B.; Chatterjee, S.; Chen, H.A.; Crossland, N.; Bishai, W.; et al. Maladaptive oxidative stress cascade drives type I interferon hyperactivity in TNF activated macrophages promoting necrosis in murine tuberculosis granulomas. bioRxiv 2020. [Google Scholar] [CrossRef]
- He, X.; Berland, R.; Mekasha, S.; Christensen, T.G.; Alroy, J.; Kramnik, I.; Ingalls, R.R. The sst1 resistance locus regulates evasion of type I interferon signaling by Chlamydia pneumoniae as a disease tolerance mechanism. PLoS Pathog. 2013, 9, e1003569. [Google Scholar] [CrossRef]
- Ji, D.X.; Yamashiro, L.H.; Chen, K.J.; Mukaida, N.; Kramnik, I.; Darwin, K.H.; Vance, R.E. Type I interferon-driven susceptibility to Mycobacterium tuberculosis is mediated by IL-1Ra. Nat. Microbiol. 2019, 4, 2128–2135. [Google Scholar] [CrossRef]
- Yan, B.S.; Pichugin, A.V.; Jobe, O.; Helming, L.; Eruslanov, E.B.; Gutiérrez-Pabello, J.A.; Rojas, M.; Shebzukhov, Y.V.; Kobzik, L.; Kramnik, I. Progression of pulmonary tuberculosis and efficiency of bacillus Calmette-Guérin vaccination are genetically controlled via a common sst1-mediated mechanism of innate immunity. J. Immunol. 2007, 179, 6919–6932. [Google Scholar] [CrossRef] [Green Version]
- Ji, D.X.; Witt, K.C.; Kotov, D.I.; Margolis, S.R.; Louie, A.; Chevée, V.; Chen, K.J.; Gaidt, M.M.; Dhaliwal, H.S.; Lee, A.Y.; et al. Role of the transcriptional regulator SP140 in resistance to bacterial infections via repression of type I interferons. eLife 2021, 10, e67290. [Google Scholar] [CrossRef]
- Jabado, N.; Jankowski, A.; Dougaparsad, S.; Picard, V.; Grinstein, S.; Gros, P. Natural resistance to intracellular infections: Natural resistance-associated macrophage protein 1 (Nramp1) functions as a pH-dependent manganese transporter at the phagosomal membrane. J. Exp. Med. 2000, 192, 1237–1248. [Google Scholar] [CrossRef]
- Linge, I.; Petrova, E.; Dyatlov, A.; Kondratieva, T.; Logunova, N.; Majorov, K.; Kondratieva, E.; Apt, A. Reciprocal control of Mycobacterium avium and Mycobacterium tuberculosis infections by the alleles of the classic Class II H2-Aβ gene in mice. Infect. Genet. Evol. J. Mol. Epidemiol. Evol. Genet. Infect. Dis. 2019, 74, 103933. [Google Scholar] [CrossRef] [PubMed]
- Larsen, S.E.; Reese, V.A.; Pecor, T.; Berube, B.J.; Cooper, S.K.; Brewer, G.; Ordway, D.; Henao-Tamayo, M.; Podell, B.K.; Baldwin, S.L.; et al. Subunit vaccine protects against a clinical isolate of Mycobacterium avium in wild type and immunocompromised mouse models. Sci. Rep. 2021, 11, 9040. [Google Scholar] [CrossRef] [PubMed]
- Van Waarde, G.S.C.; Domling, A.I. Arginase as a Potential Biomarker of Disease Progression: A Molecular Imaging Perspective. Int. J. Mol. Sci. 2020, 21, 15. [Google Scholar]
- Pessanha, A.P.; Martins, R.A.; Mattos-Guaraldi, A.L.; Vianna, A.; Moreira, L.O. Arginase-1 expression in granulomas of tuberculosis patients. FEMS Immunol. Med. Microbiol. 2012, 66, 265–268. [Google Scholar] [CrossRef] [PubMed]
- MacMicking, J.D.; North, R.J.; LaCourse, R.; Mudgett, J.S.; Shah, S.K.; Nathan, C.F. Identification of nitric oxide synthase as a protective locus against tuberculosis. Proc. Natl. Acad. Sci. USA 1997, 94, 5243–5248. [Google Scholar] [CrossRef] [PubMed] [Green Version]
- Gomes, M.S.; Florido, M.; Pais, T.F.; Appelberg, R. Improved clearance of Mycobacterium avium upon disruption of the inducible nitric oxide synthase gene. J. Immunol. 1999, 162, 6734–6739. [Google Scholar]
- Bronte, V.; Serafini, P.; De Santo, C.; Marigo, I.; Tosello, V.; Mazzoni, A.; Segal, D.M.; Staib, C.; Lowel, M.; Sutter, G.; et al. IL-4-induced arginase 1 suppresses alloreactive T cells in tumor-bearing mice. J. Immunol. 2003, 170, 270–278. [Google Scholar] [CrossRef]
- Duque-Correa, M.A.; Kuhl, A.A.; Rodriguez, P.C.; Zedler, U.; Schommer-Leitner, S.; Rao, M.; Weiner, J.; Hurwitz, R.; Qualls, J.E.; Kosmiadi, G.A.; et al. Macrophage arginase-1 controls bacterial growth and pathology in hypoxic tuberculosis granulomas. Proc. Natl. Acad. Sci. USA 2014, 111, E4024–E4032. [Google Scholar] [CrossRef] [Green Version]
- Murray, P.J.; Allen, J.E.; Biswas, S.K.; Fisher, E.A.; Gilroy, D.W.; Goerdt, S.; Gordon, S.; Hamilton, J.A.; Ivashkiv, L.B.; Lawrence, T.; et al. Macrophage activation and polarization: Nomenclature and experimental guidelines. Immunity 2014, 41, 14–20. [Google Scholar] [CrossRef] [Green Version]
- Darrah, P.A.; Zeppa, J.J.; Maiello, P.; Hackney, J.A.; Wadsworth II, M.H.; Hughes, T.K.; Pokkali, S.; Swanson II, P.A.; Grant, N.L.; Rodgers, M.A.; et al. Prevention of tuberculosis in macaques after intravenous BCG immunization. Nature 2020, 577, 95–102. [Google Scholar] [CrossRef]
- Kramnik, I.; Radzioch, D.; Skamene, E. T-helper 1-like subset selection in Mycobacterium bovis bacillus Calmette-Guérin-infected resistant and susceptible mice. Immunology 1994, 81, 618–625. [Google Scholar] [PubMed]
- McNab, F.; Mayer-Barber, K.; Sher, A.; Wack, A.; O’Garra, A. Type I interferons in infectious disease. Nat. Rev. Immunol. 2015, 15, 87–103. [Google Scholar] [CrossRef] [PubMed]
- Moreira-Teixeira, L.; Mayer-Barber, K.; Sher, A.; O’Garra, A. Type I interferons in tuberculosis: Foe and occasionally friend. J. Exp. Med. 2018, 215, 1273–1285. [Google Scholar] [CrossRef] [PubMed] [Green Version]
- Scriba, T.J.; Penn-Nicholson, A.; Shankar, S.; Hraha, T.; Thompson, E.G.; Sterling, D.; Nemes, E.; Darboe, F.; Suliman, S.; Amon, L.M.; et al. Sequential inflammatory processes define human progression from M. tuberculosis infection to tuberculosis disease. PLoS Pathog. 2017, 13, e1006687. [Google Scholar] [CrossRef] [PubMed] [Green Version]
- Benini, J.; Ehlers, E.M.; Ehlers, S. Different types of pulmonary granuloma necrosis in immunocompetent vs. TNFRp55-gene-deficient mice aerogenically infected with highly virulent Mycobacterium avium. J. Pathol. 1999, 189, 127–137. [Google Scholar] [CrossRef]
- Gideon, H.P.; Hughes, T.K.; Tzouanas, C.N.; Wadsworth, M.H., 2nd; Tu, A.A.; Gierahn, T.M.; Peters, J.M.; Hopkins, F.F.; Wei, J.R.; Kummerlowe, C.; et al. Multimodal profiling of lung granulomas in macaques reveals cellular correlates of tuberculosis control. Immunity 2022, 55, 827–846.e10. [Google Scholar] [CrossRef]
- Scheu, S.; Dresing, P.; Locksley, R.M. Visualization of IFNbeta production by plasmacytoid versus conventional dendritic cells under specific stimulation conditions in vivo. Proc. Natl. Acad. Sci. USA 2008, 105, 20416–204121. [Google Scholar] [CrossRef] [Green Version]


Publisher’s Note: MDPI stays neutral with regard to jurisdictional claims in published maps and institutional affiliations. |
© 2022 by the authors. Licensee MDPI, Basel, Switzerland. This article is an open access article distributed under the terms and conditions of the Creative Commons Attribution (CC BY) license (https://creativecommons.org/licenses/by/4.0/).
Share and Cite
Rosenbloom, R.; Gavrish, I.; Tseng, A.E.; Seidel, K.; Yabaji, S.M.; Gertje, H.P.; Huber, B.R.; Kramnik, I.; Crossland, N.A. Progression and Dissemination of Pulmonary Mycobacterium Avium Infection in a Susceptible Immunocompetent Mouse Model. Int. J. Mol. Sci. 2022, 23, 5999. https://0-doi-org.brum.beds.ac.uk/10.3390/ijms23115999
Rosenbloom R, Gavrish I, Tseng AE, Seidel K, Yabaji SM, Gertje HP, Huber BR, Kramnik I, Crossland NA. Progression and Dissemination of Pulmonary Mycobacterium Avium Infection in a Susceptible Immunocompetent Mouse Model. International Journal of Molecular Sciences. 2022; 23(11):5999. https://0-doi-org.brum.beds.ac.uk/10.3390/ijms23115999
Chicago/Turabian StyleRosenbloom, Raymond, Igor Gavrish, Anna E. Tseng, Kerstin Seidel, Shivraj M. Yabaji, Hans P. Gertje, Bertrand R. Huber, Igor Kramnik, and Nicholas A. Crossland. 2022. "Progression and Dissemination of Pulmonary Mycobacterium Avium Infection in a Susceptible Immunocompetent Mouse Model" International Journal of Molecular Sciences 23, no. 11: 5999. https://0-doi-org.brum.beds.ac.uk/10.3390/ijms23115999