
How Do Phenolic Acids Change the Secondary and Tertiary Structure of Gliadin? Studies with an Application of Spectroscopic Techniques

 , ,
, , 
Abstract
:1. Introduction
2. Results
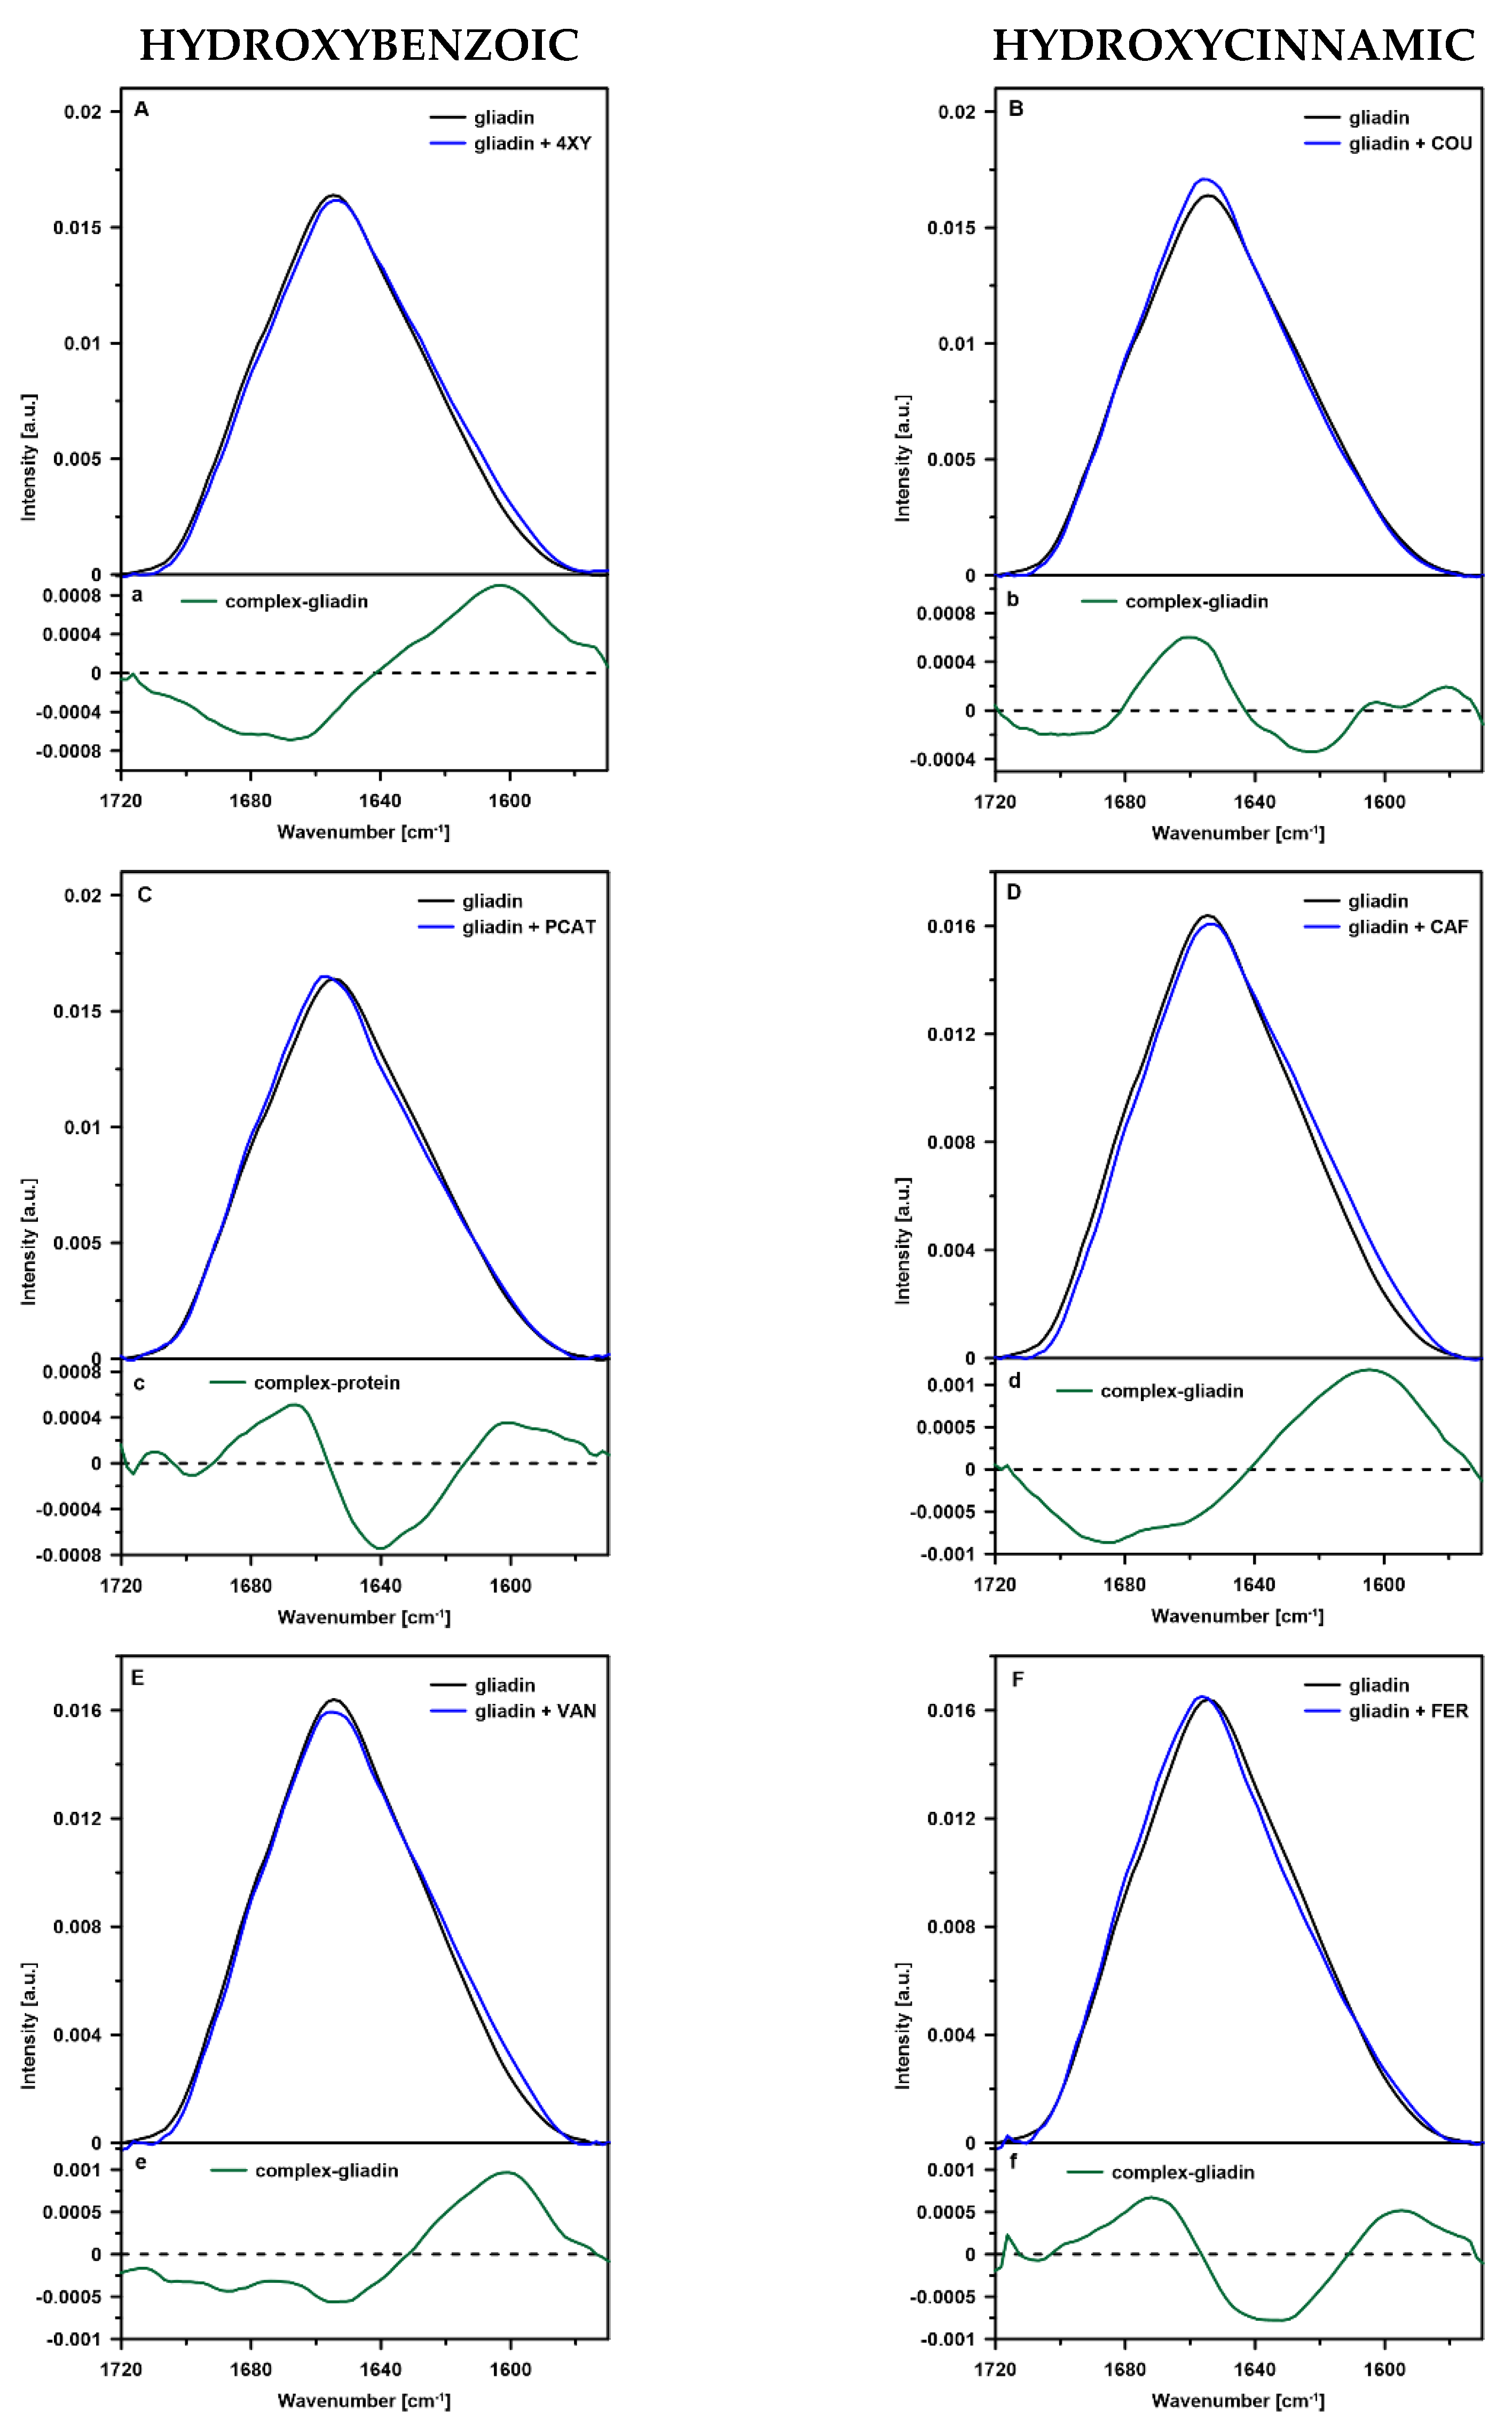
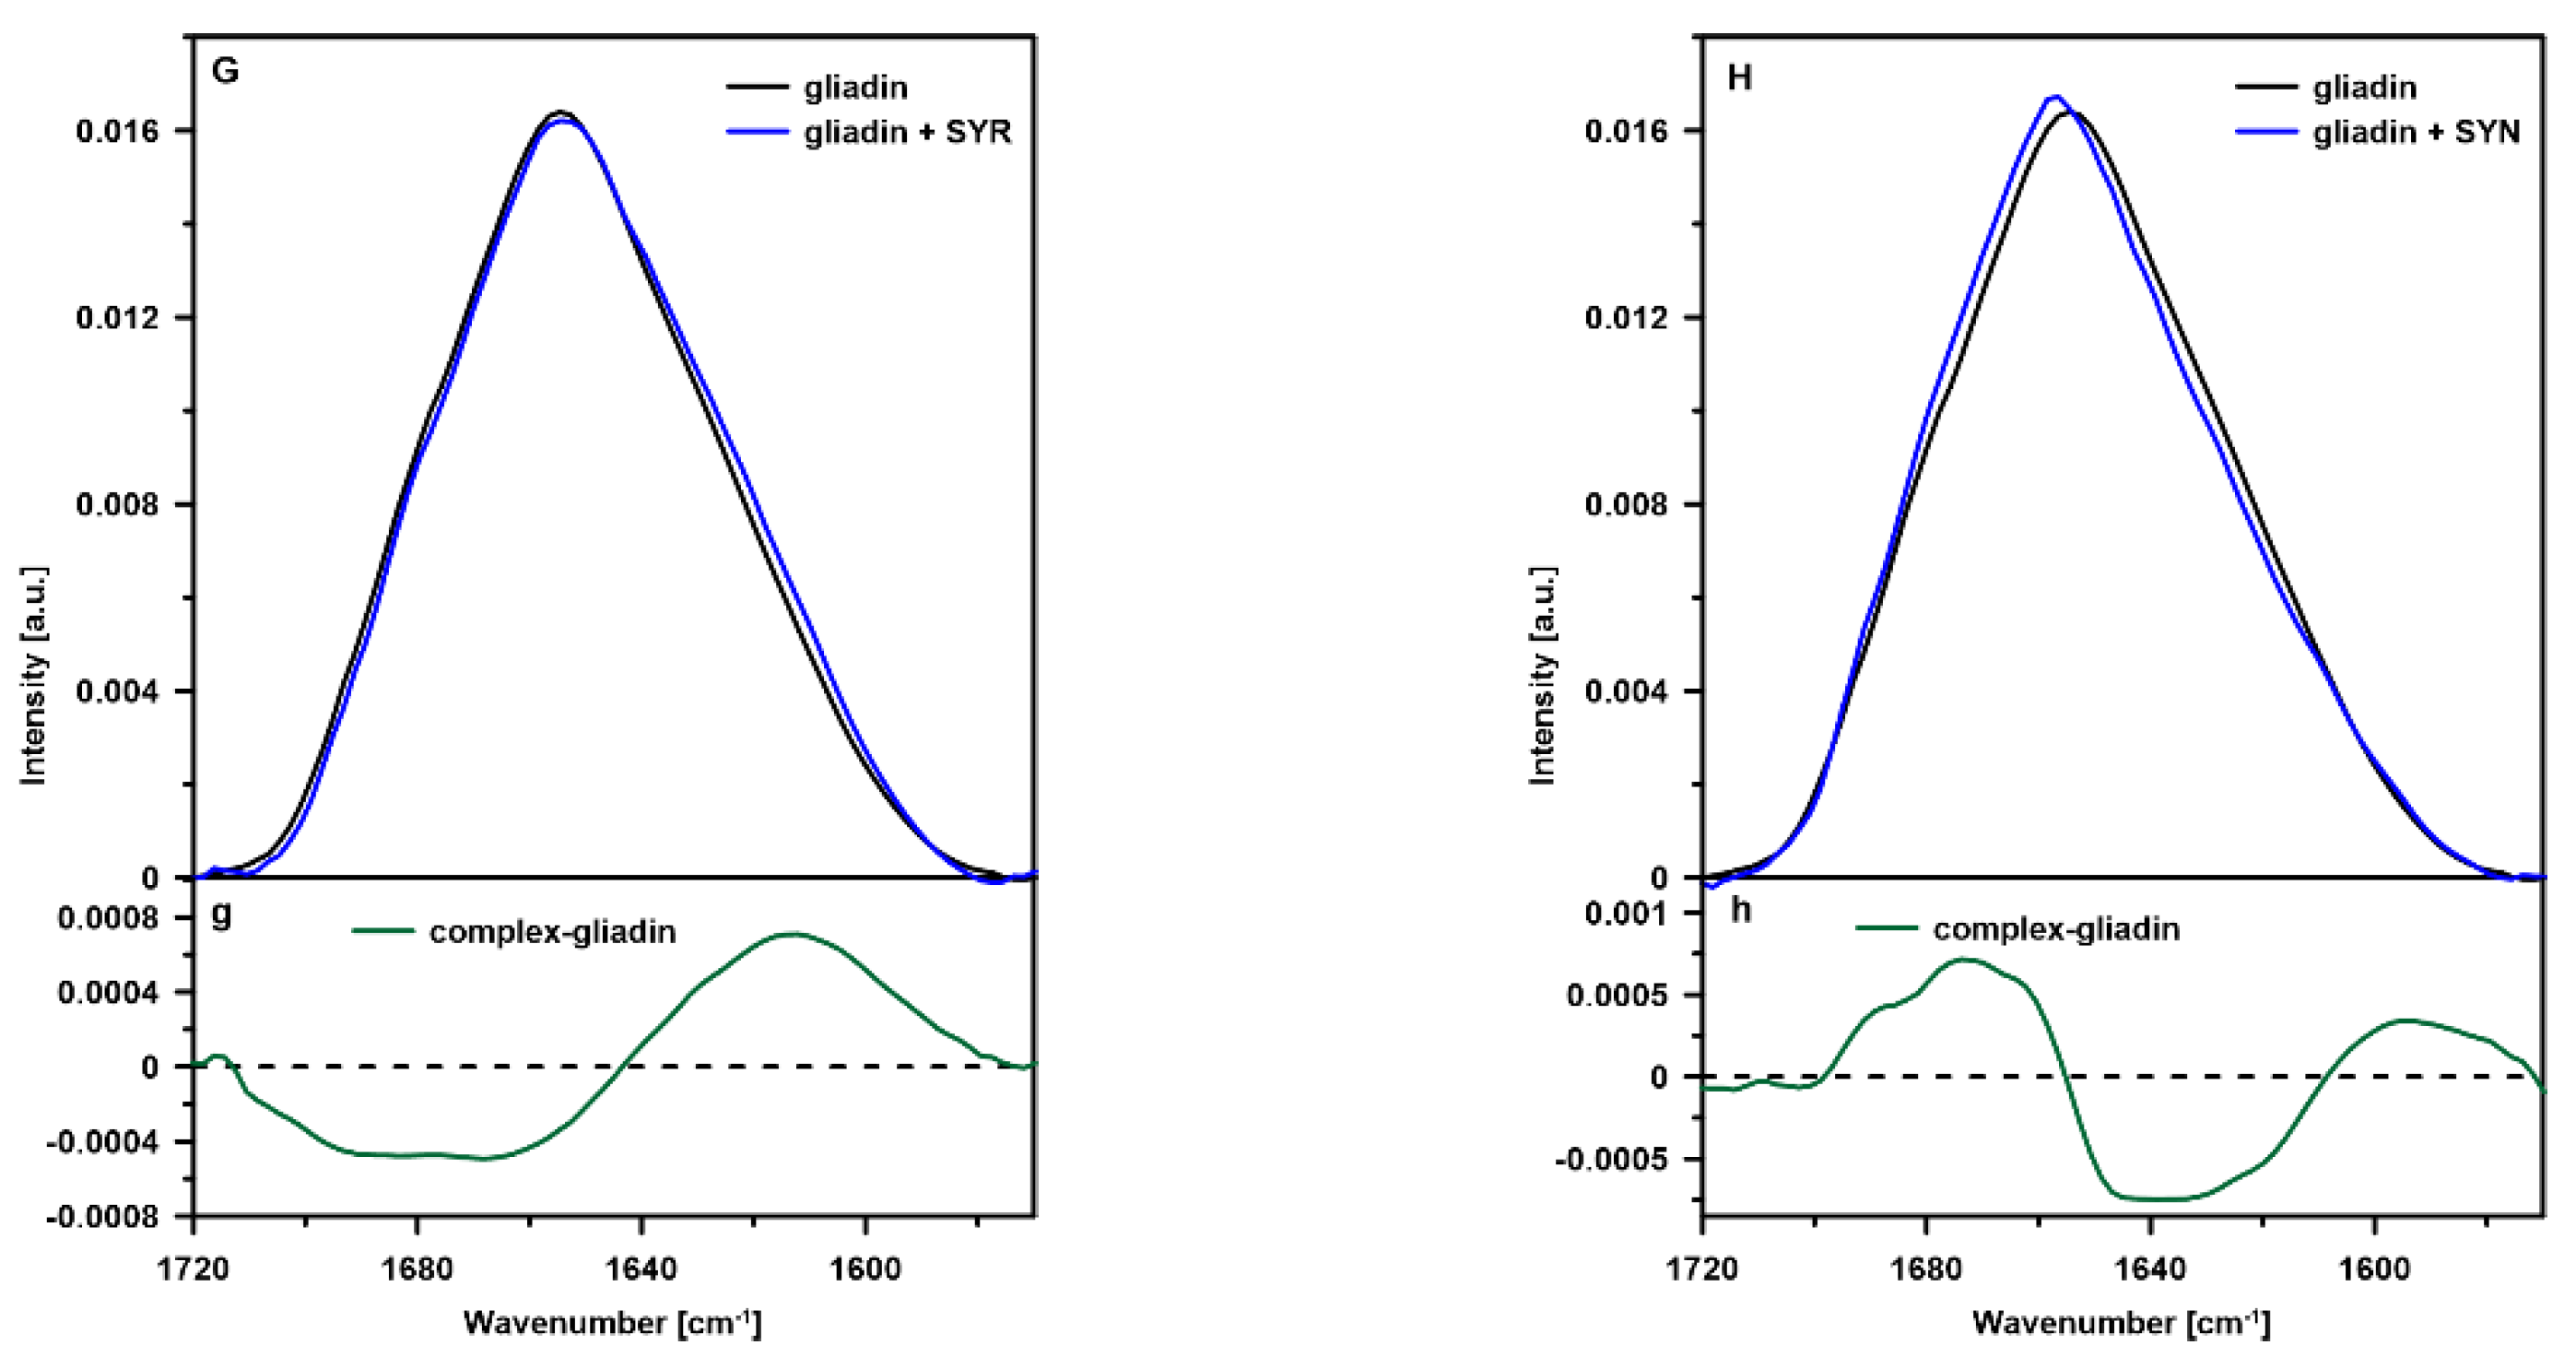
2.1. FTIR
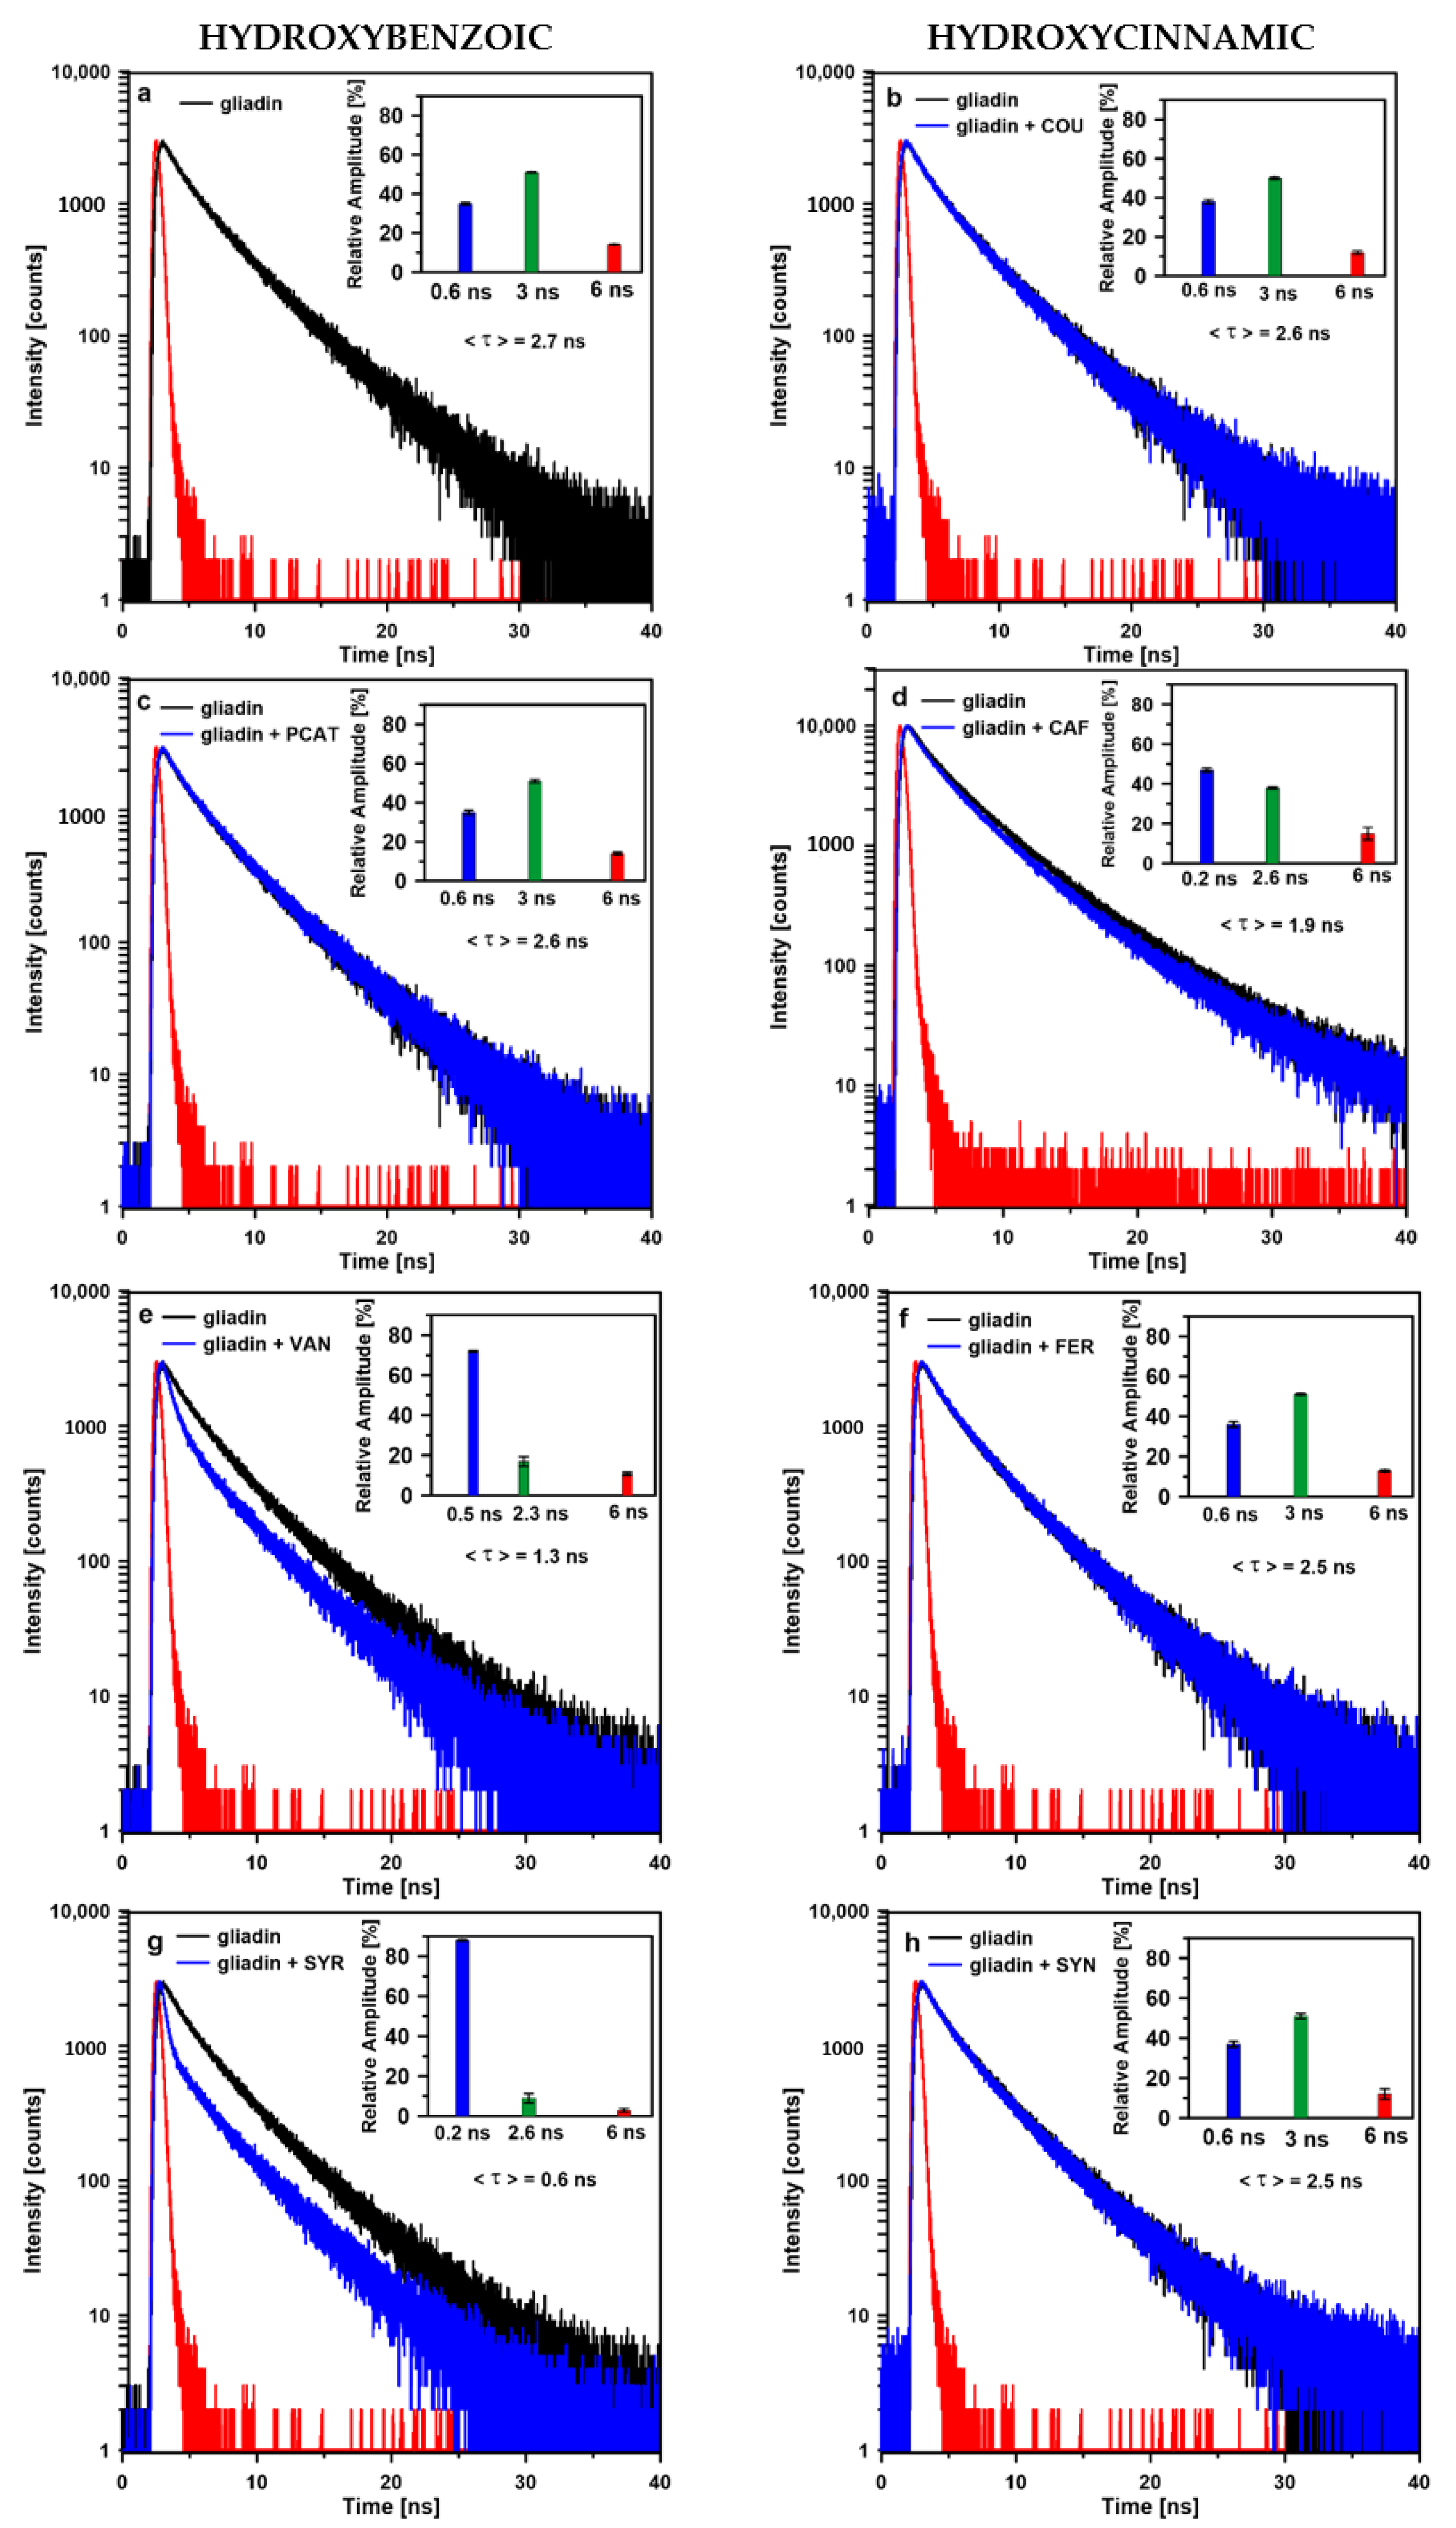
2.2. Time-Resolved Fluorescence
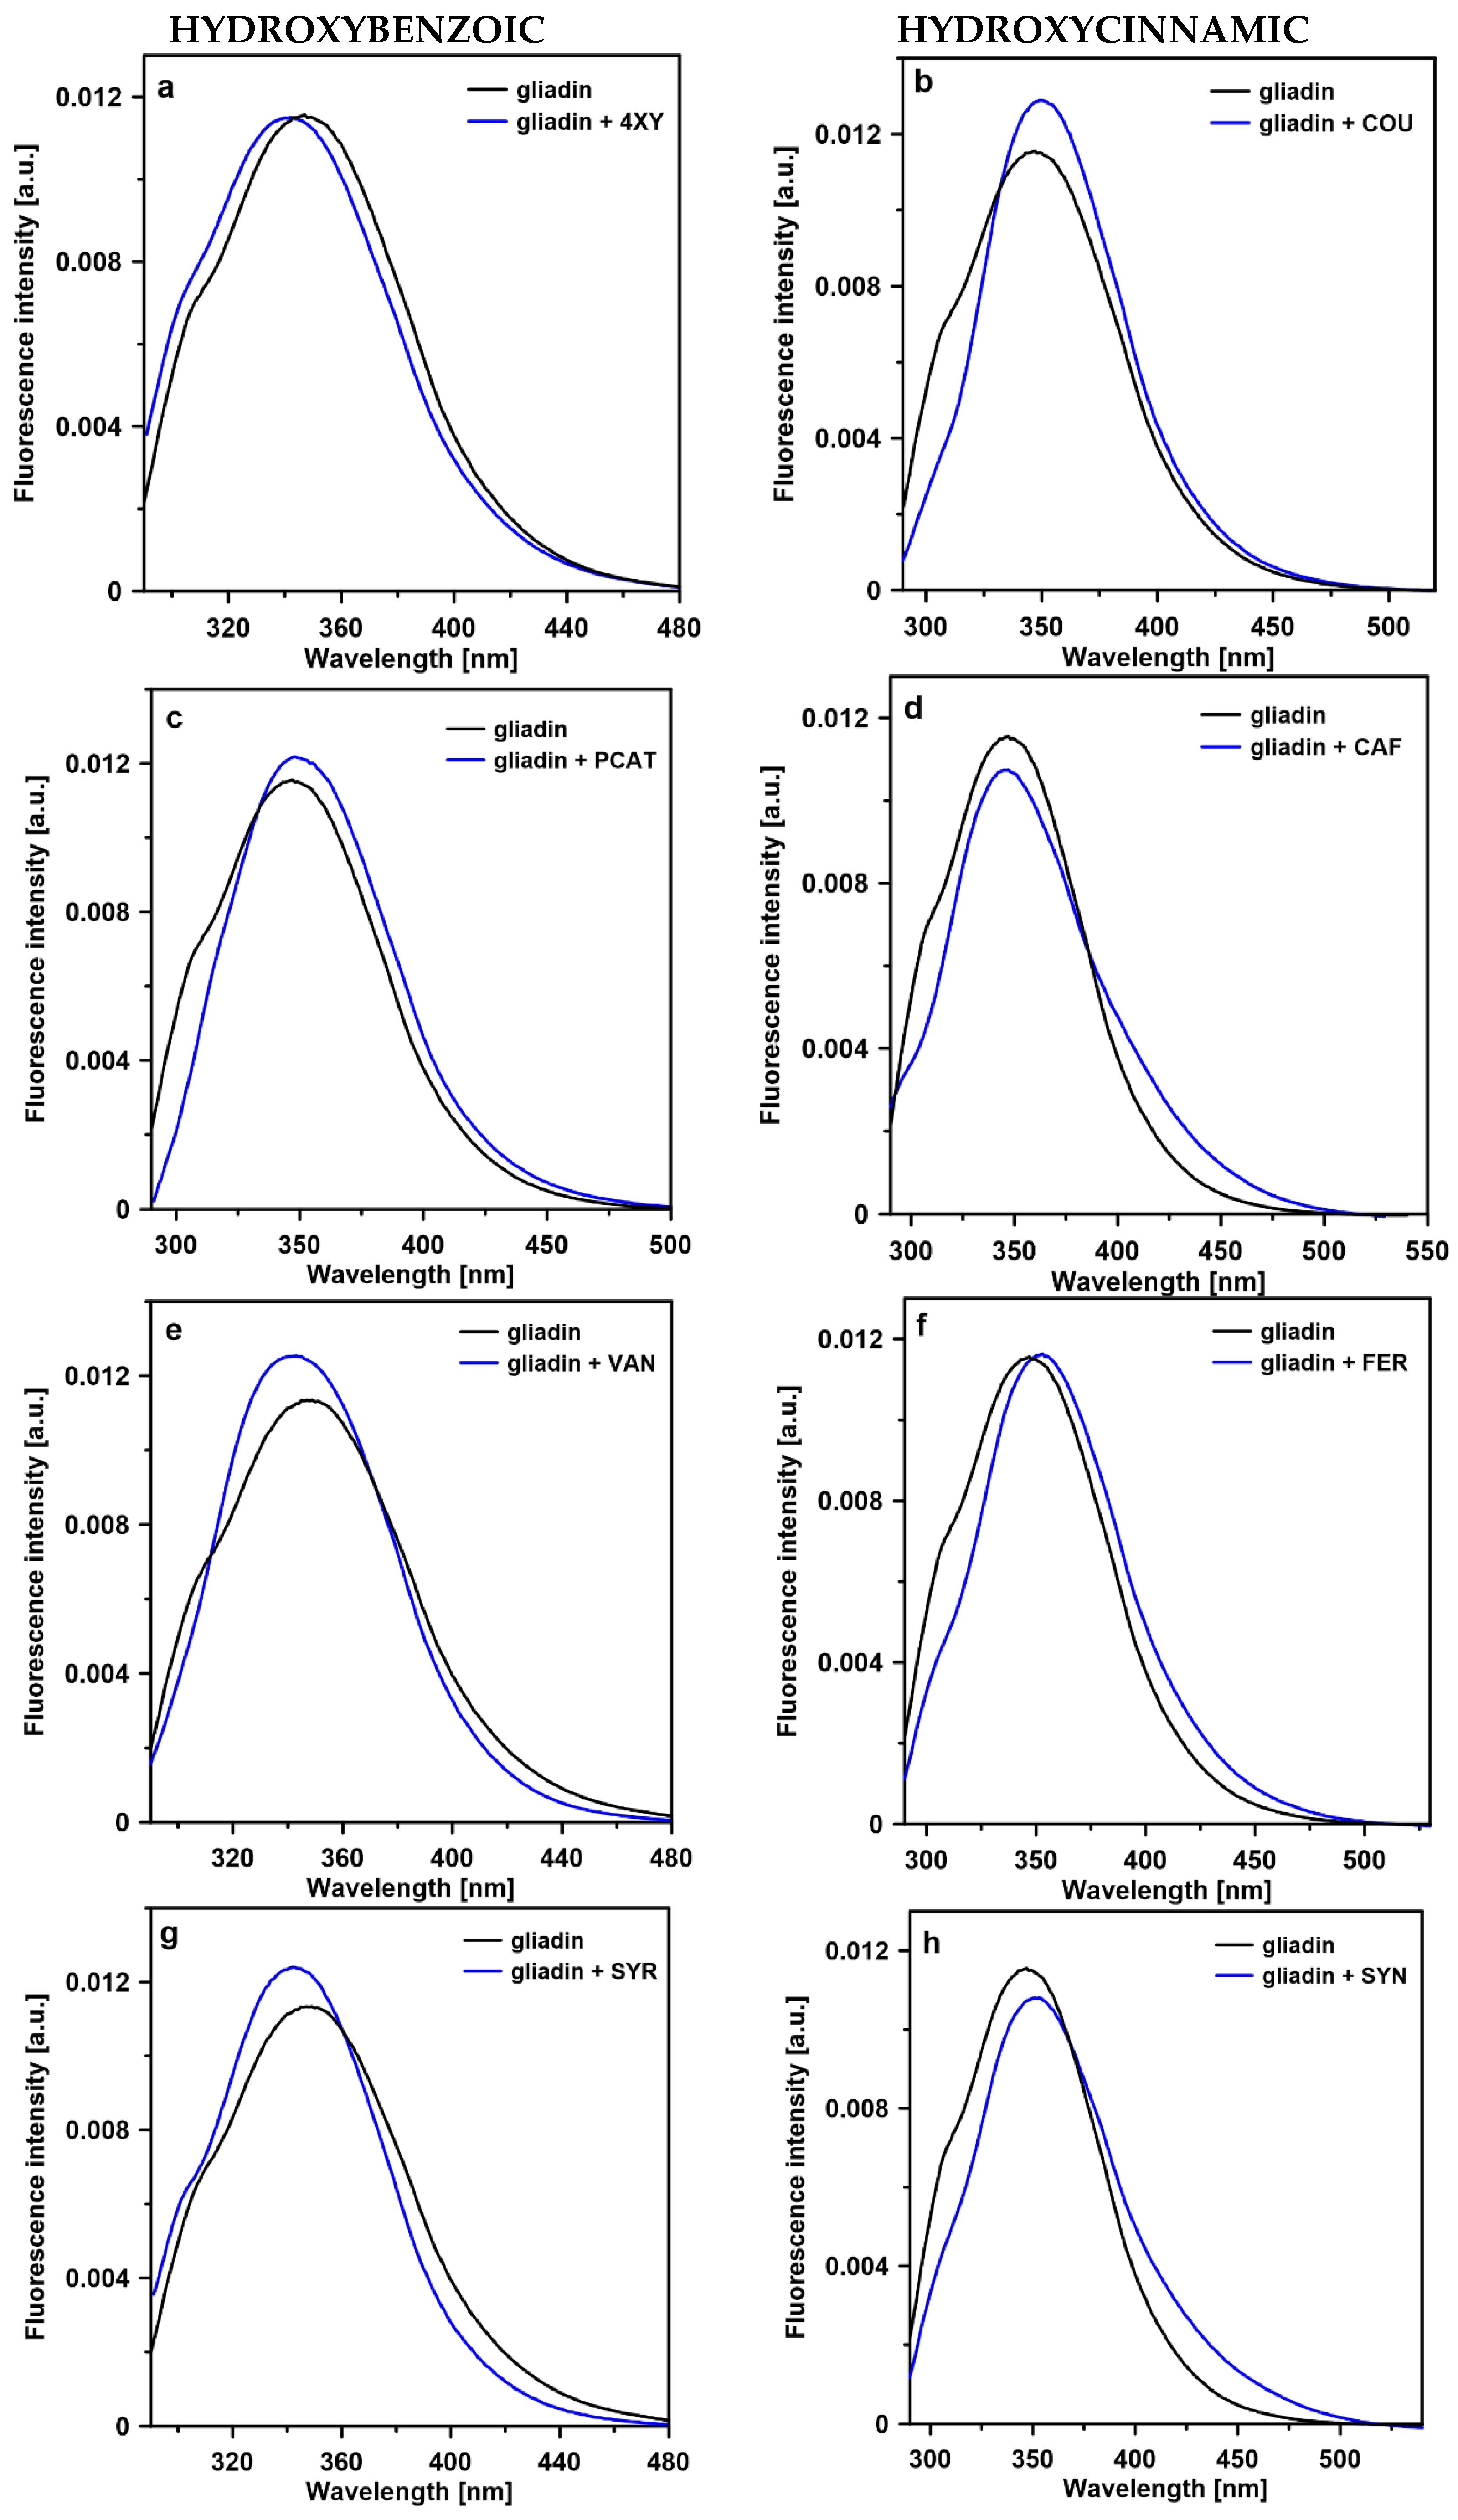
2.3. Steady-State Fluorescence
3. Materials and Methods
3.1. Materials
3.2. Samples Preparation
3.3. Fourier Transform Infrared Spectroscopy
3.4. Steady-State Fluorescence
3.5. Time-Resolved Fluorescence
4. Conclusions
Supplementary Materials
Author Contributions
Funding
Institutional Review Board Statement
Informed Consent Statement
Data Availability Statement
Conflicts of Interest
References
- Wrigley, C.W.; Shepherd, K.W. Electrofocusing of Grain Proteins from Wheat Genotypes. Ann. N. Y. Acad. Sci. 1973, 209, 154–162. [Google Scholar] [CrossRef] [PubMed]
- Elzoghby, A.O.; Samy, W.M.; Elgindy, N.A. Protein-Based Nanocarriers as Promising Drug and Gene Delivery Systems. J. Control. Release 2012, 161, 38–49. [Google Scholar] [CrossRef] [PubMed]
- Fraga, G.C.; Croft, D.K.; Kennedy, O.D.; Tomás-Barberán, A.F. The Effects of Polyphenols and Other Bioactives on Human Health. Food Funct. 2019, 10, 514–528. [Google Scholar] [CrossRef] [PubMed] [Green Version]
- Yan, Z.; Zhong, Y.; Duan, Y.; Chen, Q.; Li, F. Antioxidant Mechanism of Tea Polyphenols and Its Impact on Health Benefits. Anim. Nutr. 2020, 6, 115–123. [Google Scholar] [CrossRef]
- Khan, P.; Rahman, S.; Queen, A.; Manzoor, S.; Naz, F.; Hasan, G.M.; Luqman, S.; Kim, J.; Islam, A.; Ahmad, F.; et al. Elucidation of Dietary Polyphenolics as Potential Inhibitor of Microtubule Affinity Regulating Kinase 4: In Silico and In Vitro Studies. Sci. Rep. 2017, 7, 9470. [Google Scholar] [CrossRef] [PubMed]
- Glei, M.; Kirmse, A.; Habermann, N.; Persin, C.; Pool-Zobel, B.L. Bread Enriched with Green Coffee Extract Has Chemoprotective and Antigenotoxic Activities in Human Cells. Nutr. Cancer 2006, 56, 182–192. [Google Scholar] [CrossRef]
- Nawrocka, A.; Szymańska-Chargot, M.; Miś, A.; Wilczewska, A.Z.; Markiewicz, K.H. Dietary Fiber-Induced Changes in the Structure and Thermal Properties of Gluten Proteins Studied by Fourier Transform-Raman Spectroscopy and Thermogravimetry. J. Agric. Food Chem. 2016, 64, 2094–2104. [Google Scholar] [CrossRef]
- Nawrocka, A.; Szymańska-Chargot, M.; Miś, A.; Wilczewska, A.Z.; Markiewicz, K.H. Aggregation of Gluten Proteins in Model Dough after Fibre Polysaccharide Addition. Food Chem. 2017, 231, 51–60. [Google Scholar] [CrossRef]
- Sivam, A.S.; Sun-Waterhouse, D.; Perera, C.O.; Waterhouse, G.I.N. Exploring the Interactions between Blackcurrant Polyphenols, Pectin and Wheat Biopolymers in Model Breads; a FTIR and HPLC Investigation. Food Chem. 2012, 131, 802–810. [Google Scholar] [CrossRef]
- Mazzaracchio, P.; Tozzi, S.; Boga, C.; Forlani, L.; Pifferi, P.G.; Barbiroli, G. Interaction between Gliadins and Anthocyan Derivatives. Food Chem. 2011, 129, 1100–1107. [Google Scholar] [CrossRef] [PubMed]
- Taddei, P.; Zanna, N.; Tozzi, S. Raman Characterization of the Interactions between Gliadins and Anthocyanins. J. Raman Spectrosc. 2013, 44, 1435–1439. [Google Scholar] [CrossRef]
- Tozzi, S.; Zanna, N.; Taddei, P. Study on the Interaction between Gliadins and a Coumarin as Molecular Model System of the Gliadins–Anthocyanidins Complexes. Food Chem. 2013, 141, 3586–3597. [Google Scholar] [CrossRef]
- Mulaudzi, R.B.; Ndhlala, A.R.; Kulkarni, M.G.; Van Staden, J. Pharmacological Properties and Protein Binding Capacity of Phenolic Extracts of Some Venda Medicinal Plants Used against Cough and Fever. J. Ethnopharmacol. 2012, 143, 185–193. [Google Scholar] [CrossRef]
- Kłosok, K.; Welc, R.; Fornal, E.; Nawrocka, A. Effects of Physical and Chemical Factors on the Structure of Gluten, Gliadins and Glutenins as Studied with Spectroscopic Methods. Molecules 2021, 26, 508. [Google Scholar] [CrossRef]
- Nawrocka, A.; Krekora, M.; Niewiadomski, Z.; Miś, A. FTIR Studies of Gluten Matrix Dehydration after Fibre Polysaccharide Addition. Food Chem. 2018, 252, 198–206. [Google Scholar] [CrossRef] [PubMed]
- Secundo, F.; Guerrieri, N. ATR-FT/IR Study on the Interactions between Gliadins and Dextrin and Their Effects on Protein Secondary Structure. J. Agric. Food Chem. 2005, 53, 1757–1764. [Google Scholar] [CrossRef]
- Juszczyk, P.; Kołodziejczyk, A.S.; Grzonka, Z. FTIR Spectroscopic Studies on Aggregation Process of the Beta-Amyloid 11-28 Fragment and Its Variants. J. Pept. Sci. 2009, 15, 23–29. [Google Scholar] [CrossRef]
- Cao, Y.; Mezzenga, R. Food Protein Amyloid Fibrils: Origin, Structure, Formation, Characterization, Applications and Health Implications. Adv. Colloid Interface Sci. 2019, 269, 334–356. [Google Scholar] [CrossRef] [PubMed]
- Adamcik, J.; Mezzenga, R. Amyloid Polymorphism in the Protein Folding and Aggregation Energy Landscape. Angew. Chem. Int. Ed. 2018, 57, 8370–8382. [Google Scholar] [CrossRef]
- Velander, P.; Wu, L.; Henderson, F.; Zhang, S.; Bevan, D.R.; Xu, B. Natural Product-Based Amyloid Inhibitors. Biochem. Pharmacol. 2017, 139, 40–55. [Google Scholar] [CrossRef] [PubMed] [Green Version]
- Cao, P.; Raleigh, D.P. Analysis of the Inhibition and Remodeling of Islet Amyloid Polypeptide Amyloid Fibers by Flavanols. Biochemistry 2012, 51, 2670–2683. [Google Scholar] [CrossRef] [PubMed] [Green Version]
- Sato, M.; Murakami, K.; Uno, M.; Nakagawa, Y.; Katayama, S.; Akagi, K.; Masuda, Y.; Takegoshi, K.; Irie, K. Site-Specific Inhibitory Mechanism for Amyloid Β42 Aggregation by Catechol-Type Flavonoids Targeting the Lys Residues *. J. Biol. Chem. 2013, 288, 23212–23224. [Google Scholar] [CrossRef] [Green Version]
- Lakowicz, J.R. Principles of Fluorescence Spectroscopy, 2nd ed.; Kluwer Academic/Plenum Publishers: New York, NY, USA, 1999; ISBN 978-1-4757-3061-6. [Google Scholar]
- Albani, J.R. Origin of Tryptophan Fluorescence Lifetimes Part 1. Fluorescence Lifetimes Origin of Tryptophan Free in Solution. J. Fluoresc. 2014, 24, 93–104. [Google Scholar] [CrossRef] [PubMed]
- Stevenson, S.G.; Preston, K.R. Intrinsic Fluorescence and Quenching Studies of Gluten Proteins. Cereal Chem. 1994, 71, 155–159. [Google Scholar]
- Wang, Q.; Tang, Y.; Yang, Y.; Zhao, J.; Zhang, Y.; Li, L.; Wang, Q.; Ming, J. Interaction between Wheat Gliadin and Quercetin under Different PH Conditions Analyzed by Multi-Spectroscopy Methods. Spectrochim. Acta A Mol. Biomol. Spectrosc. 2020, 229, 117937. [Google Scholar] [CrossRef]
- Skrt, M.; Benedik, E.; Podlipnik, Č.; Ulrih, N.P. Interactions of Different Polyphenols with Bovine Serum Albumin Using Fluorescence Quenching and Molecular Docking. Food Chem. 2012, 135, 2418–2424. [Google Scholar] [CrossRef]
- Kanakis, C.D.; Hasni, I.; Bourassa, P.; Tarantilis, P.A.; Polissiou, M.G.; Tajmir-Riahi, H.-A. Milk β-Lactoglobulin Complexes with Tea Polyphenols. Food Chem. 2011, 127, 1046–1055. [Google Scholar] [CrossRef]


Publisher’s Note: MDPI stays neutral with regard to jurisdictional claims in published maps and institutional affiliations. |
© 2022 by the authors. Licensee MDPI, Basel, Switzerland. This article is an open access article distributed under the terms and conditions of the Creative Commons Attribution (CC BY) license (https://creativecommons.org/licenses/by/4.0/).
Share and Cite
Welc, R.; Luchowski, R.; Kłosok, K.; Gruszecki, W.I.; Nawrocka, A. How Do Phenolic Acids Change the Secondary and Tertiary Structure of Gliadin? Studies with an Application of Spectroscopic Techniques. Int. J. Mol. Sci. 2022, 23, 6053. https://0-doi-org.brum.beds.ac.uk/10.3390/ijms23116053
Welc R, Luchowski R, Kłosok K, Gruszecki WI, Nawrocka A. How Do Phenolic Acids Change the Secondary and Tertiary Structure of Gliadin? Studies with an Application of Spectroscopic Techniques. International Journal of Molecular Sciences. 2022; 23(11):6053. https://0-doi-org.brum.beds.ac.uk/10.3390/ijms23116053
Chicago/Turabian StyleWelc, Renata, Rafał Luchowski, Konrad Kłosok, Wiesław I. Gruszecki, and Agnieszka Nawrocka. 2022. "How Do Phenolic Acids Change the Secondary and Tertiary Structure of Gliadin? Studies with an Application of Spectroscopic Techniques" International Journal of Molecular Sciences 23, no. 11: 6053. https://0-doi-org.brum.beds.ac.uk/10.3390/ijms23116053