Article

Genome-Wide Identification and Analysis of Ariadne Gene Family Reveal Its Genetic Effects on Agronomic Traits of Brassica napus

Key Laboratory of Biology and Genetics Improvement of Oil Crops, Oil Crops Research Institute of Chinese Academy of Agricultural Sciences, Ministry of Agriculture and Rural Affairs, Wuhan 430062, China
*
Authors to whom correspondence should be addressed.
These authors contributed equally to this work.
Int. J. Mol. Sci. 2022, 23(11), 6265; https://0-doi-org.brum.beds.ac.uk/10.3390/ijms23116265
Submission received: 5 May 2022 / Revised: 27 May 2022 / Accepted: 29 May 2022 / Published: 3 June 2022
(This article belongs to the Special Issue Molecular Genetics and Plant Breeding 2.0)

Abstract

:
E3 ligases promote protein ubiquitination and degradation, which regulate every aspect of eukaryotic life. The Ariadne (ARI) proteins of RBR (ring between ring fingers) protein subfamily has been discovered as a group of potential E3 ubiquitin ligases. Only a few available research studies show their role in plant adaptations processes against the external environment. Presently, the functions of ARI proteins are largely unknown in plants. Therefore, in this study, we performed genome-wide analysis to identify the ARI gene family and explore their potential importance in B. napus. A total of 39 ARI genes were identified in the B. napus genome and were classified into three subfamilies (A, B and C) based on phylogenetic analysis. The protein–protein interaction networks and enrichment analysis indicated that BnARI genes could be involved in endoreduplication, DNA repair, proteasome assembly, ubiquitination, protein kinase activity and stress adaptation. The transcriptome data analysis in various tissues provided us an indication of some BnARI genes’ functional importance in tissue development. We also identified potential BnARI genes that were significantly responsive towards the abiotic stresses. Furthermore, eight BnARI genes were identified as candidate genes for multiple agronomic traits through association mapping analysis in B. napus; among them, BnaA02g12100D, which is the ortholog of AtARI8, was significantly associated with ten agronomic traits. This study provided useful information on BnARI genes, which could aid targeted functional research and genetic improvement for breeding in B. napus.

1. Introduction

Ubiquitination is one of the important mechanisms that prepare the cell response toward internal and external stimuli during plant life [1]. It is the process of protein degradation in which the ubiquitin-26S proteasome system (UPS) is the main player [2]. The targeted proteins are first bound to the multiple ubiquitin (Ub) proteins. Ub is a 76-aminoacid protein that is a highly conserved housekeeping protein in all the eukaryotes. A series of enzymes, including ubiquitin-protein ligases (E3), ubiquitin-activating enzymes (E1) and ubiquitin-conjugating enzymes (E2 or Ubc), are used to transfer Ub to a target protein. Firstly, the Ub protein is activated by interacting with E1 and forms a E1-Ub molecule at the expense of ATP molecules. This activated Ub molecule is transferred to E2 through the interaction of E1-Ub with E2 and forms an intermediate complex, E2-Ub. Then, the E3 covalently attaches the Ub with the target protein by interacting with the E2-Ub intermediate complex and target protein. In this way, many targeted proteins are bound to Ub proteins binds by the repetition of the above-mentioned process, and hence are recognized and degraded by the 26S proteasome [1,2,3]. About 6% of A. thaliana proteome constitutes this proteasome system [4]. Among E1, E2 and E3, E3 are most abundant in eukaryotes and 1400 E3s are predicted in A. thaliana [5]. By far, E3s are of more importance because they are diverse, directly interacting with the conjugated Ub and binding to the target protein, therefore maintaining specificity [6]. These E3 ligases maintain the cellular response by targeting cell division, signaling, immune responses and DNA repair [7].
In general, E3 ligases are divided into two groups, each of which has either a HECT domain or a RING (really interesting new gene) domain [7,8]. The RING domain containing E3s is usually identified with a cysteine-histidine rich ring motif with Zinc atoms [7]. It is one of the most detected domains in A. thaliana [9] and it has been involved in protein–protein interaction processes [10]. In Arabidopsis and rice genomes, 426 and 425 RING type E3 ligases have been identified, respectively [6,11]. The RING E3 ligases were responsive towards dehydration, cold and heat treatment in rice leaf tissue [12]. AIRP2 (ABA insensitive RING protein 2) is also a E3 ring type ligase which was involved in Abscisic-Acid-mediated drought tolerance in Arabidopsis [13]. RING E3 ligases also play an important role in the plasticity of the flowering time of plants; for example, the photoperiodic pathways are regulated through ubiquitination and, hence, timely floral induction is ensured [14].
One of the largest group of proteins that contain the RING domain is RBR (ring between ring fingers) proteins, identified by the presence of their RING1-IBR-RING2 domains (RBR supra domain) [15]. It constitutes RING1 at the N-terminal, an IBR (in between ring), and RING2 at the C-terminal. E3 ligase activity is seen in several RBR proteins [15]. The plant RBR proteins consist of Ariadne (ARI proteins), ARA54, Plant II and Helicase subfamilies [16]. The best known RBR protein is Parkin, which is involved in autosomal recessive familial Parkinson’s disease [17,18], and the Ariadne family shares its RBR domain similarity [17,19]. The RING1 is a typical RING finger with a C3HC4 signature of conserved cysteine and histidine residues, the IBR domain has a typical C6HC signature, while the RING2 is shorter than the canonical RING structure. In addition to the RBR domain, ARI proteins also contain the Ariadne domain at the C-terminus [17,20].
The ARI gene family has been identified in human [21,22,23], Drosophila [24], mouse [25], and Arabidopsis [9]. However, the mechanism and functions of ARI proteins are largely unknown, for only limited literature is available regarding the functional importance of these genes. Some ARI proteins are involved in E2 enzyme interactions in Drosophila [24] and human [23]. Ubiquitination activity is only proven in ARI8 in A. thaliana [6]. AtARI12 was involved in UV- B pathway through interaction with Constitutively Photomorphogenic 1 (COP1), which is a key component of the light signaling pathway [26,27]. The overexpression of a soybean Ariadne-like gene caused aluminum tolerance in Arabidopsis [28]. The orthologous gene of AtARI7 in Hypericum perforatum was associated with apospory [29].
Brassica napus, an allotetraploid plant generated through hybridization between Brassica rapa and Brassica oleracea [30], is a major worldwide crop due its industrial value and oil production. Like other crops, B. napus productivity has been affected by several abiotic stresses including low temperature, drought, salinity, and so on [31,32,33]. Therefore, it is important to improve stress adaptation by identifying stress-related genes in B. napus. To date, genome-resource and various transcriptome datasets have been published [34,35]. However, ARI gene family members and their potential importance have not been investigated in B. napus. Therefore, a genome-wide study was designed to find out the number of genes in this family. The evolutionary relationships, gene architectures, conserved motifs, gene duplications, and protein–protein interactions in B. napus were all investigated in this work. Diverse tissues and environmental stressors transcriptome data was used to understand the expression patterns of ARI genes in B. napus. Furthermore, we also investigated the genetic variations (SNPs) in the BnARI gene family and associated them with several agronomic traits in the natural population of B. napus. This research enriched our knowledge of BnARI genes and laid the groundwork for future functional research and genetic breeding of B. napus.

2. Results

2.1. Identification of ARI Genes in B. napus

We identified 39 ARI genes in the B. napus genome by querying 16 A. thaliana ARI protein sequences (Table 1 and Table S1). All the BnARI proteins contained the RBR and Ariadne domains. The detailed information of BnARI genes is summarized in Table 1. The protein length varied from 369 to 672 amino acids and the molecular weight ranged from 40.5 to 75.1 kDa. The isoelectric points increased from 4.7 to 6.48 (Table 1). Based on CELLO server prediction, 37 ARI proteins were localized in the nucleus (Table 1).

2.2. Phylogenetic Analysis of BnARI Proteins

To determine the evolutionary relationship between BnARI and AtARI genes, a phylogenetic tree based on the NJ (neighbor-joining) method with 1000 bootstrap replications was constructed using their protein sequences. A total of 16 AtARIs and 39 BnARIs were clustered into three subfamilies (Figure 1, Table 1). In addition, in each subfamily, the BnARIs were clustered with their closest homologous gene in A. thaliana. Based on the previous nomenclature system used in A. thaliana, these subfamilies were named subfamily A, B and C, respectively (Figure 1, Table 1). Subfamily B was the largest and included 21 ARI genes, while Subfamily C and A contained 10 and 8 ARI genes, respectively.

2.3. Chromosomal Location and ARI Genes Duplication in B. napus

In B. napus, 33 ARI genes were unevenly distributed on the 19 chromosomes; the remaining six genes were located on random chromosomes (Table 1, Figure 2). A total of 20 and 19 ARIs were located on the A and C subgenomes, respectively. Chromosome C03 had the most ARIs (4 genes) while chromosomes A01, A04, A07, A09, C01, C07 and C08 had a single ARI gene. Chromosomes A05, A08, and C06 did not contain any ARI genes.
The expansion of the gene family is contributed by duplication events in the plant genome [36]. Therefore, the duplication events were analyzed for ARI genes. Based on BLAST and MCScanX analysis, the results showed that 35 out of 39 ARIs resulted from whole-genome duplication (WGD) or segmental duplication, while four genes were derived from tandem duplication (Table 1). Furthermore, 17 duplicated ARI pairs between subgenomes were found in B. napus (Figure 2; Table S2). To determine the selection pressure on these duplicated pairs during the evolution, the ratios of non-synonymous to synonymous substitutions (Ka/Ks) and divergence time were determined. The Ka/Ks value ranged from 0.038 to 0.035 with an average of 0.268 between gene pairs. The Ka/Ks ratio was significantly less than 1. The estimated divergence time of the duplicated pairs ranged from 1.509 Mya to 10.101 MYA with an average of 3. 877 MYA time period. The results indicated that BnARIs were under strong purifying selection (Table S2).

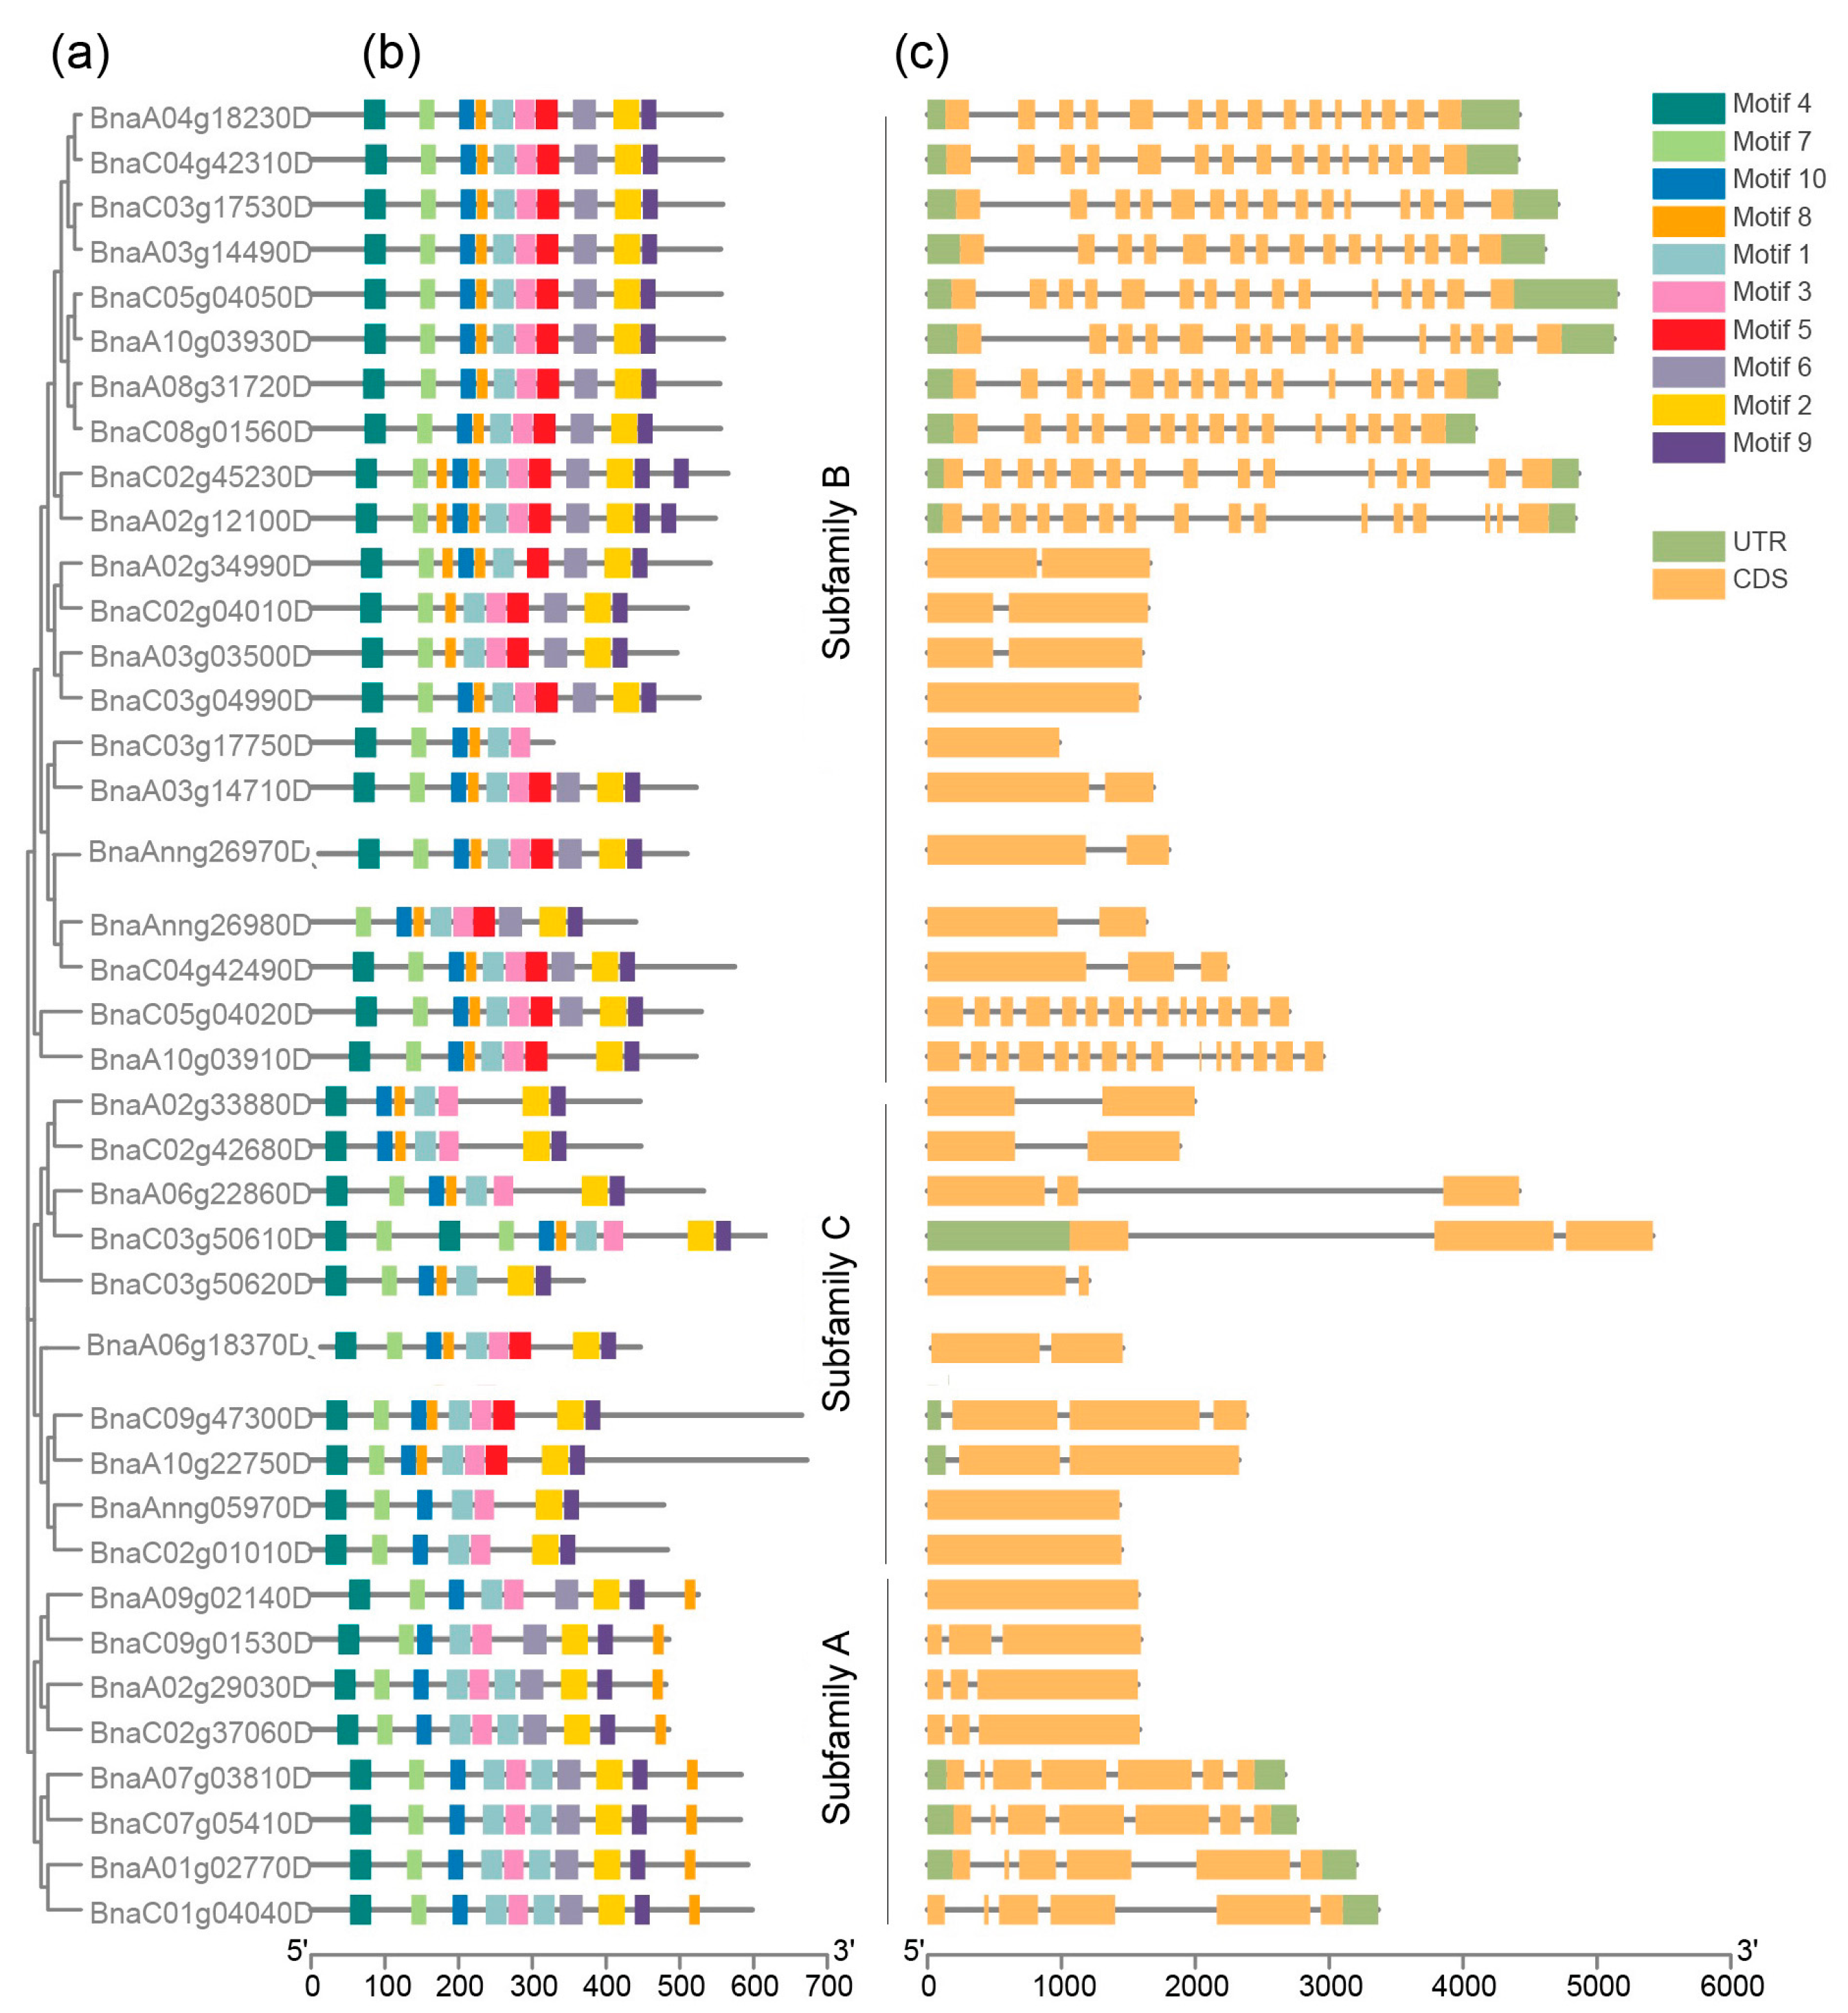
2.4. Gene Structure and Conserved Motif Analysis of BnARIs

The exons and introns were examined to obtain insights into structural evolution in the BnARI gene family. The gene structure information was retrieved from the “Darmor-bzh” genome file in the BnaOmics database (Available online: https://bnaomics.ocri-genomics.net, accessed on 6 February 2022) using TBtool software. On average, each gene contained six exons but the number of exons of BnARIs greatly varied and ranged from 1 to 15 (Table 1, Figure 3). All the three subfamilies possessed a different number of exons; for example, subfamily C had the lowest number of exons (one–four), subfamily A contained up to seven exons while the subfamily B exhibited diverse exon number variations ranging from 1 to 15 (Table 1, Figure 3).
Furthermore, we extracted the protein data of BnARIs from the Protein FASTA file of B. napus in the BnaOmics database (Available online: https://bnaomics.ocri-genomics.net, accessed on 6 February 2022) to investigate the motif composition of all the BnARIs. The online MEME sever [37] was used to perform the motif analysis. Motifs 1, 5 and 8 were annotated as IBR; 2 and 6 were annotated as Ariadne domain; and motif 7 was annotated as Zinc finger (Table S3). Motifs 1, 2 and 7 were present in all the BnARIs except BnaA02g33880D and BnaC02g42680D which do not contain motif 7 (Figure 3). Both Ariadne domains (motifs 2 and 6) were present in subfamily A and B, whereas motif 6 was absent in subfamily C. Subfamily B and C both contained motif 1, 7, 8, 5 and 2 in principle but the only difference was subfamily C do not contain motif 6. The remaining motifs, 3, 4, 9, 10, were unknown domains but these were distributed evenly within the same subfamily (Figure 3). The motif arrangement in each subfamily also verified the phylogeny classification (Figure 1 and Figure 3).

2.5. Cis-Elements and Protein Interaction Analysis of BnARI Genes

To determine the potential function of these BnARIs, we further analyzed the cis-elements in their promoter regions and proteins that could interact with them by using online public databases [38,39]. The 2kb upstream region of BnARIs were retrieved from the “Darmor-bzh” genome file and were analyzed for cis-elements through the PlantCARE database. These promoters were mainly enriched in growth-related and stress-related elements (Figure 4, Tables S4 and S5). ABRE (an element responsive to abscisic acid), CGTCA-motif (an element responsive to methyl jasmonic acid), ERE (an element response to ethylene), TCA-element (an element responsive to salicylic acid), P-box, GARE, AuxRR (an element responsive to auxin), TATC-box (an element responsive to gibberellin) and TGA-element (an element responsive to auxin) were hormone-related cis-regulatory elements and were listed according to their abundance (Figure 4, Table S4). Other growth-related elements included Circadian, O2-site (zein-metabolism-responsive element), CAT-box (a meristem-related element), MBSI (flavonoid-synthesizing element), HD-Zip (cell-differentiation element) and GCN4_motifs (an endosperm-development element); these elements are also presented according to their abundance (Figure 4, Table S4).
Stress-related elements were predominant in ARIs promoters and these included ARE (an element that responds to anaerobic induction), LTR (an element responsive to low temperature), MBS (the MYB binding site for drought stress), WUN-motif (an element responsive to wounds), TC-rich (a defense-responsive element), and GC-motif (an anoxic-specific element) (Figure 4, Table S4). Among all the promoter cis-elements, ARE was most abundant, whereas 33/39 of BnARIs contained ABREs (Figure 4, Table S4).
In subfamily A, a large number of stress- and hormone-related cis-acting elements were identified in the promoters of BnARI genes: ARE, ABRE and ERE elements had maximum copies and were detected in 5, 5 and 6 of the 8 BnARI gene promoters, respectively (Figure 4, Tables S4 and S5). The subfamily B members were enriched with stress-related element such as ARE, LTR, MBS and the WUN motif and at least 12 of 21 genes contain these elements. All 21 genes of this subfamily had the ARE motif, with an average of three copies. In 10 genes of subfamily C, CGTCA (on average, three copies), ARE (on average, two copies) and ABRE (on average, two copies) motif were found in 9, 10 and 9 genes, respectively. Stress-related cis-acting elements were relatively more abundant in number in all BnARI promoters (Figure 4, Tables S4 and S5). These results implied the importance of BnARI genes in stress adaptations.
To elucidate the functional role of BnARIs, we predicted the protein networks based on known protein interactions in A. thaliana (Figure 5, Table S6). By using 16 AtARI proteins as a query, a total of 1323 proteins were identified in the protein interactive database of A. thaliana that were homologous to 4714 proteins in B. napus. Most of the BnARI proteins interacted with each other (Figure 5a, Table S6). To further access the functional categories of these interacting proteins, Gene Ontology (GO) and Kyoto Encyclopedia of Genes and Genomes (KEGG) enrichment analyses were performed (Figure 5b, Table S6). The KEGG pathway showed that the BnARIs participated in the endoreduplication, post-replication repair, growth, proteasome assembly, protein transport, protein kinase activity and stress-related processes. The detailed GO analysis revealed that the aforementioned pathways were consistent biological processes terms; in the cellular component terms, mainly, the ubiquitin ligases complexes, spliseosomal complexes, autophagosome and nucleosomes were enriched (Table S6). Meanwhile, under molecular function category, protein kinase activity, cyclin-dependent protein serine/threonine kinase regulator activity, RNA polymerase activity, U5/U6 snRNA binding, Atg8 activating enzyme activity and ubiquitin ligase activity terms were enriched (Table S6).

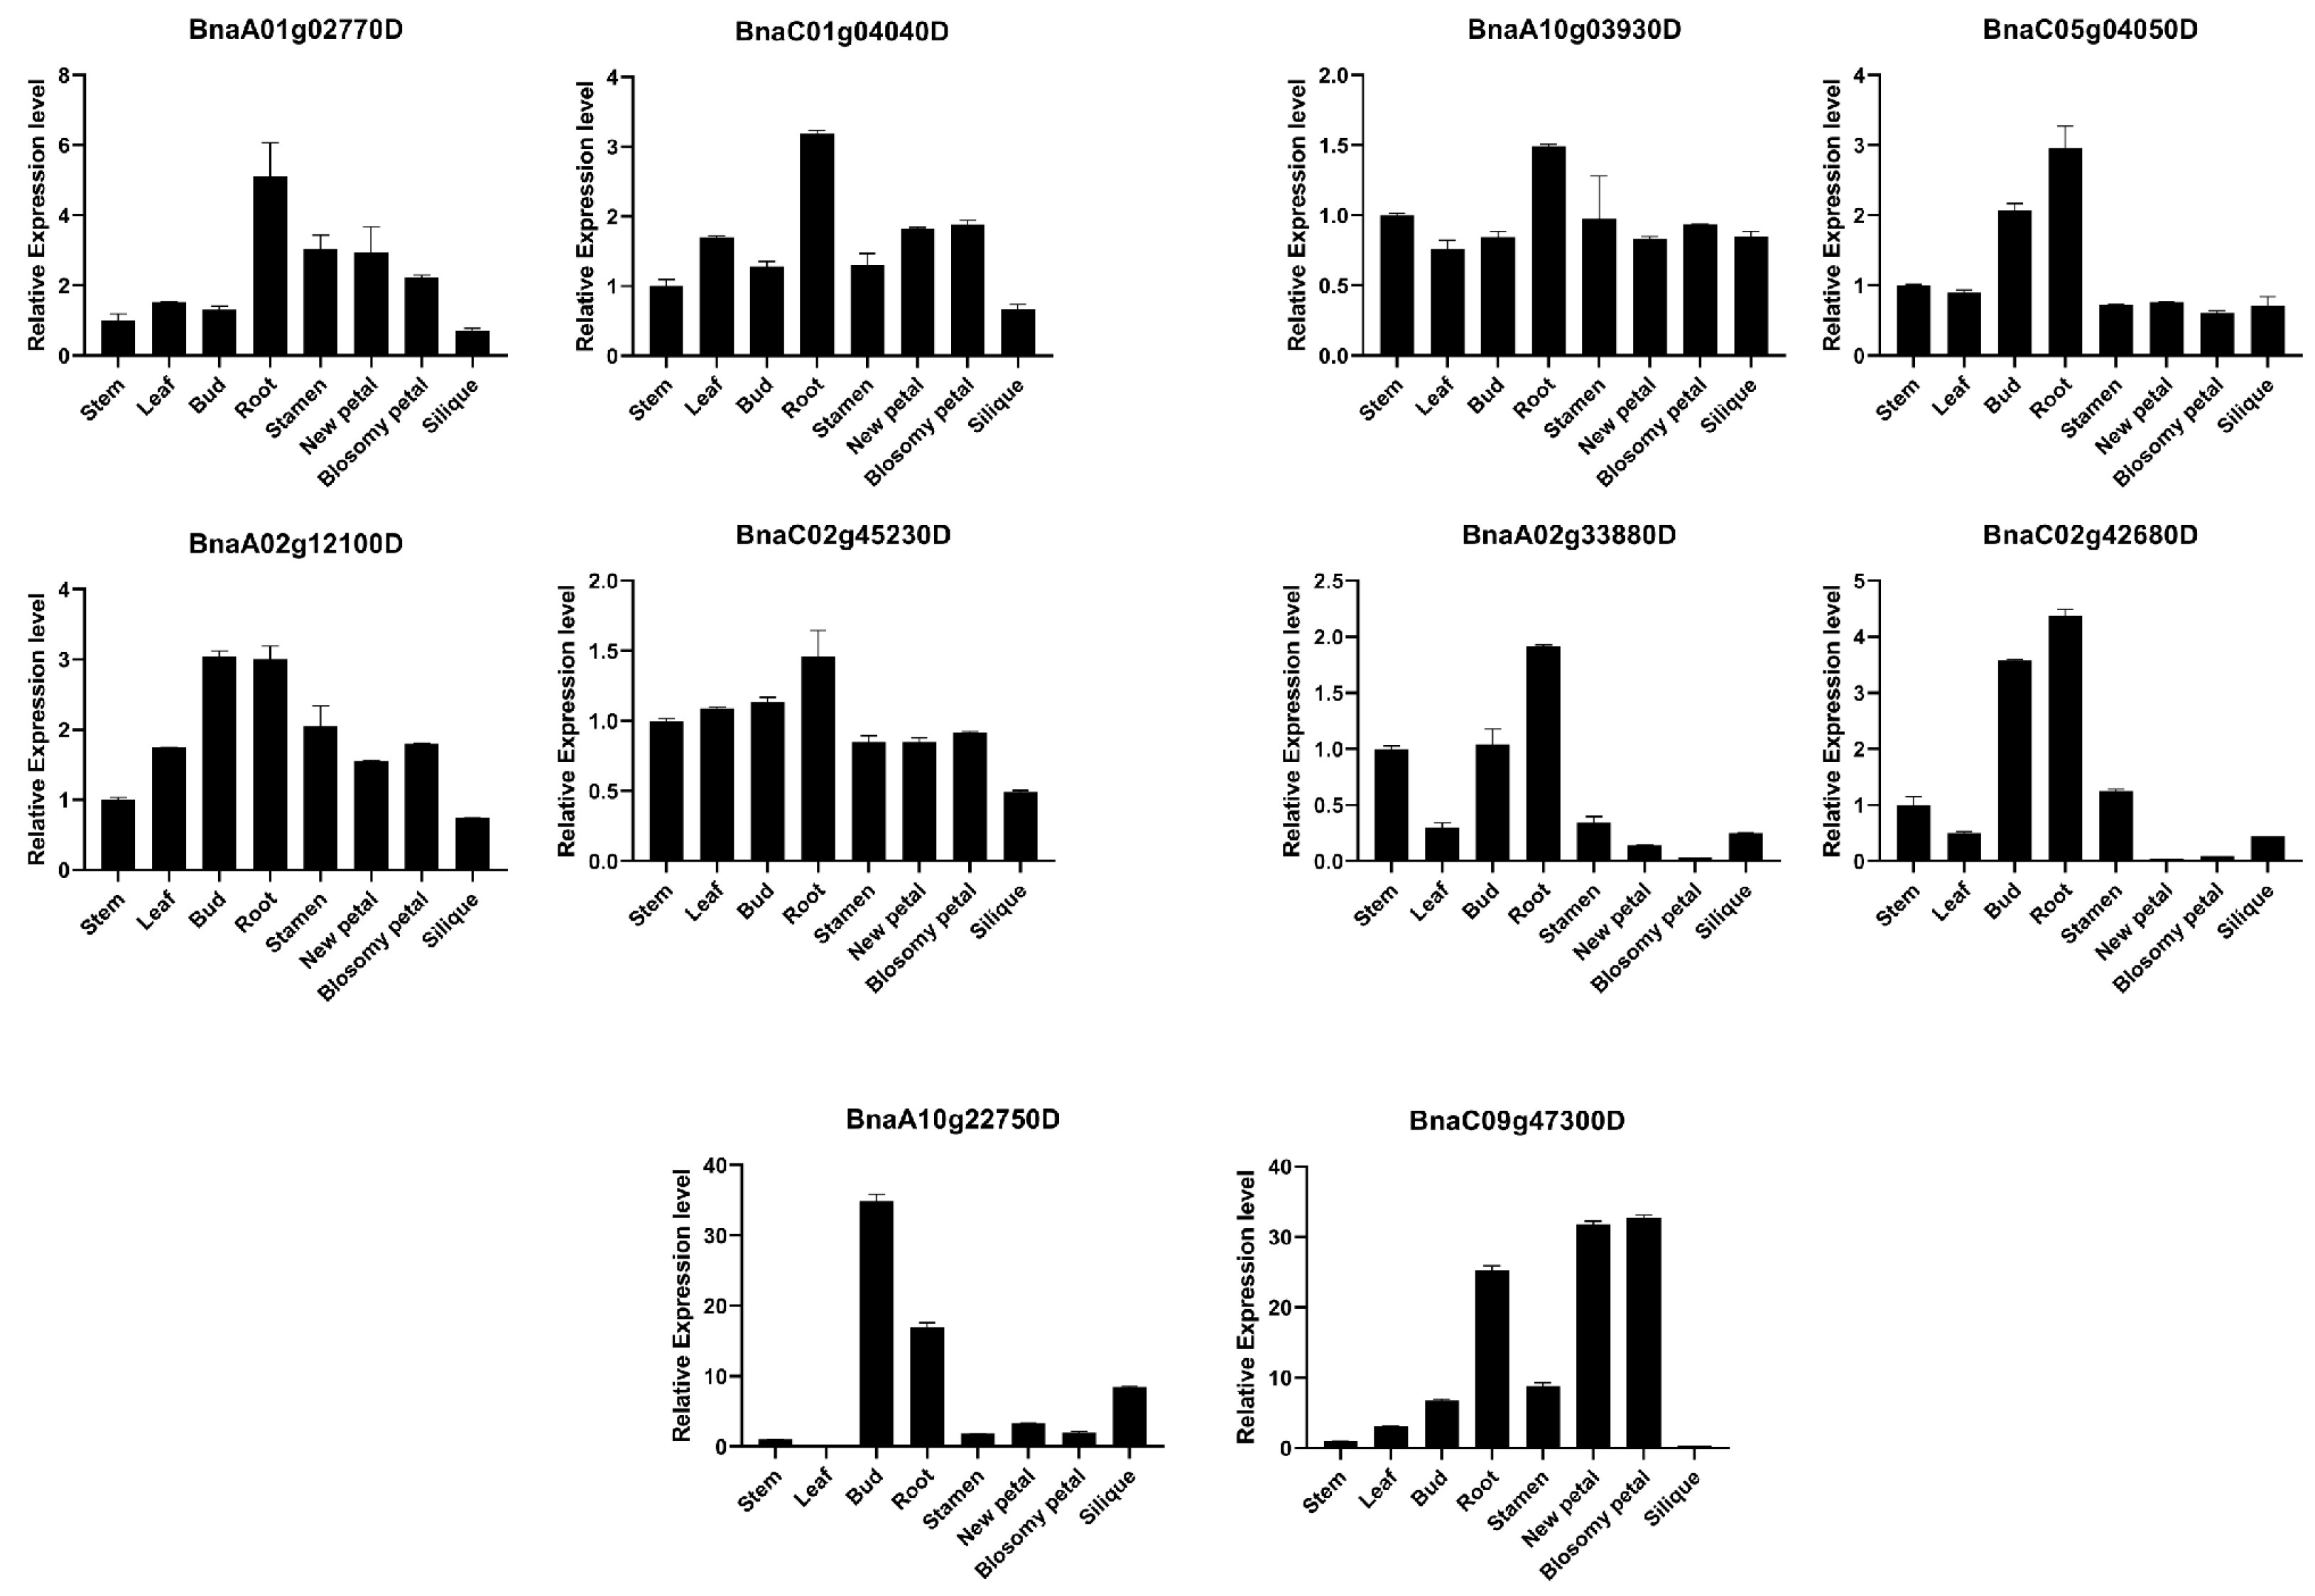
2.6. Expression Patterns of BnARI Genes in Different Tissues and under Abiotic Stresses

We utilized the 12 tissues (root, leaf, bud, silique, stamen, new petal, blossomy petal, wilting petal, stem, sepal, ovule and pericarp) in a B. napus cultivar “ZS11” from our lab resources [34], to analyze the expression patterns of BnARI genes to predict their potential functions. We observed variable gene expressions across these tissues (Figure 6, Table S7). The results showed that the majority of genes were expressed in root and bud tissues. A total of 5 genes showed maximum expression of 70–161 FPKM in the root tissue. These genes included BnaC01g04040D (an ortholog of AtARI1) of subfamily A, BnaC02g42680D (an ortholog of AtARI13), BnaAnng05970D (an ortholog of AtARI16), BnaC03g50620D (an ortholog of AtARI14) of subfamily C and BnaC05g04050D (an ortholog of AtARI5) of subfamily B with FPKM values 72.6495, 78.5711, 152.675 and 161.35, respectively (Table S7). Two genes, BnaA10g22750D and BnaAnng05970D (an ortholog of AtARI16), showed predominant expression in the ovule (>60 FPKM) and one gene BnaA01g02770D (an ortholog of AtARI1) was highly expressed in the new petal tissue (60 FPKM). A total of 13 BnARI genes were moderately expressed among different tissues and their FPKM values ranged between 5 and 20; whereas 15 BnARIs were expressed below the threshold (>5) in all the tissues (Table S7). The low-expressed genes in all the tissues could be pseudogenes (Figure 6, Table S7).
There was expression variation among different tissues between the subfamilies (Figure 6, Table S7). In subfamily A, the genes were highly expressed in root > new petal > ovule. Subfamily B is the largest family of BnARIs, but the majority of the genes are moderately expressed in all the tissues (up to 17 FPKM). The predominant expression was observed in root > bud > pericarp (Figure 6, Table S7). All the BnARIs in silique tissue and orthologs of AtARI12 in all the tissues had no FPKM greater than the threshold value; whereas, in subfamily C, all the BnARIs showed an FPKM below threshold in leaf, blossomy petal, stem, sepal and pericarp (Figure 6, Table S7). The predominant expression (>37) of remaining genes was observed in root > ovule > petals. We also observed the expression divergence between the duplicated genes of the same AtARI gene at expression level and tissue specificity; for example, in subfamily C, AtARI16 has two duplicated pairs in B. napus: BnaAnng05970D/BnaC02g01010D and BnaC09g47300D/BnaA10g22750D. There was tissue-specific expression not only between each pair but also between both pairs (Figure 6, Table S7). In subfamily A, BnaC02g37060D (ortholog of AtARI3) was expressed in root tissue only, while the remaining three orthologs did not show expression in any tissue (Figure 6, Table S7). In subfamily B, the duplicated pair BnaC04g42500D/BnaAnng26970D (ortholog of AtARI9): the former partner was expressed in the ovule, new petal and bud (up to 13 FPKM) whereas the latter partner did not show expression in any tissue (Table S7). All these results represented clues for functional differentiation in the ARI gene family in B. napus.
Moreover, according to predominant gene expression and the diverse expression patterns of duplicated gene pairs among various tissues, five BnARI duplicated genes (BnaC01g04040D, BnaA01g02770D; BnaC05g04050D, BnaA10g03930D; BnaA02g12100D, BnaC02g45230D; BnaA02g33880D, BnaC02g42680D; BnaA10g22750D, BnaC09g47300D) from the three subfamilies were selected for qRT-PCR analysis (Figure 7, Table S8). The expression pattern results verified the correctness of RNA-seq data. Expression divergence was observed in all the cases among the duplicated pairs. Most of the genes showed high expression in root tissue (Figure 7). These candidate genes must be investigated for their importance in root growth in future studies.
We also investigated the expression pattern of BnARIs under abiotic stresses that included dehydration, cold, ABA and salinity treatments. The transcriptome data for this analysis was retrieved from a previous study by referring to Zhang [40]. The majority of gene expressions were upregulated when the stresses were applied (Figure 8, Table S9). Thirteen genes showed a significant change in expression compared to the control (≥two folds) (Figure 8, Table S9). The expression of only one ortholog of AtARI5, BnaC03g04990D, was upregulated two folds after a 1 h and 8 h dehydration, 4 h and 24 h cold stress and 4 h saline treatment. One ortholog of AtARI3, BnaC02g37060D, displayed increased expression (3.5 fold) in 8 h dehydration stress while its expression was downregulated (−2.5 fold) under 4 h ABA treatment (Figure 8, Table S9). The orthologs of AtARI13 displayed a significant response towards all the stress conditions. The expression of AtARI13 orthologs (BnaC03g50610D, BnaA02g33880D, BnaC02g42680D, BnaA06g22860D) was upregulated (2–5 fold) after 24 h cold treatment (Figure S7, Table S9). The expression analysis shows the importance of these ARI genes during adaptation in B. napus.

2.7. Functional Importance of BnARIs Using Association Mapping Analysis in Natural Population

We utilized the 324 natural population accession data of our lab to find the potential effects of BnARIs in the agronomic traits of B. napus. We first analyzed their genetic variations (SNPs) and then performed association mapping analysis in natural population (Figure 9, Table S10) [41]. On average, ~40 SNPs were detected per ARI gene and SNP density was higher in the A subgenome (50 SNPs), whereas the SNP density was lower in the C subgenome (24 SNPs). Moreover, the average density of SNPs among the three subfamilies was in the following order: subfamily B (46) > subfamily B (42) > subfamily A (19) (Table S10). One gene, BnaA01g02770D from subfamily A; six genes, BnaA10g03930D, BnaA04g18230D, BnaA03g14490D, BnaA02g12100D, BnaC02g45230D from subfamily B; and one gene, BnaAnng05970D from subfamily C showed greater than 80 SNPs. There was variation in SNP number between the duplicated pairs; for example, BnaC01g04040D/BnaA01g02770D had 13/88 SNPs, BnaA02g12100D/BnaA03g14490D had 161/95 SNPs, BnaA02g33880D/BnaC02g42680D had 18/48, while BnaA10g03930D/BnaC04g42500D had 110/0 SNPs, respectively (Table S10). The SNP annotation results showed that a total of 750 SNPs were detected in the exon regions and (274) 44% of SNPs resulted in missense mutations in BnARI genes. These SNPs could lay the foundation of the functional importance of the ARI gene in B. napus.
In order to examine the effect of ARI genes on the final phenotype of the B. napus plant, association mapping analysis for primary flowering time (PFT), full flowering time (FFT1), final flowering time (FFT2), early flowering stage (EFS), late-flowering stage (LFS), flowering period (FP), branch number (BN), branch height (BH), plant height (PH), main inflorescence length (MIL), main inflorescence silique number (MISN), and main inflorescence silique density (MISD) were conducted. Finally, eight BnARI genes were identified as candidate genes for multiple agronomic traits (Table S10). Interestingly, BnaA02g12100D (an ortholog of AtARI8, AT1G65430) was significantly associated with nearly all traits used (p < 0.001) (Table S10). For flowering time, flowering period, branch height and main inflorescence silique number, the population were clearly grouped into two haplotypes, and the t-test results showed that significant differences were observed between two haplotype groups (p < 1 × 10⁻⁵) (Figure 9). Moreover, we analyzed the proteins that interacted with BnaA02g12100D (Table S10). The GO enrichment analysis showed that they were not only involved in ubiquitination (GO:0019005, GO:0000151, GO:0034450, GO:0034450, and so on), but also participated in multicellular organism development (GO:0007275), the negative regulation of flower development (GO:0009910), vegetative phase change (GO:0010050), the regulation of circadian rhythm (GO:0042752), meristem maintenance (GO:0010073), cellular response to auxin stimulus (GO:0071365), the maintenance of meristem identity (GO:0010074), developmental growth (GO:0048589), and the regulation of meristem development (GO:0048509) (Table S11). All these processes were related with the regulation of endogenous hormone and the development of meristem, which could finally affect flowering time and plant architecture. Overall, the results suggested that ARI genes could affect the agronomic traits of B. napus.

3. Discussion

The ring E3 ubiquitin ligases are widely investigated for their role in plant adaptation and development [13,14,28,42]. Since the discovery of Parkin protein that causes juvenile parkinsonism, the RBR subclass of RING-containing E3 ligases has been recognized as an essential group of proteins [18]. The plant RBR family, on the other hand, has received little attention. The RBR family has four subfamilies named as Ariadne (ARI proteins), ARA54, Plant II and Helicase in plants [16]. The Ariadne subfamily shares domain (IBR) similarity with the Parkin protein of humans. However, the functions of this subfamily are largely unidentified in plants. The Ariadne gene family is not separately explored in detail in plants except for A. thaliana. We performed a genome-wide investigation of Ariadne (ARI proteins) and attempted to anticipate the potential functions of this gene family in B. napus.
After its separation from the Arabidopsis lineage, the genus Brassica experienced genome triplication, followed by interspecific hybridization between B. rapa and B. oleracea, resulting in the allotetraploid B. napus [30]. As a result of these duplication events, the genome size was expanded in B. napus during the evolution [30] with the expectation of six genes for one A. thaliana gene in the B. napus. We identified a total of 39 ARI genes in B. napus as compared with 16 AtARI genes (Table 1). The expansion of this gene family was only about 2.5 fold more than the ancestor A. thaliana, representing gene loss [43]. We did not obtain any ortholog against two AtARI genes (AtARI6 (At1g63760), AtARI4 (At3g27720) which were considered as pseudogenes [9]). Many studies showed that WGD or segmental duplication play a critical role during the expansion of gene families [44,45,46]. We obtained similar results in BnARI genes: all the genes were produced from the WGD or segmental duplication except four genes BnaAnng26970D, BnaAnng26980D, BnaC04g42500D, BnaA03g14710D and BnaC03g50620D, which were produced as a result of tandem duplication events (Table 1). The ka/Ks ratio was less than one for all duplicated pairs, suggesting purifying selection during the evolution. There was variation in Ka/Ks for the duplicated pairs, suggesting that they had evolved at different rates of evolution. The average divergence time for all the duplicated pairs was about 4 MYA, suggesting recent duplications in the BnARI gene family, which was also consistent with the evolutionary process of B. napus.
The evolution and differentiation of genes was deduced by comparing protein homologies, gene structure and motif combinations. We used this way to classify the BnARI gene family. Using Arabidopsis ARI proteins as a reference, these ARI proteins were clustered into three subfamilies (A, B and C). This classification was further confirmed by gene structure and motif analysis within the BnARI gene-family members. The number of exon and introns within subfamily C was conserved but exon and intron number was not conserved within subfamily A and B. Then, the investigation of motifs revealed that the coding sequence was highly conserved within the subfamilies, suggesting that the coding sequences were conserved in subfamily A, B and C.
Based on Cello server prediction, almost all the proteins were localized to a nuclear region, and these results were supported by a previous study [9], except for BnaA02g33880D and BnaC02g42680D, which were localized to an extracellular region. The possible explanation for this observation was that only these two proteins did not contain motif 7, which encoded for the Ring finger (Figure 3, Table S3). However, further functional studies are required to decode the mechanism.
To determine the possible function of BnARI genes, we investigated the cis-elements in their promoters that could influence their expression pattern [47] (Figure 4, Tables S4 and S5). In the RNA-seq data of twelve tissues, which included the root, leaf, bud, silique, stamen, new petal, blossomy petal, wilting petal, stem, sepal, ovule and pericarp of blooming of B. napus [34], interestingly, the highest gene expression was observed in the root tissue (Figure 6, Table S7). Mostly, genes were expressed in the root and bud tissue and the fewest genes were expressed in the silique tissue. We observed differential expression patterns of all the genes among different tissues, as discussed in the Results section (Figure 6, Table S7). Expressional divergence was observed between the duplicated gene pairs as well, suggesting a clue for sub/neo functionalization and pseudogenization, like in other polyploid crops [48]. Plants face several kinds of external stimuli including light, drought, high temperature, influencing their growth and development. Therefore, they evolve many strategies to cope with these challenges [49]. In the promoters of BnARIs, we detected various type of stress-related cis-elements (Figure 8, Table S4) that could predict their importance in abiotic stress. In the RNA-seq data for four stress treatments (dehydration, cold, ABA and salinity), subfamily C, especially all the orthologs (BnaC03g50610D, BnaA02g33880D, BnaC02g42680D, BnaA06g22860D) of AT5G63750, (AtARI13) showed significant responses towards the stresses applied (Figure 8, Table S9). The previous studies also showed the importance of ARI genes against abiotic stress in plants [26,27,28]. The gene ontology (GO) and KEGG pathway analyses predicted the involvement of BnARIs in endoreduplication (polyploidy), DNA damage, kinase activity, proteasome assembly, ubiquitination and stress mechanisms (Figure 5, Table S6). E3 ligases are also known to be involved in the aforementioned processes [7].
We also investigated genetic variations (SNPs) for BnARIs in the natural B. napus population [41] (Table S10). The greater number of SNPs in the genomic regions suggested that a lot of variations occurred in BnARIs during the evolution. The SNP density was much higher in the A subgenome than the C subgenome (Table S10) and these results were consistent with the SR and GATA gene families in B. napus [45,50]. In this study, a total of 271 missense mutations could help in the functional differentiation of these BnARI genes. We further used these genetic variations and performed association analysis with different agronomic traits to predict the importance of ARI genes in B. napus (Figure 9). Among all the genes, BnaA02g12100D (ortholog of ARI8, AT1G65430) was significantly associated with nearly all the traits used (threshold 3) (p < 0.001) (Figure 9, Table S10). This gene has a high and more diverse expression pattern than the other duplicated partner (BnaC02g45230D) in our transcriptome studied data (Figure 6, Table S7). In addition, its expression variation was observed in all the stresses as compared with the control. Based on the GO enrichment analysis for its interacted protein, it could be involved in diverse biological processes including ubiquitination, phosphorylation of proteins, meristem development and response to hormones (Table S11), which eventually influence the phenotype and adaptation of plants. According to a previous study, when expression analysis was carried out among RBR genes in 79 developmental stages of A. thaliana, ARI8 (ortholog of BnaA02g12100D) was the predominantly expressed gene and its expression was specifically detected to be high in the mature pollen stage [16]. Among the 103 tissues of several developmental stages in B. napus, the expression of BnaA02g12100D in mature anther was specifically high [35]. Expression specificity in the male gametophyte could influence plant fitness and phenotype by causing the proteins to become ubiquitinated [51,52]. Among all the AtARI proteins, ubiquitin activity was only proven in AtARI8 [6]. Ubiquitination is one of the critical mechanism that controlled the photoperiodic pathway in flowering regulation [14]. Likewise, the E3 ligases were involved in the regulation of some important flowering time genes, for example, constans, constitutive photomorphogenic 1, and target of early activation tagged 2 [53]. The knockout mutants of their orthologous genes in animals were lethal [24]. Nevertheless, the knockout studies for ARI genes are not available in any plants and the role of ARI genes in development and stress tolerance should be further explored. Therefore, these findings can provide a better clue to understand the significance of BnARIs in phenotypic variation and adaptation.

4. Materials and Methods

4.1. Identification of ARI Gene Family in B. napus

To identify the BnARI genes, we performed the BLASTP search in B. napus at BnaOmics database (Available online: https://bnaomics.ocri-genomics.net, accessed on 6 February 2022), 16 AtARI protein sequences were used as queries with e-value 1× 10⁻⁵. The NCBI Conserved Domain Database (Available online: https://0-www-ncbi-nlm-nih-gov.brum.beds.ac.uk/cdd, accessed on 6 February 2022) [54] and Pfam database (Available online: http://pfam.xfam.org/, accessed on 6 February 2022) [55] were used for verification of candidate genes that contained IBR and Ariadne domain. The redundant genes were removed manually.
The genome data files of “Darmor-bzh” were used to collect sequence information for all BnARIs, including ID, CDS, proteins, chromosomal position at BnaOmics database (Available online: https://bnaomics.ocri-genomics.net, accessed on 6 February 2022) [30]. The ExPasy tool (Available online: http://www.expasy.org/, accessed on 6 February 2022) was used to compute the peptide length (aa), molecular weight (MW), and isoelectric point (PI) of each BnARI protein. CELLO v2.5 (Available online: http://cello.life.nctu.edu.tw/, accessed on 6 February 2022) [56] was used to predict the subcellular localization of BnARI proteins.

4.2. Phylogenetic Analysis of BnARI Family

Multiple sequence alignments of ARI proteins from A. thaliana and B. napus were performed by using the ClustalW v2 [57] programme to acquire insights into the phylogenetic relationships between ARI family members. The neighbor-joining (NJ) technique was used with 1000 bootstrap replications in the MEGA v11 [58] to create the phylogenetic tree. Furthermore, iTOL v6.5.2 (Available online: https://itol.embl.de/, accessed on 12 February 2022) was used to visualize the tree. According to homology, ARI genes were further subdivided into subfamilies.

4.3. Chromosomal Distribution, Duplication Status, Ka/Ks Ratio

The physical positions of the BnARI genes on chromosomes were identified using the B. napus genome annotation file in TBtools programme, v1.098 [59]. BLASTP, with e-value of 1 × 10⁻¹⁰ and MCScanX [60], was used to evaluate the duplication patterns, such as segmental and tandem duplications. The TBtools programme v1.098 [59] was used to visualize the chromosomal location and duplicated BnARI genes.
The ratios of synonymous substitution rate (ks) and non-synonymous substitution rate (ka) of homologous BnARI gene pairs were calculated using TBtools programme (v1.098) [59]. T = Ks/2R, where R is 1.5 × 10⁻⁸ synonymous substitutions per site per year, was used to calculate divergence [61]. Ka/Ks ratio less than one indicated purifying selection, whereas Ka/Ks ratio greater than one indicated positive selection.

4.4. Identification of Conserved Motifs and Gene Structure in BnARI Gene Family

The conserved motifs in the BnARI proteins were analyzed using Multiple Expectation Maximization for Motif Elicitation (MEME 5.4.1) [37]. The parameters were organized into 10 motifs with widths between 6–50 amino acids and the remaining options were left at default settings. The Pfam database (Available online: http://pfam.xfam.org/search, accessed on 15 February 2022) was used to annotate the discovered motifs. The gene-structure information was obtained from B. napus genome files. The gene and motif structures were visualized using the TBtools programme, v1.098 [59].

4.5. Identification of Cis-Acting Regulatory Elements and Protein–Protein Interaction in BnARI Gene Family

To find the cis-acting regulatory elements in the BnARI genes promoters, 2 kb upstream each gene was extracted and examined through PlantCARE database (Available online: http://bioinformatics.psb.ugent.be/webtools/plantcare/html/, accessed on 15 February 2022) [38]. The number of cis-acting elements were converted to log2 transformation and were visualized using TBtools programme, v1.098 [59].
To determine the protein–protein interactions (PPIs) of BnARIs, first PPIs of the AtARI proteins were downloaded from STRING database (Available online: https://www.string-db.org/, accessed on 15 February 2022) [39], the BnARI-interacting proteins were predicted based on the homologs in A. thaliana, and the network was visualized using Cytoscape [62]. Using the clusterProfiler in R [63], the genes that interacted with the BnARI proteins were selected for gene ontology and KEGG enrichment analysis.

4.6. Expression Analysis of BnARI Genes in Different Tissues and under Abiotic Stress

We used transcriptome data from twelve tissues of “ZS 11” (root, leaf, bud, silique, stamen, new petal, blossomy petal, wilting petal, stem, sepal, ovule and pericarp) [34] and four treatments (dehydration, cold, ABA and salinity) to detect the expression of BnARI genes [40]. The FPKM values were transformed to log2 folds, and TBtools was used to produce heatmaps of all data.

4.7. RNA Extraction and Reverse Transcription-Quantitative PCR (qRT PCR)

The B. napus v. “ZS 11” was grown in Oil Crop Research Institute (OCRI) Wuhan fields. Three samples for each tissue (leaf, stem, root, petal, sepal, carpel, and stamen) were collected at the blooming stage. The 21 samples were immediately put in liquid nitrogen before storing at −80 °C. The Invitrogen TRIZOL Reagent (Thermofisher, Waltham, MA, USA) was used to isolate total RNA. A TaKaRa reverse transcription kit (Prime ScriptTMRT reagent Kit, TaKaRa, Beijing, China) was used to make first-strand complementary DNA (cDNA). Furthermore, qRT-PCR primers for potential BnARI genes were constructed to test the expression pattern (Table S8). The qRT-PCR was performed using Bio Supermix (Bio-rad, Hercules, CA, USA) according to the manufacturer’s instructions, with reaction steps as follows: 95 °C for 3 min; 40 cycles of 95 °C for 15 s; 56 °C for 15 s, followed by 65 °C for 5 s and 95 °C for 5 s in three biological replicates. Ten genes of 5 duplicated pairs were analyzed for expression by qRT-PCR. The B. napus—β actin gene (AF111812) was used as internal reference. The 2−∆∆Ct method [64] was used to compute the relative expression.

4.8. Functional Significance of BnARIs by Using Association Mapping in Natural Population

To determine the functional significance of BnARIs at the population level, we investigated the natural genetic variations (SNPs) in them using 324 accessions, which were collected from around the world [41]. The SNPs were obtained and annotated through SnpEff programme v4.11 [65]. Primary flowering time (PFT), full flowering time (FFT1), final flowering time (FFT2), early flowering stage (EFS), late-flowering stage (LFS), flowering period (FP), branch number (BN), branch height (BH), plant height (PH), main inflorescence length (MIL), main inflorescence silique number (MISN), and main inflorescence silique density (MISD) were selected as studied traits [41]. EMMAX [66] was used to perform the association mapping analysis between genetic variations and agronomic traits. CMplot and ggplot2 in R (Available online: https://mirrors.tuna.tsinghua.edu.cn/CRAN/, accessed on 15 February 2022) were used to draw the Manhattan plot and the boxplot.

4.9. Statistical Analysis

The statistical analysis was performed by R (v3.6) and means of two continuous normally distributed variables were compared by independent samples Student’s T-test. A value of p < 0.05 was considered significant.

5. Conclusions

In this study, the detailed investigation and characterization of Ariadne genes was carried out. All 39 ARI genes were classified into three subfamilies. Gene architectures and motifs were comparable across genes from the same subfamily. The presence of cis-acting regulatory elements in the ARI genes promoters, as well as their expression patterns in diverse tissues and under various environmental conditions, and the protein interaction analysis demonstrated that they could play an important role in development and stress tolerance. Furthermore, genetic variations in BnARI genes provided diverse potential influences on agronomic traits. In summary, this study supplied useful information on BnARI genes, and it will aid further functional research and genetic improvement for breeding in B. napus.

Supplementary Materials

Author Contributions

M.X., S.W. and S.L. designed the research. Formal analysis, S.W., M.X. and S.S.; Funding acquisition, S.L., C.T.; Investigation, S.W., M.X., S.S., J.L.; Data curation, X.C., Z.B.; Project administration, M.X. and F.G.; Resources, C.Z.; S.W. and S.S. wrote the manuscript; Review and editing, S.L., M.X., S.W., S.S., Z.B. and F.G. All authors have read and agreed to the published version of the manuscript.

Funding

This research was funded by the National Key Research and Development Program of China (2018YFE0108000), Central Public-interest Scientific Institution Basal Research Fund, grant number 2021-2060302-061-027 No: 2021-2060302-061-029, the Agricultural Science and Technology Innovation Program of Chinese Academy of Agricultural Sciences (CAAS-ASTIP-2013-OCRI), China Agriculture Research System of MOF and MARA (CARS-12), and the Young Top-notch Talent Cultivation Program of Hubei Province.

Institutional Review Board Statement

Not applicable.

Informed Consent Statement

Not applicable.

Data Availability Statement

The corresponding data are shown in Supplementary Materials.

Acknowledgments

We thank Zhixian Qiao of the Analysis and Testing Center at IHB for technical support in RNA-seq analysis.

Conflicts of Interest

The authors declare no conflict of interest.

References

  1. Chen, L.; Hellmann, H. Plant E3 ligases: Flexible enzymes in a sessile world. Mol. Plant 2013, 6, 1388–1404. [Google Scholar] [CrossRef] [PubMed] [Green Version]
  2. Smalle, J.; Vierstra, R.D. The ubiquitin 26S proteasome proteolytic pathway. Annu. Rev. Plant Biol. 2004, 55, 555–590. [Google Scholar] [CrossRef] [PubMed]
  3. Hellmann, H.; Estelle, M. Plant development: Regulation by protein degradation. Science 2002, 297, 793–797. [Google Scholar] [CrossRef] [PubMed] [Green Version]
  4. Vierstra, R.D. The ubiquitin–26S proteasome system at the nexus of plant biology. Nat. Rev. Mol. Cell Biol. 2009, 10, 385–397. [Google Scholar] [CrossRef] [PubMed]
  5. Mazzucotelli, E.; Belloni, S.; Marone, D.; De Leonardis, A.M.; Guerra, D.; Di Fonzo, N.; Cattivelli, L.; Mastrangelo, A.M. The E3 ubiquitin ligase gene family in plants: Regulation by degradation. Curr. Genom. 2006, 7, 509–522. [Google Scholar] [CrossRef] [PubMed] [Green Version]
  6. Stone, S.L.; Hauksdóttir, H.; Troy, A.; Herschleb, J.; Kraft, E.; Callis, J. Functional analysis of the RING-type ubiquitin ligase family of Arabidopsis. Plant Physiol. 2005, 137, 13–30. [Google Scholar] [CrossRef] [PubMed] [Green Version]
  7. Sharma, B.; Joshi, D.; Yadav, P.K.; Gupta, A.K.; Bhatt, T.K. Role of ubiquitin-mediated degradation system in plant biology. Front. Plant Sci. 2016, 7, 806. [Google Scholar] [CrossRef]
  8. Callis, J. The ubiquitination machinery of the ubiquitin system. Arab. Book Am. Soc. Plant Biol. 2014, 12, e0174. [Google Scholar] [CrossRef] [Green Version]
  9. Mladek, C.; Guger, K.; Hauser, M.T. Identification and characterization of the ARIADNE gene family in Arabidopsis. A group of putative E3 ligases. Plant Physiol. 2003, 131, 27–40. [Google Scholar] [CrossRef] [Green Version]
  10. Borden, K.L.B. RING domains: Master builders of molecular scaffolds? J. Mol. Biol. 2000, 295, 1103–1112. [Google Scholar] [CrossRef]
  11. Lim, S.D.; Yim, W.C.; Moon, J.-C.; Kim, D.S.; Lee, B.-M.; Jang, C.S. A gene family encoding RING finger proteins in rice: Their expansion, expression diversity, and co-expressed genes. Plant Mol. Biol. 2010, 72, 369–380. [Google Scholar] [CrossRef] [PubMed]
  12. Lim, S.D.; Hwang, J.G.; Jung, C.G.; Hwang, S.G.; Moon, J.C.; Jang, C.S. Comprehensive analysis of the rice RING E3 ligase family reveals their functional diversity in response to abiotic stress. DNA Res. 2013, 20, 299–314. [Google Scholar] [CrossRef] [PubMed] [Green Version]
  13. Cho, S.K.; Ryu, M.Y.; Seo, D.H.; Kang, B.G.; Kim, W.T. The Arabidopsis RING E3 ubiquitin ligase AtAIRP2 plays combinatory roles with AtAIRP1 in abscisic acid-mediated drought stress responses. Plant Physiol. 2011, 157, 2240–2257. [Google Scholar] [CrossRef] [Green Version]
  14. Piñeiro, M.; Jarillo, J.A. Ubiquitination in the control of photoperiodic flowering. Plant Sci. 2013, 198, 98–109. [Google Scholar] [CrossRef] [PubMed]
  15. Eisenhaber, B.; Chumak, N.; Eisenhaber, F.; Hauser, M.T. The ring between ring fingers (RBR) protein family. Genome Biol. 2007, 8, 209. [Google Scholar] [CrossRef] [Green Version]
  16. Marín, I. Diversification and specialization of plant RBR ubiquitin ligases. PLoS ONE 2010, 5, e11579. [Google Scholar] [CrossRef] [Green Version]
  17. Marin, I.; Ferrús, A. Comparative genomics of the RBR family, including the Parkinson’s disease–related gene Parkin and the genes of the Ariadne subfamily. Mol. Biol. Evol. 2002, 19, 2039–2050. [Google Scholar] [CrossRef] [Green Version]
  18. Beasley, S.A.; Hristova, V.A.; Shaw, G.S. Structure of the Parkin in-between-ring domain provides insights for E3-ligase dysfunction in autosomal recessive Parkinson’s disease. Proc. Natl. Acad. Sci. USA 2007, 104, 3095–3100. [Google Scholar] [CrossRef] [Green Version]
  19. Morett, E.; Bork, P. A novel transactivation domain in parkin. Trends Biochem. Sci. 1999, 24, 229–231. [Google Scholar] [CrossRef]
  20. Marín, I.; Lucas, J.I.; Gradilla, A.-C.; Ferrús, A. Parkin and relatives: The RBR family of ubiquitin ligases. Physiol. Genom. 2004, 17, 253–263. [Google Scholar] [CrossRef] [Green Version]
  21. Marteijn, J.A.F.; van Emst, L.; Erpelinck-Verschueren, C.A.J.; Nikoloski, G.; Menke, A.; de Witte, T.; Löwenberg, B.; Jansen, J.H.; van der Reijden, B.A. The E3 ubiquitin-protein ligase Triad1 inhibits clonogenic growth of primary myeloid progenitor cells. Blood 2005, 106, 4114–4123. [Google Scholar] [CrossRef] [PubMed] [Green Version]
  22. Ardley, H.C.; Tan, N.G.S.; Rose, S.A.; Markham, A.F.; Robinson, P.A. Features of the parkin/ariadne-like ubiquitin ligase, HHARI, that regulate its interaction with the ubiquitin-conjugating enzyme, Ubch7. J. Biol. Chem. 2001, 276, 19640–19647. [Google Scholar] [CrossRef] [PubMed] [Green Version]
  23. Duda, D.M.; Olszewski, J.L.; Schuermann, J.P.; Kurinov, I.; Miller, D.J.; Nourse, A.; Alpi, A.F.; Schulman, B.A. Structure of HHARI, a RING-IBR-RING ubiquitin ligase: Autoinhibition of an Ariadne-family E3 and insights into ligation mechanism. Structure 2013, 21, 1030–1041. [Google Scholar] [CrossRef] [PubMed] [Green Version]
  24. Aguilera, M.; Oliveros, M.; Martínez-Padrón, M.; Barbas, J.A.; Ferrús, A. Ariadne-1: A vital Drosophila gene is required in development and defines a new conserved family of ring-finger proteins. Genetics 2000, 155, 1231–1244. [Google Scholar] [CrossRef]
  25. Itier, J.-M.; Ibáñez, P.; Mena, M.A.; Abbas, N.; Cohen-Salmon, C.; Bohme, G.A.; Laville, M.; Pratt, J.; Corti, O.; Pradier, L. Parkin gene inactivation alters behaviour and dopamine neurotransmission in the mouse. Hum. Mol. Genet. 2003, 12, 2277–2291. [Google Scholar] [CrossRef]
  26. Lang-Mladek, C.; Xie, L.; Nigam, N.; Chumak, N.; Binkert, M.; Neubert, S.; Hauser, M.T. UV-B signaling pathways and fluence rate dependent transcriptional regulation of ARIADNE12. Physiol. Plant. 2012, 145, 527–539. [Google Scholar] [CrossRef]
  27. Xie, L.; Lang-Mladek, C.; Richter, J.; Nigam, N.; Hauser, M.T. UV-B induction of the E3 ligase ARIADNE12 depends on CONSTITUTIVELY PHOTOMORPHOGENIC 1. Plant Physiol. Biochem. 2015, 93, 18–28. [Google Scholar] [CrossRef] [Green Version]
  28. Zhang, X.; Wang, N.; Chen, P.; Gao, M.; Liu, J.; Wang, Y.; Zhao, T.; Li, Y.; Gai, J. Overexpression of a soybean ariadne-like ubiquitin ligase gene GmARI1 enhances aluminum tolerance in Arabidopsis. PLoS ONE 2014, 9, e111120. [Google Scholar] [CrossRef] [Green Version]
  29. Schallau, A.; Arzenton, F.; Johnston, A.J.; Hähnel, U.; Koszegi, D.; Blattner, F.R.; Altschmied, L.; Haberer, G.; Barcaccia, G.; Bäumlein, H. Identification and genetic analysis of the APOSPORY locus in Hypericum perforatum L. Plant J. 2010, 62, 773–784. [Google Scholar] [CrossRef]
  30. Chalhoub, B.; Denoeud, F.; Liu, S.; Parkin, I.A.P.; Tang, H.; Wang, X.; Chiquet, J.; Belcram, H.; Tong, C.; Samans, B.; et al. Early allopolyploid evolution in the post-neolithic Brassica napus oilseed genome. Science 2014, 345, 950–953. [Google Scholar] [CrossRef] [Green Version]
  31. Ayyaz, A.; Miao, Y.; Hannan, F.; Islam, F.; Zhang, K.; Xu, J.; Farooq, M.A.; Zhou, W. Drought tolerance in Brassica napus is accompanied with enhanced antioxidative protection, photosynthetic and hormonal regulation at seedling stage. Physiol. Plant. 2021, 172, 1133–1148. [Google Scholar] [CrossRef] [PubMed]
  32. Lei, Y.A.N.; Shah, T.; Cheng, Y.; Yan, L.Ü.; Zhang, X.; Zou, X. Physiological and molecular responses to cold stress in rapeseed (Brassica napus L.). J. Integr. Agric. 2019, 18, 2742–2752. [Google Scholar]
  33. Lohani, N.; Jain, D.; Singh, M.B.; Bhalla, P.L. Engineering multiple abiotic stress tolerance in canola, Brassica napus. Front. Plant Sci. 2020, 3. [Google Scholar] [CrossRef] [PubMed]
  34. Li, Y.; Dong, C.; Hu, M.; Bai, Z.; Tong, C.; Zuo, R.; Liu, Y.; Cheng, X.; Cheng, M.; Huang, J.; et al. Identification of flower-specific promoters through comparative transcriptome analysis in Brassica napus. Int. J. Mol. Sci. 2019, 20, 5949. [Google Scholar] [CrossRef] [PubMed] [Green Version]
  35. Chao, H.; Li, T.; Luo, C.; Huang, H.; Ruan, Y.; Li, X.; Niu, Y.; Fan, Y.; Sun, W.; Zhang, K.; et al. Brassicaedb: A gene expression database for brassica crops. Int. J. Mol. Sci. 2020, 21, 5831. [Google Scholar] [CrossRef]
  36. Cannon, S.B.; Mitra, A.; Baumgarten, A.; Young, N.D.; May, G. The roles of segmental and tandem gene duplication in the evolution of large gene families in Arabidopsis thaliana. BMC Plant Biol. 2004, 4, 10. [Google Scholar] [CrossRef] [Green Version]
  37. Bailey, T.L.; Boden, M.; Buske, F.A.; Frith, M.; Grant, C.E.; Clementi, L.; Ren, J.; Li, W.W.; Noble, W.S. MEME Suite: Tools for motif discovery and searching. Nucleic Acids Res. 2009, 37, 202–208. [Google Scholar] [CrossRef]
  38. Lescot, M.; Déhais, P.; Thijs, G.; Marchal, K.; Moreau, Y.; Van De Peer, Y.; Rouzé, P.; Rombauts, S. PlantCARE, a database of plant cis-acting regulatory elements and a portal to tools for in silico analysis of promoter sequences. Nucleic Acids Res. 2002, 30, 325–327. [Google Scholar] [CrossRef]
  39. Szklarczyk, D.; Gable, A.L.; Lyon, D.; Junge, A.; Wyder, S.; Huerta-Cepas, J.; Simonovic, M.; Doncheva, N.T.; Morris, J.H.; Bork, P. STRING v11: Protein–protein association networks with increased coverage, supporting functional discovery in genome-wide experimental datasets. Nucleic Acids Res. 2019, 47, D607–D613. [Google Scholar] [CrossRef] [Green Version]
  40. Zhang, Y.; Ali, U.; Zhang, G.; Yu, L.; Fang, S.; Iqbal, S.; Li, H.; Lu, S.; Guo, L. Transcriptome analysis reveals genes commonly responding to multiple abiotic stresses in rapeseed. Mol. Breed. 2019, 39, 158. [Google Scholar] [CrossRef]
  41. Tang, M. Population Genome Variations and Subgenome Asymmetry in Brassica napus L.; Huazhong Agricultural University: Wuhan, China, 2019. [Google Scholar]
  42. Cho, S.K.; Ryu, M.Y.; Kim, J.H.; Hong, J.S.; Oh, T.R.; Kim, W.T.; Yang, S.W. RING E3 ligases: Key regulatory elements are involved in abiotic stress responses in plants. BMB Rep. 2017, 50, 393. [Google Scholar] [CrossRef] [PubMed] [Green Version]
  43. Albalat, R.; Cañestro, C. Evolution by gene loss. Nat. Rev. Genet. 2016, 17, 379–391. [Google Scholar] [CrossRef]
  44. Sehrish, S.; Sumbal, W.; Xie, M.; Zhao, C.; Zuo, R.; Gao, F.; Liu, S. Genome-Wide Identification and Characterization of SET Domain Family Genes in Brassica napus L. Int. J. Mol. Sci. 2022, 23, 1936. [Google Scholar] [CrossRef] [PubMed]
  45. Xie, M.; Zuo, R.; Bai, Z.; Yang, L.; Zhao, C.; Gao, F.; Cheng, X.; Huang, J.; Liu, Y.; Li, Y. Genome-wide characterization of Serine/Arginine-Rich gene family and its genetic effects on agronomic traits of Brassica napus. Front. Plant Sci. 2022, 13, 829668. [Google Scholar] [CrossRef] [PubMed]
  46. Wu, Y.; Ke, Y.; Wen, J.; Guo, P.; Ran, F.; Wang, M.; Liu, M.; Li, P.; Li, J.; Du, H. Evolution and expression analyses of the MADS-box gene family in Brassica napus. PLoS ONE 2018, 13, e0200762. [Google Scholar] [CrossRef] [PubMed]
  47. Oudelaar, A.M.; Higgs, D.R. The relationship between genome structure and function. Nat. Rev. Genet. 2021, 22, 154–168. [Google Scholar] [CrossRef]
  48. Chaudhary, B.; Flagel, L.; Stupar, R.M.; Udall, J.A.; Verma, N.; Springer, N.M.; Wendel, J.F. Reciprocal silencing, transcriptional bias and functional divergence of homeologs in polyploid cotton (Gossypium). Genetics 2009, 182, 503–517. [Google Scholar] [CrossRef] [Green Version]
  49. Meena, K.K.; Sorty, A.M.; Bitla, U.M.; Choudhary, K.; Gupta, P.; Pareek, A.; Singh, D.P.; Prabha, R.; Sahu, P.K.; Gupta, V.K. Abiotic stress responses and microbe-mediated mitigation in plants: The omics strategies. Front. Plant Sci. 2017, 8, 172. [Google Scholar] [CrossRef]
  50. Zhu, W.; Guo, Y.; Chen, Y.; Wu, D.; Jiang, L. Genome-wide identification, phylogenetic and expression pattern analysis of GATA family genes in Brassica napus. BMC Plant Biol. 2020, 20, 543. [Google Scholar] [CrossRef]
  51. Borges, F.; Gomes, G.; Gardner, R.; Moreno, N.; McCormick, S.; Feijó, J.A.; Becker, J.D. Comparative transcriptomics of Arabidopsis sperm cells. Plant Physiol. 2008, 148, 1168–1181. [Google Scholar] [CrossRef] [Green Version]
  52. Haerizadeh, F.; Wong, C.E.; Bhalla, P.L.; Gresshoff, P.M.; Singh, M.B. Genomic expression profiling of mature soybean (Glycine max) pollen. BMC Plant Biol. 2009, 9, 25. [Google Scholar] [CrossRef] [PubMed] [Green Version]
  53. Pavicic, M.; Mouhu, K.; Wang, F.; Bilicka, M.; Chovanček, E.; Himanen, K. Genomic and phenomic screens for flower related RING type ubiquitin E3 ligases in Arabidopsis. Front. Plant Sci. 2017, 8, 416. [Google Scholar] [CrossRef] [PubMed]
  54. Lu, S.; Wang, J.; Chitsaz, F.; Derbyshire, M.K.; Geer, R.C.; Gonzales, N.R.; Gwadz, M.; Hurwitz, D.I.; Marchler, G.H.; Song, J.S. CDD/SPARCLE: The conserved domain database in 2020. Nucleic Acids Res. 2020, 48, D265–D268. [Google Scholar] [CrossRef] [PubMed] [Green Version]
  55. Mistry, J.; Chuguransky, S.; Williams, L.; Qureshi, M.; Salazar, G.A.; Sonnhammer, E.L.L.; Tosatto, S.C.E.; Paladin, L.; Raj, S.; Richardson, L.J. Pfam: The protein families database in 2021. Nucleic Acids Res. 2021, 49, D412–D419. [Google Scholar] [CrossRef]
  56. Yu, C.; Chen, Y.; Lu, C.; Hwang, J. Prediction of protein subcellular localization. Proteins Struct. Funct. Bioinform. 2006, 64, 643–651. [Google Scholar] [CrossRef]
  57. Larkin, M.A.; Blackshields, G.; Brown, N.P.; Chenna, R.; McGettigan, P.A.; McWilliam, H.; Valentin, F.; Wallace, I.M.; Wilm, A.; Lopez, R. Clustal W and Clustal X version 2.0. Bioinformatics 2007, 23, 2947–2948. [Google Scholar] [CrossRef] [Green Version]
  58. Tamura, K.; Stecher, G.; Kumar, S. MEGA11: Molecular evolutionary genetics analysis version 11. Mol. Biol. Evol. 2021, 38, 3022–3027. [Google Scholar] [CrossRef]
  59. Chen, C.; Xia, R.; Chen, H.; He, Y. TBtools, a toolkit for biologists integrating various biological data handling tools with a user-friendly interface. bioRxiv 2018, 289660. [Google Scholar] [CrossRef]
  60. Wang, Y.; Tang, H.; DeBarry, J.D.; Tan, X.; Li, J.; Wang, X.; Lee, T.; Jin, H.; Marler, B.; Guo, H. MCScanX: A toolkit for detection and evolutionary analysis of gene synteny and collinearity. Nucleic Acids Res. 2012, 40, e49. [Google Scholar] [CrossRef] [Green Version]
  61. Wei, L.; Zhu, Y.; Liu, R.; Zhang, A.; Zhu, M.; Xu, W.; Lin, A.; Lu, K.; Li, J. Genome wide identification and comparative analysis of glutathione transferases (GST) family genes in Brassica napus. Sci. Rep. 2019, 9, 9196. [Google Scholar] [CrossRef] [Green Version]
  62. Shannon, P.; Markiel, A.; Ozier, O.; Baliga, N.S.; Wang, J.T.; Ramage, D.; Amin, N.; Schwikowski, B.; Ideker, T. Cytoscape: A software environment for integrated models of biomolecular interaction networks. Genome Res. 2003, 13, 2498–2504. [Google Scholar] [CrossRef] [PubMed]
  63. Yu, G.; Wang, L.-G.; Han, Y.; He, Q.-Y. clusterProfiler: An R package for comparing biological themes among gene clusters. OMICS J. Integr. Biol. 2012, 16, 284–287. [Google Scholar] [CrossRef]
  64. Livak, K.J.; Schmittgen, T.D. Analysis of relative gene expression data using real-time quantitative PCR and the 2− ΔΔCT method. Methods 2001, 25, 402–408. [Google Scholar] [CrossRef] [PubMed]
  65. Cingolani, P.; Platts, A.; Wang, L.L.; Coon, M.; Nguyen, T.; Wang, L.; Land, S.J.; Lu, X.; Ruden, D.M. A program for annotating and predicting the effects of single nucleotide polymorphisms, SnpEff: SNPs in the genome of Drosophila melanogaster strain w1118; iso-2; iso-3. Fly 2012, 6, 80–92. [Google Scholar] [CrossRef] [PubMed] [Green Version]
  66. Kang, H.M.; Sul, J.H.; Service, S.K.; Zaitlen, N.A.; Kong, S.; Freimer, N.B.; Sabatti, C.; Eskin, E. Variance component model to account for sample structure in genome-wide association studies. Nat. Genet. 2010, 42, 348–354. [Google Scholar] [CrossRef] [Green Version]
Figure 1. Phylogenetic analysis of ARI proteins in B. napus and A. thaliana. All ARI proteins are grouped into three subfamilies, and each subfamily is represented by a different color. The number on the branches shows the bootstrap values.
Ijms 23 06265 g001
Figure 2. The chromosomal locations and duplicated genes analysis of ARI genes in B. napus. The locations of all the chromosomal BnARI genes are represented on different chromosomes, excluding the random fragment chromosomes. The different colors mean different BnARI subfamilies genes. Subfamily A, subfamily B and subfamily C are indicated by green, brown and purple color, respectively. The orange lines are used to highlight the duplicated BnARI gene pairs.
Ijms 23 06265 g002
Figure 3. The phylogenetic relationship, conserved motifs and gene structure of ARI genes in B. napus. (a) The phylogenetic relationship of BnARI proteins. (b) The motif composition of BnARI proteins. Motifs (1–10) are shown in different colored boxes. (c) Gene structures of the BnARI genes. Orange boxes represent the CDS whereas green boxes represent UTR.
Ijms 23 06265 g003
Figure 4. Cis-acting regulatory elements identified in ARI gene promoters in B. napus. The color bar shows log2 of copy number of cis-elements from low (cadetblue) to high (orange).
Ijms 23 06265 g004
Figure 5. The ARI-protein interaction-network analysis in B. napus. (a) Protein–protein interaction network of BnARI proteins. The BnARI proteins are shown by orange circles, the green circles represent proteins that interacted with BnARI proteins. The red lines indicate the interaction between BnARI proteins, and the gray lines indicate the interaction between BnARI and other proteins. (b) KEGG pathway analysis of proteins interacted with BnARI proteins. The color bar shows the value of p.adjust from low (red) to high (purple).
Ijms 23 06265 g005
Figure 6. Expression profile of ARI genes in different tissues of B. napus. Heatmap was generated by taking log2 fold of FPKM values. The color bar shows relative expression from low (cadetblue) to high (orange).
Ijms 23 06265 g006
Figure 7. A qRT-PCR expression analysis of 10 ARI genes in eight different tissues of B. napus. The 2−ΔΔCT method was used to analyze the results. The error bars indicate the standard error of the mean of three biological replicates for every tissue.
Ijms 23 06265 g007
Figure 8. Expression profile of ARI genes under abiotic stress conditions in B. napus. The expression data is processed by comparing the control with each treated sample and calculating the log2 fold change to generate the heatmap. The color bar represents relative expression levels from low (cadetblue) to high (orange).
Ijms 23 06265 g008
Figure 9. Association analysis of genetic variations in BnaA02g12100D in 324 worldwide collections of B. napus population with several agronomic traits. (a) Manhattan plot of BnaA02g12100D with primary flowering time, flowering period, branch height and main inflorescence silique number (p < 0.001). (be) The haplotype analysis of BnaA02g12100D genetic variation for primary flowering time, flowering period, branch height and main inflorescence silique number.
Ijms 23 06265 g009
Table 1. Characteristics of the ARI genes in B. napus (pI, isoelectric point; MW, molecular weight).
IDClassificationpIMW (kDa)Amino acidsChromosomeStartEndDuplication TypeExon NumberSubcellular Localization
BnaC01g04040Dsubfamily A5.4468.30577598C0121072322110597WGD or Segmental6Nuclear
BnaA01g02770D 5.4967.70018592A0113635701366772WGD or Segmental6Nuclear
BnaA07g03810D 5.566.84028583A0734642243466892WGD or Segmental7Nuclear
BnaC07g05410D 5.3967.01159582C0785913838594140WGD or Segmental7Nuclear
BnaA09g02140D 5.3861.03602525A0910518751053449WGD or Segmental1Nuclear
BnaA02g29030D 5.2855.36126481A022126541621266987WGD or Segmental3Nuclear
BnaC09g01530D 5.4556.70796485C09836916838508WGD or Segmental3Nuclear
BnaC02g37060D 5.0755.77174485C024001433540015918WGD or Segmental3Nuclear
BnaC02g04010Dsubfamily B5.5358.47465510C0220401752041821WGD or Segmental2Nuclear
BnaC05g04050D 5.1263.11043556C0519760381981190WGD or Segmental15Nuclear
BnaA02g34990D 5.8362.01988541A02_random2481626477WGD or Segmental2Nuclear
BnaA10g03930D 5.1163.19455559A1020887352093862WGD or Segmental15Nuclear
BnaA03g03500D 556.69741496A0316881161689720WGD or Segmental2Nuclear
BnaC03g04990D 5.0259.7861526C0324160722417649WGD or Segmental1Nuclear
BnaA04g18230D 4.9963.39872556A041465850914662929WGD or Segmental15Nuclear
BnaC03g17530D 4.963.69074558C0389603598965066WGD or Segmental15Nuclear
BnaC04g42310D 4.9263.61489558C044288662742891037WGD or Segmental15Nuclear
BnaA08g31720D 5.0862.69513554A08_random21006052104866WGD or Segmental15Nuclear
BnaA03g14490D 4.8563.39747555A0366695446674154WGD or Segmental15Nuclear
BnaC08g01560D 5.0362.76486555C0812117741215865WGD or Segmental15Nuclear
BnaA02g12100D 5.0662.48365548A0263264356331272WGD or Segmental16Nuclear
BnaC02g45230D 5.0564.28373565C02_random956624961488WGD or Segmental15Nuclear
BnaAnng26970D 4.9657.65184499Ann_random3092237130924172Tandem2Nuclear
BnaAnng26980D 6.4851.01917440Ann_random3092629830927929Tandem2Nuclear
BnaC04g42500D 5.0963.14806548C044306666443068633Tandem2Nuclear
BnaA03g14710D 5.8360.14362522A0367611866762872WGD or Segmental2Nuclear
BnaC04g42490D 5.3966.50624574C044306014543062382WGD or Segmental3Nuclear
BnaC05g04020D 5.1861.60797529C0519670241969723WGD or Segmental14Nuclear
BnaA10g03910D 5.2860.45582522A1020730342075988WGD or Segmental15Nuclear
BnaC03g50610Dsubfamily C4.8775.1735657C033506689535072312WGD or Segmental3Nuclear
BnaA02g33880D 5.1551.08088446A022424239424244388WGD or Segmental2Extracellular
BnaC02g42680D 5.3151.23706447C024518962945191512WGD or Segmental2Extracellular
BnaA06g22860D 4.761.10942532A061600953716013955WGD or Segmental3Nuclear
BnaC03g50620D 4.8242.64821369C033507368435074888Tandem2Nuclear
BnaC02g01010D 5.6154.80394483C02436156437604WGD or Segmental1Nuclear
BnaA06g18370D 4.9950.6674447A061055257110553998WGD or Segmental2Nuclear
BnaA10g22750D 5.0674.29611672A101523547015237795WGD or Segmental3Nuclear
BnaAnng05970D 5.3854.8181478Ann_random61157916117224WGD or Segmental1Nuclear
BnaC09g47300D 6.0573.81982665C094671718146719562WGD or Segmental4Nuclear
Publisher’s Note: MDPI stays neutral with regard to jurisdictional claims in published maps and institutional affiliations.

