
New Insights into Adipokines in Gestational Diabetes Mellitus

 , ,
, ,  ,
,
Abstract
:1. Introduction
2. Methods
3. Adipokines in Maternal Circulation
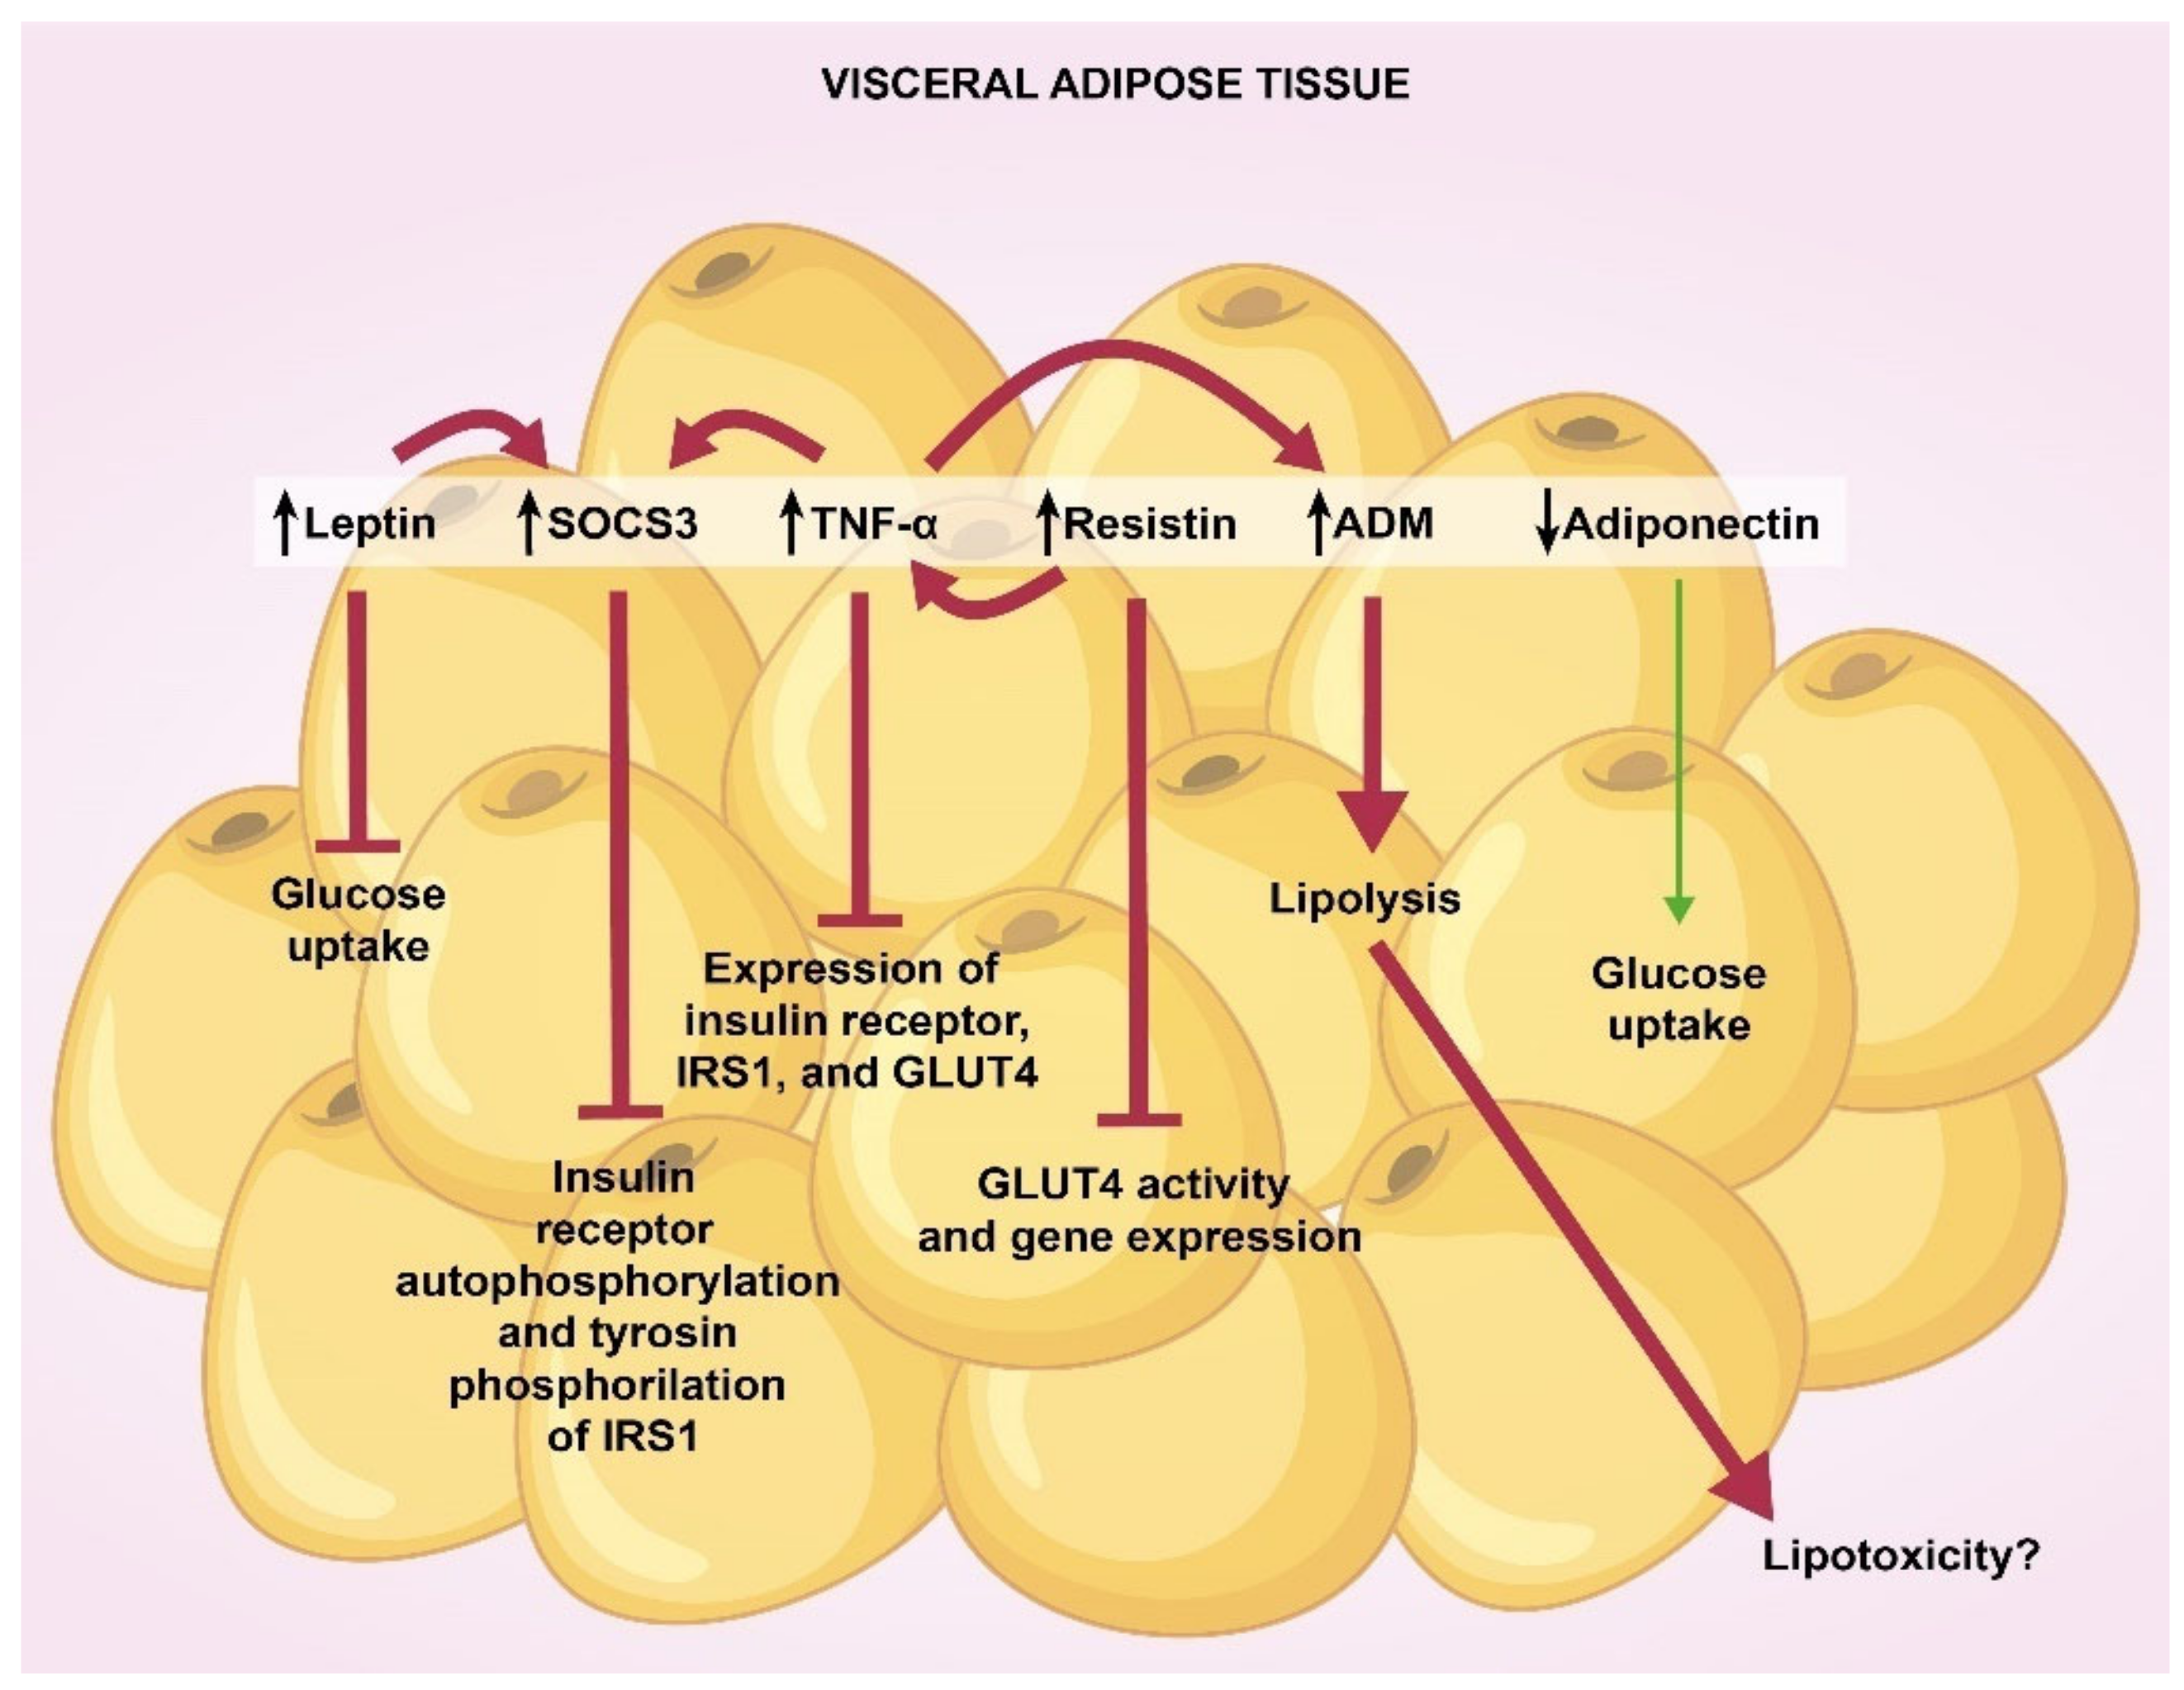
4. Adipokines in Visceral and Subcutaneous Adipose Tissue
5. Adipokines in Placenta and Cord Blood
6. Conclusions
Funding
Institutional Review Board Statement
Informed Consent Statement
Acknowledgments
Conflicts of Interest
References
- American Diabetes Association. 2. Classification and Diagnosis of Diabetes: Standards of Medical Care in Diabetes-2021. Diabetes Care 2021, 44, S15–S33. [Google Scholar] [CrossRef] [PubMed]
- McIntyre, H.D.; Catalano, P.; Zhang, C.; Desoye, G.; Mathiesen, E.R.; Damm, P. Gestational diabetes mellitus. Nat. Rev. Dis. Primers 2019, 5, 47. [Google Scholar] [CrossRef] [PubMed]
- Bellamy, L.; Casa, J.P.; Hingorani, A.D.; Williams, D. Type 2 diabetes mellitus after gestational diabetes: A systematic review and meta-analysis. Lancet 2009, 373, 1773–1779. [Google Scholar] [CrossRef]
- Catalano, P.M. The impact of gestational diabetes and maternal obesity on the mother and her offspring. J. Dev. Orig. Health Dis. 2010, 1, 208–215. [Google Scholar] [CrossRef] [PubMed]
- Landon, M.B.; Gabbe, S.G. Gestational diabetes mellitus. Obstet. Gynecol. 2011, 118, 1379–1393. [Google Scholar] [CrossRef]
- Vrachnis, N.; Augoulea, A.; Iliodromiti, Z.; Lambrinoudaki, I.; Sifakis, S.; Creatsas, G. Previous gestational diabetes mellitus and markers of cardiovascular risk. Int. J. Endocrinol. 2012, 2012, 458610. [Google Scholar] [CrossRef]
- Lambrinoudaki, I.; Vlachou, S.A.; Creatsas, G. Genetics in gestational diabetes mellitus: Association with incidence, severity, pregnancy outcome and response to treatment. Curr. Diabetes Rev. 2010, 6, 393–399. [Google Scholar] [CrossRef]
- Fasshauer, M.; Blüher, M.; Stumvoll, M. Adipokines in gestational diabetes. Lancet Diabetes Endocrinol. 2014, 2, 488–499. [Google Scholar] [CrossRef]
- De Gennaro, G.; Palla, G.; Battini, L.; Simoncini, T.; Del Prato, S.; Bertolotto, A.; Bianchi, C. The role of adipokines in the pathogenesis of gestational diabetes mellitus. Gynecol. Endocrinol. 2019, 35, 737–751. [Google Scholar] [CrossRef]
- Ruszała, M.; Niebrzydowska, M.; Pilszyk, A.; Kimber-Trojnar, Ż.; Trojnar, M.; Leszczyńska-Gorzelak, B. Novel Biomolecules in the Pathogenesis of Gestational Diabetes Mellitus. Int. J. Mol. Sci. 2021, 22, 11578. [Google Scholar] [CrossRef]
- Mallardo, M.; Ferraro, S.; Daniele, A.; Nigro, E. GDM-complicated pregnancies: Focus on adipokines. Mol. Biol. Rep. 2021, 48, 8171–8180. [Google Scholar] [CrossRef] [PubMed]
- Tagoma, A.; Haller-Kikkatalo, K.; Oras, A.; Roos, K.; Kirss, A.; Uibo, R. Plasma cytokines during pregnancy provide insight into the risk of diabetes in the gestational diabetes risk group. J. Diabetes Investig. 2022. [Google Scholar] [CrossRef] [PubMed]
- Al-Musharaf, S.; Sabico, S.; Hussain, S.D.; Al-Tawashi, F.; Bandar, H.; Al-Daghri, N.; McTernan, P. Inflammatory and Adipokine Status from Early to Midpregnancy in Arab Women and Its Associations with Gestational Diabetes Mellitus. Dis. Markers 2021, 2021, 8862494. [Google Scholar] [CrossRef] [PubMed]
- Saucedo, R.; Valencia, J.; Moreno, L.E.; Peña, M.I.; Aranda, A.; García, Y.; Díaz, M.F.; Hernández, M. Maternal serum adipokines and inflammatory markers at late gestation and newborn weight in mothers with and without gestational diabetes mellitus. Ginekol. Pol. 2022, 93, 126–133. [Google Scholar] [CrossRef] [PubMed]
- Atarod, Z.; Ebrahemian, M.; Jafarpour, H.; Moraghebi, M.; Sharafkhani, E. Association between serum adiponectin levels with gestational diabetes mellitus and postpartum metabolic syndrome: A case control study. Endocr. Regul. 2020, 54, 119–125. [Google Scholar] [CrossRef] [PubMed]
- Wang, Q.; DU, J.; Liu, F. Changes of Serum Adiponectin and Glycated Albumin Levels in Gestational Diabetes Mellitus Patients and Their Relationship with Insulin Resistance. Iran. J. Public Health 2020, 49, 1252–1261. [Google Scholar] [CrossRef] [PubMed]
- Francis, E.C.; Li, M.; Hinkle, S.N.; Cao, Y.; Chen, J.; Wu, J.; Zhu, Y.; Cao, H.; Kemper, K.; Rennert, L.; et al. Adipokines in early and mid-pregnancy and subsequent risk of gestational diabetes: A longitudinal study in a multiracial cohort. BMJ Open Diabetes Res. Care 2020, 8, e001333. [Google Scholar] [CrossRef]
- Yuan, X.S.; Shi, H.; Wang, H.Y.; Yu, B.; Jiang, J. Ficolin-3/adiponectin ratio for the prediction of gestational diabetes mellitus in pregnant women. J. Diabetes Investig. 2018, 9, 403–410. [Google Scholar] [CrossRef] [Green Version]
- Mierzyński, R.; Dłuski, D.; Nowakowski, Ł.; Poniedziałek-Czajkowska, E.; Leszczyńska-Gorzelak, B. Adiponectin and Omentin Levels as Predictive Biomarkers of Preterm Birth in Patients with Gestational Diabetes Mellitus. Biomed. Res. Int. 2018, 2018, 7154216. [Google Scholar] [CrossRef] [Green Version]
- Sweeting, A.N.; Wong, J.; Appelblom, H.; Ross, G.P.; Kouru, H.; Williams, P.F.; Sairanen, M.; Hyett, J.A. A Novel Early Pregnancy Risk Prediction Model for Gestational Diabetes Mellitus. Fetal. Diagn. Ther. 2019, 45, 76–84. [Google Scholar] [CrossRef]
- Thagaard, I.N.; Krebs, L.; Holm, J.C.; Lange, T.; Larsen, T.; Christiansen, M. Adiponectin and leptin as first trimester markers for gestational diabetes mellitus: A cohort study. Clin. Chem. Lab. Med. 2017, 55, 1805–1812. [Google Scholar] [CrossRef] [PubMed]
- Guelfi, K.J.; Ong, M.J.; Li, S.; Wallman, K.E.; Doherty, D.A.; Fournier, P.A.; Newnham, J.P.; Keelan, J.A. Maternal circulating adipokine profile and insulin resistance in women at high risk of developing gestational diabetes mellitus. Metabolism 2017, 75, 54–60. [Google Scholar] [CrossRef] [PubMed] [Green Version]
- Abell, S.K.; Shorakae, S.; Harrison, C.L.; Hiam, D.; Moreno-Asso, A.; Stepto, N.K.; De Courten, B.; Teede, H.J. The association between dysregulated adipocytokines in early pregnancy and development of gestational diabetes. Diabetes Metab. Res. Rev. 2017, 33, e2926. [Google Scholar] [CrossRef] [PubMed]
- Zhang, Y.; Lu, J.H.; Zheng, S.Y.; Yan, J.H.; Chen, L.; Liu, X.; Wu, W.Z.; Wang, F. Serum levels of nesfatin-1 are increased in gestational diabetes mellitus. Gynecol. Endocrinol. 2017, 33, 621–624. [Google Scholar] [CrossRef]
- Peña-Cano, M.I.; Valencia, J.; Morales, E.; Díaz, M.F.; Gómez, R.; Saucedo, R. Omentin-1 and its relationship with inflammatory factors in maternal plasma and visceral adipose tissue of women with gestational diabetes mellitus. J. Endocrinol. Investig. 2022, 45, 453–462. [Google Scholar] [CrossRef]
- Yin, X.; Huo, Y.; Liu, L.; Pan, Y.; Liu, S.; Wang, R. Serum Levels and Placental Expression of NGAL in Gestational Diabetes Mellitus. Int. J. Endocrinol. 2020, 2020, 8760563. [Google Scholar] [CrossRef]
- Šimják, P.; Cinkajzlová, A.; Anderlová, K.; Kloučková, J.; Kratochvílová, H.; Lacinová, Z.; Kaválková, P.; Krejčí, H.; Mráz, M.; Pařízek, A. Changes in plasma concentrations and mRNA expression of hepatokines fetuin A, fetuin B and FGF21 in physiological pregnancy and gestational diabetes mellitus. Physiol. Res. 2018, 67, S531–S542. [Google Scholar] [CrossRef]
- Yang, X.; Quan, X.; Lan, Y.; Ye, J.; Wei, Q.; Yin, X.; Fan, F.; Xing, H. Serum chemerin level during the first trimester of pregnancy and the risk of gestational diabetes mellitus. Gynecol. Endocrinol. 2017, 33, 770–773. [Google Scholar] [CrossRef]
- Mierzyński, R.; Poniedziałek-Czajkowska, E.; Dłuski, D.; Patro-Małysza, J.; Kimber-Trojnar, Ż.; Majsterek, M.; Leszczyńska-Gorzelak, B. Nesfatin-1 and Vaspin as Potential Novel Biomarkers for the Prediction and Early Diagnosis of Gestational Diabetes Mellitus. Int. J. Mol. Sci. 2019, 20, 159. [Google Scholar] [CrossRef] [Green Version]
- Seyhanli, Z.; Seyhanli, A.; Aksun, S.; Pamuk, B.O. Evaluation of serum Angiopoietin-like protein 2 (ANGPTL-2), Angiopoietin-like protein 8 (ANGPTL-8), and high-sensitivity C-reactive protein (hs-CRP) levels in patients with gestational diabetes mellitus and normoglycemic pregnant women. J. Matern. Fetal Neonatal Med. 2021, 1–9. [Google Scholar] [CrossRef]
- Abdeltawab, A.; Zaki, M.E.; Abdeldayem, Y.; Mohamed, A.A.; Zaied, S.M. Circulating micro RNA-223 and angiopoietin-like protein 8 as biomarkers of gestational diabetes mellitus. Br. J. Biomed. Sci. 2021, 78, 12–17. [Google Scholar] [CrossRef] [PubMed]
- Gülcü, F.; Melekoğlu, R.; Gürsu, M.F.; Bağcı, H.; Celik, E.; Akyol, A. Evaluation of second-trimester maternal serum betatrophin levels and lipid and carbohydrate metabolism parameters in patients with gestational diabetes mellitus. Turk. J. Obstet. Gynecol. 2020, 17, 28–33. [Google Scholar] [CrossRef] [PubMed]
- Huang, Y.; Chen, X.; Chen, X.; Feng, Y.; Guo, H.; Li, S.; Dai, T.; Jiang, R.; Zhang, X.; Fang, C.; et al. Angiopoietin-like protein 8 in early pregnancy improves the prediction of gestational diabetes. Diabetologia 2018, 61, 574–580. [Google Scholar] [CrossRef] [PubMed] [Green Version]
- Demir, M.; Caniklioğlu, A. Maternal Serum Delta-Like 1 and Nesfatin-1 Levels in Gestational Diabetes Mellitus: A Prospective Case-Control Study. Cureus 2021, 8, e17001. [Google Scholar] [CrossRef]
- Ademoglu, E.N.; Gorar, S.; Keskin, M.; Carlioglu, A.; Ucler, R.; Erdamar, H.; Culha, C.; Aral, Y. Serum nesfatin-1 levels are decreased in pregnant women newly diagnosed with gestational diabetes. Arch. Endocrinol. Metab. 2017, 61, 455–459. [Google Scholar] [CrossRef] [Green Version]
- Jin, C.; Lin, L.; Han, N.; Zhao, Z.; Liu, Z.; Luo, S.; Xu, X.; Liu, J.; Wang, H. Effects of dynamic change in fetuin-A levels from the first to the second trimester on insulin resistance and gestational diabetes mellitus: A nested case-control study. BMJ Open Diabetes Res. Care 2020, 8, e000802. [Google Scholar] [CrossRef] [Green Version]
- Jeon, E.J.; Hong, S.Y.; Lee, J.H. Adipokines and Insulin Resistance According to Characteristics of Pregnant Women with Gestational Diabetes Mellitus. Diabetes Metab. J. 2017, 41, 457–465. [Google Scholar] [CrossRef]
- Tsiotra, P.C.; Halvatsiotis, P.; Patsouras, K.; Maratou, E.; Salamalekis, G.; Raptis, S.A.; Dimitriadis, G.; Boutati, E. Circulating adipokines and mRNA expression in adipose tissue and the placenta in women with gestational diabetes mellitus. Peptides 2018, 101, 157–166. [Google Scholar] [CrossRef]
- Fruhbeck, G. Intracellular signalling pathways activated by leptin. Biochem. J. 2006, 393, 7–20. [Google Scholar] [CrossRef] [Green Version]
- Amitani, M.; Asakawa, A.; Amitani, H.; Inui, A. The role of leptin in the control of insulin-glucose axis. Front. Neurosci. 2013, 7, 51. [Google Scholar] [CrossRef] [Green Version]
- Xiao, W.Q.; He, J.R.; Shen, S.Y.; Lu, J.H.; Kuang, Y.S.; Wei, X.L.; Qiu, X. Maternal circulating leptin profile during pregnancy and gestational diabetes mellitus. Diabetes Res. Clin. Pract. 2020, 161, 108041. [Google Scholar] [CrossRef] [PubMed]
- Masuzaki, H.; Ogawa, Y.; Sagawa, N.; Hosoda, K.; Matsumoto, T.; Mise, H.; Nishimura, H.; Yoshimasa, Y.; Tanaka, I.; Mori, T.; et al. Nonadipose tissue production of leptin: Leptin as a novel placenta-derived hormone in humans. Nat. Med. 1997, 3, 1029–1033. [Google Scholar] [CrossRef] [PubMed]
- Paz-Filho, G.; Mastronardi, C.; Wong, M.L.; Licinio, J. Leptin therapy, insulin sensitivity, and glucose homeostasis. Indian J. Endocrinol. Metab. 2012, 16, S549–S555. [Google Scholar] [CrossRef] [PubMed]
- Hennige, A.M.; Stefan, N.; Kapp, K.; Lehmann, R.; Weigert, C.; Beck, A.; Moeschel, J.; Mushack, J.; Schleicher, E.; Häring, H.U. Leptin down-regulates insulin action through phosphorylation of serine-318 in insulin receptor substrate. FASEB J. 2006, 20, 1206–1208. [Google Scholar] [CrossRef] [Green Version]
- Kieffer, T.J.; Habener, J.F. The adipoinsular axis: Effects of leptin on pancreatic beta-cells. Am. J. Physiol. Endorcrinol. Metab. 2000, 278, E1–E14. [Google Scholar] [CrossRef]
- Jang, D.I.; Lee, A.H.; Shin, H.Y.; Song, H.R.; Park, J.H.; Kang, T.B.; Lee, S.R.; Yang, S.H. The Role of Tumor Necrosis Factor Alpha (TNF-α) in Autoimmune Disease and Current TNF-α Inhibitors in Therapeutics. Int. J. Mol. Sci. 2021, 22, 2719. [Google Scholar] [CrossRef]
- Akash, M.S.H.; Rehman, K.; Liaqat, A. Tumor Necrosis Factor-Alpha: Role in Development of Insulin Resistance and Pathogenesis of Type 2 Diabetes Mellitus. J. Cell. Biochem. 2018, 119, 105–110. [Google Scholar] [CrossRef]
- He, P.; Bai, M.; Hu, J.P.; Dong, C.; Sun, S.; Huang, C. Significance of Neutrophil Gelatinase-Associated Lipocalin as a Biomarker for the Diagnosis of Diabetic Kidney Disease: A Systematic Review and Meta-Analysis. Kidney Blood Press. Res. 2020, 45, 497–509. [Google Scholar] [CrossRef]
- Chang, S.Y.; Kim, D.B.; Ko, S.H.; Jang, H.J.; Jo, Y.H.; Kim, M.J. The level of nitric oxide regulates lipocalin-2 expression under inflammatory condition in RINm5F beta-cells. Biochem. Biophys. Res. Commun. 2016, 476, 7–14. [Google Scholar] [CrossRef]
- Abu-Farha, M.; Ghosh, A.; Al-Khairi, I.; Madiraju, S.R.M.; Abubaker, J.; Prentki, M. The multi-faces of Angptl8 in health and disease: Novel functions beyond lipoprotein lipase modulation. Prog. Lipid Res. 2020, 80, 101067. [Google Scholar] [CrossRef]
- Luo, M.; Peng, D. ANGPTL8: An Important Regulator in Metabolic Disorders. Front. Endocrinol. 2018, 9, 169. [Google Scholar] [CrossRef] [PubMed] [Green Version]
- Achari, A.E.; Jain, S.K. Adiponectin, a Therapeutic Target for Obesity, Diabetes, and Endothelial Dysfunction. Int. J. Mol. Sci. 2017, 18, 1321. [Google Scholar] [CrossRef] [Green Version]
- Oh, D.K.; Ciaraldi, T.; Henry, R.R. Adiponectin in health and disease. Diabetes Obes. Metab. 2007, 9, 282–289. [Google Scholar] [CrossRef]
- Waki, H.; Yamauchi, T.; Kamon, J.; Kita, S.; Ito, Y.; Hada, Y.; Uchida, S.; Tsuchida, A.; Takekawa, S.; Kadowaki, T. Generation of globular fragment of adiponectin by leukocyte elastase secreted by monocytic cell line THP-1. Endocrinology 2005, 146, 790–796. [Google Scholar] [CrossRef]
- Yamauchi, T.; Kamon, J.; Ito, Y.; Tsuchida, A.; Yokomizo, T.; Kita, S.; Sugiyama, T.; Miyagishi, M.; Hara, K.; Tsunoda, M. Cloning of adiponectin receptors that mediate antidiabetic metabolic effects. Nature 2003, 423, 762–769. [Google Scholar] [CrossRef] [PubMed]
- Hug, C.; Wang, J.; Ahmad, N.S.; Bogan, J.S.; Tsao, T.S.; Lodish, H.F. T-cadherin is a receptor for hexameric and high-molecular-weight forms of acrp30/adiponectin. Proc. Natl. Acad. Sci. USA 2004, 101, 10308–10313. [Google Scholar] [CrossRef] [Green Version]
- Mazaki-Tovi, S.; Kanety, H.; Pariente, C.; Hemi, R.; Wiser, A.; Schiff, E.; Sivan, E. Maternal serum adiponectin levels during human pregnancy. J. Perinatol. 2007, 27, 77–81. [Google Scholar] [CrossRef]
- Yamauchi, T.; Kamon, J.; Minokoshi, Y.A.; Ito, Y.; Waki, H.; Uchida, S.; Yamashita, S.; Noda, M.; Kita, S.; Ueki, K. Adiponectin stimulates glucose utilization and fatty-acid oxidation by activating amp-activated protein kinase. Nat. Med. 2002, 8, 1288–1295. [Google Scholar] [CrossRef] [PubMed]
- Fruebis, J.; Tsao, T.-S.; Javorschi, S.; Ebbets-Reed, D.; Erickson, M.R.S.; Yen, F.T.; Bihain, B.E.; Lodish, H.F. Proteolytic cleavage product of 30-kDa adipocyte complement-related protein increases fatty acid oxidation in muscle and causes weight loss in mice. Proc. Natl. Acad. Sci. USA 2001, 98, 2005–2010. [Google Scholar] [CrossRef] [PubMed]
- Ceddia, R.B.; Somwar, R.; Maida, A.; Fang, X.; Bikopoulos, G.; Sweeney, G. Globular adiponectin increases glut4 translocation and glucose uptake but reduces glycogen synthesis in rat skeletal muscle cells. Diabetologia 2005, 48, 132–139. [Google Scholar] [CrossRef]
- Ohashi, K.; Ouchi, N.; Matsuzawa, Y. Anti-inflammatory and anti-atherogenic properties of adiponectin. Biochimie 2012, 94, 2137–2142. [Google Scholar] [CrossRef] [PubMed]
- Kadowaki, T.; Yamauchi, T. Adiponectin and Adiponectin Receptors. Endocr. Rev. 2005, 26, 439–451. [Google Scholar] [CrossRef] [PubMed] [Green Version]
- Fang, H.; Judd, R.L. Adiponectin Regulation and Function. Compr. Physiol. 2018, 8, 1031–1063. [Google Scholar] [CrossRef] [PubMed]
- Yang, M.; Zhang, Z.; Wang, C.; Li, K.; Li, S.; Boden, G.; Li, L.; Yang, G. Nesfatin-1 action in the brain increases insulin sensitivity through Akt/AMPK/TORC2 pathway in diet-induced insulin resistance. Diabetes 2012, 61, 1959–1968. [Google Scholar] [CrossRef] [Green Version]
- Wu, D.; Yang, M.; Chen, Y.; Jia, Y.; Ma, Z.A.; Boden, G.; Li, L.; Yang, G. Hypothalamic nesfatin-1/NUCB2 knockdown augments hepatic gluconeogenesis that is correlated with inhibition of mTOR-STAT3 signaling pathway in rats. Diabetes 2014, 63, 1234–1247. [Google Scholar] [CrossRef] [Green Version]
- Nakata, M.; Manaka, K.; Yamamoto, S.; Mori, M.; Yada, T. Nesfatin-1 enhances glucose-induced insulin secretion by promoting Ca2+ influx through L-type channels in mouse islet β-cells. Endocr. J. 2011, 58, 305. [Google Scholar] [CrossRef] [Green Version]
- Makki, K.; Froguel, P.; Wolowczuk, I. Adipose tissue in obesity-related inflammation and insulin resistance: Cells, cytokines, and chemokines. ISRN Inflamm. 2013, 2013, 139239. [Google Scholar] [CrossRef] [Green Version]
- Karastergiou, K.; Mohamed-Ali, V. The autocrine and paracrine roles of adipokines. Mol. Cell. Endocrinol. 2010, 318, 69–78. [Google Scholar] [CrossRef] [Green Version]
- Mancuso, P. The role of adipokines in chronic inflammation. ImmunoTargets Ther. 2016, 5, 47–56. [Google Scholar] [CrossRef] [Green Version]
- Bai, Y.; Sun, Q. Macrophage recruitment in obese adipose tissue. Obes. Rev. 2015, 16, 127–136. [Google Scholar] [CrossRef] [Green Version]
- Revelo, X.S.; Luck, H.; Winer, S.; Winer, D.A. Morphological and inflammatory changes in visceral adipose tissue during obesity. Endocr. Pathol. 2014, 25, 93–101. [Google Scholar] [CrossRef] [PubMed]
- Cao, H. Adipocytokines in obesity and metabolic disease. J. Endocrinol. 2014, 220, T47–T59. [Google Scholar] [CrossRef] [PubMed] [Green Version]
- Calvani, M.; Scarfone, A.; Granato, L.; Mora, E.V.; Nanni, G.; Castagneto, M.; Greco, A.V.; Manco, M.; Mingrone, G. Restoration of Adiponectin Pulsatility in Severely Obese Subjects after Weight Loss. Diabetes 2004, 53, 939–947. [Google Scholar] [CrossRef] [PubMed] [Green Version]
- Reinehr, T.; Roth, C.; Menke, T.; Andler, W. Adiponectin before and after weight loss in obese children. J. Clin. Endocrinol. Metab. 2004, 89, 3790–3794. [Google Scholar] [CrossRef] [Green Version]
- Ovesen, P.; Rasmussen, S.; Kesmodel, U. Effect of Prepregnancy Maternal Overweight and Obesity on Pregnancy Outcome. Obstet. Gynecol. 2011, 118, 305–312. [Google Scholar] [CrossRef] [Green Version]
- Poston, L.; Harthoorn, L.F.; van der Beek, E.M.; Contributors to the ILSI Europe Workshop. Obesity in pregnancy: Implications for the mother and lifelong health of the child. A consensus statement. Pediatr. Res. 2011, 69, 175–180. [Google Scholar] [CrossRef]
- Minjarez, M.; Rincón, I.; Morales, Y.A.; Espinosa, M.J.; Zárate, A.; Hernández, M. Ganancia de peso gestacional como factor de riesgo para desarrollar complicaciones obstétricas. Perinatol. Reprod. Hum. 2014, 28, 159–166. [Google Scholar]
- Gutaj, P.; Sibiak, R.; Jankowski, M.; Awdi, K.; Bryl, R.; Mozdziak, P.; Kempisty, B.; Wender-Ozegowska, E. The Role of the Adipokines in the Most Common Gestational Complications. Int. J. Mol. Sci. 2020, 21, 9408. [Google Scholar] [CrossRef]
- Dong, Y.; Chauhan, M.; Betancourt, A.; Belfort, M.; Yallampalli, C. Adipose Tissue Inflammation and Adrenomedullin Overexpression Contribute to Lipid Dysregulation in Diabetic Pregnancies. J. Clin. Endocrinol. Metab. 2018, 103, 3810–3818. [Google Scholar] [CrossRef] [Green Version]
- Ott, R.; Stupin, J.H.; Melchior, K.; Schellong, K.; Ziska, T.; Dudenhausen, J.W.; Henrich, W.; Rancourt, R.C.; Plagemann, A. Alterations of adiponectin gene expression and DNA methylation in adipose tissues and blood cells are associated with gestational diabetes and neonatal outcome. Clin. Epigenetics 2018, 10, 131. [Google Scholar] [CrossRef] [Green Version]
- Telejko, B.; Kuzmicki, M.; Wawrusiewicz-Kurylonek, N.; Szamatowicz, J.; Nikolajuk, A.; Zonenberg, A.; Zwierz-Gugala, D.; Jelski, W.; Laudański, P.; Wilczynski, J.; et al. Plasma apelin levels and apelin/APJ mRNA expression in patients with gestational diabetes mellitus. Diabetes Res. Clin. Pract. 2010, 87, 176–183. [Google Scholar] [CrossRef] [PubMed]
- Lappas, M. Effect of pre-existing maternal obesity, gestational diabetes and adipokines on the expression of genes involved in lipid metabolism in adipose tissue. Metabolism 2014, 63, 250–262. [Google Scholar] [CrossRef] [PubMed]
- Barker, G.; Lim, R.; Georgiou, H.M.; Lappas, M. Omentin-1 is decreased in maternal plasma, placenta and adipose tissue of women with pre-existing obesity. PLoS ONE 2012, 7, e42943. [Google Scholar] [CrossRef] [PubMed]
- Rancourt, R.C.; Ott, R.; Ziska, T.; Schellong, K.; Melchior, K.; Henrich, W.; Plagemann, A. Visceral Adipose Tissue Inflammatory Factors (TNF-Alpha, SOCS3) in Gestational Diabetes (GDM): Epigenetics as a Clue in GDM Pathophysiology. Int. J. Mol. Sci. 2020, 21, 479. [Google Scholar] [CrossRef] [Green Version]
- Ma, Y.; Cheng, Y.; Wang, J.; Cheng, H.; Zhou, S.; Li, X. The changes of visfatin in serum and its expression in fat and placental tissue in pregnant women with gestational diabetes. Diabetes Res. Clin. Pract. 2010, 90, 60–65. [Google Scholar] [CrossRef]
- Li, X.M.; Ji, H.; Li, C.J.; Wang, P.H.; Yu, P.; Yu, D.M. Chemerin expression in Chinese pregnant women with and without gestational diabetes mellitus. Ann. Endocrinol. 2015, 76, 19–24. [Google Scholar] [CrossRef]
- Müller, G.; Ertl, J.; Gerl, M.; Preibisch, G. Leptin impairs metabolic actions of insulin in isolated rat adipocytes. J. Biol. Chem. 1997, 272, 10585–10593. [Google Scholar] [CrossRef] [Green Version]
- Pérez, C.; Fernández-Galaz, C.; Fernández-Agulló, T.; Arribas, C.; Andrés, A.; Ros, M.; Carrascosa, J.M. Leptin impairs insulin signaling in rat adipocytes. Diabetes 2004, 53, 347–353. [Google Scholar] [CrossRef] [Green Version]
- Emanuelli, B.; Peraldi, P.; Filloux, C.; Chavey, C.; Freidinger, K.; Hilton, D.J.; Hotamisligil, G.S.; Van Obberghen, E. SOCS-3 inhibits insulin signaling and is up-regulated in response to tumor necrosis factor-alpha in the adipose tissue of obese mice. J. Biol. Chem. 2001, 276, 47944–47949. [Google Scholar] [CrossRef] [Green Version]
- Liu, L.S.; Spelleken, M.; Rohrig, K.; Hauner, H.; Eckel, J. Tumor necrosis factor-alpha acutely inhibits insulin signaling in human adipocytes: Implication of the p80 tumor necrosis factor receptor. Diabetes 1998, 47, 515–522. [Google Scholar] [CrossRef]
- Ruan, H.; Miles, P.D.; Ladd, C.M.; Ross, K.; Golub, T.R.; Olefsky, J.M.; Lodish, H.F. Profiling gene transcription in vivo reveals adipose tissue as an immediate target of tumor necrosis factor-alpha: Implications for insulin resistance. Diabetes 2002, 51, 3176–3188. [Google Scholar] [CrossRef] [PubMed] [Green Version]
- Stephens, J.M.; Lee, J.; Pilch, P.F. Tumor necrosis factor-alpha-induced insulin resistance in 3T3-L1 adipocytes is accompanied by a loss of insulin receptor substrate-1 and GLUT4 expression without a loss of insulin receptor-mediated signal transduction. J. Biol. Chem. 1997, 272, 971–976. [Google Scholar] [CrossRef] [PubMed] [Green Version]
- Fu, Y.; Luo, L.; Luo, N.; Garvey, W.T. Proinflammatory cytokine production and insulin sensitivity regulated by overexpression of resistin in 3T3-L1 adipocytes. Nutr. Metab. 2006, 3, 28. [Google Scholar] [CrossRef] [PubMed] [Green Version]
- Wu, X.; Motoshima, H.; Mahadev, K.; Stalker, T.J.; Scalia, R.; Goldstein, B.J. Involvement of AMP-activated protein kinase in glucose uptake stimulated by the globular domain of adiponectin in primary rat adipocytes. Diabetes 2003, 52, 1355–1363. [Google Scholar] [CrossRef] [PubMed] [Green Version]
- Olmos, A.; Flores, P.; Díaz, L.; Velázquez, P.; Ramírez, C.; Zaga, V. Immunoendocrine Dysregulation during Gestational Diabetes Mellitus: The Central Role of the Placenta. Int. J. Mol. Sci. 2021, 22, 8087. [Google Scholar] [CrossRef] [PubMed]
- Lopez, I.; Smith, R.F.; Gillmer, M.; Schidlmeir, A.; Hockaday, T.D. High levels of growth hormone and human placental lactogen in pregnancy complicated by diabetes. Diabetes Res. 1986, 3, 119–125. [Google Scholar]
- Lassance, L.; Haghiac, M.; Minium, J.; Catalano, P.; Hauguel-de Mouzon, S.H. Obesity-Induced Down-Regulation of the Mitochondrial Translocator Protein (TSPO) Impairs Placental Steroid Production. J. Clin. Endocrinol. Metab. 2015, 100, E11–E18. [Google Scholar] [CrossRef] [Green Version]
- Lee, S.R.; Choi, W.Y.; Heo, J.H.; Huh, J.; Kim, G.; Lee, K.P.; Kwun, H.-J.; Shin, H.J.; Baek, I.J.; Hong, E.J. Progesterone increases blood glucose via hepatic progesterone receptor membrane component 1 under limited or impaired action of insulin. Sci. Rep. 2020, 10, 16316. [Google Scholar] [CrossRef]
- Pantham, P.; Aye, I.; Powell, T. Inflammation in maternal obesity and gestational diabetes mellitus. Placenta 2015, 36, 709–715. [Google Scholar] [CrossRef] [Green Version]
- Shang, M.; Dong, X.; Hou, L. Correlation of adipokines and markers of oxidative stress in women with gestational diabetes mellitus and their newborns. J. Obstet. Gynaecol. Res. 2018, 44, 637–646. [Google Scholar] [CrossRef]
- Manoharan, B.; Bobby, Z.; Dorairajan, G.; Vinayagam, V.; Packirisamy, R.M. Adipokine levels and their association with insulin resistance and fetal outcomes among the newborns of Indian gestational diabetic mothers. Saudi Med. J. 2019, 40, 353–359. [Google Scholar] [CrossRef] [PubMed]
- Ortega-Senovilla, H.; Schaefer-Graf, U.; Meitzner, K.; Abou-Dakn, M.; Graf, K.; Kintscher, U.; Herrera, E. Gestational diabetes mellitus causes changes in the concentrations of adipocyte fatty acid-binding protein and other adipocytokines in cord blood. Diabetes Care 2011, 34, 2061–2066. [Google Scholar] [CrossRef] [PubMed] [Green Version]
- Tan, K.; Tint, M.T.; Michael, N.; Yap, F.; Chong, Y.S.; Tan, K.H.; Godfrey, K.M.; Larbi, A.; Lee, Y.S.; Chan, S.Y.; et al. Determinants of cord blood adipokines and association with neonatal abdominal adipose tissue distribution. Int. J. Obes. 2022, 46, 637–645. [Google Scholar] [CrossRef] [PubMed]
- Aslan, M.; Celik, O.; Celik, N.; Turkcuoglu, I.; Yilmaz, E.; Karaer, A.; Simsek, Y.; Celik, E.; Aydin, S. Cord blood nesfatin-1 and apelin-36 levels in gestational diabetes mellitus. J. Endocrinol. 2011, 41, 424–429. [Google Scholar] [CrossRef] [PubMed]
- Yu, J.; Xiao-Ling, S.; Jing, J.; Shao-Shuai, W.; Ling, F. The Relationship Between the Expression of Resistin and Apoptosis Factors in Placenta and the Pathogenesis of Gestational Diabetes Mellitus. Matern. Fetal Med. 2020, 2, 80–83. [Google Scholar] [CrossRef]
- Šimják, P.; Cinkajzlová, A.; Anderlová, K.; Pařízek, A.; Mráz, M.; Kršek, M.; Haluzík, M. The role of obesity and adipose tissue dysfunction in gestational diabetes mellitus. J. Endocrinol. 2018, 238, R63–R77. [Google Scholar] [CrossRef] [PubMed]
- Huo, Y.; Liu, S.X.; Song, G.Y.; Ren, L.P.; Wang, C.; Zhang, D.H. Plasma levels and placental expression of vaspin in pregnant women with diabetes mellitus. Braz. J. Med. Biol. Res. 2015, 48, 273–279. [Google Scholar] [CrossRef] [PubMed] [Green Version]
- Yuksel, M.A.; Oncul, M.; Tuten, A.; Imamoglu, M.; Acikgoz, A.S.; Kucur, M.; Madazli, R. Maternal serum and fetal cord blood irisin levels in gestational diabetes mellitus. Diabetes Res. Clin. Pract. 2014, 104, 171–175. [Google Scholar] [CrossRef]
- Stanirowski, P.J.; Lipa, M.; Bomba-Opoń, D.; Wielgoś, M. Expression of placental glucose transporter proteins in pregnancies complicated by fetal growth disorders. Adv. Protein Chem. Struct. Biol. 2021, 123, 95–131. [Google Scholar] [PubMed]
- Kainulainen, H.; Järvinen, T.; Heinonen, P.K. Placental glucose transporters in fetal intrauterine growth retardation and macrosomia. Gynecol. Obstet. Investig. 1997, 44, 89–92. [Google Scholar] [CrossRef]
- Stanirowski, P.J.; Szukiewicz, D.; Majewska, A.; Wątroba, M.; Pyzlak, M.; Bomba-Opoń, D.; Wielgoś, M. Differential Expression of Glucose Transporter Proteins GLUT-1, GLUT-3, GLUT-8 and GLUT-12 in the Placenta of Macrosomic, Small-for-Gestational-Age and Growth-Restricted Foetuses. J. Clin. Med. 2021, 10, 5833. [Google Scholar] [CrossRef] [PubMed]


| Authors (Year) | Study Design | n | Gestational Age at Measurement | Adipokine Concentration in GDM | Secondary Findings and Comments |
|---|---|---|---|---|---|
| Adiponectin | |||||
| Tagoma, et al. (2022) [12] | Cohort | 213 (60 GDM and 153 controls) | Weeks 23–28 | ↓ | Not reported |
| Al-Musharaf, et al. (2021) [13] | Cohort | 232 (99 GDM and 133 controls) | Visit 1: weeks 8–12 Visit 2: weeks 24–28 | ↔ ↔ | Visit 1: −Systolic blood pressure, total cholesterol, triglycerides, HDL-cholesterol Visit 2: +HOMA-β It is not specified whether the correlations are considering only the GDM group or the study sample in general. |
| Saucedo, et al. (2020) [14] | Case-control | 65 GDM and 65 controls | At the end of pregnancy | ↔ | Not reported |
| Atarod, et al. (2020) [15] | Case-control | 37 GDM and 37 controls matched for maternal age and BMI | Weeks 24–28 | ↓ | In GDM: −Impaired blood glucose |
| Wang, et al. (2020) [16] | Case-control | 71 GDM and 66 controls | Weeks 23–28 | ↓ | In GDM: −Fasting plasma glucose, fasting insulin and HOMA-IR. |
| Francis, et al. (2020) [17] | Cohort | 321 (107 GDM and 214 controls) | Visit 1: weeks 10–14 Visit 2: weeks 15–26 Visit 3: weeks 23–31 Visit 4: weeks 33–39 | ↓ ↓ ↓ ↔ | Concentrations at visits 1 and 2: −GDM risk Concentrations at visit 1: −HOMA-IR, glucose, insulin, C-peptide at visit 1 −Triglycerides at visit 2. +HDL-cholesterol at visit 2 |
| Yuan, et al. (2018) [18] | Cohort | 359 (86 GDM and 273 controls) | Weeks 16–18 | ↓ | Serum adiponectin levels were a significant predictor of GDM. |
| Mierzyński, et al. (2018) [19] | Case-control | 105 GDM and 55 controls | Weeks 24–28 | ↓ | In all participants: +Omentin −BMI prior to pregnancy, at the time of blood sampling and at the end of pregnancy. |
| Sweeting, et al. (2018) [20] | Cohort | 980 (248 GDM and 732 controls) | Weeks 11–13 | ↓ | Statistical difference was maintained regardless of ethnicity. |
| Thagaard, et al. (2017) [21] | Cohort | 2590 (107 GDM and 2483 without GDM) classified as normal weight (18.5 ≤ BMI ≤ 24.9), moderately obese (30 ≤ BMI ≤ 34.9) and severely obese (BMI ≥ 35). | Weeks 6–14 | ↓ | Adiponectin concentrations were lower in GDM in all BMI groups, although the difference was more pronounced in women with BMI < 35. |
| Guelfi, et al. (2017) [22] | Cohort | 123 (52 GDM and 71 controls) | Visit 1: week 14 Visit 2: week 28 (at the time of diagnosis) | ↓ ↓ | All participants had a history of GDM in previous pregnancy. |
| Abell, et al. (2017) [23] | Cohort | 103 (25 GDM and 78 controls) | Weeks 12–15 | ↓ | −Fasting glucose, GDM risk. High molecular weight adiponectin was measured. |
| Leptin | |||||
| Tagoma, et al. (2022) [12] | Cohort | 213 (60 GDM and 153 controls) | Weeks 23–28 | ↔ | In GDM women, overweight and obesity were associated with higher levels of leptin. |
| Al-Musharaf, et al. (2021) [13] | Cohort | 232 (99 GDM and 133 controls) | Visit 1: weeks 8–12 Visit 2: weeks 24–28 | ↔ ↔ | Visit 1: +Systolic blood pressure, midarm circumference, insulin −Body fat percentage |
| Saucedo, et al. (2020) [14] | Case-control | 65 GDM and 65 controls | At the end of pregnancy | ↔ | +Pre-pregnancy BMI considering both groups. |
| Francis, et al. (2020) [17] | Cohort | 321 (107 GDM and 214 controls) | Visit 1: weeks 10–14 Visit 2: weeks 15–26 Visit 3: weeks 23–31 Visit 4: weeks 33–39 | ↑ ↑ ↑ ↔ | Concentrations at visits 1 and 2: +GDM risk Concentrations at visit 1: +HOMA-IR, insulin, C-peptide, hsCRP at visit 2. |
| Sweeting, et al. (2018) [20] | Cohort | 980 (248 GDM and 732 controls) | Weeks 11–13 | ↓ | Concentrations are influenced by ethnicity. |
| Thagaard, et al. (2017) [21] | Cohort | 2590 (107 GDM and 2483 without GDM) classified as normal weight (18.5 ≤ BMI ≤ 24.9), moderately obese (30 ≤ BMI ≤ 34.9) and severely obese (BMI ≥ 35). | Weeks 6–14 | ↑ | Leptin concentrations were higher in GDM, but only in women with BMI ≥ 35. |
| Guelfi, et al. (2017) [22] | Cohort | 123 (52 GDM and 71 controls) | Visit 1: week 14 Visit 2: week 28 (at the time of diagnosis) | ↔ ↔ | All participants had a history of GDM in previous pregnancy. |
| Zhang, et al. (2017) [24] | Case-control | 50 GDM and 50 controls | ≥37 weeks | ↑ | Not reported |
| Resistin | |||||
| Tagoma, et al. (2022) [12] | Cohort | 213 (60 GDM and 153 controls) | Weeks 23–28 | ↔ | In GDM women, premature bith was associated with higher levels of resistin. |
| Al-Musharaf, et al. (2021) [13] | Cohort | 232 (99 GDM and 133 controls) | Visit 1: weeks 8–12 Visit 2: weeks 24–28 | ↔ ↔ | Visit 1: +Insulin −Body fat percentage |
| Saucedo, et al. (2020) [14] | Case-control | 65 GDM and 65 controls | At the end of pregnancy | ↔ | Not reported |
| Guelfi, et al. (2017) [22] | Cohort | 123 (52 GDM and 71 controls) | Visit 1: week 14 Visit 2: week 28 (at the time of diagnosis) | ↔ ↔ | All participants had a history of GDM in previous pregnancy. |
| TNF-α | |||||
| Peña-Cano, et al. (2021) [25] | Case-control | 116 GDM and 115 controls | At the end of pregnancy | ↔ | +BMI at the end of pregnancy considering both groups. |
| Al-Musharaf, et al. (2021) [13] | Cohort | 232 (99 GDM and 133 controls) | Visit 1: weeks 8–12 Visit 2: weeks 24–28 | ↔ ↔ | Visit 1: −Maternal age Logistic regression adjusted for age and BMI showed that TNF-α levels significantly predict the development of GDM. Significance is lost when other maternal variables are added to the adjustment. |
| Yin X, et al. (2020) [26] | Case-control | 49 GDM and 39 controls | At the end of pregnancy | ↑ | Not reported |
| Saucedo, et al. (2020) [14] | Case-control | 65 GDM and 65 controls | At the end of pregnancy | ↑ | +Newborn weight. With predictive value for large for gestational age newborn. +Pre-pregnancy BMI considering both groups. Difference was not maintained after adjustment for maternal age and weight. |
| Šimják, et al. (2018) [27] | Cohort | 24 (12 GDM and 12 controls) | Visit 1: 28–32 weeks Visit 2: 36–38 weeks Visit 3: 6–12 months after delivery | ↑ ↑ ↑ | Not reported |
| IL-6 | |||||
| Peña-Cano, et al. (2021) [25] | Case-control | 116 GDM and 115 controls | At the end of pregnancy | ↔ | +Gestational weight gain considering both groups. |
| Al-Musharaf, et al. (2021) [13] | Cohort | 232 (99 GDM and 133 controls) | Visit 1: weeks 8–12 Visit 2: weeks 24–28 | ↔ ↔ | −Cholesterol/HDL ratio |
| Abell, et al. (2017) [23] | Cohort | 103 (25 GDM and 78 controls) | Weeks 12–15 | ↔ | +BMI at the time of blood sampling +GDM risk |
| Šimják, et al. (2018) [27] | Cohort | 24 (12 GDM and 12 controls) | Visit 1: 28–32 weeks Visit 2: 36–38 weeks Visit 3: 6–12 months after delivery | ↔ ↔ ↔ | Not reported |
| IL-8 | |||||
| Šimják, et al. (2018) [27] | Cohort | 24 (12 GDM and 12 controls) | Visit 1: 28–32 weeks Visit 2: 36–38 weeks Visit 3: 6–12 months after delivery | ↔ ↔ ↔ | Not reported |
| IL-10 | |||||
| Šimják, et al. (2018) [27] | Cohort | 24 (12 GDM and 12 controls) | Visit 1: 28–32 weeks Visit 2: 36–38 weeks Visit 3: 6–12 months after delivery | ↑ ↔ ↔ | Not reported |
| IFN-γ | |||||
| Šimják, et al. (2018) [27] | Cohort | 24 (12 GDM and 12 controls) | Visit 1: 28–32 weeks Visit 2: 36–38 weeks Visit 3: 6–12 months after delivery | ↔ ↔ ↔ | Not reported |
| Adipsin | |||||
| Saucedo, et al. (2020) [14] | Case-control | 65 GDM and 65 controls | At the end of pregnancy | ↑ | +Pre-pregnancy BMI considering both groups. The difference was not maintained after adjustment for maternal age and weight. |
| NGAL | |||||
| Saucedo, et al. (2020) [14] | Case-control | 65 GDM and 65 controls | At the end of pregnancy | ↔ | Not reported |
| Yin, et al. (2020) [26] | Case-control | 49 GDM and 39 controls | At the end of pregnancy | ↑ | In all participants: + Fasting plasma glucose in the second and third trimester, fasting insulin, HOMA-IR, triglycerides and neonatal weight. |
| Sweeting, et al. (2018) [20] | Cohort | 980 (248 GDM and 732 controls) | Weeks 11–13 | ↑ | Multivariate regression analysis showed its value as a significant predictor of GDM. Concentrations are influenced by ethnicity. |
| NGF | |||||
| Saucedo, et al. (2020) [14] | Case-control | 65 GDM and 65 controls | At the end of pregnancy | ↔ | Not reported |
| MCP-1 | |||||
| Saucedo, et al. (2020) [14] | Case-control | 65 GDM and 65 controls | At the end of pregnancy | ↑ | +Newborn weight. +Pre-pregnancy BMI considering both groups. Difference was not maintained after adjustment for maternal age and weight. |
| Abell, et al. (2017) [23] | Cohort | 103 (25 GDM and 78 controls) | Weeks 12–15 | ↔ | Not reported |
| Omentin-1 | |||||
| Peña-Cano, et al. (2021) [25] | Case-control | 116 GDM and 115 controls | At the end of pregnancy | ↓ | −Pre-pregnancy BMI, BMI at the end of pregnancy and HOMA-IR considering both groups. +HDL considering both groups. The difference was not maintained after adjustment for maternal age, gestational age and BMI. |
| Francis, et al. (2020) [17] | Cohort | 321 (107 GDM and 214 controls) | Visit 1: weeks 10–14 Visit 2: weeks 15–26 Visit 3: weeks 23–31 Visit 4: weeks 33–39 | ↔ ↔ ↔ ↔ | Concentrations at visit 1: −HOMA-IR, insulin, C-peptide and triglycerides at visit 2. |
| Mierzyński, et al. (2018) [19] | Case-control | 105 GDM and 55 controls | Weeks 24–28 | ↓ | In all participants: +Adiponectin. −BMI prior to pregnancy, at the time of blood sampling and at the end of pregnancy. −Risk of preterm birth |
| Abell, et al. (2017) [23] | Cohort | 103 (25 GDM and 78 controls) | Weeks 12–15 | ↓ | −GDM risk |
| FABP4 | |||||
| Francis, et al. (2020) [17] | Cohort | 321 (107 GDM and 214 controls) | Visit 1: weeks 10–14 Visit 2: weeks 15–26 Visit 3: weeks 23–31 Visit 4: weeks 33–39 | ↑ ↑ ↑ ↑ | Concentrations at visits 1 and 2: +GDM risk Concentrations at visit 1: +Glucose, insulin, C-peptide and hsCRP at visit 2. −HDL-cholesterol at visit 2 |
| Guelfi, et al. (2017) [22] | Cohort | 123 (52 GDM and 71 controls) | Visit 1: week 14 Visit 2: week 28 (at the time of diagnosis) | ↔ ↔ | All participants had a history of GDM in previous pregnancy. |
| Chemerin | |||||
| Francis, et al. (2020) [17] | Cohort | 321 (107 GDM and 214 controls) | Visit 1: weeks 10–14 Visit 2: weeks 15–26 Visit 3: weeks 23–31 Visit 4: weeks 33–39 | ↑ ↑ ↑ ↑ | Concentrations at visits 1 and 2: +GDM risk. Concentrations at visit 1: +hsCRP, triglycerides at visit 2. |
| Guelfi, et al. (2017) [22] | Cohort | 123 (52 GDM and 71 controls) | Visit 1: week 14 Visit 2: week 28 (at the time of diagnosis) | ↔ ↔ | All participants had a history of GDM in previous pregnancy. |
| Yang, et al. (2017) [28] | Cohort | 163 (19 GDM and 144 controls) | Visit 1: weeks 8–12 Visit 2: at around week 31 | ↓ ↑ | A positive association between the risk of GDM and first trimester chemerin levels is reported; however, it does not make sense, as the association should be negative. |
| sOB-R | |||||
| Francis, et al. (2020) [17] | Cohort | 321 (107 GDM and 214 controls) | Visit 1: weeks 10–14 Visit 2: weeks 15–26 Visit 3: weeks 23–31 Visit 4: weeks 33–39 | ↓ ↓ ↓ ↓ | Concentrations at visits 1 and 2: −GDM risk. Concentrations at visit 1: −HOMA-IR, glucose, insulin, C-peptide and hsCRP at visit 2. +HDLD at visit 2. |
| Vaspin | |||||
| Francis, et al. (2020) [17] | Cohort | 321 (107 GDM and 214 controls) | Visit 1: weeks 10–14 Visit 2: weeks 15–26 Visit 3: weeks 23–31 Visit 4: weeks 33–39 | ↔ ↔ ↔ ↓ | No relevant correlations. |
| Mierzyński, et al. (2019) [29] | Case-control | 153 GDM and 84 controls | Weeks 24–28 | ↓ | In all participants: −Nesfatin-1 levels, BMI prior to pregnancy, BMI at sampling, fasting blood glucose, 1 h and 2 h post-OGTT glucose levels. |
| RBP-4 | |||||
| Francis, et al. (2020) [17] | Cohort | 321 (107 GDM and 214 controls) | Visit 1: weeks 10–14 Visit 2: weeks 15–26 Visit 3: weeks 23–31 Visit 4: weeks 33–39 | Data not shown | Concentrations at visit 1: +LDL-cholesterol and triglycerides at visit 2. The authors did not report RBP-4 concentrations for each visit. |
| Visfatin | |||||
| Abell, et al. (2017) [23] | Cohort | 103 (25 GDM and 78 controls) | Weeks 12–15 | ↔ | Not reported |
| PAI-1 | |||||
| Tagoma, et al. (2022) [12] | Cohort | 213 (60 GDM and 153 controls) | Weeks 23–28 | ↔ | No relevant correlations. |
| ANGPTL8 | |||||
| Seyhanli, et al. (2021) [30] | Case-control | 45 GDM and 45 controls | Weeks 18–39 | ↑ | +Fasting plasma glucose, fasting plasma insulin, 1 h and 2 h post-load plasma glucose, HOMA-IR, and triglycerides. |
| Abdeltawab, et al. (2021) [31] | Case-control | 109 GDM and 103 controls | Weeks 24–28 | ↑ | +Fasting blood glucose, glycated hemoglobin, LDL-cholesterol, total cholesterol, triglycerides, 1 h and 2 h postprandial blood glucose levels. Multivariate logistic regression showed its value as a significant predictor of GDM. |
| Gülcü Bulmuş, et al. (2020) [32] | Case-control | 30 GDM and 30 controls | Weeks 24–28 | ↑ | +Insulin, C-peptide, and HOMA-IR. |
| Huang, et al. (2018) [33] | Cohort | 474 (88 GDM and 386 controls) | Weeks 12–16 | ↑ | Using multivariable logistic regression, ANGPTL8 levels were related to risk of GDM. |
| Nesfatin-1 | |||||
| Çaltekin, and Caniklioğlu (2021) [34] | Case-control | 44 GDM and 40 controls | Weeks 24–28 | ↓ | No significant correlations. |
| Mierzyński, et al. (2019) [29] | Case-control | 153 GDM and 84 controls | Weeks 24–28 | ↓ | In all participants: +BMI prior to pregnancy, BMI at sampling, fasting blood glucose, 1 h and 2 h post-OGTT glucose levels. |
| Ademoglu, et al. (2017) [35] | Case-control | 40 GDM and 30 controls | Weeks 24–28 | ↓ | +Gestational age |
| Zhang, et al. (2017) [24] | Case-control | 50 GDM and 50 controls | ≥37 weeks | ↑ | +BMI prior to pregnancy, BMI before delivery, fasting insulin, HOMA-IR and triglycerides. Serum nesfatin-1 was the only independent riskfactor for GDM after adjusting for the BMI before delivery and fasting insulin. |
| DLK1 | |||||
| Çaltekin, and Caniklioğlu (2021) [34] | Case-control | 44 GDM and 40 controls | Weeks 24–28 | ↓ | +Fasting insulin and HOMA-IR. |
| Fetuin A | |||||
| Jin, et al. (2020) [36] | Nested case-control | 135 GDM and 135 controls | Visit 1: 7–13 weeks Visit 2: 25–28 weeks | ↑ ↑ | The change in fertuin A levels from the first to the second trimester was first found to be associated with the changes in insulin sensitivity and β-cell function, and associated with an increased risk of the development of GDM. |
| Šimják, et al. (2018) [27] | Cohort | 24 (12 GDM and 12 controls) | Visit 1: 28–32 weeks Visit 2: 36–38 weeks Visit 3: 6–12 months after delivery | ↔ ↔ ↔ | +Uric acid, and CRP. −Creatinine, total bilirubin. |
| Fetuin B | |||||
| Šimják, et al. (2018) [27] | Cohort | 24 (12 GDM and 12 controls) | Visit 1: 28–32 weeks Visit 2: 36–38 weeks Visit 3: 6–12 months after delivery | ↔ ↔ ↔ | +Triglycerides, and CRP. −Total bilirubin. |
| AFABP | |||||
| Zhang, et al. (2017) [24] | Case-control | 50 GDM and 50 controls | ≥37 weeks | ↑ | Not reported |
| Authors (Year) | n | Sample and Measurement Type | Adipokine Expression in GDM | Secondary Findings and Comments |
|---|---|---|---|---|
| Adiponectin | ||||
| Dong, et al. (2018) [79] | 10 GDM and 27 controls (3 subgroups: 10 obese, 8 overweight and 9 normal weight) | VAT for protein levels | ↓ | Adiponectin expression was lower in women with GDM than in all subgroups of controls. |
| Ott, et al. (2018) [80] | 25 GDM and 30 controls | VAT for mRNA levels | ↓ | +Maternal circulating levels of adiponectin −Glucose concentrations at the time of OGTT and at the end of pregnancy. |
| Telejko, et al. (2010) [81] | 20 GDM and 16 controls | VAT for mRNA levels | ↓ | Not reported |
| Telejko, et al. (2010) [81] | 20 GDM and 16 controls | SAT for mRNA levels | ↔ | Not reported |
| Ott, et al. (2018) [80] | 25 GDM and 30 controls | SAT for mRNA levels | ↓ | +Maternal circulating levels of adiponectin |
| Leptin | ||||
| Lappas, et al. (2014) [82] | 18 GDM and 28 controls | VAT for mRNA levels | ↔ | Within the controls, a higher expression of leptin was observed in obese compared to non-obese women |
| Dong, et al. (2018) [79] | 10 GDM and 27 controls (3 subgroups: 10 obese, 8 overweight and 9 normal weight) | VAT for protein levels | ↑ | No relevant secondary finding |
| Omentin-1 | ||||
| Peña-Cano, et al. (2022) [25] | 50 GDM and 50 controls | VAT for mRNA levels | ↔ | No relevant secondary finding |
| Barker, et al. (2012) [83] | 22 GDM and 22 controls | VAT for mRNA and protein levels | ↔ | In controls, a negative effect of obesity on mRNA and protein levels of omentin-1 was observed. mRNA and protein levels of omentin-1 were measured. |
| Resistin | ||||
| Dong, et al. (2018) [79] | 10 GDM and 27 controls (3 subgroups: 10 obese, 8 overweight and 9 normal weight women) | VAT for protein levels | ↑ | No relevant secondary finding |
| IL-1β | ||||
| Peña-Cano, et al. (2022) [25] | 50 GDM and 50 controls | VAT for mRNA levels | ↓ | No relevant secondary finding |
| Lappas, et al. (2014) [82] | 18 GDM and 28 controls | VAT for mRNA levels | ↔ | Within the controls, higher expression of IL1-β was observed in obese compared to non-obese women |
| IL-6 | ||||
| Peña-Cano, et al. (2022) [25] | 50 GDM and 50 controls | VAT for mRNA levels | ↓ | No relevant secondary finding |
| IL-1RA | ||||
| Peña-Cano, et al. (2022) [25] | 50 GDM and 50 controls | VAT for mRNA levels | ↓ | No relevant secondary finding |
| IL-10 | ||||
| Peña-Cano, et al. (2022) [25] | 50 GDM and 50 controls | VAT for mRNA levels | ↓ | After controlling the analysis for gestational age, pre-gestational BMI, and BMI at the end of pregnancy, only IL-10 expression remained significantly lower in women with GDM |
| TNF-α | ||||
| Peña-Cano, et al. (2022) [25] | 50 GDM and 50 controls | VAT for mRNA levels | ↔ | No relevant secondary finding |
| Rancourt, et al. (2020) [84] | 19 GDM and 22 controls | VAT for mRNA levels | ↑ | +Maternal circulating levels of TNF-α. |
| Rancourt, et al. (2020) [84] | 19 GDM and 22 controls | SAT for mRNA levels | ↔ | No relevant secondary finding |
| Dong, et al. (2018) [79] | 10 GDM and 27 controls (3 subgroups: 10 obese, 8 overweight and 9 normal weight women) | VAT for mRNA and protein levels | ↑ | |
| Lappas, et al. (2014) [82] | 18 GDM and 28 controls | VAT for mRNA levels | ↔ | No relevant secondary finding |
| SOCS3 | ||||
| Rancourt, et al. (2020) [84] | 19 GDM and 22 controls | VAT for mRNA levels | ↑ | No relevant secondary finding |
| Rancourt, et al. (2020) [84] | 19 GDM and 22 controls | SAT for mRNA levels | ↔ | No relevant secondary finding |
| Visfatin | ||||
| Ma, et al. (2010) [85] | 20 GDM and 22 controls | SAT for mRNA and protein levels | ↔ | No relevant secondary finding |
| Ma, et al. (2010) [85] | 20 GDM and 22 controls | VAT for mRNA and protein levels | ↔ | No relevant secondary finding |
| Apelin | ||||
| Telejko, et al. (2010) [81] | 20 GDM and 16 controls | SAT for mRNA levels | ↔ | No relevant secondary finding |
| Telejko, et al. (2010) [81] | 20 GDM and 16 controls | VAT for mRNA levels | ↔ | No relevant secondary finding |
| ADM | ||||
| Dong, et al. (2018) [79] | 10 GDM and 27 controls (3 subgroups: 10 obese, 8 overweight and 9 normal weight women) | VAT for mRNA levels | ↑ | The gene expression in VAT of ADM receptor components (CRLR, RAMP2, and RAMP3) was higher in GDM than controls. |
| Nesfatin-1 | ||||
| Zhang, et al. (2017) [24] | 50 GDM and 50 controls | SAT for protein levels | ↑ | No relevant secondary finding |
| Authors (Year) | n | Sample and Measurement Type | Adipokine Level in GDM | Secondary Findings and Comments |
|---|---|---|---|---|
| TNF-α | ||||
| Yin, et al. (2020) [26] | 49 GDM and 39 controls | Placental tissue for mRNA and protein levels | ↑ | In GDM, increased expression of TNF-α was observed in the placenta compared to the umbilical cord tissue, which was not observed in the control group. |
| Yin, et al. (2020) [26] | 49 GDM and 39 controls | Umbilical cord tissue for mRNA and protein levels | ↑ | No relevant secondary finding |
| Yin, et al. (2020) [26] | 49 GDM and 39 controls | Cord blood for circulating levels | ↓ | No relevant secondary finding |
| Leptin | ||||
| Shang, et al. (2018) [100] | 105 GDM and 103 controls | Placental tissue for protein levels | ↑ | A mathematical model including placental levels of leptin, adiponectin and resistin was shown to correlate positively with maternal HOMA-IR. |
| Manoharan, et al. (2019) [101] | 40 GDM and 40 controls | Cord blood for circulating levels | ↑ | +Ponderal index, Newborn leptin/adiponectin ratio correlated positively with newborn HOMA-IR levels and negatively with HOMA-S |
| Ortega-Senovilla, et al. (2011) [102] | 98 GDM and 86 controls | Cord blood for circulating levels | ↔ | No relevant secondary finding |
| Tan, et al. (2021) [103] | 95 GDM and 470 controls | Cord blood for circulating levels | ↑ | Not reported |
| Shang, et al. (2018) [100] | 105 GDM and 103 controls | Cord blood for circulating levels | ↑ | A mathematical model including umbilical cord concentrations of leptin, adiponectin and resistin was shown to correlate positively with newborn birthweight. |
| Apelin | ||||
| Telejko, et al. (2010) [81] | 20 GDM and 16 controls | Placental tissue for mRNA levels | ↔ | No relevant secondary finding |
| Aslan, et al. (2011) [104] | 30 GDM and 30 controls | Cord blood for circulating levels | ↔ | No relevant secondary finding |
| NGAL | ||||
| Yin, et al. (2020) [26] | 49 GDM and 39 controls | Placental tissue for mRNA and protein levels | ↑ | +Maternal NGAL concentrations in all of the subjects included in the study. In GDM, increased expression of NGAL was observed in the placenta compared to the umbilical cord tissue, which was not observed in the control group. |
| Yin, et al. (2020) [26] | 49 GDM and 39 controls | Umbilical cord tissue for mRNA and protein levels | ↑ | No relevant secondary finding |
| Yin, et al. (2020) [26] | 49 GDM and 39 controls | Cord blood for circulating levels | ↑ | +Maternal NGAL concentrations in all of the subjects included in the study. |
| Adiponectin | ||||
| Shang, et al. (2018) [100] | 105 GDM and 103 controls | Placental tissue for protein levels | ↓ | A mathematical model including placental levels of leptin, adiponectin and resistin was shown to correlate positively with maternal HOMA-IR. |
| Telejko, et al. (2010) [81] | 20 GDM and 16 controls | Placental tissue for mRNA levels | No detectable | Not reported |
| Manoharan, et al. (2019) [101] | 40 GDM and 40 controls | Cord blood for circulating levels | ↓ | Newborn leptin/adiponectin ratio correlated positively with newborn HOMA-IR levels and negatively with HOMA-S |
| Shang, et al. (2018) [100] | 105 GDM and 103 controls | Cord blood for circulating levels | ↓ | A mathematical model including umbilical cord concentrations of leptin, adiponectin and resistin was shown to correlate positively with newborn birthweight. |
| Ortega-Senovilla, et al. (2011) [102] | 98 GDM and 86 controls | Cord blood for circulating levels | ↓ | No relevant secondary finding |
| Tan, et al. (2021) [103] | 95 GDM and 470 controls | Cord blood for circulating levels | ↓ | Not reported |
| Resistin | ||||
| Yu, et al. (2020) [105] | 15 GDM and 15 controls | Placental blood for circulating levels | ↑ | Not reported |
| Shang, et al. (2018) [100] | 105 GDM and 103 controls | Placental tissue for protein levels | ↑ | A mathematical model including placental levels of leptin, adiponectin and resistin was shown to correlate positively with maternal HOMA-IR. |
| Manoharan, et al. (2019) [101] | 40 GDM and 40 controls | Cord blood for circulating levels | ↔ | Not reported |
| Shang, et al. (2018) [100] | 105 GDM and 103 controls | Cord blood for circulating levels | ↑ | A mathematical model including umbilical cord concentrations of leptin, adiponectin and resistin was shown to correlate positively with newborn birthweight. |
| Visfatin | ||||
| Ma, et al. (2010) [85] | 20 GDM and 22 controls | Placental tissue for mRNA and protein levels | ↑ | +Maternal serum visfatin levels |
| Manoharan, et al. (2019) [101] | 40 GDM and 40 controls | Cord blood for circulating levels | ↑ | −Total cholesterol, LDL-cholesterol and triglycerides in GDM newborns. |
| Omentin-1 | ||||
| Barker, et al. (2012) [83] | 22 GDM and 22 controls | Placental tissue for mRNA and protein levels | ↔ | In controls, a negative effect of obesity on mRNA and protein levels of omentin-1 in placental tissue was observed. |
| Fetuin A | ||||
| Šimják, et al. (2018) [106] | 12 GDM and 12 controls | Placental tissue for mRNA levels | ↔ | No relevant secondary finding |
| Šimják, et al. (2018) [106] | 12 GDM and 12 controls | Cord blood for circulating levels | ↓ | No relevant secondary finding |
| RBP-4 | ||||
| Ortega-Senovilla, et al. (2011) [102] | 98 GDM and 86 controls | Cord blood for circulating levels | ↑ | No relevant secondary finding |
| Nesfatin-1 | ||||
| Zhang, et al. (2017) [24] | 50 GDM and 50 controls | Cord blood for circulating levels | ↑ | No relevant secondary finding |
| Aslan, et al. (2011) [104] | 30 GDM and 30 controls | Cord blood for circulating levels | ↔ | No relevant secondary finding |
| AFABP | ||||
| Ortega-Senovilla, et al. (2011) [102] | 98 GDM and 86 controls | Cord blood for circulating levels | ↓ | +Prepregnancy BMI and maternal leptin levels in all of the subjects included in the study |
| Vaspin | ||||
| Huo, et al. (2015) [107] | 30 GDM and 27 controls | Placental tissue for mRNA and protein levels | ↔ | −Neonatal birth weight |
| Irisin | ||||
| Yuksel, et al. (2014) [108] | 20 GDM and 20 controls | Cord blood for circulating levels | ↔ | No relevant secondary finding |
Publisher’s Note: MDPI stays neutral with regard to jurisdictional claims in published maps and institutional affiliations. |
© 2022 by the authors. Licensee MDPI, Basel, Switzerland. This article is an open access article distributed under the terms and conditions of the Creative Commons Attribution (CC BY) license (https://creativecommons.org/licenses/by/4.0/).
Share and Cite
Valencia-Ortega, J.; González-Reynoso, R.; Ramos-Martínez, E.G.; Ferreira-Hermosillo, A.; Peña-Cano, M.I.; Morales-Ávila, E.; Saucedo, R. New Insights into Adipokines in Gestational Diabetes Mellitus. Int. J. Mol. Sci. 2022, 23, 6279. https://0-doi-org.brum.beds.ac.uk/10.3390/ijms23116279
Valencia-Ortega J, González-Reynoso R, Ramos-Martínez EG, Ferreira-Hermosillo A, Peña-Cano MI, Morales-Ávila E, Saucedo R. New Insights into Adipokines in Gestational Diabetes Mellitus. International Journal of Molecular Sciences. 2022; 23(11):6279. https://0-doi-org.brum.beds.ac.uk/10.3390/ijms23116279
Chicago/Turabian StyleValencia-Ortega, Jorge, Rebeca González-Reynoso, Edgar G. Ramos-Martínez, Aldo Ferreira-Hermosillo, María I. Peña-Cano, Enrique Morales-Ávila, and Renata Saucedo. 2022. "New Insights into Adipokines in Gestational Diabetes Mellitus" International Journal of Molecular Sciences 23, no. 11: 6279. https://0-doi-org.brum.beds.ac.uk/10.3390/ijms23116279