
Chronically Radiation-Exposed Survivor Glioblastoma Cells Display Poor Response to Chk1 Inhibition under Hypoxia

 , , , and
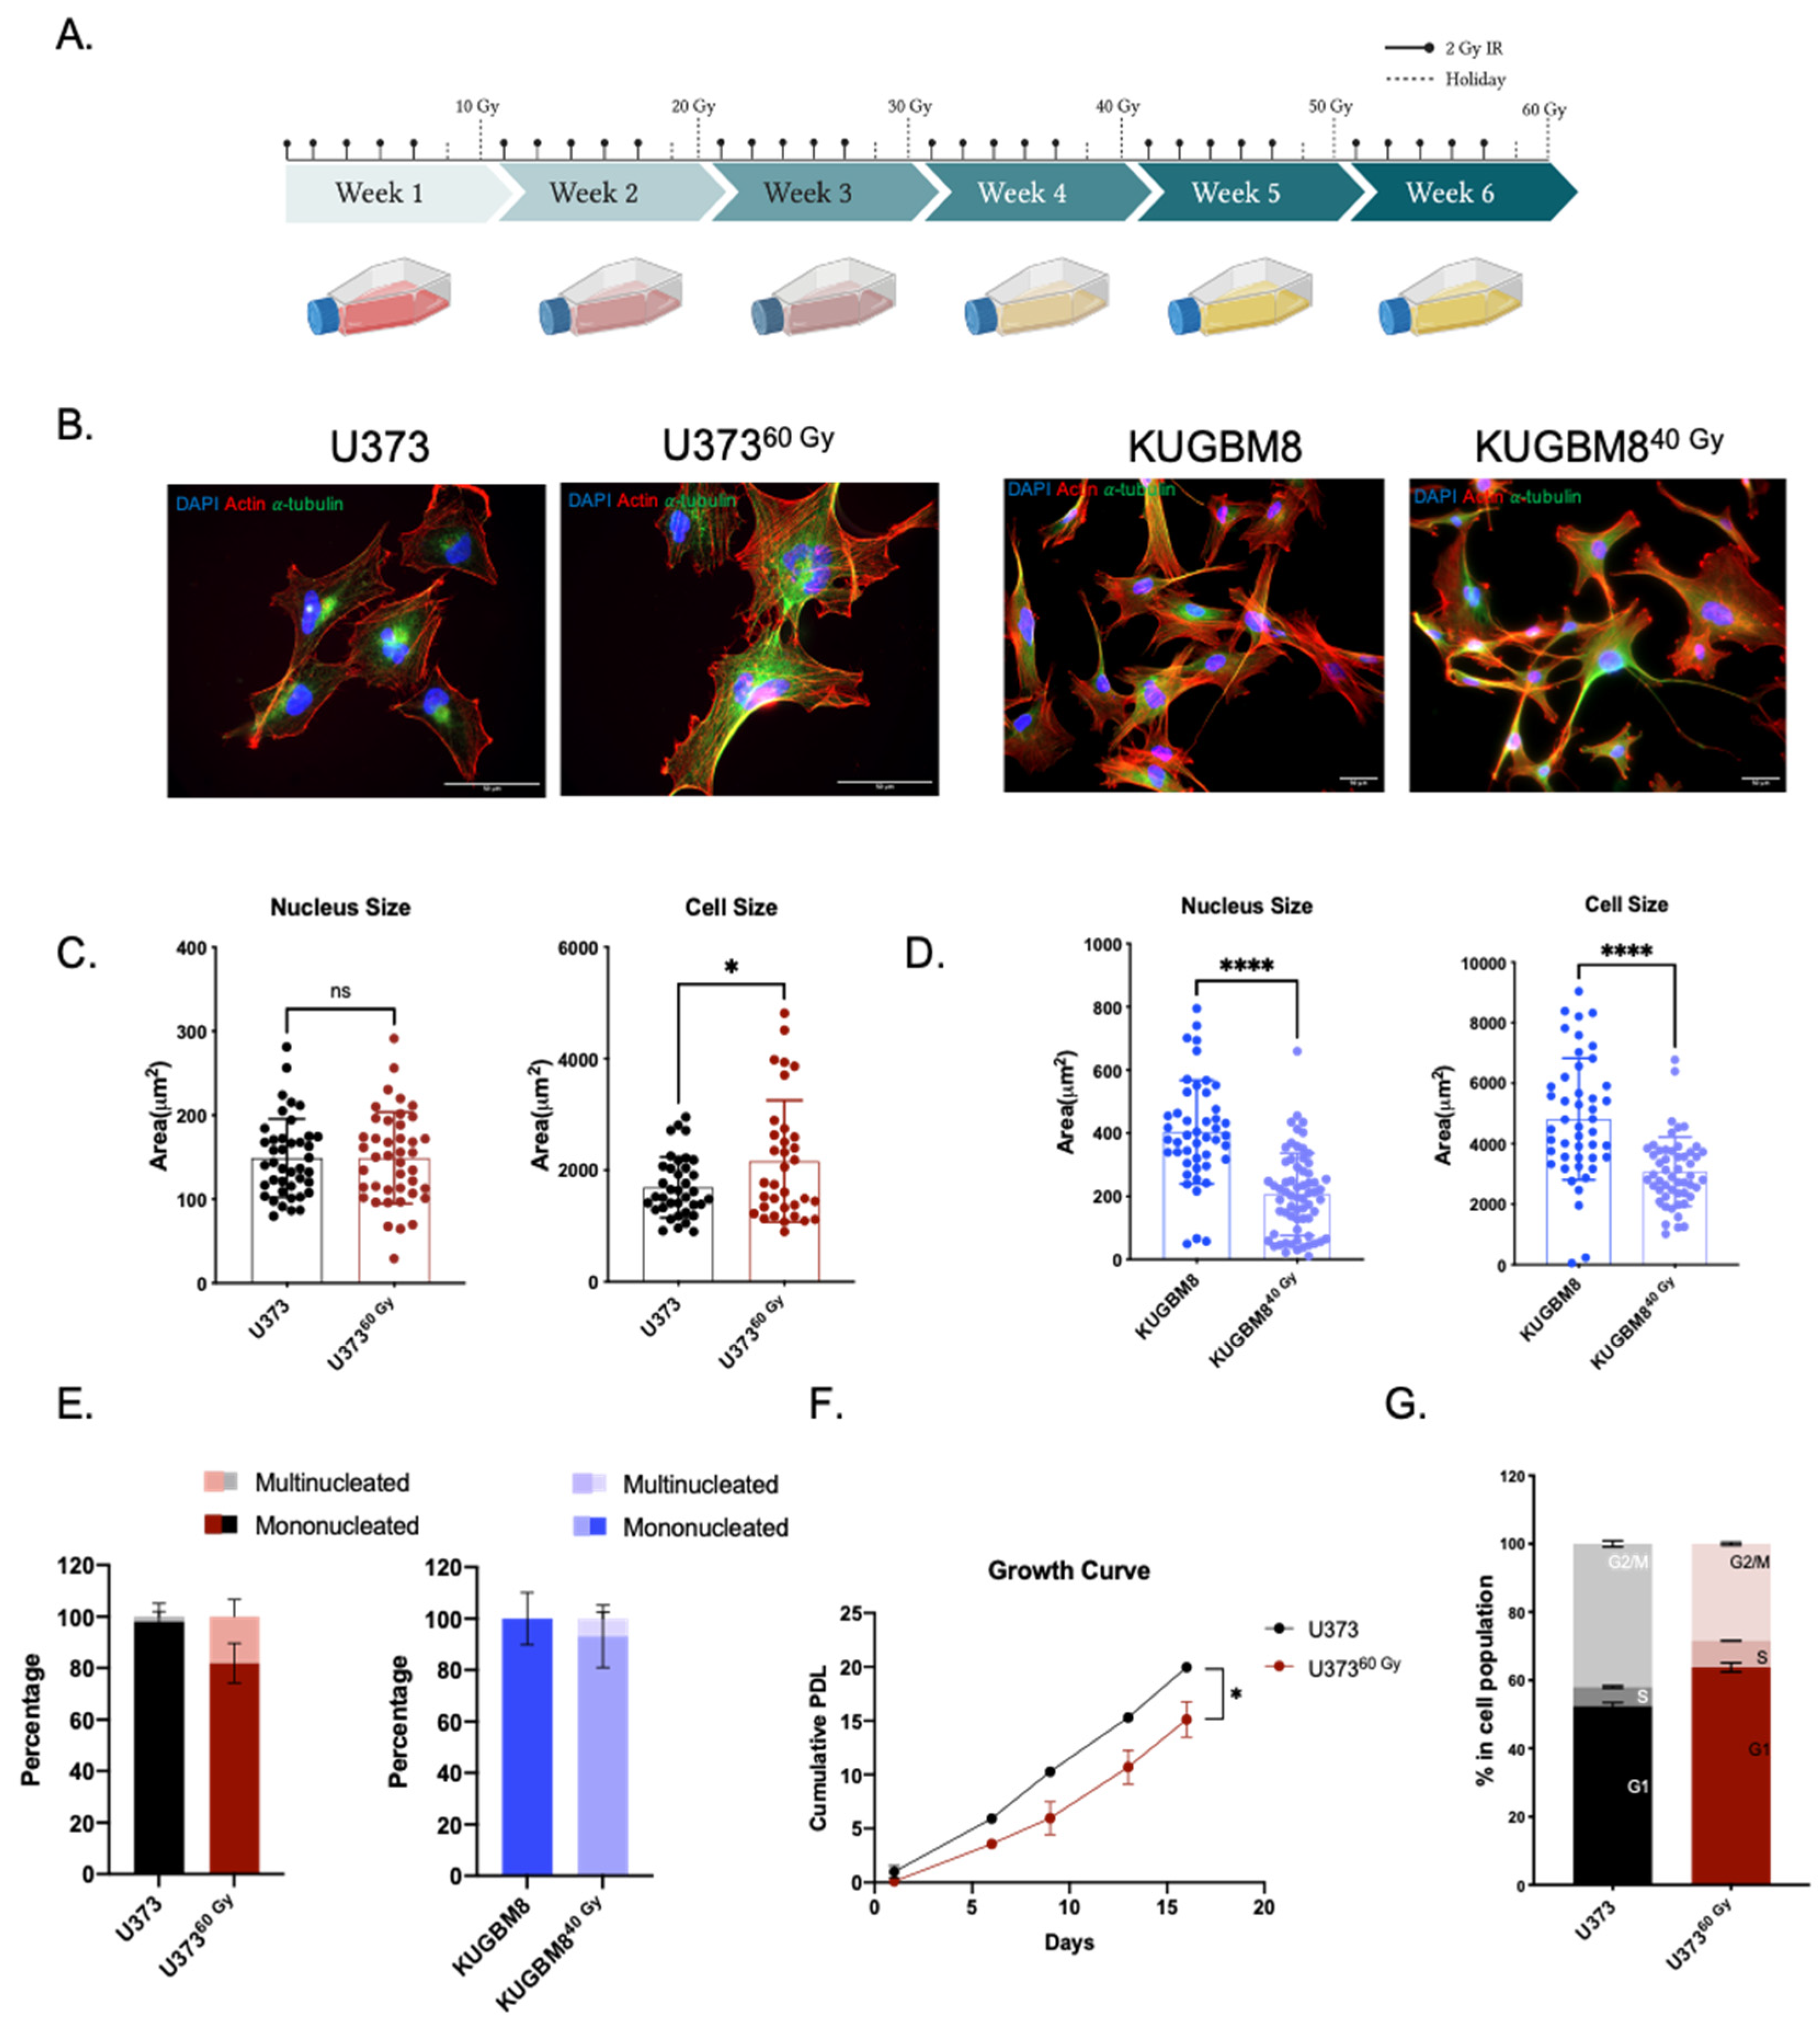
Abstract
:1. Introduction
2. Results
2.1. Generation of Radiation Survivor (IR-Surv) Glioblastoma Cell Populations
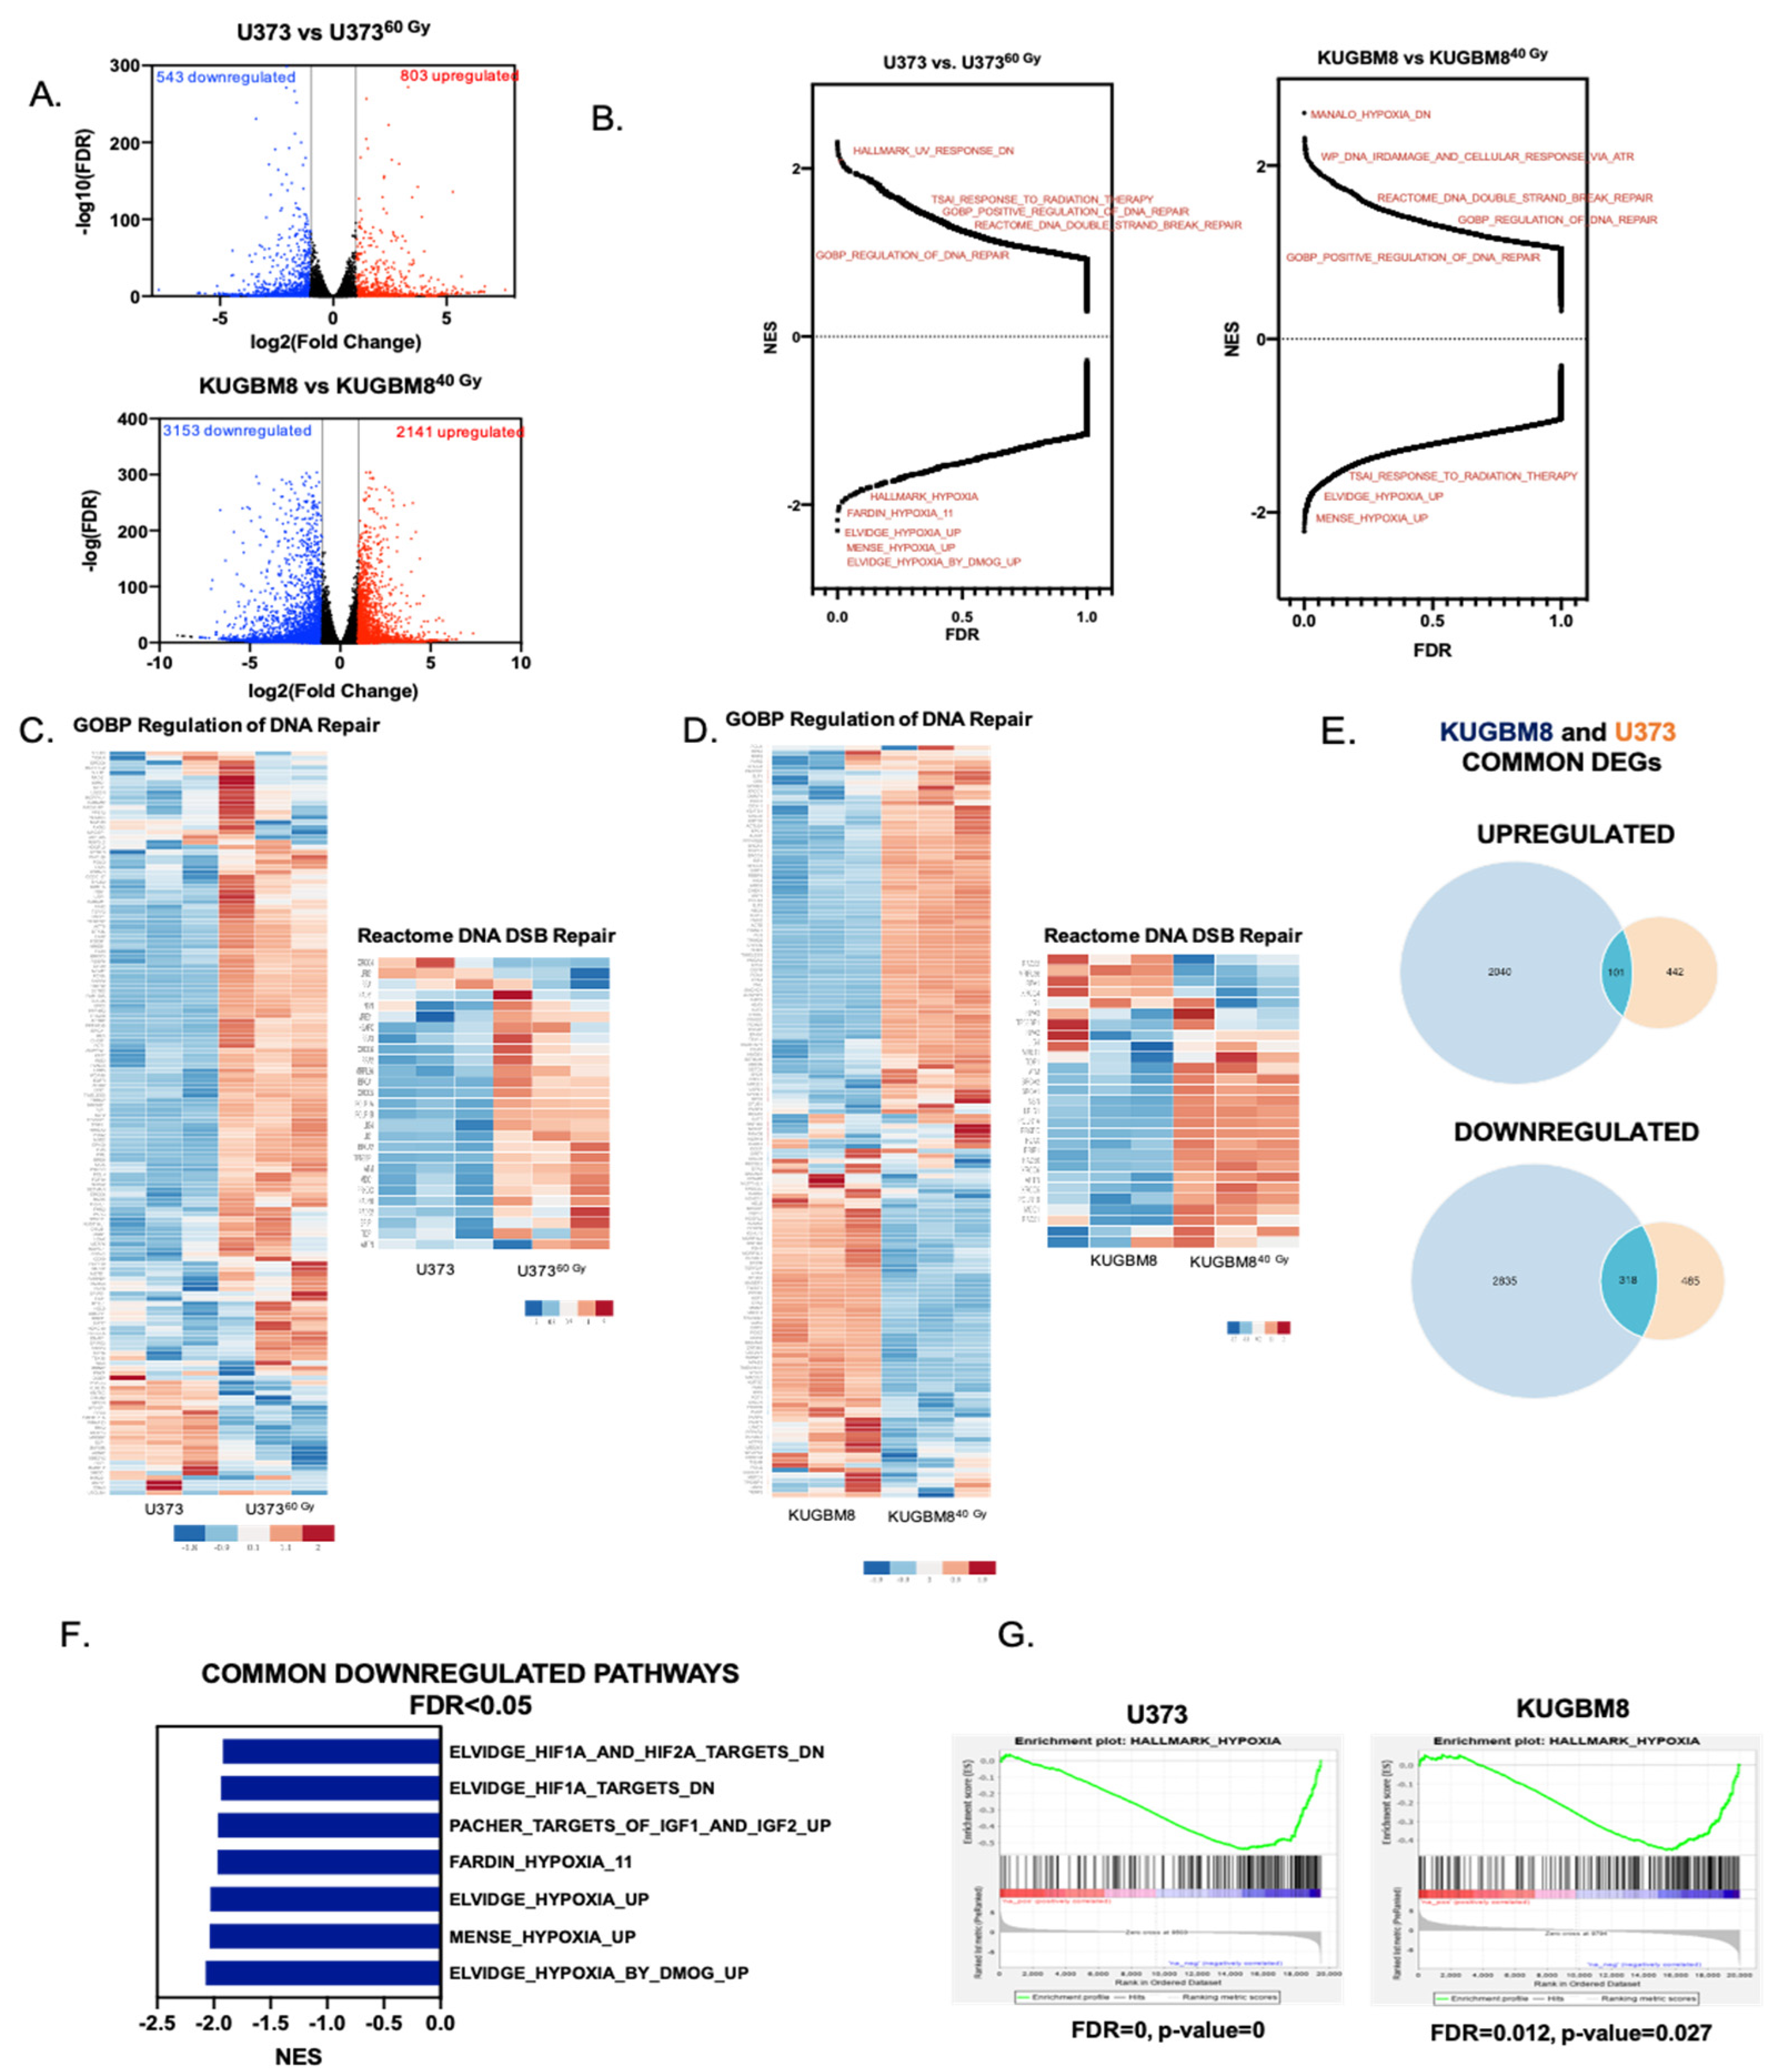
2.2. Transcriptomics Analyses Reveal Changes in DNA Damage Response and Hypoxia Pathways in IR-Surv Cells
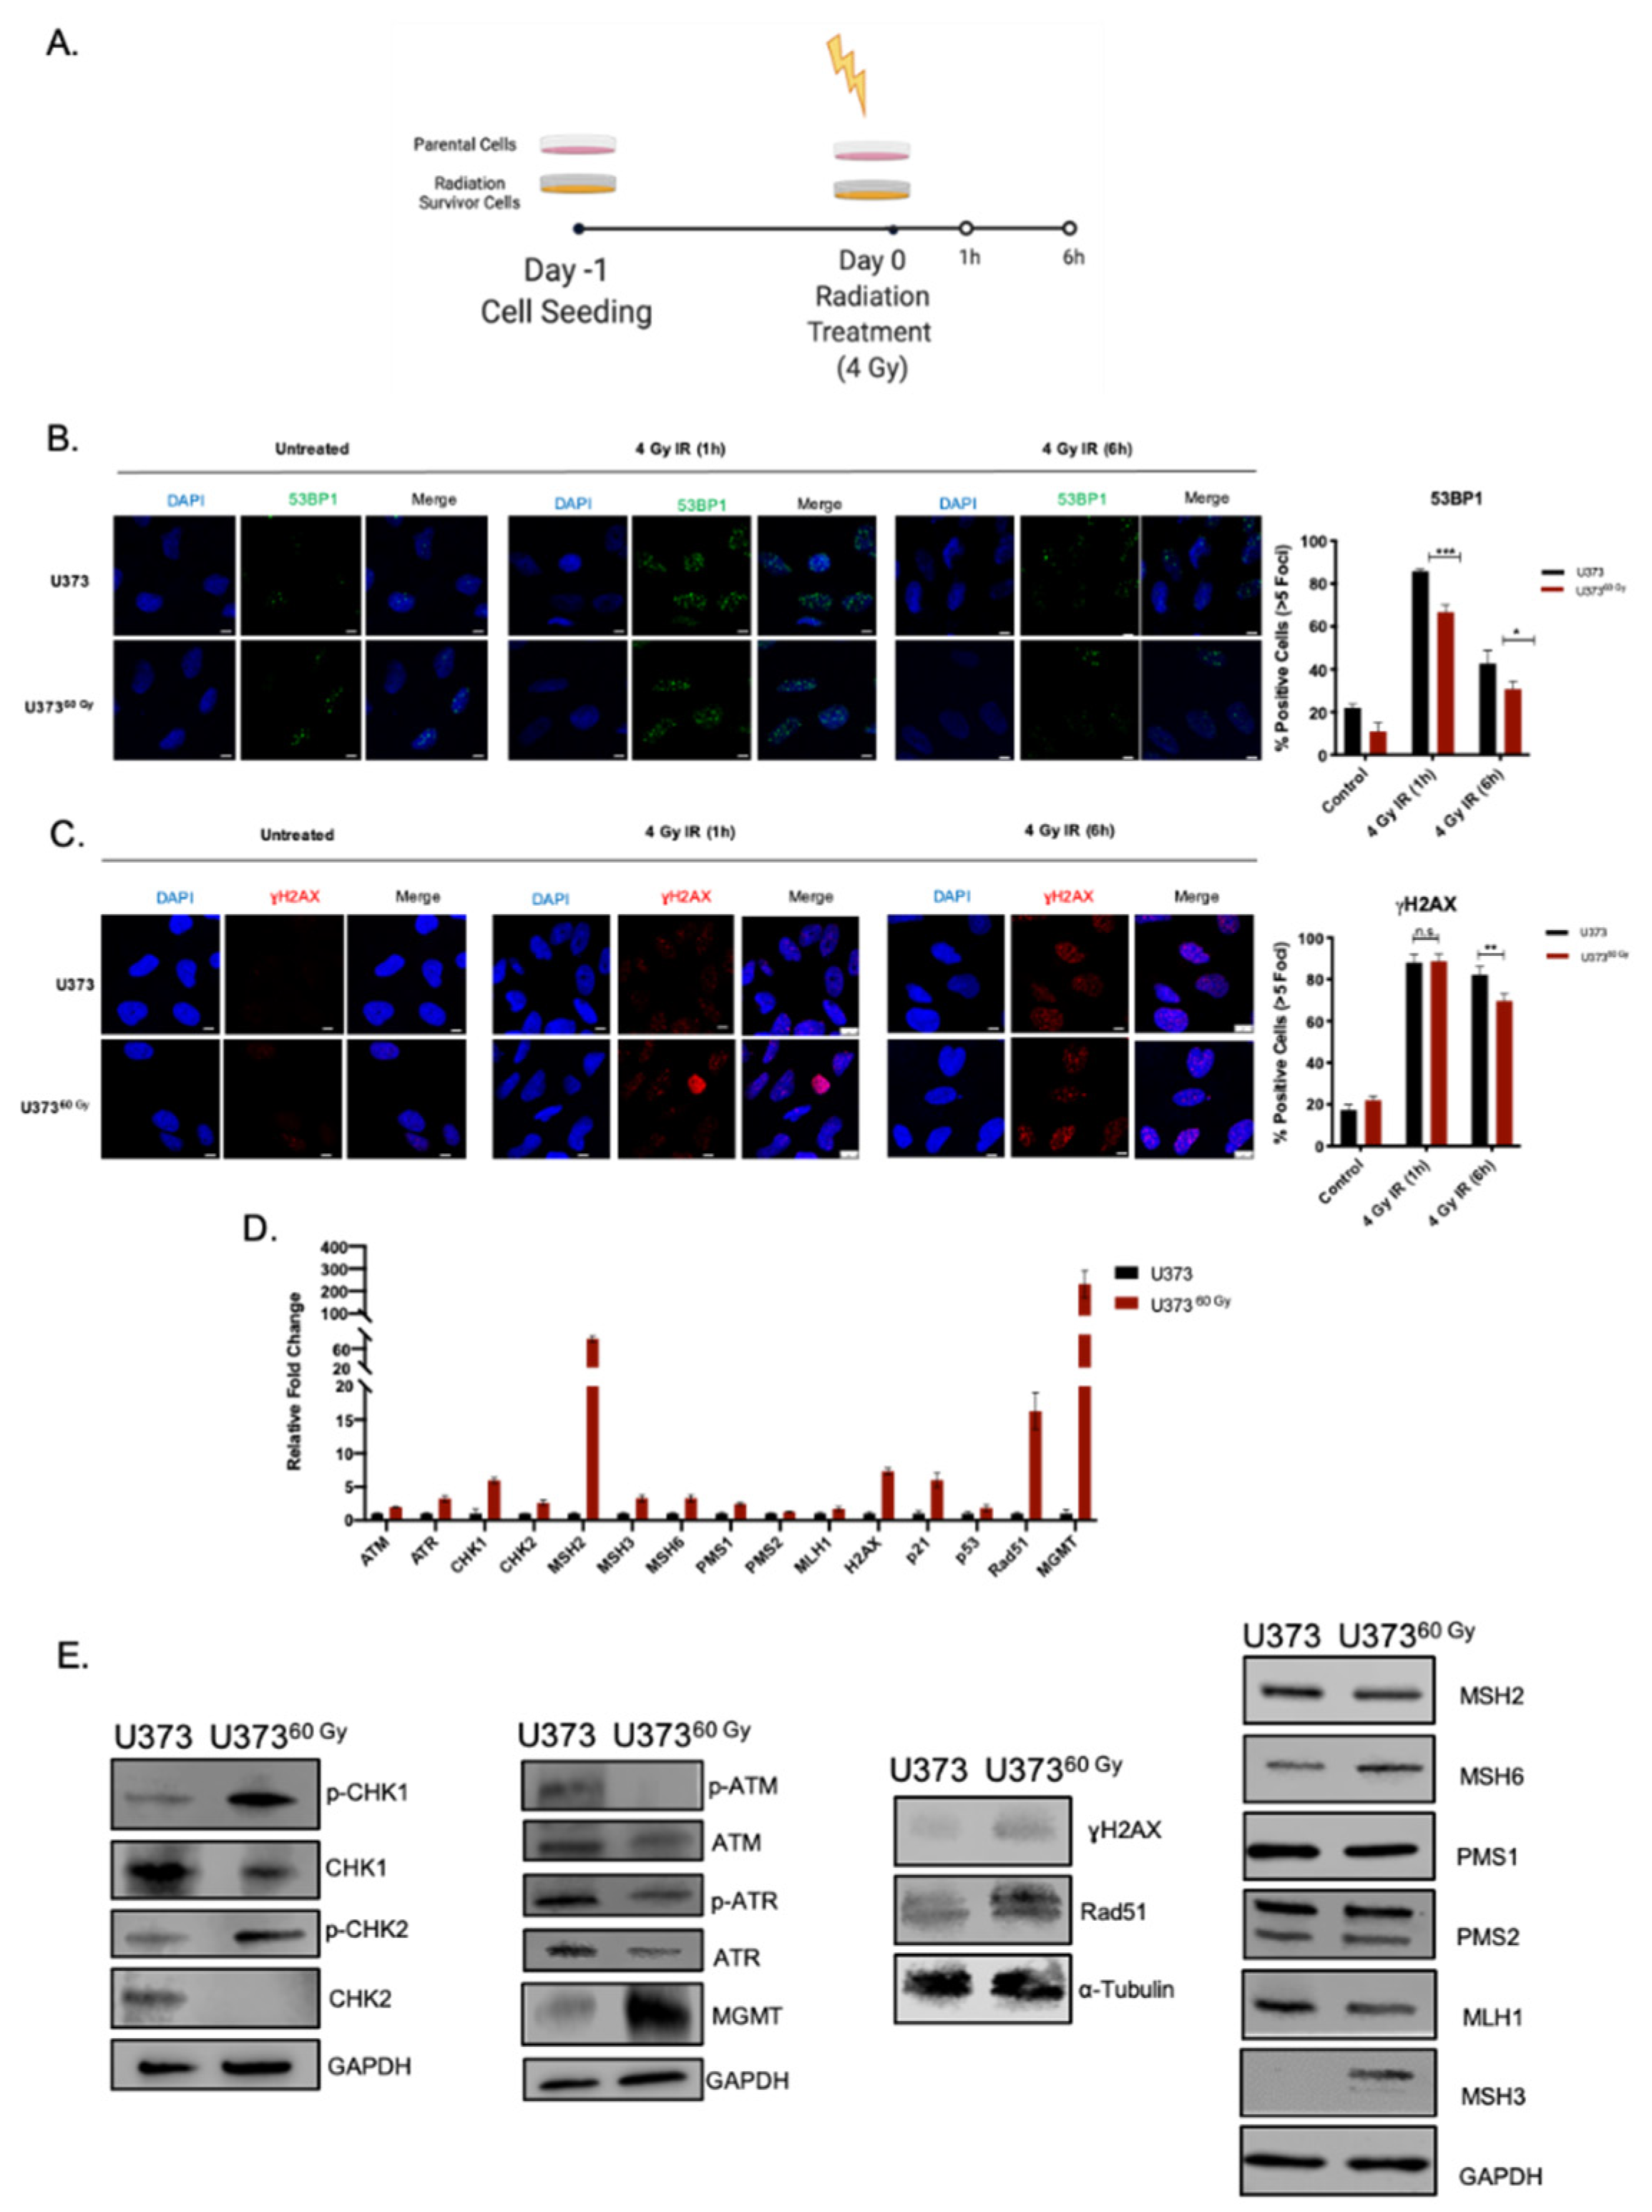
2.3. IR-Surv Cells Have Higher DNA Repair Capacity
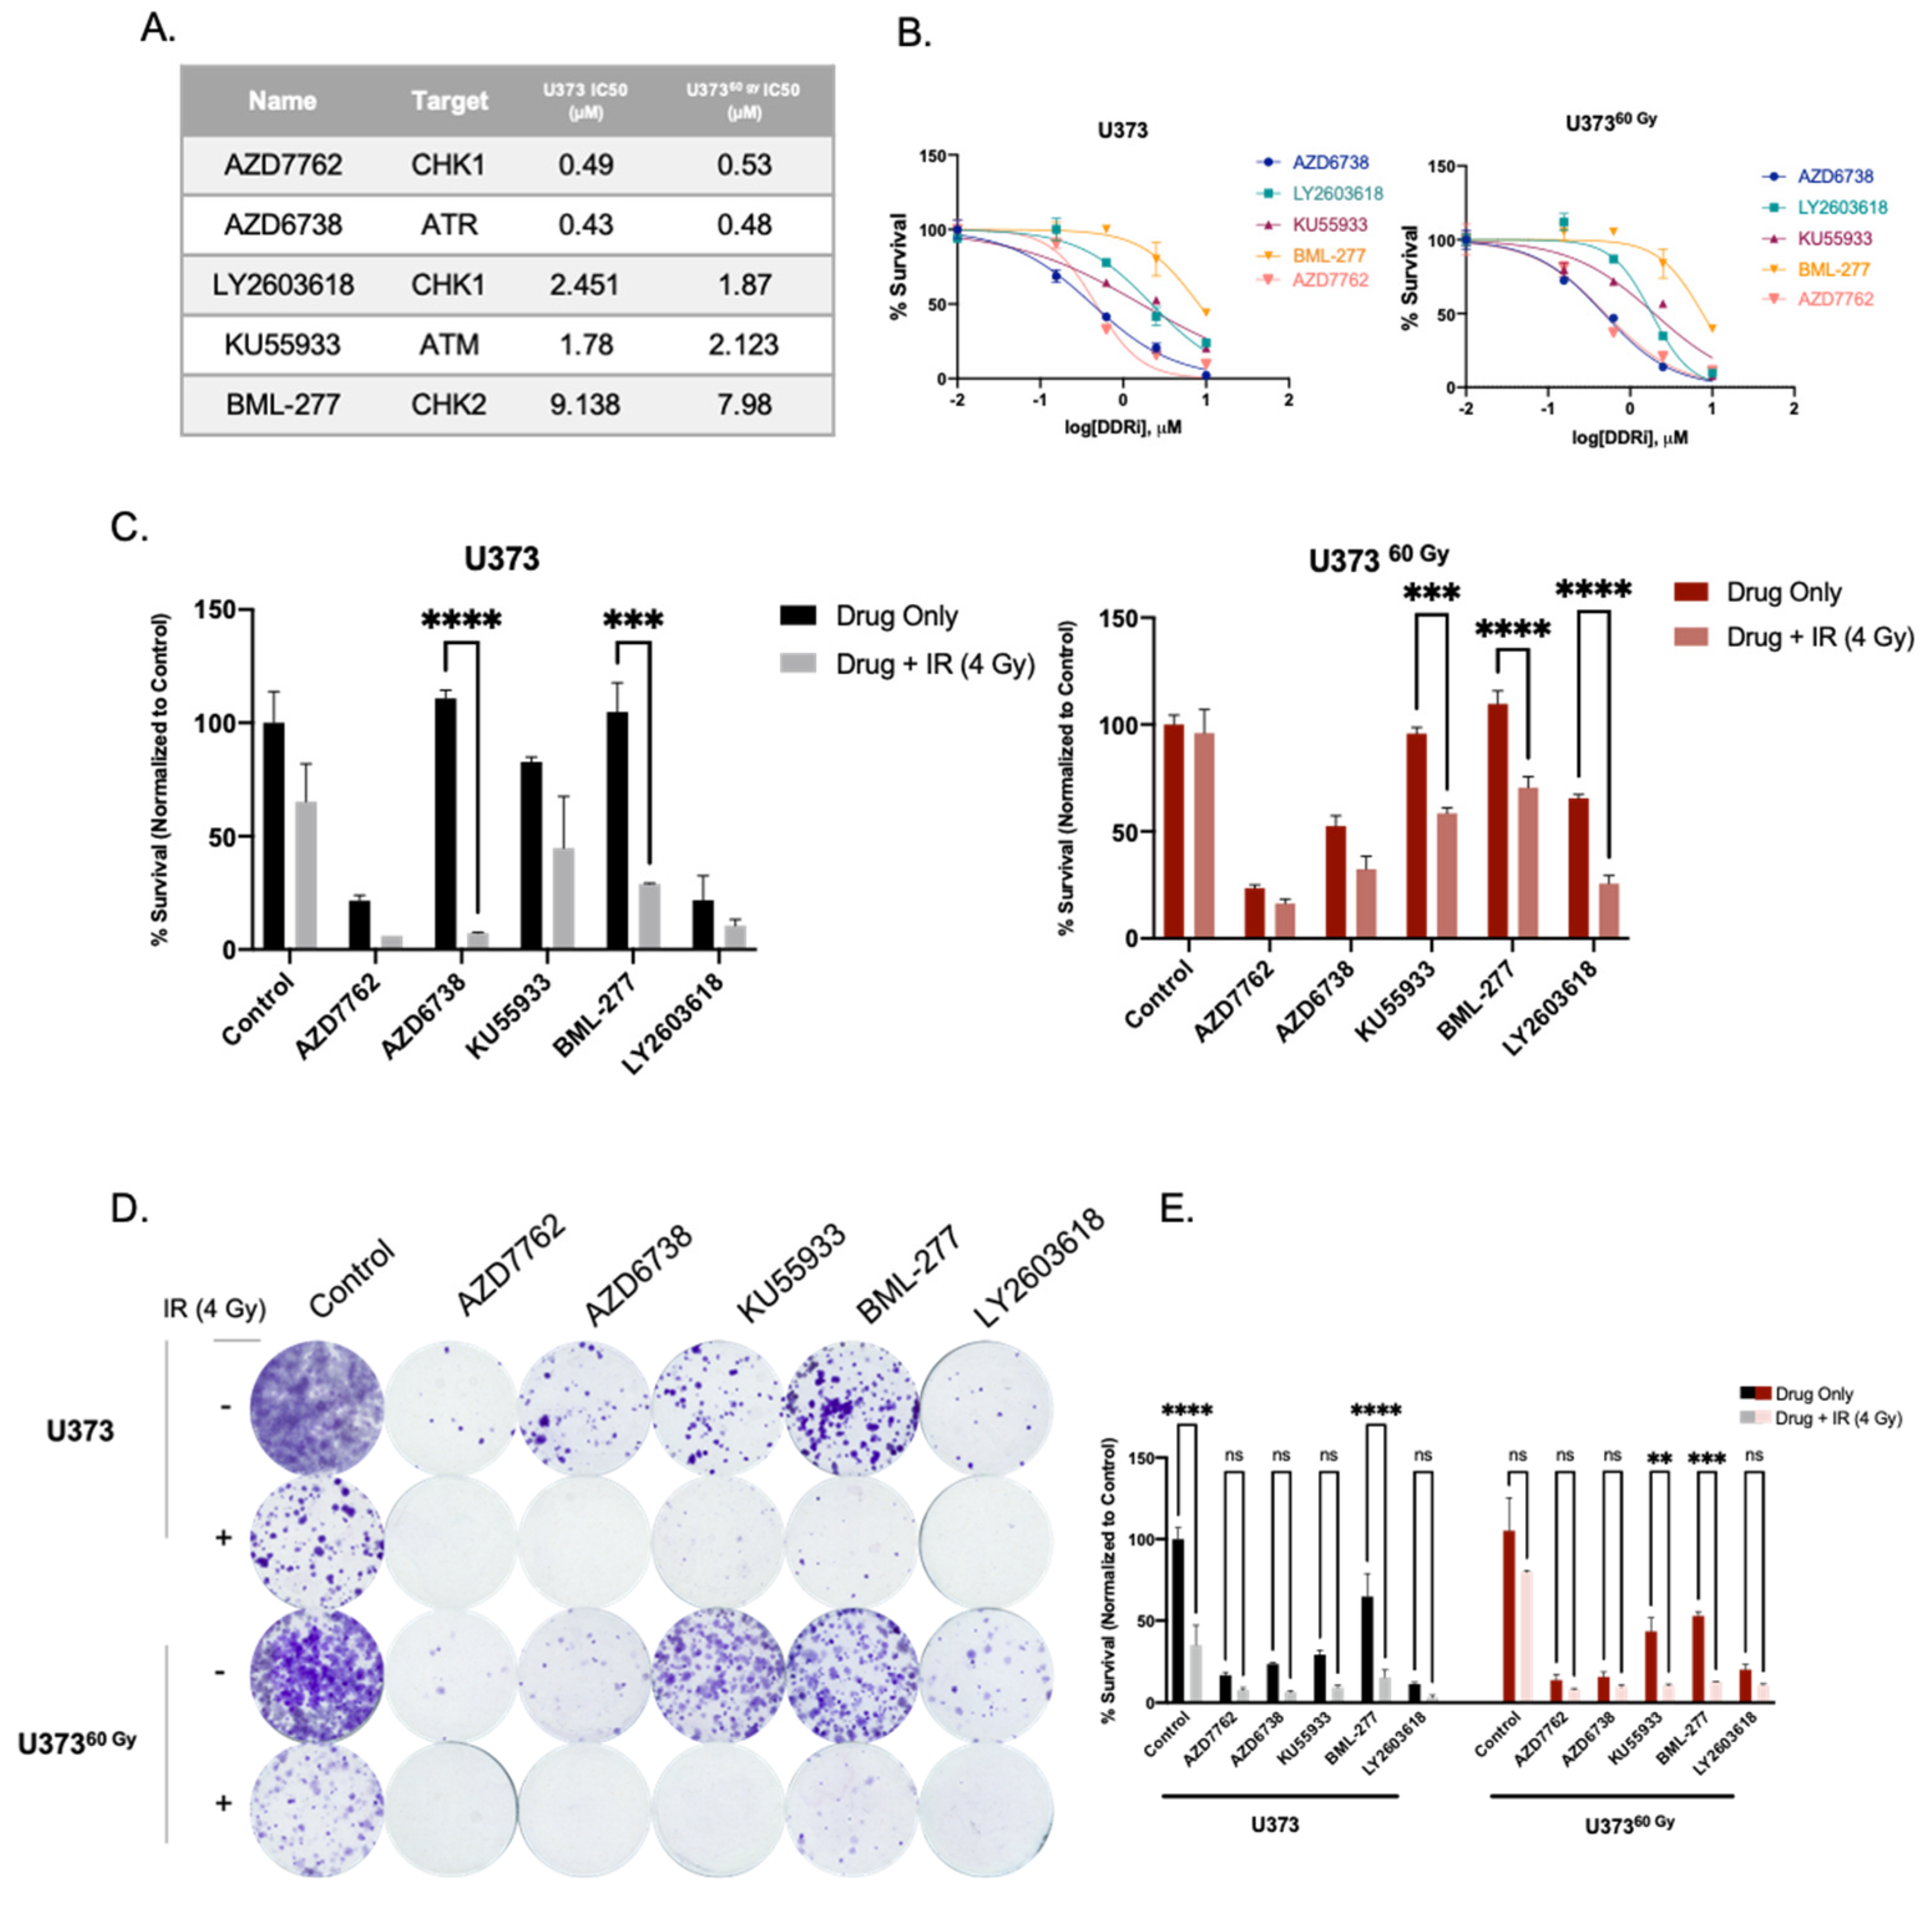
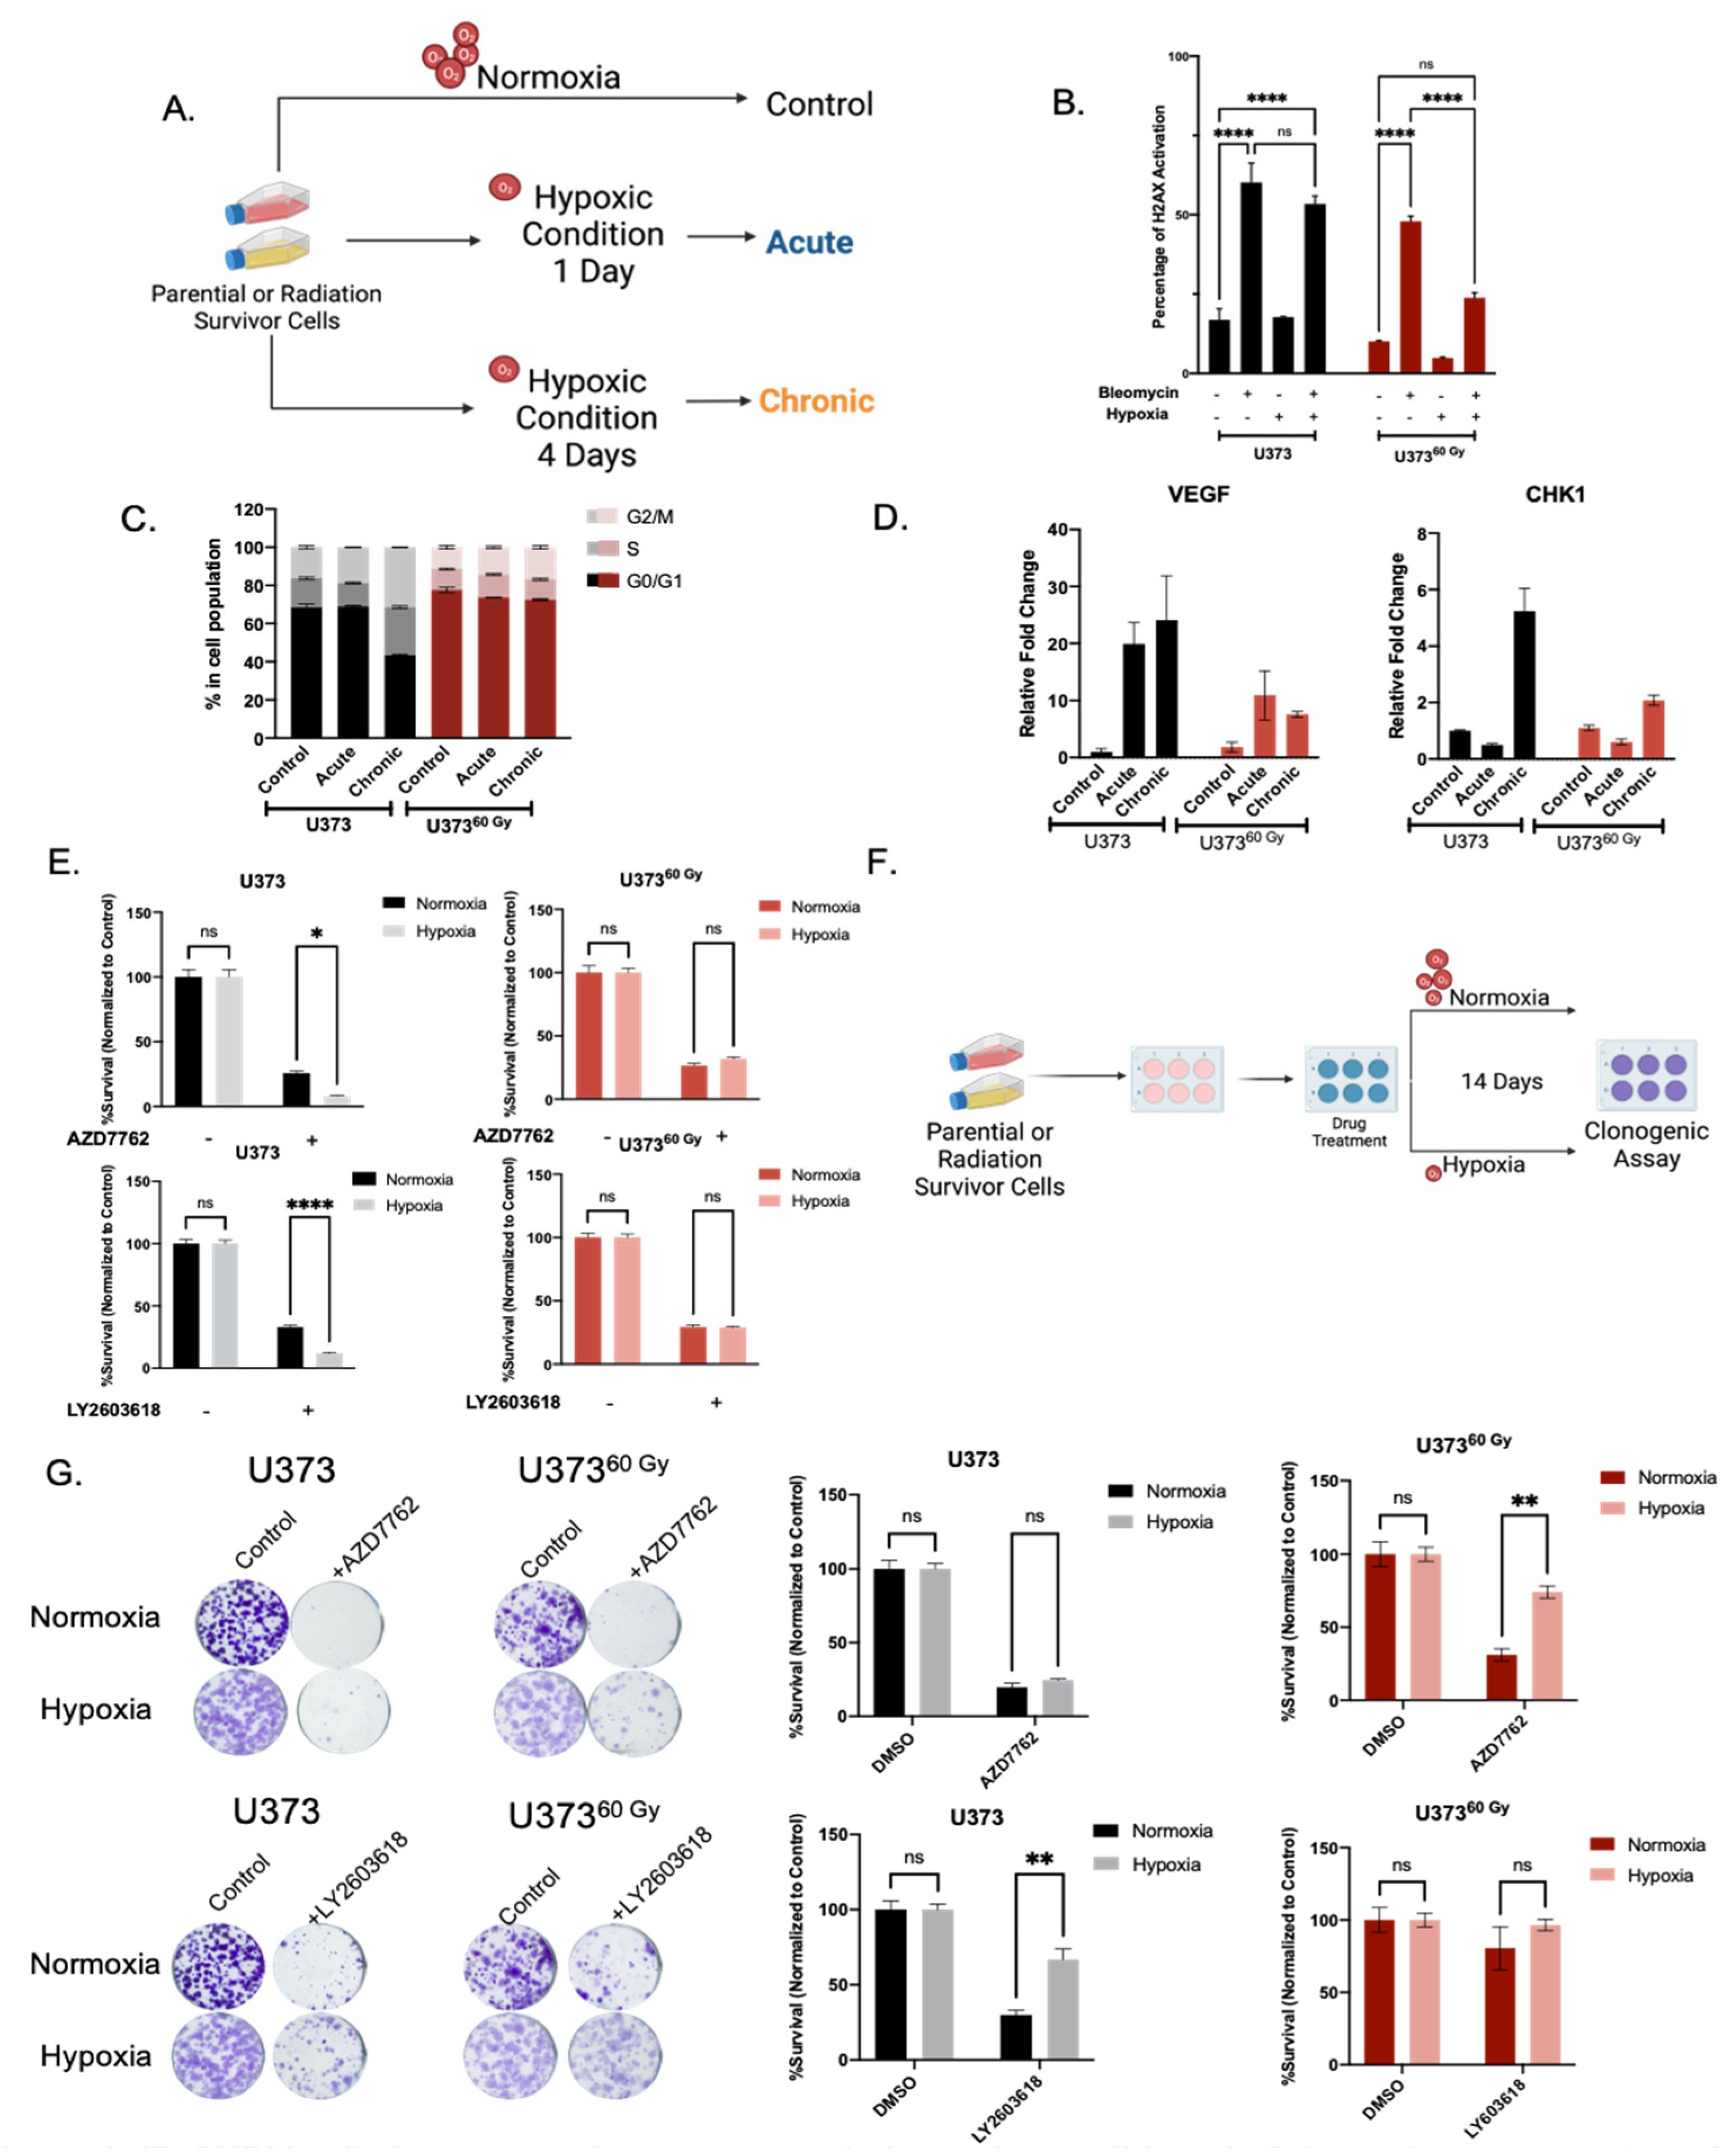
2.4. IR-Surv Cells Have Lower Hypoxic State and Exhibit Poor Response to DDR Inhibition under Further Hypoxia
3. Discussion
4. Materials and Methods
4.1. Cell Culture and Reagents
4.2. Generation of Radiation Exposed Cell Lines
4.3. Cell Size and Nuclei Size Analysis
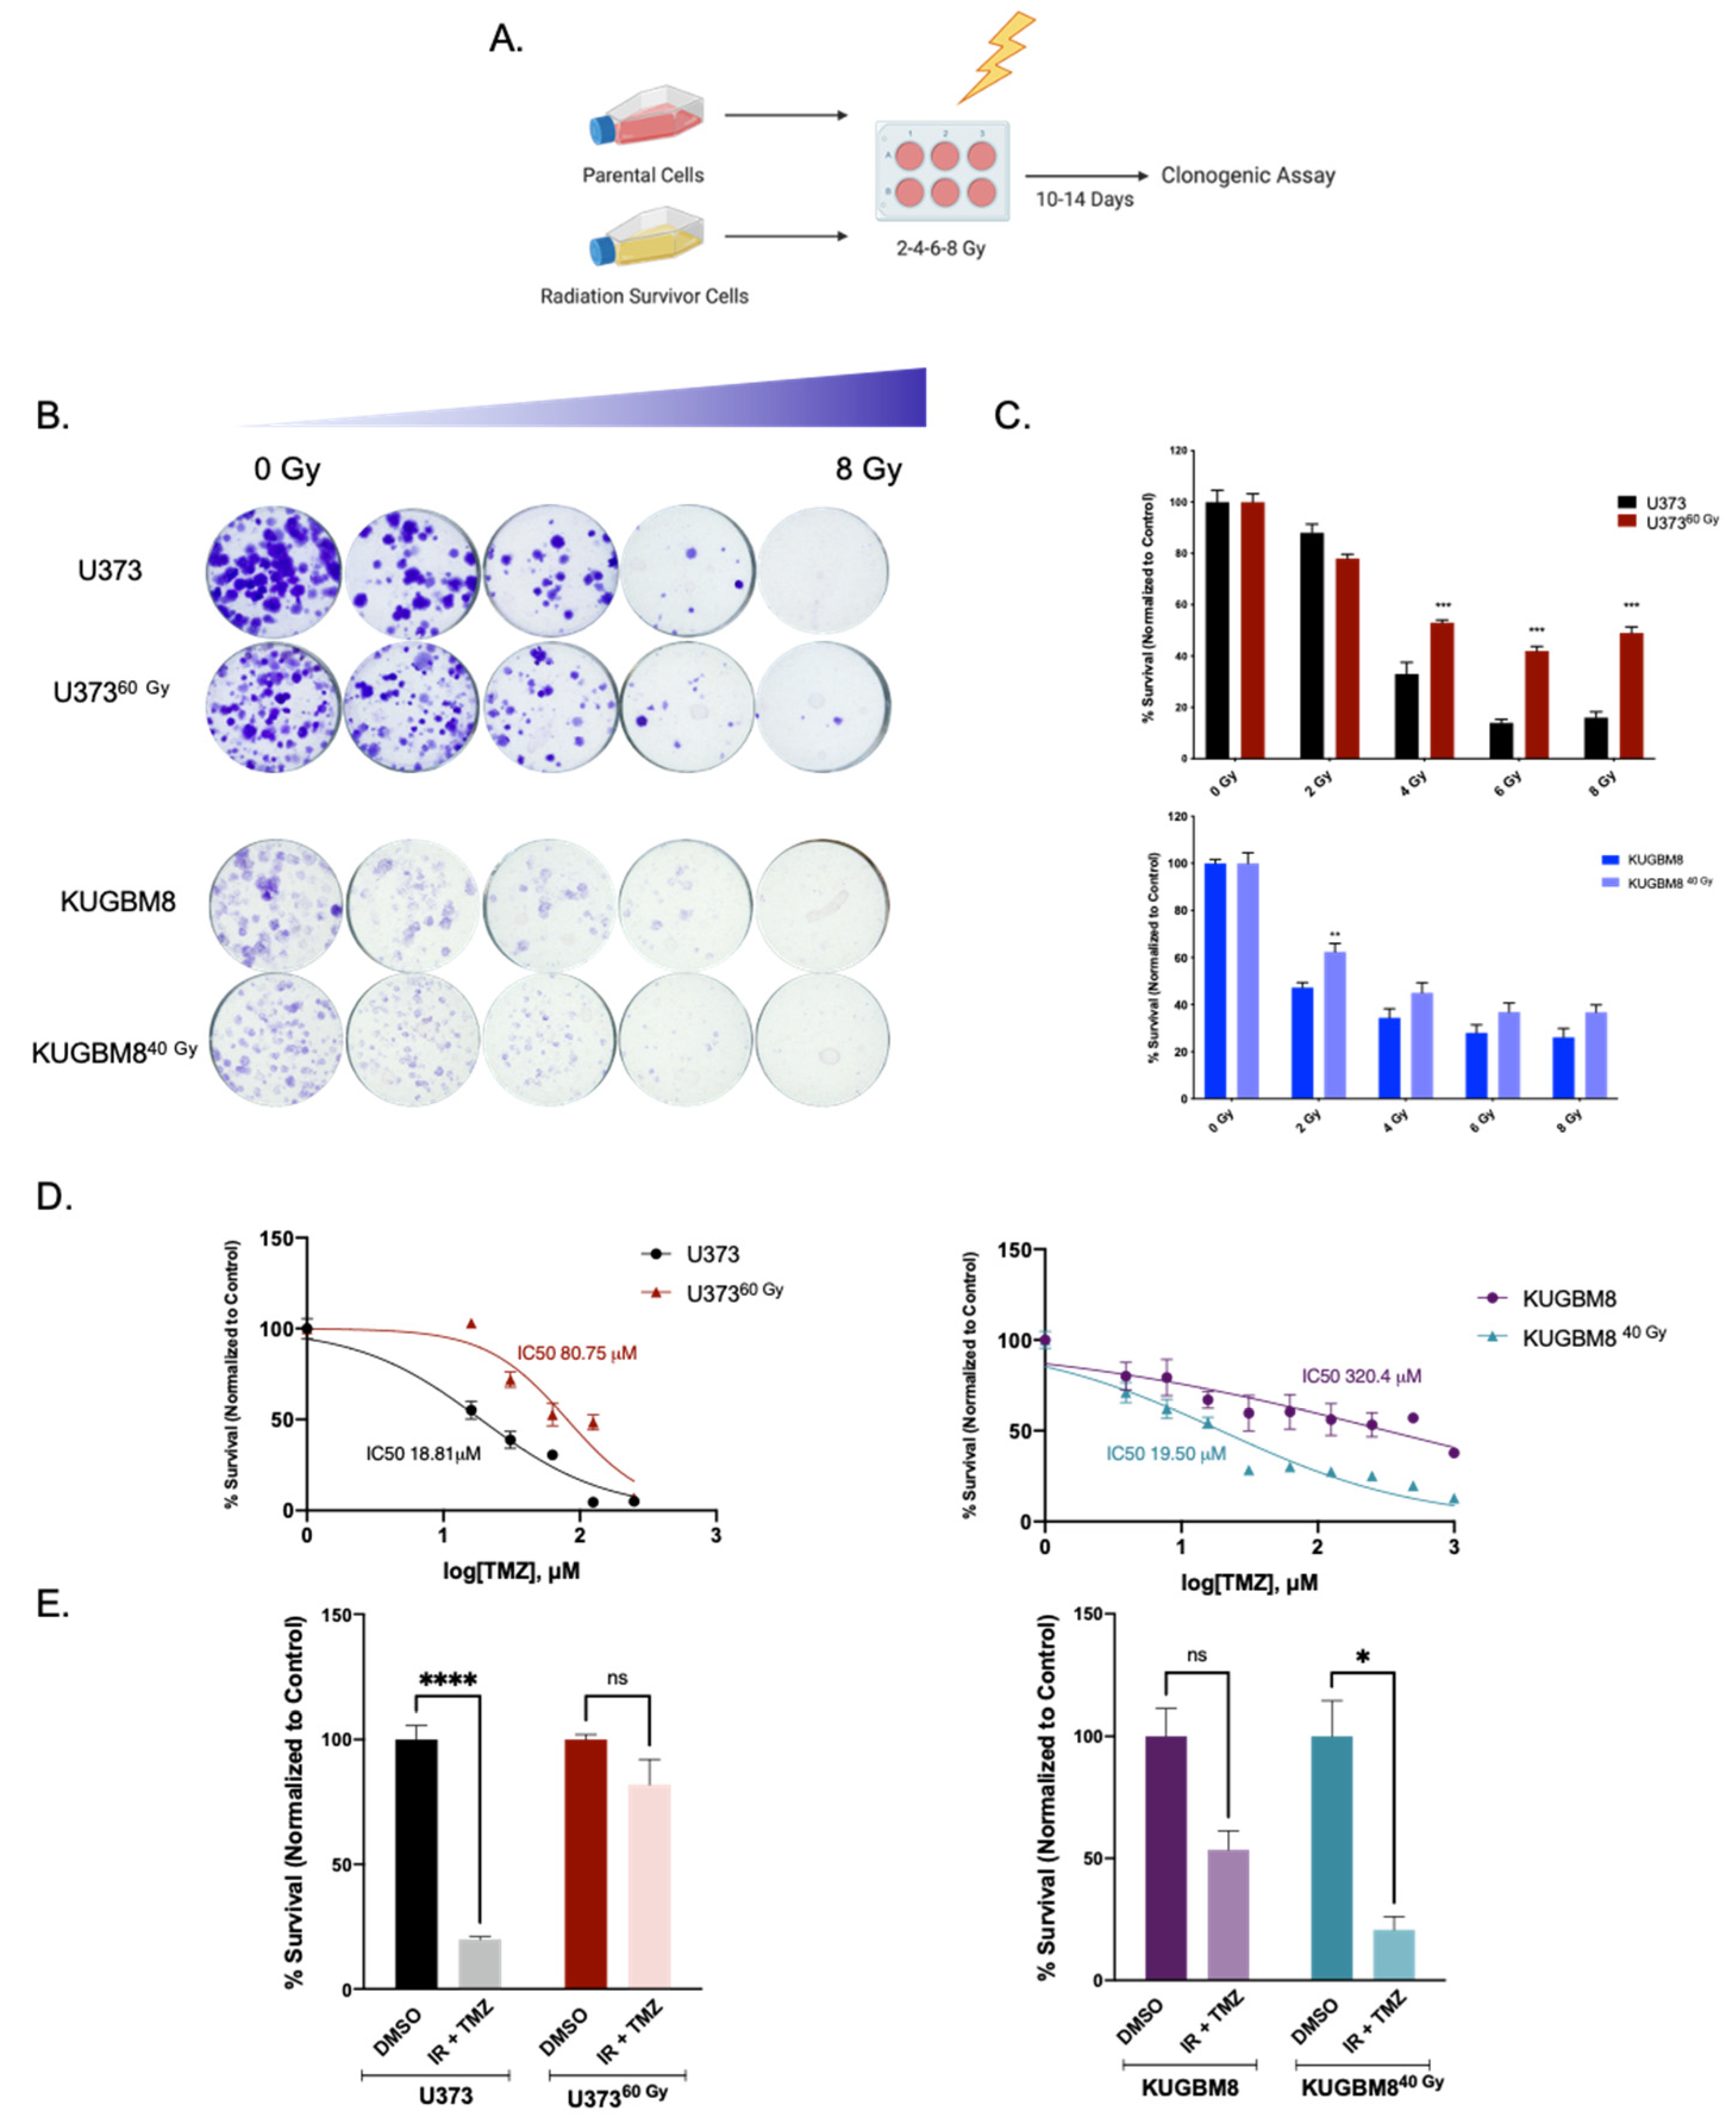
4.4. Clonogenic Assay
4.5. Cell Viability Assay
4.6. Cell Cycle Assay
4.7. H2AX Activation Assay
4.8. Quantitative Real-Time PCR (qRT-PCR)
4.9. Western Blotting
4.10. Immunofluorescence Staining
4.11. RNA-Sequencing and Analysis
4.12. Statistical Analysis
Supplementary Materials
Author Contributions
Funding
Institutional Review Board Statement
Informed Consent Statement
Data Availability Statement
Acknowledgments
Conflicts of Interest
References
- Wirsching, H.G.; Galanis, E.; Weller, M. Glioblastoma. Handb. Clin. Neurol. 2016, 134, 381–397. [Google Scholar] [PubMed]
- Stupp, R.; Mason, W.P.; van den Bent, M.J.; Weller, M.; Fisher, B.; Taphoorn, M.J.B.; Belanger, K.; Brandes, A.A.; Marosi, C.; Bogdahn, U.; et al. Radiotherapy plus concomitant and adjuvant temozolomide for glioblastoma. N. Engl. J. Med. 2005, 352, 987–996. [Google Scholar] [CrossRef] [PubMed]
- Brandes, A.A.; Tosoni, A.; Franceschi, E.; Reni, M.; Gatta, G.; Vecht, C. Glioblastoma in adults. Crit. Rev. Oncol. Hematol. 2008, 67, 139–152. [Google Scholar] [CrossRef] [PubMed]
- McGranahan, N.; Swanton, C. Clonal Heterogeneity and Tumor Evolution: Past, Present, and the Future. Cell 2017, 168, 613–628. [Google Scholar] [CrossRef] [Green Version]
- Osuka, S.; Van Meir, E.G. Overcoming therapeutic resistance in glioblastoma: The way forward. J. Clin. Investig. 2017, 127, 415–426. [Google Scholar] [CrossRef] [Green Version]
- Mannino, M.; Chalmers, A.J. Radioresistance of glioma stem cells: Intrinsic characteristic or property of the “microenvironment-stem cell unit”? Mol. Oncol. 2011, 5, 374–386. [Google Scholar] [CrossRef] [Green Version]
- Shimura, T.; Noma, N.; Oikawa, T.; Ochiai, Y.; Kakuda, S.; Kuwahara, Y.; Takai, Y.; Takahashi, A.; Fukumoto, M. Activation of the AKT/cyclin D1/Cdk4 survival signaling pathway in radioresistant cancer stem cells. Oncogenesis 2012, 1, e12–e19. [Google Scholar] [CrossRef] [Green Version]
- Bao, S.; Wu, Q.; McLendon, R.E.; Hao, Y.; Shi, Q.; Hjelmeland, A.B.; Dewhirst, M.W.; Bigner, D.D.; Rich, J.N. Glioma stem cells promote radioresistance by preferential activation of the DNA damage response. Nature 2006, 444, 756–760. [Google Scholar] [CrossRef]
- Serafim, R.B.; da Silva, P.; Cardoso, C.; Di Cristofaro, L.F.M.; Netto, R.P.; de Almeida, R.; Navegante, G.; Storti, C.B.; de Sousa, J.F.; de Souza, F.C.; et al. Expression Profiling of Glioblastoma Cell Lines Reveals Novel Extracellular Matrix-Receptor Genes Correlated with the Responsiveness of Glioma Patients to Ionizing Radiation. Front. Oncol. 2021, 11, 668090. [Google Scholar] [CrossRef]
- Cuddapah, V.A.; Robel, S.; Watkins, S.; Sontheimer, H. A neurocentric perspective on glioma invasion. Nat. Rev. Neurosci. 2014, 15, 455–465. [Google Scholar] [CrossRef] [Green Version]
- Basheer, A.S.; Abas, F.; Othman, I.; Naidu, R. Role of Inflammatory Mediators, Macrophages, and Neutrophils in Glioma Maintenance and Progression: Mechanistic Understanding and Potential Therapeutic Applications. Cancers 2021, 13, 4226. [Google Scholar] [CrossRef] [PubMed]
- Roy, K.; Wang, L.; Makrigiorgos, G.M.; Price, B.D. Methylation of the ATM promoter in glioma cells alters ionizing radiation sensitivity. Biochem. Biophys. Res. Commun. 2006, 344, 821–826. [Google Scholar] [CrossRef] [PubMed]
- Wang, C.; Zheng, W.; Yao, D.; Chen, Q.; Zhu, L.; Zhang, J.; Pan, Y.; Zhang, J.; Shao, C. Upregulation of DNA Metabolism-Related Genes Contributes to Radioresistance of Glioblastoma. Hum. Gene Ther. Clin. Dev. 2019, 30, 74–87. [Google Scholar] [CrossRef] [PubMed]
- Fukui, R.; Saga, R.; Matsuya, Y.; Tomita, K.; Kuwahara, Y.; Ohuchi, K.; Sato, T.; Okumura, K.; Date, H.; Fukumoto, M.; et al. Tumor radioresistance caused by radiation-induced changes of stem-like cell content and sub-lethal damage repair capability. Sci. Rep. 2022, 12, 1056. [Google Scholar] [CrossRef]
- Ali, M.Y.; Oliva, C.R.; Noman, A.S.M.; Allen, B.G.; Goswami, P.C.; Zakharia, Y.; Monga, V.; Spitz, D.R.; Buatti, J.M.; Griguer, C.E. Radioresistance in glioblastoma and the development of radiosensitizers. Cancers 2020, 12, 2511. [Google Scholar] [CrossRef] [PubMed]
- Gupta, K.; Burns, T.C. Radiation-induced alterations in the recurrent glioblastoma microenvironment: Therapeutic implications. Front. Oncol. 2018, 8, 503. [Google Scholar] [CrossRef] [Green Version]
- Mukherjee, B.; McEllin, B.; Camacho, C.V.; Tomimatsu, N.; Sirasanagandala, S.; Nannepaga, S.; Hatanpaa, K.J.; Mickey, B.; Madden, C.; Maher, E.; et al. EGFRvIII and DNA double-strand break repair: A molecular mechanism for radioresistance in glioblastoma. Cancer Res. 2009, 69, 4252–4259. [Google Scholar] [CrossRef] [Green Version]
- Carruthers, R.D.; Ahmed, S.U.; Ramachandran, S.; Strathdee, K.; Kurian, K.M.; Hedley, A.; Gomez-Roman, N.; Kalna, G.; Neilson, M.; Gilmour, L.; et al. Replication stress drives constitutive activation of the DNA damage response and radioresistance in glioblastoma stem-like cells. Cancer Res. 2018, 78, 5060–5071. [Google Scholar] [CrossRef] [Green Version]
- Kim, Y.H.; Yoo, K.C.; Cui, Y.H.; Uddin, N.; Lim, E.J.; Kim, M.J.; Nam, S.Y.; Kim, I.G.; Suh, Y.; Lee, S.J. Radiation promotes malignant progression of glioma cells through HIF-1alpha stabilization. Cancer Lett. 2014, 354, 132–141. [Google Scholar] [CrossRef]
- Huang, R.X.; Zhou, P.K. DNA damage response signaling pathways and targets for radiotherapy sensitization in cancer. Signal Transduct. Target. Ther. 2020, 5, 60. [Google Scholar] [CrossRef]
- Chen, H.H.W.; Kuo, M.T. Improving radiotherapy in cancer treatment: Promises and challenges. Oncotarget 2017, 8, 62742–62758. [Google Scholar] [CrossRef] [PubMed] [Green Version]
- Morás, A.M.; Henn, J.G.; Steffens Reinhardt, L.; Lenz, G.; Moura, D.J. Recent developments in drug delivery strategies for targeting DNA damage response in glioblastoma. Life Sci. 2021, 287, 120128. [Google Scholar] [CrossRef] [PubMed]
- Pilié, P.G.; Tang, C.; Mills, G.B.; Yap, T.A. State-of-the-art strategies for targeting the DNA damage response in cancer. Nat. Rev. Clin. Oncol. 2019, 16, 81–104. [Google Scholar] [CrossRef] [PubMed]
- Topkan, E.; Selek, U.; Ozdemir, Y.; Yildirim, B.A.; Guler, O.C.; Ciner, F.; Mertsoylu, H.; Tufan, K. Prognostic value of the Glasgow Prognostic Score for glioblastoma multiforme patients treated with radiotherapy and temozolomide. J. Neurooncol. 2018, 139, 411–419. [Google Scholar] [CrossRef] [PubMed]
- Menon, H.; Ramapriyan, R.; Cushman, T.R.; Verma, V.; Kim, H.H.; Schoenhals, J.E.; Atalar, C.; Selek, U.; Chun, S.G.; Chang, J.Y.; et al. Role of radiation therapy in modulation of the tumor stroma and microenvironment. Front. Immunol. 2019, 10, 193. [Google Scholar] [CrossRef] [PubMed] [Green Version]
- Topkan, E.; Kucuk, A.; Ozdemir, Y.; Mertsoylu, H.; Besen, A.A.; Sezen, D.; Bolukbasi, Y.; Pehlivan, B.; Selek, U. Systemic Inflammation Response Index Predicts Survival Outcomes in Glioblastoma Multiforme Patients Treated with Standard Stupp Protocol. J. Immunol. Res. 2020, 2020, 8628540. [Google Scholar] [CrossRef]
- Topkan, E.; Besen, A.A.; Mertsoylu, H.; Kucuk, A.; Pehlivan, B.; Selek, U. Prognostic Value of C-Reactive Protein to Albumin Ratio in Glioblastoma Multiforme Patients Treated with Concurrent Radiotherapy and Temozolomide. Int. J. Inflamm. 2020, 2020, 6947382. [Google Scholar] [CrossRef]
- Topkan, E.; Besen, A.A.; Ozdemir, Y.; Kucuk, A.; Mertsoylu, H.; Pehlivan, B.; Selek, U. Prognostic Value of Pretreatment Systemic Immune-Inflammation Index in Glioblastoma Multiforme Patients Undergoing Postneurosurgical Radiotherapy plus Concurrent and Adjuvant Temozolomide. Mediat. Inflamm. 2020, 2020, 4392189. [Google Scholar] [CrossRef]
- Kuwahara, Y.; Roudkenar, M.H.; Urushihara, Y.; Saito, Y.; Tomita, K.; Roushandeh, A.M.; Sato, T.; Kurimasa, A.; Fukumoto, M. Clinically relevant radioresistant cell line: A simple model to understand cancer radioresistance. Med. Mol. Morphol. 2017, 50, 195–204. [Google Scholar] [CrossRef]
- Franken, N.A.P.; Rodermond, H.M.; Stap, J.; Haveman, J.; van Bree, C. Clonogenic assay of cells in vitro. Nat. Protoc. 2006, 1, 2315–2319. [Google Scholar] [CrossRef]
- Maier, P.; Hartmann, L.; Wenz, F.; Herskind, C. Cellular pathways in response to ionizing radiation and their targetability for tumor radiosensitization. Int. J. Mol. Sci. 2016, 17, 102. [Google Scholar] [CrossRef] [PubMed] [Green Version]
- Hein, A.L.; Ouellete, M.M.; Yan, Y. Radiation-induced signaling pathways that promote cancer cell survival (Review). Int. J. Oncol. 2014, 45, 1813–1819. [Google Scholar] [CrossRef] [PubMed] [Green Version]
- Kuleshov, M.V.; Jones, M.R.; Rouillard, A.D.; Fernandez, N.F.; Duan, Q.; Wang, Z.; Koplev, S.; Jenkins, S.L.; Jagodnik, K.M.; Lachmann, A.; et al. Enrichr: A comprehensive gene set enrichment analysis web server 2016 update. Nucleic Acids Res. 2016, 44, W90–W97. [Google Scholar] [CrossRef] [PubMed] [Green Version]
- Chen, E.Y.; Tan, C.M.; Kou, Y.; Duan, Q.; Wang, Z.; Meirelles, G.V.; Clark, N.R.; Ma’ayan, A. Enrichr: Interactive and collaborative HTML5 gene list enrichment analysis tool. BMC Bioinform. 2013, 14, 128. [Google Scholar] [CrossRef] [Green Version]
- Xie, Z.; Bailey, A.; Kuleshov, M.V.; Clarke, D.J.B.; Evangelista, J.E.; Jenkins, S.L.; Lachmann, A.; Wojciechowicz, M.L.; Kropiwnicki, E.; Jagodnik, K.M.; et al. Gene Set Knowledge Discovery with Enrichr. Curr. Protoc. 2021, 1, e90. [Google Scholar] [CrossRef]
- Raleigh, D.R.; Haas-Kogan, D.A. Molecular targets and mechanisms of radiosensitization using DNA damage response pathways. Futur. Oncol. 2013, 9, 219–233. [Google Scholar] [CrossRef] [Green Version]
- Elmore, K.B.; Schaff, L.R. DNA Repair Mechanisms and Therapeutic Targets in Glioma. Curr. Oncol. Rep. 2021, 23, 87. [Google Scholar] [CrossRef]
- Dillon, M.T.; Good, J.S.; Harrington, K.J. Selective Targeting of the G2/M Cell Cycle Checkpoint to Improve the Therapeutic Index of Radiotherapy. Clin. Oncol. 2014, 26, 257–265. [Google Scholar] [CrossRef]
- Carrassa, L.; Damia, G. DNA damage response inhibitors: Mechanisms and potential applications in cancer therapy. Cancer Treat. Rev. 2017, 60, 139–151. [Google Scholar] [CrossRef]
- Bolzán, A.D.; Bianchi, M.S. DNA and chromosome damage induced by bleomycin in mammalian cells: An update. Mutat. Res.-Rev. Mutat. Res. 2018, 775, 51–62. [Google Scholar] [CrossRef]
- Tirpe, A.A.; Gulei, D.; Ciortea, S.M.; Crivii, C.; Berindan-Neagoe, I. Hypoxia: Overview on hypoxia-mediated mechanisms with a focus on the role of hif genes. Int. J. Mol. Sci. 2019, 20, 6140. [Google Scholar] [CrossRef] [PubMed] [Green Version]
- Mooney, J.; Bernstock, J.D.; Ilyas, A.; Ibrahim, A.; Yamashita, D.; Markert, J.M.; Nakano, I. Current Approaches and Challenges in the Molecular Therapeutic Targeting of Glioblastoma. World Neurosurg. 2019, 129, 90–100. [Google Scholar] [CrossRef] [PubMed]
- Friedman, H.S.; Kerby, T.; Calvert, H. Temozolomide and treatment of malignant glioma. Clin. Cancer Res. 2000, 6, 2585–2597. [Google Scholar] [PubMed]
- Taal, W.; Bromberg, J.E.C.; van den Bent, M.J. Chemotherapy in glioma. CNS Oncol. 2015, 4, 179–192. [Google Scholar] [CrossRef] [PubMed]
- Chang, E.L.; Akyurek, S.; Avalos, T.; Rebueno, N.; Spicer, C.; Garcia, J.; Famiglietti, R.; Allen, P.K.; Chao, K.S.C.; Mahajan, A.; et al. Evaluation of Peritumoral Edema in the Delineation of Radiotherapy Clinical Target Volumes for Glioblastoma. Int. J. Radiat. Oncol. Biol. Phys. 2007, 68, 144–150. [Google Scholar] [CrossRef]
- Gray, M.; Turnbull, A.K.; Ward, C.; Meehan, J.; Martínez-Pérez, C.; Bonello, M.; Pang, L.Y.; Langdon, S.P.; Kunkler, I.H.; Murray, A.; et al. Development and characterisation of acquired radioresistant breast cancer cell lines. Radiat. Oncol. 2019, 14, 64. [Google Scholar] [CrossRef] [Green Version]
- Petragnano, F.; Pietrantoni, I.; Camero, S.; Codenotti, S.; Milazzo, L.; Vulcano, F.; MacIoce, G.; Giordani, I.; Tini, P.; Cheleschi, S.; et al. Clinically relevant radioresistant rhabdomyosarcoma cell lines: Functional, molecular and immune-related characterization. J. Biomed. Sci. 2020, 27, 90. [Google Scholar] [CrossRef]
- Senbabaoglu, F.; Aksu, A.C.; Cingoz, A.; Seker-Polat, F.; Borklu-Yucel, E.; Solaroglu, İ.; Bagci-Onder, T. Drug Repositioning Screen on a New Primary Cell Line Identifies Potent Therapeutics for Glioblastoma. Front. Neurosci. 2020, 14, 578316. [Google Scholar] [CrossRef]
- Ma, J.; Benitez, J.A.; Li, J.; Miki, S.; Ponte de Albuquerque, C.; Galatro, T.; Orellana, L.; Zanca, C.; Reed, R.; Boyer, A.; et al. Inhibition of Nuclear PTEN Tyrosine Phosphorylation Enhances Glioma Radiation Sensitivity through Attenuated DNA Repair. Cancer Cell 2019, 35, 504–518.e7. [Google Scholar] [CrossRef] [Green Version]
- Lee, J.J.; Kim, B.C.; Park, M.J.; Lee, Y.S.; Kim, Y.N.; Lee, B.L.; Lee, J.S. PTEN status switches cell fate between premature senescence and apoptosis in glioma exposed to ionizing radiation. Cell Death Differ. 2011, 18, 666–677. [Google Scholar] [CrossRef] [Green Version]
- Kim, B.M.; Hong, Y.; Lee, S.; Liu, P.; Lim, J.H.; Lee, Y.H.; Lee, T.H.; Chang, K.T.; Hong, Y. Therapeutic implications for overcoming radiation resistance in cancer therapy. Int. J. Mol. Sci. 2015, 16, 26880–26913. [Google Scholar] [CrossRef] [PubMed] [Green Version]
- Lee, S.Y. Temozolomide resistance in glioblastoma multiforme. Genes Dis. 2016, 3, 198–210. [Google Scholar] [CrossRef] [PubMed] [Green Version]
- Marín, A.; Martín, M.; Liñán, O.; Alvarenga, F.; López, M.; Fernández, L.; Büchser, D.; Cerezo, L. Bystander effects and radiotherapy. Rep. Pract. Oncol. Radiother. 2015, 20, 12–21. [Google Scholar] [CrossRef] [PubMed] [Green Version]
- Nickoloff, J.A.; Jones, D.; Lee, S.H.; Williamson, E.A.; Hromas, R. Drugging the Cancers Addicted to DNA Repair. J. Natl. Cancer Inst. 2017, 109, djx059. [Google Scholar] [CrossRef] [PubMed]
- Motegi, A.; Masutani, M.; Yoshioka, K.; Bessho, T. Aberrations in DNA Repair Pathways in Cancer and Therapeutic Significances. Semin. Cancer Biol. 2019, 58, 29–46. [Google Scholar] [CrossRef]
- Squatrito, M.; Brennan, C.W.; Helmy, K.; Huse, J.T.; Petrini, J.H.; Holland, E.C. Loss of ATM/Chk2/p53 Pathway Components Accelerates Tumor Development and Contributes to Radiation Resistance in Gliomas. Cancer Cell 2010, 18, 619–629. [Google Scholar] [CrossRef] [Green Version]
- Dillon, M.T.; Barker, H.E.; Pedersen, M.; Hafsi, H.; Bhide, S.A.; Newbold, K.L.; Nutting, C.M.; McLaughlin, M.; Harrington, K.J. Radiosensitization by the ATR Inhibitor AZD6738 through Generation of Acentric Micronuclei. Mol. Cancer Ther. 2016, 16, 25–34. [Google Scholar] [CrossRef] [Green Version]
- Vlatkovic, T.; Veldwijk, M.R.; Giordano, F.A.; Herskind, C. Targeting Cell Cycle Checkpoint Kinases to Overcome Intrinsic Radioresistance in Brain Tumor Cells. Cancers 2022, 14, 701. [Google Scholar] [CrossRef]
- Goldstein, M.; Kastan, M.B. The DNA Damage Response: Implications for Tumor Responses to Radiation and Chemotherapy. Annu. Rev. Med. 2015, 66, 129–143. [Google Scholar] [CrossRef] [Green Version]
- van Bijsterveldt, L.; Durley, S.C.; Maughan, T.S.; Humphrey, T.C. The Challenge of Combining Chemo- and Radiotherapy with Checkpoint Kinase Inhibitors. Clin. Cancer Res. 2021, 27, 937–962. [Google Scholar] [CrossRef]
- Qiu, Z.; Oleinick, N.L.; Zhang, J. ATR/CHK1 inhibitors and cancer therapy. Radiother. Oncol. 2018, 126, 450–464. [Google Scholar] [CrossRef] [PubMed]
- Barker, H.E.; Patel, R.; McLaughlin, M.; Schick, U.; Zaidi, S.; Nutting, C.M.; Newbold, K.L.; Bhide, S.; Harrington, K.J. CHK1 inhibition radiosensitizes head and neck cancers to paclitaxel-based chemoradiotherapy. Mol. Cancer Ther. 2016, 15, 2042–2054. [Google Scholar] [CrossRef] [PubMed] [Green Version]
- Rey, S.; Schito, L.; Koritzinsky, M.; Wouters, B.G. Molecular targeting of hypoxia in radiotherapy. Adv. Drug Deliv. Rev. 2017, 109, 45–62. [Google Scholar] [CrossRef] [PubMed]
- Boustani, J.; Grapin, M.; Laurent, P.A.; Apetoh, L.; Mirjolet, C. The 6th R of radiobiology: Reactivation of anti-tumor immune response. Cancers 2019, 11, 860. [Google Scholar] [CrossRef] [Green Version]
- Jarosz-Biej, M.; Smolarczyk, R.; Cichoń, T.; Kułach, N. Tumor Microenvironment as A “Game Changer” in Cancer Radiotherapy. Int. J. Mol. Sci. 2019, 20, 3212. [Google Scholar] [CrossRef] [Green Version]
- Boulefour, W.; Rowinski, E.; Louati, S.; Sotton, S.; Wozny, A.S.; Moreno-Acosta, P.; Mery, B.; Rodriguez-Lafrasse, C.; Magne, N. A review of the role of hypoxia in radioresistance in cancer therapy. Med. Sci. Monit. 2021, 27, 1–7. [Google Scholar]
- Moeller, B.J.; Richardson, R.A.; Dewhirst, M.W. Hypoxia and radiotherapy: Opportunities for improved outcomes in cancer treatment. Cancer Metastasis Rev. 2007, 26, 241–248. [Google Scholar] [CrossRef]
- Hasvold, G.; Nähse-Kumpf, V.; Tkacz-Stachowska, K.; Rofstad, E.K.; Syljuåsen, R.G. The efficacy of CHK1 inhibitors is not altered by hypoxia, but is enhanced after reoxygenation. Mol. Cancer Ther. 2013, 12, 705–716. [Google Scholar] [CrossRef] [Green Version]
- Xie, Y.; Bergström, T.; Jiang, Y.; Johansson, P.; Marinescu, V.D.; Lindberg, N.; Segerman, A.; Wicher, G.; Niklasson, M.; Baskaran, S.; et al. The Human Glioblastoma Cell Culture Resource: Validated Cell Models Representing All Molecular Subtypes. EBioMedicine 2015, 2, 1351–1363. [Google Scholar] [CrossRef]


Publisher’s Note: MDPI stays neutral with regard to jurisdictional claims in published maps and institutional affiliations. |
© 2022 by the authors. Licensee MDPI, Basel, Switzerland. This article is an open access article distributed under the terms and conditions of the Creative Commons Attribution (CC BY) license (https://creativecommons.org/licenses/by/4.0/).
Share and Cite
Pinarbasi-Degirmenci, N.; Sur-Erdem, I.; Akcay, V.; Bolukbasi, Y.; Selek, U.; Solaroglu, I.; Bagci-Onder, T. Chronically Radiation-Exposed Survivor Glioblastoma Cells Display Poor Response to Chk1 Inhibition under Hypoxia. Int. J. Mol. Sci. 2022, 23, 7051. https://0-doi-org.brum.beds.ac.uk/10.3390/ijms23137051
Pinarbasi-Degirmenci N, Sur-Erdem I, Akcay V, Bolukbasi Y, Selek U, Solaroglu I, Bagci-Onder T. Chronically Radiation-Exposed Survivor Glioblastoma Cells Display Poor Response to Chk1 Inhibition under Hypoxia. International Journal of Molecular Sciences. 2022; 23(13):7051. https://0-doi-org.brum.beds.ac.uk/10.3390/ijms23137051
Chicago/Turabian StylePinarbasi-Degirmenci, Nareg, Ilknur Sur-Erdem, Vuslat Akcay, Yasemin Bolukbasi, Ugur Selek, Ihsan Solaroglu, and Tugba Bagci-Onder. 2022. "Chronically Radiation-Exposed Survivor Glioblastoma Cells Display Poor Response to Chk1 Inhibition under Hypoxia" International Journal of Molecular Sciences 23, no. 13: 7051. https://0-doi-org.brum.beds.ac.uk/10.3390/ijms23137051